UTN Seminar 2
117
Seminar 2: Creating the University Town Northampton The Next Steps
-
Upload
transformplaces -
Category
Presentations & Public Speaking
-
view
63 -
download
0
Transcript of UTN Seminar 2

Seminar 2: Creating the University Town NorthamptonThe Next Steps

About the project

Integration of the University
and Northampton


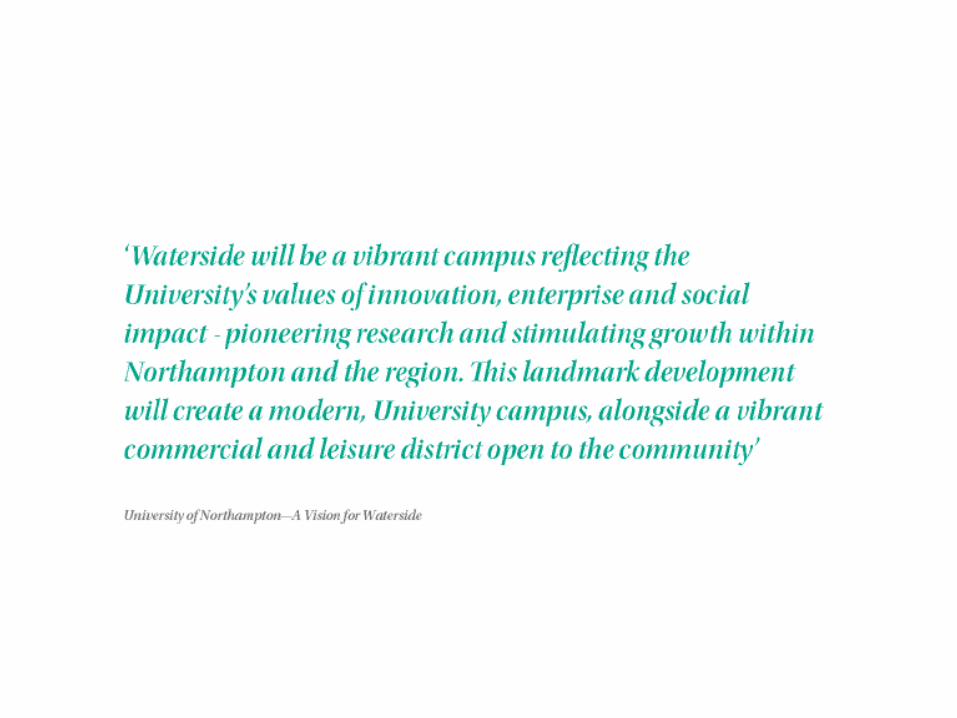
University Vision
“…unswerving commitment to the economic,
social and cultural success of the region.”
Creating change for the better:

Impacts
• Skills;
• Social;
• Research;
• Economic;
• New development….

University of Northampton Innovation Centre

University of Northampton St John’s Residences
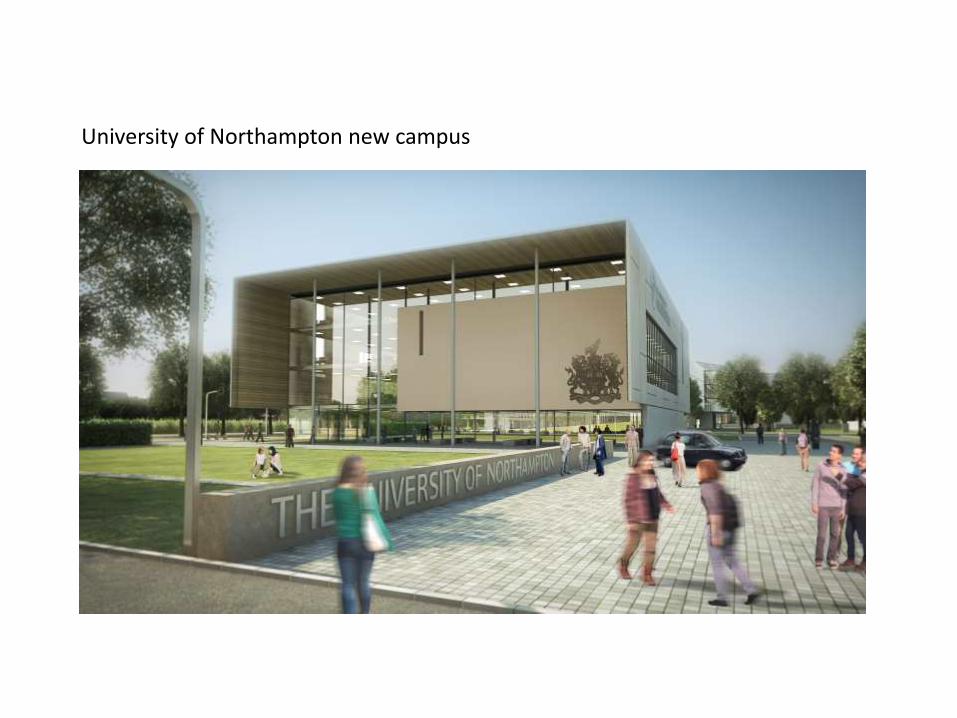
University of Northampton new campus


Waterside Impact
• Waterside Campus development, operational by 2018;
• How much ‘good stuff’ can we do when we spend £330million
building a campus?;
• How much additional funding can we lever into the County?;
• Strategic partnerships: Moulton College, NCC, NBC, NEP,
University and contractors – how many trained and employed
construction apprentices can we support through the
Waterside construction;
• How many new houses can this new work force build in the
County by 2031 (target is 80,000);
• University has a detailed social impact action plan for the
Waterside.

Waterside Impact
• One new hall of residence in Northampton brings over
£750k p.a. new spend by students to the town centre
(440 students);
• What will 15,000 students and 650 staff bring to the town
centre?;
• Effect on cultural life of town?;
• Impact of University as largest organisation in Enterprise
Zone;
• Strategic projects to bring businesses to
Northamptonshire, as well as grow our own.

Waterside Impact
• Significant opportunities for local SMEs in supply chains
of major contractors working on Waterside (social impact
a key element of PQQ and ITT);
• Significant opportunities for local SMEs as suppliers of
services to University when new campus is operating.

Quote from the Prime Minister
“The Government is playing its part through the
Enterprise Zone and through the development of
the railway station, but what’s so exciting about
this is the amount of good work that the borough
is doing alongside the Government initiative and
the private sector is coming forward and
developing it. It you take it all together –
the Enterprise Zone, the railway station and all the projects I
saw on the on the Northampton Alive map – and also the fact
that one day the University might want to move and free up
more sites for development and change where it is in the town,
all of that is ambition, it’s drive, it’s exciting and it means
Northampton can be a success story...”

Thank you
for listening

Recap of previous Urban Design analysis

‘Streets and public spaces are not only the settings for our everyday lives……..they can also be seen as drivers of urban prosperity.’
UN- Habitat , 2013
Urban Design Mapping and Assessment

Urban Design Mapping and Assessment


Key Routes
Methodology:
Key routes selected using most integrated lines of movement
Data on ease of movement and other factors likely to influence route choice such as:
- Waiting time and movement data- Active passive and dead frontage- Building quality
(Jan Gehl, 2014)

Route A: Beckett’s Park to Northampton StationRoute length: 1271m

Route A: Walking analysisRoute length: 1271mTotal time: 1380 secs (23 mins)Stop / wait time: 215 secs (3 mins 35 secs)Stop / wait %: 15.5%

Active / Passive / Dead
Route Quality: Frontage

PositiveNeutralNegative
Route Quality: Buildings


How do people use space?(WARNING: Contains maths)

Which is the easiest route between A and B?
A
B
Source: Space Syntax

Shortest path/least metric distance?
A
B
Source: Space Syntax

Simplest path/least angle change?
A
B
Source: Space Syntax

B
Observation studies show that most people prefer simple, more direct paths over complex, indirect paths – even if the complex path is shorter.
A
B
A
Most people prefer simplest paths
Source: Space Syntax

.
A way to describe space: Graph theory
Two different spatial layouts:
Two different graphs:
Source: Space Syntax

Total depth =
10
01
1
1
1
22
233 0
1
2
2
3
3
4
4
5
6
Measuring ‘depth’ in graphs
3
4
2
3
1
2
6
5
4
30Total depth =
3
1 1
22 2
3
1 1
16
Depth is a ‘system metric’ and varies from place to place in the spatial layout.
Source: Space Syntax

30
16
3
4
2
3
1
2
6
5
4
30
3
1 1
22 2
3
1 1
16
Adding colours to show ‘heat’
Using colours to represent numerical values provides an effective visualisation of simultaneous relations in spatial layouts.
Source: Space Syntax

Tate Britain – Room ‘depth’ and visitors
Observed Modelled
Source: Space Syntax

Some key discoveries about spaces
0
1
2
3
4
5
6
7
8
0 1 2 3 4 5 6 7
y = .784x + 2.147, R-squared: .589
Spatial accessibility
Pe
de
stri
an m
ove
me
nt
Spatial accessibility
-1
0
1
2
3
4
5
6
7
8
9
0 1 2 3 4 5 6 7
y = 1.235x + 1.048, R-squared: .702
Ve
hic
le m
ove
me
nt
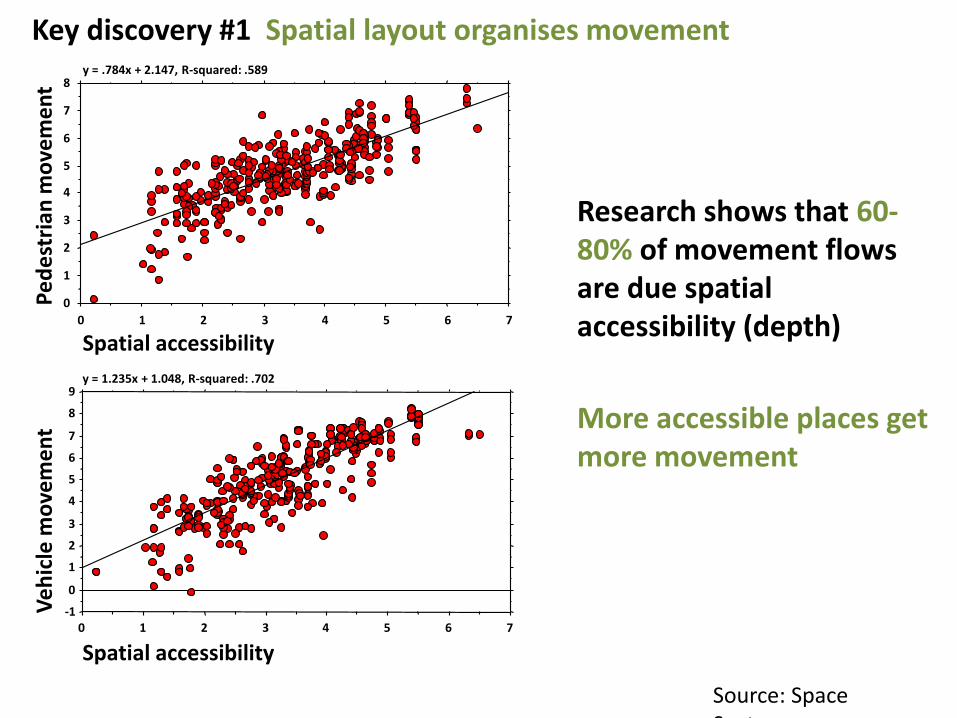
Research shows that 60-80% of movement flows are due spatial accessibility (depth)
More accessible places get more movement
Key discovery #1 Spatial layout organises movement
Source: Space Syntax

Key discovery #2 Spatial layout distributes land use
Source: Space Syntax

Courtesy of The TLRN Central London Pedestrian Study by Atkins
80% retail located on 20% most spatially accessible streets
Source: Space Syntax


Space Syntax Analysis of Northampton


What is it like to cycle in Northampton?


Emerging waterside campus masterplan


Form follows function: how your campus influences your
character


Seminar 2: Learning from the study visit to Malmo and Copenhagen

Urban Universities: Malmö and Copenhagen

Malmo University;Entrance from the street

Business School, University of Copenhagen:Green routes and street connections

Connectivity and Town Centre Regeneration

Connectivity and Town Centre Regeneration
Behind Michael Bloomberg’s long-term plan for
the city is a Danish professor and urban planner
named Jan Gehl, who for several years has been
quietly, if not slowly, guiding the remaking of New
York.
“We used to say we plan at the scale of Robert
Moses, but we judge ourselves by the standard of
Jane Jacobs,” she said. “That’s not really true
anymore. We judge ourselves now by Jan Gehl’s
standard.”
http://www.capitalnewyork.com/article/culture/2010/09/468271/planyc-guru-plays-west-village-gig-sold-out

Connectivity and Town Centre Regeneration

Connectivity and Town Centre Regeneration

Connectivity and Town Centre Regeneration

Neighbourhood Renewal: Augustenborg, Malmö


New Urban Extensions: Copenhagen Orestad & Malmö BoO1

New Urban Extension: Ørestad

New Urban Extension: Ørestad
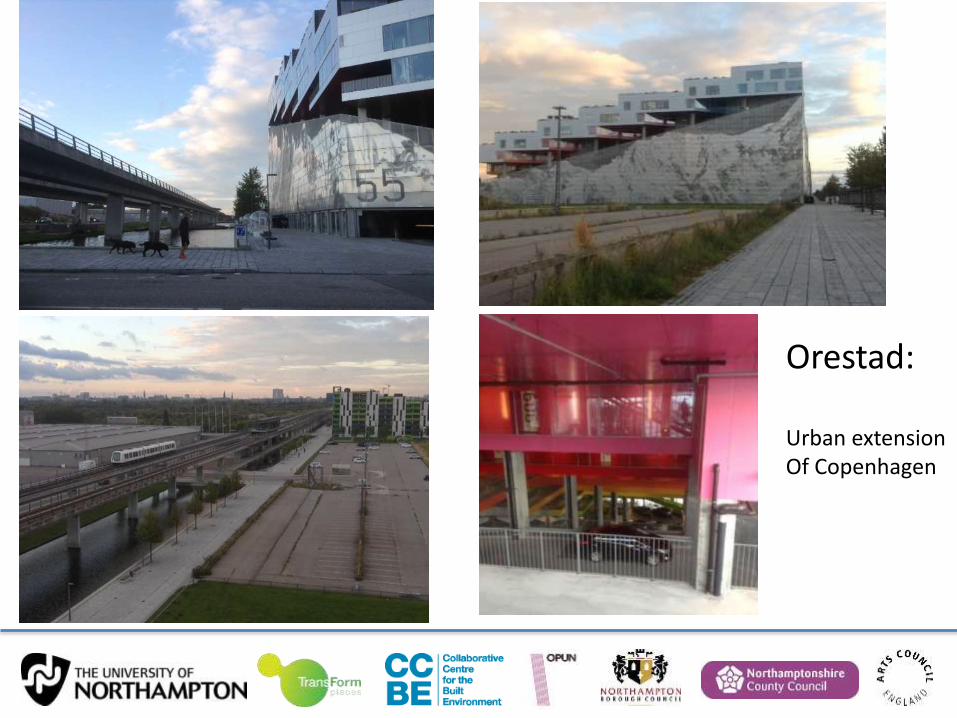
Orestad:
Urban extensionOf Copenhagen

Malmo Bo 01:
Housing Expo and sustainable neighbourhood

New Urban Extension: Malmö Bo01
Key Learning Points
As a district, Bo01 has succeeded in establishing quality building with the focus on the choice of materials and better integration of the landscape and urban spaces. As far as insuring the success of Bo01 is concerned the two most important documents have been the quality programme and the detail plan.
The unique thing about the quality programme was that it was initiated before the plots went on the market. The quality programme formulates a shared ambition which obliges the involved parties to guarantee quality of architectural expression, materials and technology. The detail plan specifies physical requirements concerning execution.
Monthly lectures for the developers, the municipality and other partners maintained a focus on the vision on a new district, the sustainability of which would be way above average. Compliance with the quality programme was important, although most of all it was the fact that planning became a shared learning process which ensured that the parties involved remained in step.

New Urban Extension: Malmö Bo01

New Urban Extension: Malmö Bo01

New Urban Extension: Malmö Bo01

New Urban Extension: Malmö Bo01

New Urban Extension: Malmö Bo01

New Urban Extension: Malmö Bo01


New Urban Extension: Malmö Bo01

New Urban Extension: Malmö Bo01

New Urban Extension: Malmö Bo01