Utilizing Independent Colleges and Universities to Fulfill ...
68
A REPORT FOR Utilizing Independent Colleges and Universities to Fulfill States’ College Degree Attainment Goals William Zumeta and Nick Huntington-Klein
Transcript of Utilizing Independent Colleges and Universities to Fulfill ...
A REPORT FOR
Utilizing Independent Colleges and Universities to Fulfill States’ College Degree Attainment Goals
William Zumeta and Nick Huntington-Klein

CIC’s Securing America’s Future Initiative
This report was prepared as a component of the Council of Independent Colleges’ (CIC) Securing America’s Future initiative, which extends elements of both the Project on the Future of Independent Higher Education and the Power of Liberal Arts Education public information campaign. The projects have been guided by steering and advisory committees comprised of leaders of CIC member institutions (see page 60). The Securing America’s Future initiative works to provide accurate and compelling information about the value of the liberal arts and independent higher education and to ensure continued educational excellence by fostering mission-driven innovation in CIC member institutions.
Generous support for these initiatives has been provided by the Arthur Vining Davis Foundations, Carnegie Corporation of New York, Endeavor Foundation, Gladys Krieble Delmas Foundation, Jessie Ball DuPont Fund, Lumina Foundation for Education, National Endowment for the Humanities, Teagle Foundation, and TIAA Institute.
A Report for the Council of Independent Colleges
April 2017
Utilizing Independent Colleges and Universities to Fulfill States’ College Degree Attainment Goals
William Zumeta and Nick Huntington-Klein
Copyright © 2017 Council of Independent Colleges
The Council of Independent Colleges is an association of 765 nonprofit independent colleges and universities and higher education affiliates and organizations that has worked since 1956 to support college and university leadership, advance institutional excellence, and enhance public understanding of private higher education’s contributions to society. CIC is the major national organization that focuses on providing services to leaders of independent colleges and universities as well as conferences, seminars, and other programs that help institutions improve educational quality, administrative and financial performance, and institutional visibility. CIC conducts the largest annual conferences of college and university presidents and of chief academic officers. CIC also provides support to state associations that organize programs and generate contributions for private colleges and universities. The Council is headquartered at One Dupont Circle in Washington, DC.
About the AuthorsWilliam Zumeta is professor of public policy and higher education at the University of Washington in Seattle where he has taught since 1985. He is a fellow of the TIAA Institute and previously served as senior fellow at the National Center for Public Policy and Higher Education (2005–2011). In 2009–2010, Zumeta was president of the Association for the Study of Higher Education. Earlier, he taught at UCLA as well as the University of British Columbia and Claremont Graduate University. Zumeta’s research touches on many aspects of public policy toward postsecondary education at all levels, and he has studied the private sector of academe extensively. His most recent book is Financing American Higher Education in the Era of Globalization, co-authored with Patrick Callan, David Breneman, and Joni Finney (Harvard Education Press 2012). In 2011, Zumeta co-edited with Daniel Levy a special issue of the Journal of Comparative Policy Analysis titled, “Private Higher Education and Public Policy: A Global Comparative View.” He holds a BA from Haverford College and a PhD in public policy from the University of California, Berkeley.
Nick Huntington-Klein is assistant professor of economics at California State University, Fullerton. His research interests include choice in higher education, decision making under uncertainty and risk, and teacher labor markets. Some of his work has been published in the Economics of Education Review, Research in Higher Education, Education Finance and Policy, and as policy briefs and working papers at the Center for Education Data and Research. One chapter of his dissertation, “Beliefs, Choice Structure, and Human Capital Investment,” has been published in the Journal of Economic Behavior and Organization. He holds a PhD in economics from the University of Washington and a BA from Reed College.
Table of Contents
Preface . . . . . . . . . . . . . . . . . . . . . . . . . . . . . . . . . . . . . . . . . . . . . . . . . . . . . . . . . . . . . . . . . . . . . . . . . . . . . . . . . . . . . . . . . . . . 1
Executive Summary . . . . . . . . . . . . . . . . . . . . . . . . . . . . . . . . . . . . . . . . . . . . . . . . . . . . . . . . . . . . . . . . . . . . . . . . . . . . . . 2
Introduction . . . . . . . . . . . . . . . . . . . . . . . . . . . . . . . . . . . . . . . . . . . . . . . . . . . . . . . . . . . . . . . . . . . . . . . . . . . . . . . . . . . . . . . 5
The PND Advantage . . . . . . . . . . . . . . . . . . . . . . . . . . . . . . . . . . . . . . . . . . . . . . . . . . . . . . . . . . . . . . . . . . . . . . . . . . . . . . . . 6
A Familiar Policy Tool for States . . . . . . . . . . . . . . . . . . . . . . . . . . . . . . . . . . . . . . . . . . . . . . . . . . . . . . . . . . . . . . . . . . . . . 7
Selection of States . . . . . . . . . . . . . . . . . . . . . . . . . . . . . . . . . . . . . . . . . . . . . . . . . . . . . . . . . . . . . . . . . . . . . . . . . . . . . . . . . 8
Overall Simulation Results . . . . . . . . . . . . . . . . . . . . . . . . . . . . . . . . . . . . . . . . . . . . . . . . . . . . . . . . . . . . . . . . . . . . . . . 10
Simulation Results for Individual States . . . . . . . . . . . . . . . . . . . . . . . . . . . . . . . . . . . . . . . . . . . . . . . . . . . . . . . . . 22
Alabama . . . . . . . . . . . . . . . . . . . . . . . 22
Arkansas . . . . . . . . . . . . . . . . . . . . . . . 23
California . . . . . . . . . . . . . . . . . . . . . . 24
Florida . . . . . . . . . . . . . . . . . . . . . . . . 25
Georgia . . . . . . . . . . . . . . . . . . . . . . . . 27
Illinois . . . . . . . . . . . . . . . . . . . . . . . . . . 28
Indiana . . . . . . . . . . . . . . . . . . . . . . . . . 29
Kansas . . . . . . . . . . . . . . . . . . . . . . . . . 30
Kentucky . . . . . . . . . . . . . . . . . . . . . . . 31
Minnesota . . . . . . . . . . . . . . . . . . . . . . 32
Missouri . . . . . . . . . . . . . . . . . . . . . . . . 33
Nebraska . . . . . . . . . . . . . . . . . . . . . . . 34
New Jersey . . . . . . . . . . . . . . . . . . . . . 35
New York . . . . . . . . . . . . . . . . . . . . . . 36
North Carolina . . . . . . . . . . . . . . . . . . 37
Ohio . . . . . . . . . . . . . . . . . . . . . . . . . . . 38
Oregon . . . . . . . . . . . . . . . . . . . . . . . . 39
Pennsylvania . . . . . . . . . . . . . . . . . . . 40
South Carolina . . . . . . . . . . . . . . . . . 41
Tennessee . . . . . . . . . . . . . . . . . . . . . . 42
Texas . . . . . . . . . . . . . . . . . . . . . . . . . . . 43
Virginia . . . . . . . . . . . . . . . . . . . . . . . . 44
Washington . . . . . . . . . . . . . . . . . . . . 45
West Virginia . . . . . . . . . . . . . . . . . . . 46
Conclusion . . . . . . . . . . . . . . . . . . . . . . . . . . . . . . . . . . . . . . . . . . . . . . . . . . . . . . . . . . . . . . . . . . . . . . . . . . . . . . . . . . . . . . . . 47
Endnotes . . . . . . . . . . . . . . . . . . . . . . . . . . . . . . . . . . . . . . . . . . . . . . . . . . . . . . . . . . . . . . . . . . . . . . . . . . . . . . . . . . . . . . . . . . 48
APPENDIX A: Figures . . . . . . . . . . . . . . . . . . . . . . . . . . . . . . . . . . . . . . . . . . . . . . . . . . . . . . . . . . . . . . . . . . . . . . . . . . . . . 50
APPENDIX B: List of Colleges Included in Analysis, by State . . . . . . . . . . . . . . . . . . . . . . . . . . . . . . . . . . . . . . . . . . . . . . . . . . . . . . . . . . . . . . . . . . . . . . . . . . . . . . 52
References . . . . . . . . . . . . . . . . . . . . . . . . . . . . . . . . . . . . . . . . . . . . . . . . . . . . . . . . . . . . . . . . . . . . . . . . . . . . . . . . . . . . . . . . 59
Steering Committees for CIC Initiatives . . . . . . . . . . . . . . . . . . . . . . . . . . . . . . . . . . . . . . . . . . . . . . . . . . . . . . . . . 60


Since 2013, the Council of Independent Colleges has
pursued a two-pronged agenda to explore fresh
solutions to major challenges that independent colleges
and universities face and to raise the visibility of successful
institutions. A public information campaign has promoted
the liberal arts as fields of study and the effectiveness
of independent colleges and universities. A Project on
the Future of Independent Higher Education has sought
to reconcile the need for more cost-effective business
models with the student-centered features of independent
colleges that account for much of their success.
In the past year, a series of eight workshops at locations
throughout the country has allowed about 500 college
administrative leaders and faculty to learn about these
initiatives and to adapt them to their own institutions. CIC
continues to provide presidents and other campus leaders
with research-based insights that demonstrate the value
of a liberal arts education and the effectiveness of smaller
independent colleges and universities.
This report follows one released in 2015, also by William
Zumeta and Nick Huntington-Klein, Cost Effectiveness
of Undergraduate Education at Private Nondoctoral
Colleges and Universities. This first report showed that
a degree at a public institution is 6.4 times more costly
to state taxpayers and that the efficiency of degree pro-
duction at private nondoctoral colleges and universities
is 22 percentage points higher than comparable public
institutions in four-year graduation rates. The authors
explained that in the five states studied, grants of $1,000
to students who switch enrollment from public institu-
tions to private nondoctoral colleges and universities
would increase college graduation rates and at lower
cost to taxpayers.
In this follow-up report, Utilizing Independent Colleges
and Universities to Fulfill States’ College Degree
Attainment Goals, Zumeta and Huntington-Klein expand
their analysis to consider the impact of a modest $1,000
state grant awarded to students who hypothetically
choose private colleges and universities in 24 states.
The researchers find that these modest grants would
reduce state outlays in 22 of the states and increase
total baccalaureate degree production in 19 of them. The
efficiency of degree production at private colleges and
universities leads to compelling taxpayer savings of millions
of dollars and in some states saves capital expansion
costs on the order of hundreds of millions of dollars.
These dramatic findings should guide policymakers
who are focused on increasing college attainment rates
while saving tax dollars.
Richard Ekman President
Council of Independent Colleges
April 2017
Preface
1
America’s diverse higher education landscape includes more than 700 four-year nonprofit
colleges and universities that focus on baccalaureate education.1 These private nondoctoral (PND) institu-tions are located in almost every state and collectively enroll about 1.6 million students and award nearly 150,000 degrees annually, with the majority of these being bachelor’s degrees. As this report will show, these independent colleges and universities are effective and efficient academic enterprises and, as such, are a valu-able resource to the states in which they are located, as well as to the nation.
In the first section of this report, we document just how effective and efficient these colleges and uni-versities are, drawing on research we conducted for an earlier published report, The Cost-Effectiveness of Undergraduate Education at Private Nondoctoral Colleges and Universities: Implications for Students and Public Policy (Zumeta and Huntington-Klein 2015). In particular, we show that PND colleges and universities
graduate students at higher rates and significantly earlier than public institutions with similar foci that enroll similar types of students. These advantages apply to students of all demographic groups available in sufficient numbers for analysis in data from the U.S. Department of Education’s Integrated Postsecondary Data System (IPEDS). Also, PND colleges and univer-sities are significantly more successful in retaining students who indicate in their first year that they are interested in a STEM or health major and progress to completion of a bachelor’s degree in one of those fields. Finally, we show that PND colleges and universities provide these benefits at a far lower per-degree cost to states (mainly costs for state grant aid provided to their students) than the cost of supporting students and institutions in the public sector.
Once the superior performance of PND institutions is established, we consider whether states could make better use of the capacity of these colleges and universities in their quest to increase bachelor’s degree production
Executive Summary
Utilizing Independent Colleges and Universities to Fulfill States’ College Degree Attainment Goals
2

during an era of constrained taxpayer funding. Most states already have in place state grant programs for resident students attending both public and private col-leges and universities in the state. We suggest that states could modestly increase the magnitude of such support they provide to some students choosing private over public institutions in an effort to reduce overall state costs, especially those from per-student appropriations to public colleges and universities.
The primary focus of this report, then, is to describe the results of state-specific simulations that we con-ducted of hypothetical policy changes for 24 of the 50 states.2 We explored the effects of increases in average state grants of, respectively, $1,000, $2,000, and $3,000 per year for aid-eligible students choosing private over comparable public colleges.3 Specifically, using values for the responsiveness of students to net price changes (“price elasticities”) derived from the empirical litera-ture on higher education economics, we simulated how many students at the margin of choice between a public and private college would likely shift their enrollment plans to a private college because of the hypothetical enhanced grant.4 Then, we calculated how much this shift would add to (or, in a few state-specific cases, subtract from) subsequent bachelor’s degree produc-tion in the state, and how it would affect state higher education spending overall.
For the latter calculation, we assumed that states would incur the costs of the increased grants for the affected private college students in addition to current aver-age state spending on grants to students in this sector. States would, however, save the average amount cur-rently spent on aid to these students had they attended one of the affected public institutions. They also would save on per-student appropriations to these colleges and universities for the students who shifted sectors. For analytic purposes, we calculated these latter savings conservatively at half the current per-student amount of state appropriations to the affected public institutions. All calculations were based on recent state-specific spending figures from the federal IPEDS database.
A key finding from the simulations is that the smallest grant increase (i.e., $1,000), added to the average state grant to students choosing a PND college over a com-parable (matched) public institution, produces what appears to be the most attractive combination of state budget savings and, in most states, increases bachelor’s degree production. Hence, we focus here mainly on the results of the simulations of this level of state grant increase. The results of the $2,000 increase are covered briefly and reported in Table 4. In general, the $2,000 grant added to state costs considerably while producing only modestly greater bachelor’s degree output. The $3,000 grant increase was judged to be prohibitively costly and was not considered for further study.
This report covers the findings for all 24 states that were studied. In summary, the simulations for the $1,000 grant increase show that, in all but two of the states studied (California and South Carolina), under the assumptions explained, states are projected to save money on balance, primarily from reduced appropri-ations to affected public institutions. Using the more conservative estimate of the number of students who would shift sectors (based on the more conservative of the two price elasticity values we studied), these net state annual operating budget savings range from $1.8 million in Oregon to $159 million in New York. The estimated annual net savings reach approximately $137 million in Ohio, $67 million in Texas, $61 mil-lion in Illinois, $52 million in Indiana, $39 million in Tennessee, $38 million in North Carolina, $33 million in Florida, and $32 million in Georgia. Annual savings of less than $30 million are estimated to occur in 13 more states.
3 COUNCIL OF INDEPENDENT COLLEGES
All but two of the states are projected to save money on balance, primarily from reduced appropriations to affected public institutions.
If we apply an alternate, more expansive response elas-ticity assumption that is still plausible according to the empirical literature, annual state savings are enhanced by more than half. In California and South Carolina, however, already generous state grants to private college students mean that moving students into this sector from the public sector is quite costly. These costs modestly outweigh appropriations savings by about $300,000 per year in California (or about $450,000 under the more expansive elasticity assumption) and $2.2 million in South Carolina (or $3.4 million under the more expansive elasticity assumption).
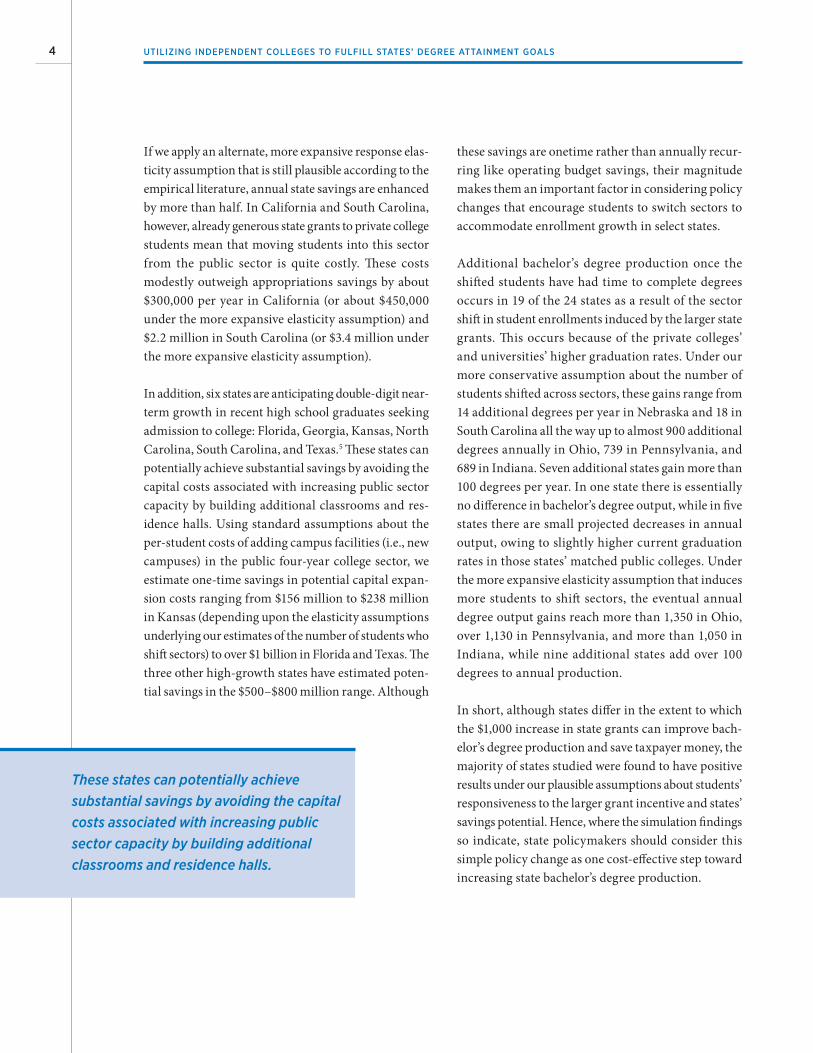
In addition, six states are anticipating double-digit near-term growth in recent high school graduates seeking admission to college: Florida, Georgia, Kansas, North Carolina, South Carolina, and Texas.5 These states can potentially achieve substantial savings by avoiding the capital costs associated with increasing public sector capacity by building additional classrooms and res-idence halls. Using standard assumptions about the per-student costs of adding campus facilities (i.e., new campuses) in the public four-year college sector, we estimate one-time savings in potential capital expan-sion costs ranging from $156 million to $238 million in Kansas (depending upon the elasticity assumptions underlying our estimates of the number of students who shift sectors) to over $1 billion in Florida and Texas. The three other high-growth states have estimated poten-tial savings in the $500–$800 million range. Although
these savings are onetime rather than annually recur-ring like operating budget savings, their magnitude makes them an important factor in considering policy changes that encourage students to switch sectors to accommodate enrollment growth in select states.
Additional bachelor’s degree production once the shifted students have had time to complete degrees occurs in 19 of the 24 states as a result of the sector shift in student enrollments induced by the larger state grants. This occurs because of the private colleges’ and universities’ higher graduation rates. Under our more conservative assumption about the number of students shifted across sectors, these gains range from 14 additional degrees per year in Nebraska and 18 in South Carolina all the way up to almost 900 additional degrees annually in Ohio, 739 in Pennsylvania, and 689 in Indiana. Seven additional states gain more than 100 degrees per year. In one state there is essentially no difference in bachelor’s degree output, while in five states there are small projected decreases in annual output, owing to slightly higher current graduation rates in those states’ matched public colleges. Under the more expansive elasticity assumption that induces more students to shift sectors, the eventual annual degree output gains reach more than 1,350 in Ohio, over 1,130 in Pennsylvania, and more than 1,050 in Indiana, while nine additional states add over 100 degrees to annual production.
In short, although states differ in the extent to which the $1,000 increase in state grants can improve bach-elor’s degree production and save taxpayer money, the majority of states studied were found to have positive results under our plausible assumptions about students’ responsiveness to the larger grant incentive and states’ savings potential. Hence, where the simulation findings so indicate, state policymakers should consider this simple policy change as one cost-effective step toward increasing state bachelor’s degree production.
4 UTILIZING INDEPENDENT COLLEGES TO FULFILL STATES’ DEGREE ATTAINMENT GOALS
These states can potentially achieve substantial savings by avoiding the capital costs associated with increasing public sector capacity by building additional classrooms and residence halls.

Introduction
5
The U.S. higher education sector includes more than 700 private nondoctoral (PND) four-year nonprofit
colleges and universities that focus primarily on bac-calaureate-level education. This sector enrolls around 1.6 million students and grants nearly 150,000 degrees annually. An earlier study, The Cost-Effectiveness of Undergraduate Education at Private Nondoctoral Colleges and Universities (Zumeta and Huntington-Klein 2015), showed that the PND sector is a very cost-effective provider of baccalaureate degrees. Its record of successfully graduating students, and grad-uating them in a timely way, exceeds that of comparable public institutions by a substantial margin for all types of students. The PND sector accomplishes this greater effectiveness at a much lower cost to taxpayers than public institutions do.
Motivated by the potential to improve degree attain-ment at low taxpayer cost,6 the analysis herein reports the results of simulations across 24 states. In the simu-lations, we estimate the hypothetical effect of incentive grant enhancements provided to state resident students
choosing to enroll in private colleges and universi-ties that are members of the Council of Independent Colleges (CIC) rather than in comparable public insti-tutions in the same state.7
Although results vary across the states, along with their distinct public and private higher education sectors and state spending patterns, in general we find that a relatively modest inducement—an additional state aid grant of just $1,000 accurately targeted at students switching sectors—would lead significant numbers of students to shift sectors. In most states this would eventually lead to increased baccalaureate degree pro-duction while also saving the state money. In most cases state student aid spending would increase, but this cost would be more than offset by the assumed reduced appropriations to public colleges and universities.8
This report on these analytic results proceeds as fol-lows. First, it summarizes findings from our earlier study (Zumeta and Huntington-Klein 2015). Then, it provides details on our simulation methodology and
6 UTILIZING INDEPENDENT COLLEGES TO FULFILL STATES’ DEGREE ATTAINMENT GOALS
the data. Finally, it presents the results of our simula-tions, summarizing the results across the states and then detailing the results for each state.
The PND AdvantageIn our 2015 report, we compared PND colleges and universities to similar public institutions on several performance indicators, using carefully matched national samples of hundreds of institutions from each sector enrolling similar mixes of students. The key com-parisons were based on standard data from the U.S. Department of Education’s Integrated Postsecondary Data System (IPEDS) covering the years 2005–2012. A summary of the major findings follows.
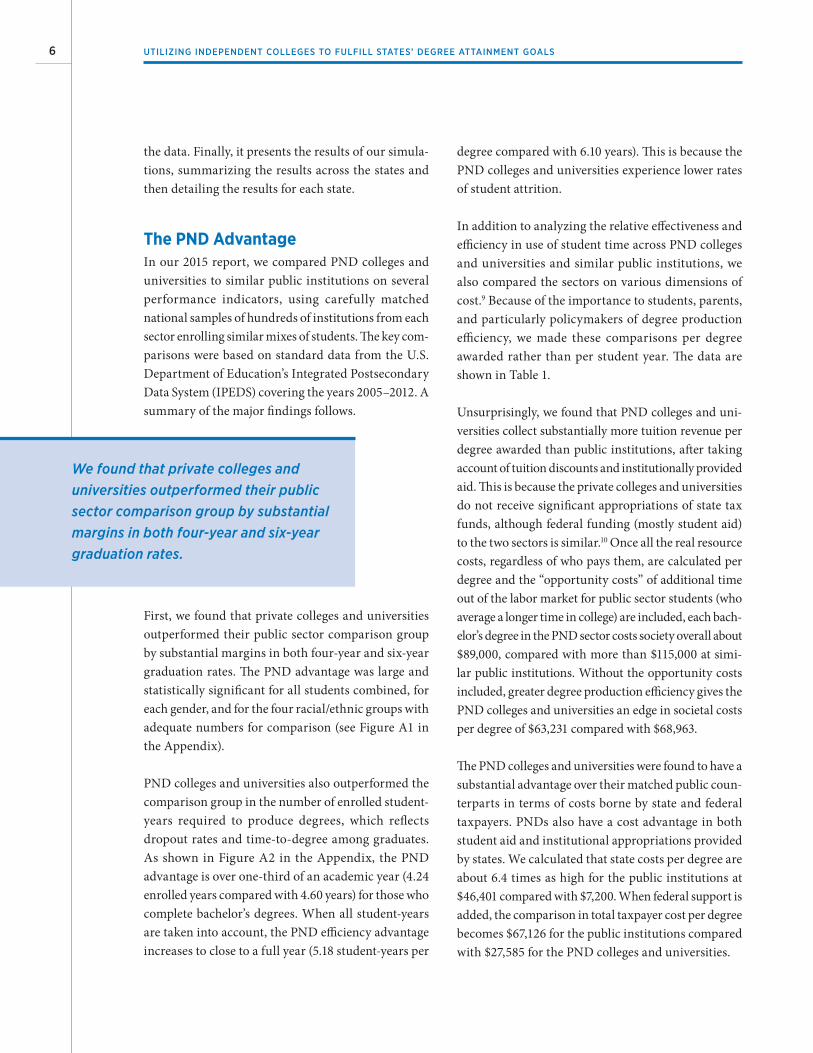
First, we found that private colleges and universities outperformed their public sector comparison group by substantial margins in both four-year and six-year graduation rates. The PND advantage was large and statistically significant for all students combined, for each gender, and for the four racial/ethnic groups with adequate numbers for comparison (see Figure A1 in the Appendix).
PND colleges and universities also outperformed the comparison group in the number of enrolled student- years required to produce degrees, which reflects dropout rates and time-to-degree among graduates. As shown in Figure A2 in the Appendix, the PND advantage is over one-third of an academic year (4.24 enrolled years compared with 4.60 years) for those who complete bachelor’s degrees. When all student-years are taken into account, the PND efficiency advantage increases to close to a full year (5.18 student-years per
degree compared with 6.10 years). This is because the PND colleges and universities experience lower rates of student attrition.
In addition to analyzing the relative effectiveness and efficiency in use of student time across PND colleges and universities and similar public institutions, we also compared the sectors on various dimensions of cost.9 Because of the importance to students, parents, and particularly policymakers of degree production efficiency, we made these comparisons per degree awarded rather than per student year. The data are shown in Table 1.
Unsurprisingly, we found that PND colleges and uni-versities collect substantially more tuition revenue per degree awarded than public institutions, after taking account of tuition discounts and institutionally provided aid. This is because the private colleges and universities do not receive significant appropriations of state tax funds, although federal funding (mostly student aid) to the two sectors is similar.10 Once all the real resource costs, regardless of who pays them, are calculated per degree and the “opportunity costs” of additional time out of the labor market for public sector students (who average a longer time in college) are included, each bach-elor’s degree in the PND sector costs society overall about $89,000, compared with more than $115,000 at simi-lar public institutions. Without the opportunity costs included, greater degree production efficiency gives the PND colleges and universities an edge in societal costs per degree of $63,231 compared with $68,963.
The PND colleges and universities were found to have a substantial advantage over their matched public coun-terparts in terms of costs borne by state and federal taxpayers. PNDs also have a cost advantage in both student aid and institutional appropriations provided by states. We calculated that state costs per degree are about 6.4 times as high for the public institutions at $46,401 compared with $7,200. When federal support is added, the comparison in total taxpayer cost per degree becomes $67,126 for the public institutions compared with $27,585 for the PND colleges and universities.
We found that private colleges and universities outperformed their public sector comparison group by substantial margins in both four-year and six-year graduation rates.
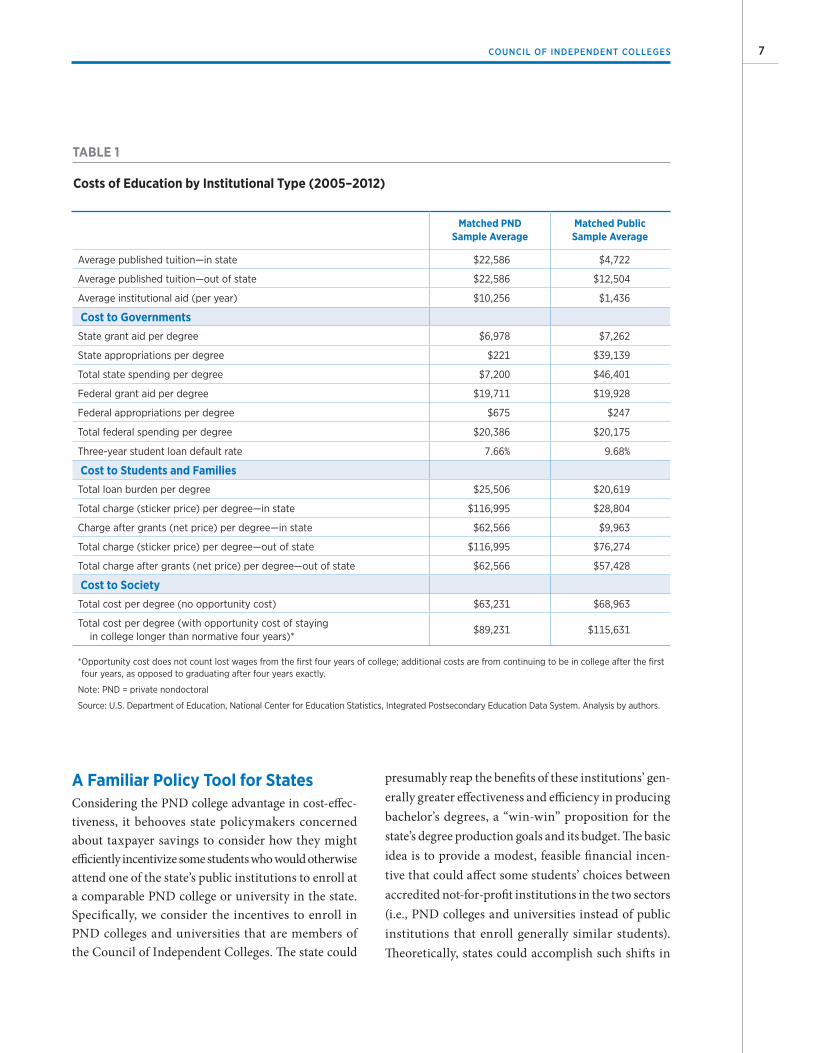
TABLE 1
Costs of Education by Institutional Type (2005–2012)
Matched PND Sample Average
Matched Public Sample Average
Average published tuition—in state $22,586 $4,722
Average published tuition—out of state $22,586 $12,504
Average institutional aid (per year) $10,256 $1,436
Cost to GovernmentsState grant aid per degree $6,978 $7,262
State appropriations per degree $221 $39,139
Total state spending per degree $7,200 $46,401
Federal grant aid per degree $19,711 $19,928
Federal appropriations per degree $675 $247
Total federal spending per degree $20,386 $20,175
Three-year student loan default rate 7.66% 9.68%
Cost to Students and FamiliesTotal loan burden per degree $25,506 $20,619
Total charge (sticker price) per degree—in state $116,995 $28,804
Charge after grants (net price) per degree—in state $62,566 $9,963
Total charge (sticker price) per degree—out of state $116,995 $76,274
Total charge after grants (net price) per degree—out of state $62,566 $57,428
Cost to SocietyTotal cost per degree (no opportunity cost) $63,231 $68,963
Total cost per degree (with opportunity cost of staying in college longer than normative four years)*
$89,231 $115,631
* Opportunity cost does not count lost wages from the first four years of college; additional costs are from continuing to be in college after the first four years, as opposed to graduating after four years exactly.
Note: PND = private nondoctoral
Source: U.S. Department of Education, National Center for Education Statistics, Integrated Postsecondary Education Data System. Analysis by authors.
7 COUNCIL OF INDEPENDENT COLLEGES
A Familiar Policy Tool for States Considering the PND college advantage in cost-effec-tiveness, it behooves state policymakers concerned about taxpayer savings to consider how they might efficiently incentivize some students who would otherwise attend one of the state’s public institutions to enroll at a comparable PND college or university in the state. Specifically, we consider the incentives to enroll in PND colleges and universities that are members of the Council of Independent Colleges. The state could
presumably reap the benefits of these institutions’ gen-erally greater effectiveness and efficiency in producing bachelor’s degrees, a “win-win” proposition for the state’s degree production goals and its budget. The basic idea is to provide a modest, feasible financial incen-tive that could affect some students’ choices between accredited not-for-profit institutions in the two sectors (i.e., PND colleges and universities instead of public institutions that enroll generally similar students). Theoretically, states could accomplish such shifts in
several ways, including direct state appropriations to willing private nondoctoral institutions, “capita-tion” payments to private institutions specifically for enrolling (or graduating) additional (above some base year) state resident students, or perhaps even incentives provided to individuals for private sector enrollment through the state tax system.
In most states, such schemes would face feasibility challenges because they would represent new types of policies. Yet nearly all states already have on the books one or more student aid (or “state scholarship”) pro-grams for which state resident students enrolling in accredited, private nonprofit colleges and universities are eligible (National Association of State Student Grant and Aid Programs 2016). In other words, state policy has already institutionalized the idea of subsidizing some student choice through student aid. The student aid policy lever is familiar and, presumably, relatively easy for policymakers to manipulate. States with such programs—and a willing and reasonably sized set of PND colleges and universities from which students can choose—could simply add a modest sum to their existing state scholarship grants available to incoming students enrolling at smaller private colleges and universities rather than comparable public institutions in order to incent some students to shift their enrollment choices. In the simulations reported below, we tested the effects of both $1,000 and $2,000 average increases in state aid grants provided to aid-eligible, resident students.11
Selection of StatesStates were selected for policy simulations based on sev-eral criteria. First, we sought states that had sufficient numbers of private colleges and universities similar enough to their public institutions to make it mean-ingful to consider the implications of inducing some students to consider shifting their enrollment choice from a public to a private institution. States facing sig-nificant expected enrollment growth were particularly good candidates for this study because such states also would be able to save on the capital costs of expanding their public higher education sectors if some of this growth could be accommodated in the private sector. In addition, we considered the relative degree produc-tivity of the two sectors of matched institutions in the state. In most cases, the private sector group was more efficient in producing bachelor’s degrees because of its generally higher completion rates and lower average time to degree.
In the end, 24 states were selected for the policy sim-ulations, or nearly half of the U.S. states. These states provided state tuition grants to students enrolled at private institutions and had sufficient numbers of “matched” public and private colleges and universi-ties to use in the analysis. These states are listed below. Their institutions represent approximately 60 percent of CIC members.
Alabama Arkansas California Florida Georgia Illinois Indiana Kansas Kentucky Minnesota Missouri Nebraska
New Jersey New York North Carolina OhioOregon Pennsylvania South Carolina Tennessee TexasVirginia Washington West Virginia
8 UTILIZING INDEPENDENT COLLEGES TO FULFILL STATES’ DEGREE ATTAINMENT GOALS
States facing significant expected enroll-ment growth were particularly good candidates for this study because such states also would be able to save on the capital costs of expanding their public higher education sectors if some of this growth could be accommodated in the private sector.
9 COUNCIL OF INDEPENDENT COLLEGES
SECTION HIGHLIGHTS
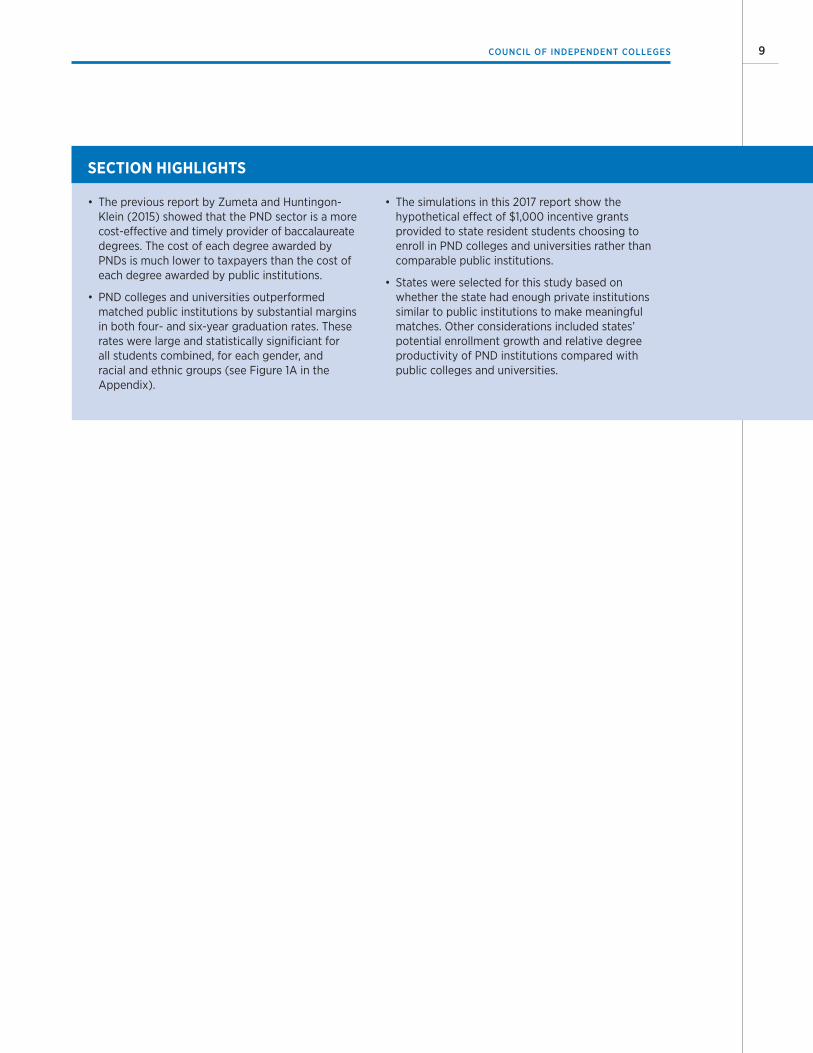
• The previous report by Zumeta and Huntingon-Klein (2015) showed that the PND sector is a more cost-effective and timely provider of baccalaureate degrees. The cost of each degree awarded by PNDs is much lower to taxpayers than the cost of each degree awarded by public institutions.
• PND colleges and universities outperformed matched public institutions by substantial margins in both four- and six-year graduation rates. These rates were large and statistically significiant for all students combined, for each gender, and racial and ethnic groups (see Figure 1A in the Appendix).
• The simulations in this 2017 report show the hypothetical effect of $1,000 incentive grants provided to state resident students choosing to enroll in PND colleges and universities rather than comparable public institutions.
• States were selected for this study based on whether the state had enough private institutions similar to public institutions to make meaningful matches. Other considerations included states’ potential enrollment growth and relative degree productivity of PND institutions compared with public colleges and universities.
Our simulation scenarios included hypothetical increases in state student aid grants to students
assumed to select a matched private college or univer-sity over one of the matched public institutions because of the increased grant for doing so. We examined the effects of average student grant increases relative to existing state aid grants to resident students attending private colleges and universities at three different levels: a $1,000 grant increase, a $2,000 grant increase, and a $3,000 increase. Here we focus on the $1,000 grant increase, since it clearly produced the most attractive combination of results in the form of substantially larger state operating budget savings and, at the same time, an increase in degree attainment gains that were only modestly smaller than would result from the larger grant increases. We provide tables summarizing the results for the $1,000 grant increase in this section and analogous tables for the $2,000 grant increase in Table 4. We determined the $3,000 grant increase from the simulation results to be prohibitively costly for states and do not consider it further here.
Overall Simulation Results
10
Procedure for Matching PND Colleges and Universities with Similar Public Institutions within StatesWhen comparing PND and public institutions, it makes sense to make comparisons using only the public institutions that are most like the private colleges and universities. That way, our comparison is of institu-tions between which students could reasonably choose in response to a change in the relative magnitude of state aid grants. Therefore, our estimates are based on a comparison of PND colleges and universities in each state with a set of public institutions in that same state that match them well in key respects.
To construct the set of matched public institutions in each state, we use a “distance measure” of how similar or different each private-public pair of institutions is within each state.12 For each PND college and univer-sity we choose the “closest” public match based on this multivariate distance score to include in the compari-son group. If a private college does not have any strong

11 COUNCIL OF INDEPENDENT COLLEGES
match in the state, then we omit the institution from the analysis. We define a “strong match” as one for which the distance measure is less than 0.2 of a standard devi-ation of the entire distribution of PND-public in-state matches across all the states. This basic criterion of 0.2 standard deviations for a strong match is in line with a rough rule of thumb in the empirical social science matching literature (Steiner and Cook 2013).
This basic matching procedure does not, however, generate representative comparison groups in every state among our 24 states of interest. In some states, there are not enough PND colleges and universities with any strong public match, and so there are fewer institutions in the private sector group used for the comparisons. In other states, the same public college serves as the closest public match for many of the PND institutions, and so there are too few colleges and universities in the public comparison group to make sense for policy purposes. For such states, which include Alabama, California, Florida, Kansas, Kentucky, Indiana, Nebraska, Oregon, Tennessee, and Washington among our 24 focal states, we broaden the analysis in two ways. First, we loosen the defi-nition of a “strong match” institution to be 0.3 of a standard deviation among the national private-public pair distribution (rather than 0.2). This loosened defi-nition allows more PND colleges and universities into the comparison group. Second, we include a college in the public comparison group in a state if there is any strong PND-public match for that college in its state, rather than only using the strongest PND-public match for each private college, in order to allow more public institutions into the public comparison group. In addition, Ohio had especially weak matches between its PND colleges and universities and its public institutions. So for Ohio alone we weakened the definition of a “strong match” to be 0.4 of a stan-dard deviation among the distribution of PND-public in-state pairs.
These alternate matching rules allow us to include the above-named states, including Ohio, in the analysis. Although the closeness of the PND-public match
in these states is weaker than in the other states, we emphasize that the single-match, 0.2 standard deviation rule, is not a hard and fast rule. It is well acknowledged that the matching procedure should be sensitive to the structure of the data itself (Althauser and Rubin 1970; Lunt 2014).
Basic Data on Matched Institutions within the 24 StatesFirst, we draw the reader’s attention to Table 2, which includes some basic data suggesting how most states could benefit from shifting some students from public to private institutions for the colleges and universities in the two sectors in each state that were determined to be reasonably similar (i.e., “matched” private and public institutions).
Columns one and two of Table 2 show the number of private colleges and universities in each state that had a reasonable match in the state’s public collegiate sector as well as the number of public sector institutions involved in these matches. The full list of colleges included in the analysis is shown in Appendix B. Columns three and four compare the six-year graduation rates13 of the matched institutions in the two sectors (from IPEDS data for the years 2005–2012). In 18 of the 24 states, the matched private institutions have higher graduation rates—and many have rates substantially higher than the matched public universities. In Missouri, the two sectors have equal graduation rates, while the matched public colleges and universities have modestly higher rates in five states: Florida, Kansas, North Carolina, New Jersey, and Virginia. Columns five and six show the total of enrolled student-years per bachelor’s degree
In 18 of the 24 states, the matched private institutions have higher graduation rates—and many have rates substantially higher than the matched public universities.

TABLE 2
Comparative Statistics of Matched Private Nondoctoral (PND) and Matched Public Institutions
Number of Institutions Used
Six-Year Graduation Rate
Years of Education per Degree
STEM/Health Degree Share
Average State Grant per Degree
State PNDMatchedPublics PND
MatchedPublics PND
MatchedPublics PND
MatchedPublics PND
MatchedPublics
(1) (2) (3) (4) (5) (6) (7) (8) (9) (10)
Alabama* 8 14 0.51 0.40 6.51 7.55 0.30 0.26 $5,879 $12,630
Arkansas 4 3 0.47 0.32 6.73 8.07 0.12 0.16 $22,091 $20,499
California* 24 29 0.60 0.56 5.42 6.22 0.19 0.22 $40,928 $19,687
Florida* 15 11 0.48 0.53 6.22 6.07 0.17 0.23 $26,604 $17,451
Georgia 11 4 0.54 0.40 5.99 7.17 0.22 0.18 $17,520 $28,832
Illinois 23 3 0.58 0.53 5.76 6.06 0.24 0.17 $25,088 $25,656
Indiana* 24 14 0.64 0.35 5.18 8.64 0.23 0.26 $26,658 $31,192
Kansas* 14 7 0.46 0.49 6.25 6.28 0.23 0.25 $17,009 $7,474
Kentucky* 15 8 0.48 0.43 6.40 7.04 0.23 0.22 $25,822 $13,929
Minnesota 12 5 0.69 0.47 4.94 6.36 0.26 0.25 $17,862 $16,510
Missouri 11 4 0.51 0.51 5.99 6.04 0.22 0.18 $14,989 $10,446
Nebraska* 7 6 0.53 0.49 6.08 6.48 0.28 0.18 $6,926 $8,647
New Jersey 9 3 0.54 0.58 5.75 5.85 0.17 0.16 $43,063 $29,464
New York 34 8 0.56 0.49 5.61 6.20 0.25 0.25 $15,228 $15,054
North Carolina 15 4 0.44 0.46 6.45 6.53 0.15 0.21 $26,391 $17,240
Ohio* 35 14 0.58 0.48 5.64 6.81 0.23 0.26 $9,509 $11,104
Oregon* 9 6 0.66 0.45 5.34 6.75 0.15 0.23 $14,295 $11,897
Pennsylvania 50 10 0.65 0.54 5.08 5.85 0.27 0.26 $16,532 $17,938
South Carolina 12 4 0.55 0.54 5.71 5.88 0.14 0.18 $35,274 $27,841
Tennessee* 18 9 0.51 0.43 6.01 6.83 0.22 0.24 $26,860 $29,155
Texas 14 8 0.51 0.35 6.25 7.73 0.17 0.17 $22,645 $26,251
Virginia 13 4 0.60 0.65 5.44 5.32 0.19 0.14 $14,920 $19,864
Washington* 8 6 0.73 0.62 4.87 5.54 0.21 0.22 $25,418 $23,716
West Virginia 7 3 0.53 0.37 5.72 7.49 0.31 0.24 $18,404 $26,503
* These states, using “Multiple” matching, allowed multiple public matches per PND institution, and with the exception of Ohio, used a match strength standard of 0.3 instead of 0.2. Ohio used a match strength standard of 0.4. Outlier institutions were omitted from the Washington and West Virginia analyses.
Source: U.S. Department of Education, National Center for Education Statistics, Integrated Postsecondary Education Data System. Analysis by authors.
12 UTILIZING INDEPENDENT COLLEGES TO FULFILL STATES’ DEGREE ATTAINMENT GOALS

13 COUNCIL OF INDEPENDENT COLLEGES
in the matched institutions from the two sectors, again showing that in most cases the private institutions take fewer enrolled years to produce a degree and are more efficient in degree production overall. The difference favoring the private nondoctoral institutions is more than a student-year of enrollment in nine states and more than half a year of enrollment in 15 of the 24 states. Small differences favor the PND institutions in seven more states, and small differences favor the public institutions in two states (Florida and Virginia).
The share of bachelor’s degrees awarded in STEM and health fields—major fields of high current policy interest—is shown in columns seven and eight of Table 2. Here the two sectors are fairly equal, with the matched private colleges and universities showing a higher pro-portion of such majors in 11 states, the matched public institutions leading in 11 states, and equal proportions in two states. In most states the proportions of STEM and health degrees granted in the two sectors are fairly sim-ilar, with one sector leading by more than 5 percentage points in only six states. In three of these cases (Illinois, Nebraska, and West Virginia) the matched private colleges and universities grant substantially more STEM/health degrees, while in Florida, North Carolina, and Oregon the matched public colleges and universi-ties grant a substantially larger share. As mentioned earlier, our previously published study (Zumeta and Huntington-Klein 2015) found that, based on following a nationally representative sample of students from the federal Beginning Postsecondary Survey 2003–2009, the private nondoctoral sector was much more successful in retaining students who initially expressed interest in STEM and health fields to bachelor’s degrees in those fields than were either public doctoral or public non-doctoral institutions.
Columns nine and ten of Table 2 show the average state grant provided per degree (taking into account annual per-student state aid grants and the number of years of education needed to produce a degree) at PND colleges and universities and matched public institutions. Most state governments provide more grant funding to stu-dents at public institutions. In some states, however,
students at private colleges and universities already receive robust funding; and in several states, more grant funding per degree goes to PND institutions than to their matched public counterparts. (This does not account for the additional funding in state appro-priations to public institutions.)
We also incorporate information about the poten-tial that each state has to see growth in the ranks of incoming first-year students, since states with increasing student populations may soon experi-ence campus size constraints. To calculate this, we use forecasts of increases in the high school gradu-ate population recently published by the Western Interstate Commission for Higher Education (WICHE) (Bransberger and Michelau 2016). From this report we identify six states that have fast-growing high school graduate populations: Florida (9.5 percent projected growth between 2012–2013 and 2024–202514), Georgia (12 percent), Kansas (10.7 percent), North Carolina (9.3 percent), South Carolina (11.3 percent), and Texas (19.2 percent). In the simulations, we consider the possibility that these states will be able to pursue savings in capital costs they would presumably otherwise incur to expand their public sector capacity, in addition to any operating budget savings from grant and appropriations spending that the shifting of students across sectors allows.
Simulation ResultsWe turn now to the results of the $1,000 state aid grant increase (for students enrolling in private rather than public colleges and universities) simulations, which are shown in Table 3.
The difference favoring the privatenondoctoral institutions is more than astudent-year of enrollment in nine statesand more than half a year of enrollmentin 15 of the 24 states.
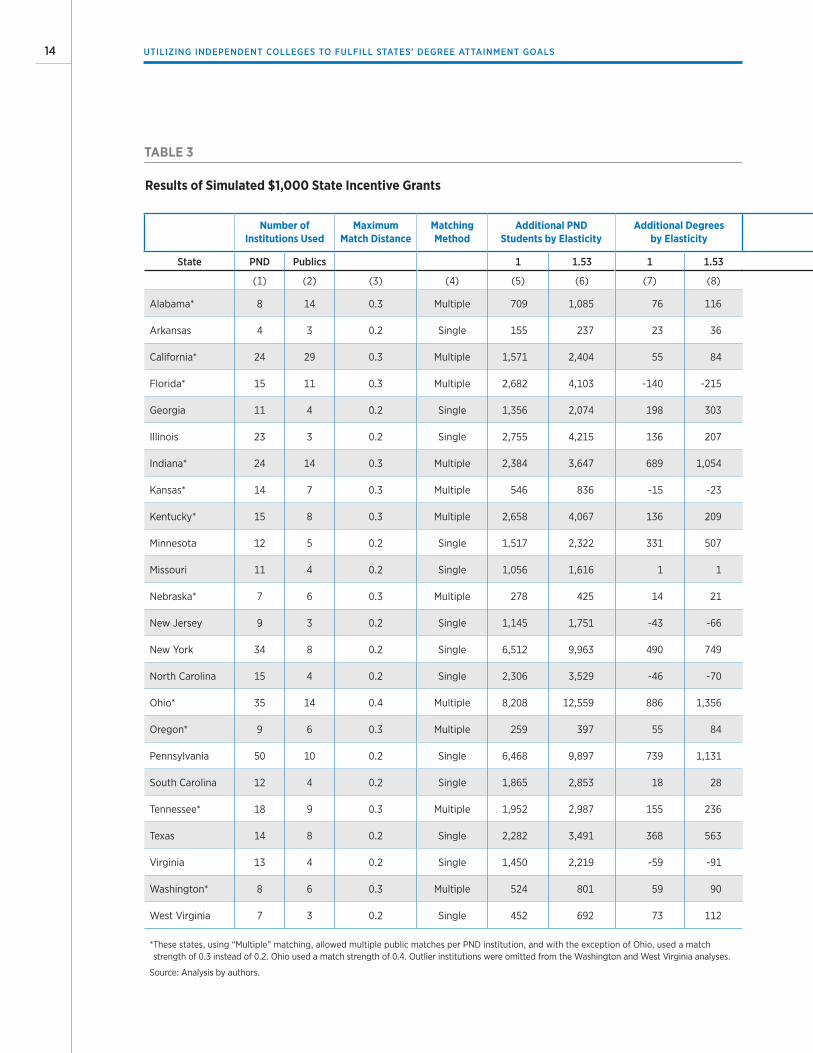
TABLE 3
Results of Simulated $1,000 State Incentive Grants
Number of Institutions Used
Maximum Match Distance
Matching Method
Additional PND Students by Elasticity
Additional Degrees by Elasticity
State PND Publics 1 1.53 1 1.53
(1) (2) (3) (4) (5) (6) (7) (8)
Alabama* 8 14 0.3 Multiple 709 1,085 76 116
Arkansas 4 3 0.2 Single 155 237 23 36
California* 24 29 0.3 Multiple 1,571 2,404 55 84
Florida* 15 11 0.3 Multiple 2,682 4,103 -140 -215
Georgia 11 4 0.2 Single 1,356 2,074 198 303
Illinois 23 3 0.2 Single 2,755 4,215 136 207
Indiana* 24 14 0.3 Multiple 2,384 3,647 689 1,054
Kansas* 14 7 0.3 Multiple 546 836 -15 -23
Kentucky* 15 8 0.3 Multiple 2,658 4,067 136 209
Minnesota 12 5 0.2 Single 1,517 2,322 331 507
Missouri 11 4 0.2 Single 1,056 1,616 1 1
Nebraska* 7 6 0.3 Multiple 278 425 14 21
New Jersey 9 3 0.2 Single 1,145 1,751 -43 -66
New York 34 8 0.2 Single 6,512 9,963 490 749
North Carolina 15 4 0.2 Single 2,306 3,529 -46 -70
Ohio* 35 14 0.4 Multiple 8,208 12,559 886 1,356
Oregon* 9 6 0.3 Multiple 259 397 55 84
Pennsylvania 50 10 0.2 Single 6,468 9,897 739 1,131
South Carolina 12 4 0.2 Single 1,865 2,853 18 28
Tennessee* 18 9 0.3 Multiple 1,952 2,987 155 236
Texas 14 8 0.2 Single 2,282 3,491 368 563
Virginia 13 4 0.2 Single 1,450 2,219 -59 -91
Washington* 8 6 0.3 Multiple 524 801 59 90
West Virginia 7 3 0.2 Single 452 692 73 112
* These states, using “Multiple” matching, allowed multiple public matches per PND institution, and with the exception of Ohio, used a match strength of 0.3 instead of 0.2. Ohio used a match strength of 0.4. Outlier institutions were omitted from the Washington and West Virginia analyses.
Source: Analysis by authors.
14 UTILIZING INDEPENDENT COLLEGES TO FULFILL STATES’ DEGREE ATTAINMENT GOALS
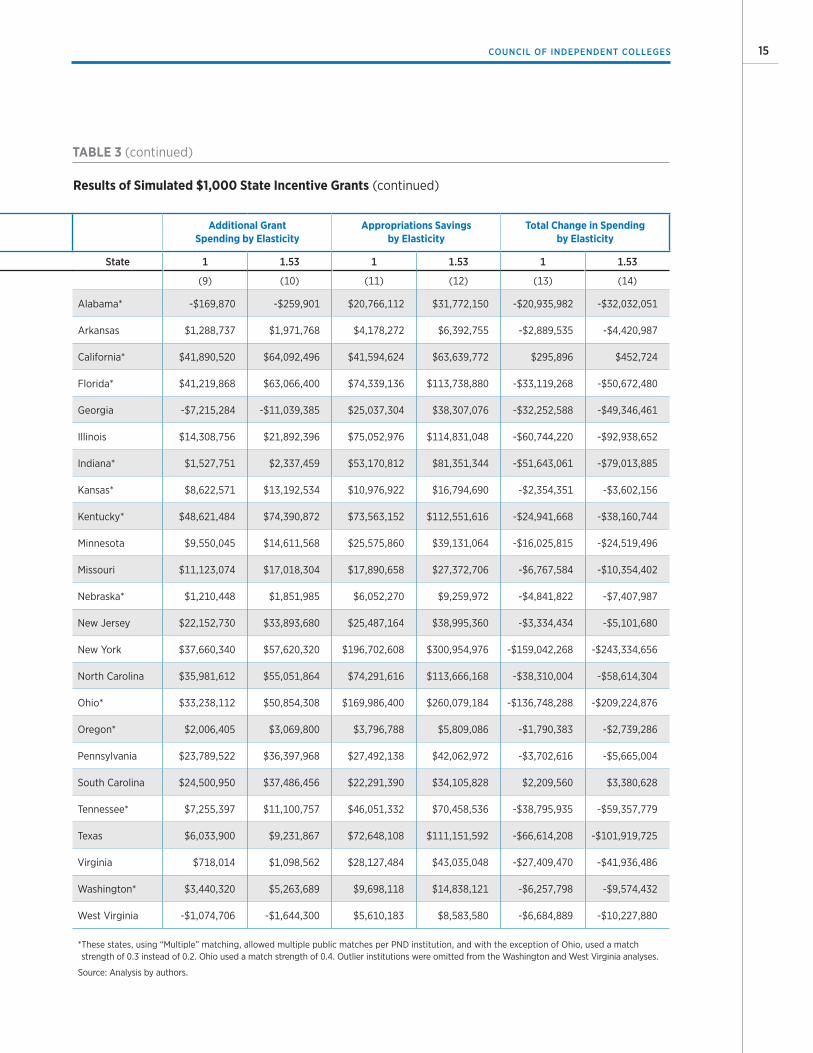
TABLE 3 (continued)
Results of Simulated $1,000 State Incentive Grants (continued)
Additional Grant Spending by Elasticity
Appropriations Savings by Elasticity
Total Change in Spending by Elasticity
State 1 1.53 1 1.53 1 1.53
(9) (10) (11) (12) (13) (14)
Alabama* -$169,870 -$259,901 $20,766,112 $31,772,150 -$20,935,982 -$32,032,051
Arkansas $1,288,737 $1,971,768 $4,178,272 $6,392,755 -$2,889,535 -$4,420,987
California* $41,890,520 $64,092,496 $41,594,624 $63,639,772 $295,896 $452,724
Florida* $41,219,868 $63,066,400 $74,339,136 $113,738,880 -$33,119,268 -$50,672,480
Georgia -$7,215,284 -$11,039,385 $25,037,304 $38,307,076 -$32,252,588 -$49,346,461
Illinois $14,308,756 $21,892,396 $75,052,976 $114,831,048 -$60,744,220 -$92,938,652
Indiana* $1,527,751 $2,337,459 $53,170,812 $81,351,344 -$51,643,061 -$79,013,885
Kansas* $8,622,571 $13,192,534 $10,976,922 $16,794,690 -$2,354,351 -$3,602,156
Kentucky* $48,621,484 $74,390,872 $73,563,152 $112,551,616 -$24,941,668 -$38,160,744
Minnesota $9,550,045 $14,611,568 $25,575,860 $39,131,064 -$16,025,815 -$24,519,496
Missouri $11,123,074 $17,018,304 $17,890,658 $27,372,706 -$6,767,584 -$10,354,402
Nebraska* $1,210,448 $1,851,985 $6,052,270 $9,259,972 -$4,841,822 -$7,407,987
New Jersey $22,152,730 $33,893,680 $25,487,164 $38,995,360 -$3,334,434 -$5,101,680
New York $37,660,340 $57,620,320 $196,702,608 $300,954,976 -$159,042,268 -$243,334,656
North Carolina $35,981,612 $55,051,864 $74,291,616 $113,666,168 -$38,310,004 -$58,614,304
Ohio* $33,238,112 $50,854,308 $169,986,400 $260,079,184 -$136,748,288 -$209,224,876
Oregon* $2,006,405 $3,069,800 $3,796,788 $5,809,086 -$1,790,383 -$2,739,286
Pennsylvania $23,789,522 $36,397,968 $27,492,138 $42,062,972 -$3,702,616 -$5,665,004
South Carolina $24,500,950 $37,486,456 $22,291,390 $34,105,828 $2,209,560 $3,380,628
Tennessee* $7,255,397 $11,100,757 $46,051,332 $70,458,536 -$38,795,935 -$59,357,779
Texas $6,033,900 $9,231,867 $72,648,108 $111,151,592 -$66,614,208 -$101,919,725
Virginia $718,014 $1,098,562 $28,127,484 $43,035,048 -$27,409,470 -$41,936,486
Washington* $3,440,320 $5,263,689 $9,698,118 $14,838,121 -$6,257,798 -$9,574,432
West Virginia -$1,074,706 -$1,644,300 $5,610,183 $8,583,580 -$6,684,889 -$10,227,880
* These states, using “Multiple” matching, allowed multiple public matches per PND institution, and with the exception of Ohio, used a match strength of 0.3 instead of 0.2. Ohio used a match strength of 0.4. Outlier institutions were omitted from the Washington and West Virginia analyses.
Source: Analysis by authors.
15 COUNCIL OF INDEPENDENT COLLEGES

16 UTILIZING INDEPENDENT COLLEGES TO FULFILL STATES’ DEGREE ATTAINMENT GOALS
After the columns showing the number of matched institutions (one and two) and the matching criteria used (columns three and four), as described above, the first of the simulation results are presented in Table 3. Columns five and six, labeled “Additional PND Students by Elasticity,” show the estimated number of students who would shift sectors in response to the hypothesized larger average grant for private sector enrollees, with column five assuming a fairly conservative unit (-1.0) price elasticity of response15 to the reduced private-public net price gap. Column six provides a more expansive estimate (an elasticity of -1.53) of the enrollment shift-ing effect based upon an upper-bound elasticity value drawn from the empirical higher education economics literature (Allen and Shen 1999; Curs and Singell 2002; van der Klaauw 2002; Buss, Parker, and Rivenburg 2004). The numbers of students estimated to shift sectors range from a low of 155 in Arkansas under the lower elasticity assumption and up to more than 12,500 in Ohio and nearly 10,000 in New York and Pennsylvania under the higher elasticity assumption. In 17 of the 24 states, more than 1,000 students are estimated to shift sectors even under the more conservative response elasticity assump-tion. In addition, Alabama passes the 1,000 student mark under the more expansive elasticity assumption. The states with estimated shifts of a few hundred students are those with lower total enrollment. Thus, even the smaller numbers in such states as Arkansas, Kansas, Nebraska, Oregon, and West Virginia may be considered significant.
Columns seven and eight, labeled “Additional Degrees by Elasticity,” estimate the effects these shifts in enroll-ments would have on bachelor’s degrees granted six years later. These estimates are based on the graduation
rate averages by sector shown in Table 2. Because the matched private colleges and universities in most of the states have higher graduation rates than their public counterparts, 19 of the 24 states would see some gain in degree production (those with positive figures in these columns). Using the more conservative price response elasticity assumption (elasticity of -1.0), the degree gains would exceed 100 per year in 10 of these 19 states, and the number of such states would increase to 12 under the more expansive elasticity (-1.53) assump-tion. The annual degree gains would reach 300 or more under the more conservative elasticity assumption in Indiana, Minnesota, New York, Ohio, Pennsylvania, and Texas. Ohio would gain 886 degrees, Pennsylvania 739, Indiana 689, and New York 490.
If the more expansive response elasticity value (-1.53) is assumed, the annual degree output gains would exceed 1,000 per year in Ohio, Indiana, and Pennsylvania and would be greater than 500 in New York, Texas, and Minnesota. Finally, in the five states with lower degree output resulting from the sector enrollment shifts (because the matched public colleges and universities have higher graduation rates in those states), the effects would be small. Only in populous Florida would the reduced numbers of degrees produced after six years as a result of the sector shifts in student enrollment exceed 100 per year under either elasticity assumption. In short, most states would see an increase in degree productivity after shifting student enrollments via enhanced state student grants to private sector enroll-ees. These degree effects would be somewhat larger under the alternative $2,000 aid grant increase for students moved from the public sector to comparable (matched) PND colleges and universities, as is shown in Table 4.
The next columns of Table 3 show the effects of the hypothesized $1,000 grant increase and associated stu-dent enrollment shifts on various categories of state spending, under the two alternative price response elasticity assumptions. These estimated effects rely on the current levels of state grant spending per degree in each sector, as shown in columns nine and ten,
Because the matched private colleges and universities in most of the states have higher graduation rates than their public counterparts, 19 of the 24 states would see some gain in degree production.
17 COUNCIL OF INDEPENDENT COLLEGES
labeled “Average State Grant per Degree,” in Table 2. Columns nine and ten of Table 3 show the net effects of the hypothesized average grant increase for aided private sector students on total state spending on aid grants. In 21 of the 24 states, aid spending increases (i.e., positive numbers are shown in the table). The increase in aid spending is primarily a result of the cost of the enhanced grants, because the $1,000 grant must be applied each year the students are expected to be enrolled (see Table 2 columns five and six). These figures also are affected by the current average levels of state aid provided, per degree awarded, to the students in the two sectors. Thirteen of the 24 states already provide more aid per degree to students in the private sector, so adding more students to this sector saves less than in states currently providing more aid to public sector students.16 These additional aid costs are sub-stantial in many states. It is for this reason that the larger ($2,000) grant increase becomes very expensive for states, as can be seen in Table 4.
Columns 11 and 12 of Table 3, labeled “Appropriations Savings by Elasticity,” show assumed savings to states from reduced appropriations to public colleges and universities as a result of the students being induced to switch sectors. For these calculations we assume that states would reduce their appropriations to public colleges and universities by one half the per-student amount that they currently provide to these institu-tions for each student who moves out of the sector. This assumption reflects a fairly generous allowance for the fact that some institutional operating costs are fixed and cannot be altered proportionately when enroll-ments change. Even under this assumption, states that shift a substantial number of students to the private sector would save significant sums in funding pro-vided to affected public colleges and universities. Using the more conservative response elasticity assumption (column 11), these total estimated appropriations savings range from about $4 million in Oregon and Arkansas to nearly $200 million in New York and about $170 million in Ohio. Reduced annual appropriations to public institutions total more than $10 million in 20 of the 24 states and exceed $40 million in ten states.
The appropriations savings (shown in column 12) are more than half as large when the upper bound elasticity assumption is applied.
Finally, columns 13 and 14, labeled “Total Change in Spending by Elasticity,” show the total change in annual state spending, adding changes in grant aid and appropriations spending together. In these columns we show net savings to the state as negative values. Using the more conservative price response elasticity assumption (column 13), we find that 22 of the 24 states show net savings from moving the calculated students from the public to the private sector via the $1,000 aid grant increase. The overall annual net savings reach approximately $159 million in New York, $137 million in Ohio, $67 million in Texas, $61 million in Illinois, $52 million in Indiana, $39 million in Tennessee, $32 million in Georgia, $38 million in North Carolina, and $33 million in Florida. Annual savings of less than $30 million are estimated to occur in 13 more states. If we apply the more expansive response elasticity assumption (column 14), these annual state savings are enhanced by more than 50 percent.
On the other hand, in two states—California and South Carolina—we estimate that shifting students via increased aid to students who choose matched private nondoctoral institutions over public institutions would end up costing the state more than would be saved. This is primarily because these states have relatively gener-ous state student aid grant programs for private sector students. We assume that students who shift sectors would receive these sector average amounts of aid in
Using the more conservative response elasticity assumption, these total estimated appropriations savings range from about $4 million in Oregon and Arkansas to nearly $200 million in New York and about $170 million in Ohio.

TABLE 4
Results of Simulated $2,000 State Incentive Grants
Number of Institutions Used
Maximum Match Distance
Matching Method
Additional PND Students by Elasticity
Additional Degrees by Elasticity
State PND Publics 1 1.53 1 1.53
(1) (2) (3) (4) (5) (6) (7) (8)
Alabama* 8 14 0.3 Multiple 766 1172 82 125
Arkansas 4 3 0.2 Single 175 267 26 40
California* 24 29 0.3 Multiple 1654 2531 58 89
Florida* 15 11 0.3 Multiple 2915 4459 -153 -233
Georgia 11 4 0.2 Single 1447 2213 212 324
Illinois 23 3 0.2 Single 2925 4475 144 220
Indiana* 24 14 0.3 Multiple 2522 3858 728 1114
Kansas* 14 7 0.3 Multiple 590 903 -16 -25
Kentucky* 15 8 0.3 Multiple 2895 4429 149 227
Minnesota 12 5 0.2 Single 1609 2462 351 537
Missouri 11 4 0.2 Single 1161 1777 1 1
Nebraska* 7 6 0.3 Multiple 293 448 14 22
New Jersey 9 3 0.2 Single 1223 1872 -46 -70
New York 34 8 0.2 Single 6870 10511 517 790
North Carolina 15 4 0.2 Single 2468 3776 -49 -75
Ohio* 35 14 0.4 Multiple 8497 13001 917 1403
Oregon* 9 6 0.3 Multiple 272 417 57 88
Pennsylvania 50 10 0.2 Single 6812 10423 779 1191
South Carolina 12 4 0.2 Single 2060 3152 20 31
Tennessee* 18 9 0.3 Multiple 2181 3337 173 264
Texas 14 8 0.2 Single 2432 3721 393 601
Virginia 13 4 0.2 Single 1531 2342 -63 -96
Washington* 8 6 0.3 Multiple 549 840 61 94
West Virginia 7 3 0.2 Single 506 775 82 125
* These states, using “Multiple” matching, allowed multiple Public matches per PND institution, and with the exception of Ohio, used a match strength of 0.3 instead of 0.2. Ohio used a match strength of 0.4. Outlier institutions were omitted from the Washington and West Virginia analyses.
Source: Analysis by authors.
18 UTILIZING INDEPENDENT COLLEGES TO FULFILL STATES’ DEGREE ATTAINMENT GOALS
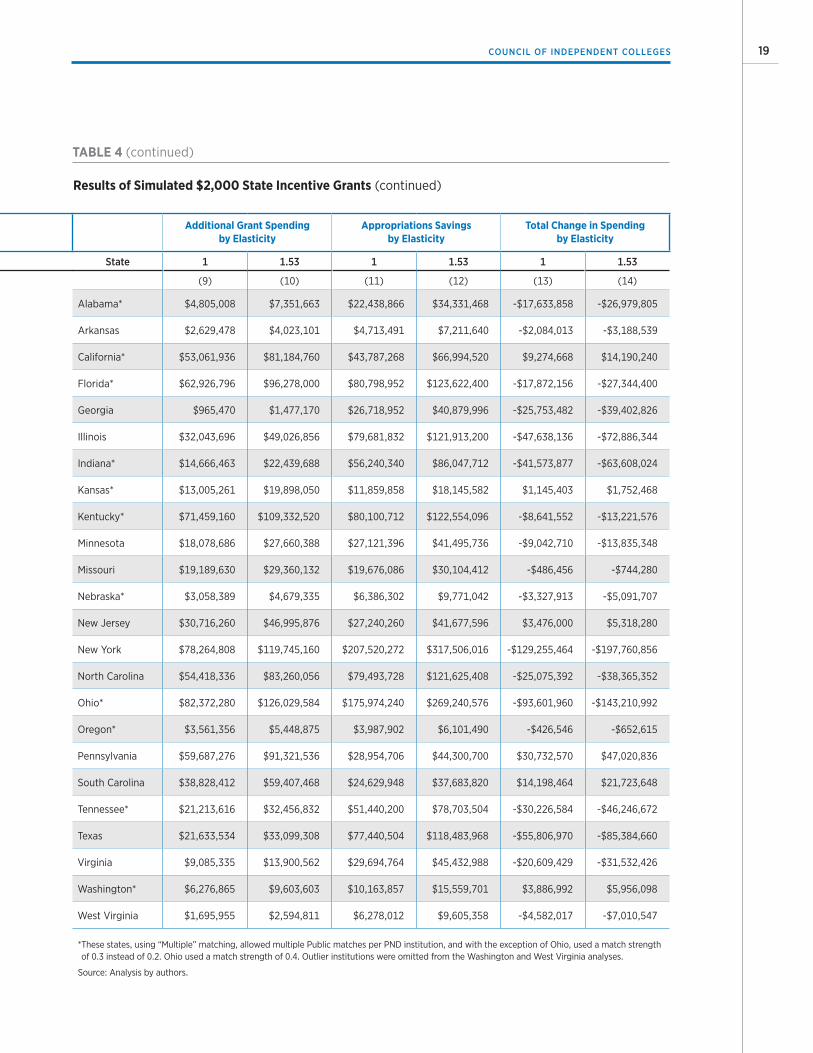
TABLE 4
Results of Simulated $2,000 State Incentive Grants
Number of Institutions Used
Maximum Match Distance
Matching Method
Additional PND Students by Elasticity
Additional Degrees by Elasticity
State PND Publics 1 1.53 1 1.53
(1) (2) (3) (4) (5) (6) (7) (8)
Alabama* 8 14 0.3 Multiple 766 1172 82 125
Arkansas 4 3 0.2 Single 175 267 26 40
California* 24 29 0.3 Multiple 1654 2531 58 89
Florida* 15 11 0.3 Multiple 2915 4459 -153 -233
Georgia 11 4 0.2 Single 1447 2213 212 324
Illinois 23 3 0.2 Single 2925 4475 144 220
Indiana* 24 14 0.3 Multiple 2522 3858 728 1114
Kansas* 14 7 0.3 Multiple 590 903 -16 -25
Kentucky* 15 8 0.3 Multiple 2895 4429 149 227
Minnesota 12 5 0.2 Single 1609 2462 351 537
Missouri 11 4 0.2 Single 1161 1777 1 1
Nebraska* 7 6 0.3 Multiple 293 448 14 22
New Jersey 9 3 0.2 Single 1223 1872 -46 -70
New York 34 8 0.2 Single 6870 10511 517 790
North Carolina 15 4 0.2 Single 2468 3776 -49 -75
Ohio* 35 14 0.4 Multiple 8497 13001 917 1403
Oregon* 9 6 0.3 Multiple 272 417 57 88
Pennsylvania 50 10 0.2 Single 6812 10423 779 1191
South Carolina 12 4 0.2 Single 2060 3152 20 31
Tennessee* 18 9 0.3 Multiple 2181 3337 173 264
Texas 14 8 0.2 Single 2432 3721 393 601
Virginia 13 4 0.2 Single 1531 2342 -63 -96
Washington* 8 6 0.3 Multiple 549 840 61 94
West Virginia 7 3 0.2 Single 506 775 82 125
* These states, using “Multiple” matching, allowed multiple Public matches per PND institution, and with the exception of Ohio, used a match strength of 0.3 instead of 0.2. Ohio used a match strength of 0.4. Outlier institutions were omitted from the Washington and West Virginia analyses.
Source: Analysis by authors.
TABLE 4 (continued)
Results of Simulated $2,000 State Incentive Grants (continued)
Additional Grant Spending by Elasticity
Appropriations Savings by Elasticity
Total Change in Spending by Elasticity
State 1 1.53 1 1.53 1 1.53
(9) (10) (11) (12) (13) (14)
Alabama* $4,805,008 $7,351,663 $22,438,866 $34,331,468 -$17,633,858 -$26,979,805
Arkansas $2,629,478 $4,023,101 $4,713,491 $7,211,640 -$2,084,013 -$3,188,539
California* $53,061,936 $81,184,760 $43,787,268 $66,994,520 $9,274,668 $14,190,240
Florida* $62,926,796 $96,278,000 $80,798,952 $123,622,400 -$17,872,156 -$27,344,400
Georgia $965,470 $1,477,170 $26,718,952 $40,879,996 -$25,753,482 -$39,402,826
Illinois $32,043,696 $49,026,856 $79,681,832 $121,913,200 -$47,638,136 -$72,886,344
Indiana* $14,666,463 $22,439,688 $56,240,340 $86,047,712 -$41,573,877 -$63,608,024
Kansas* $13,005,261 $19,898,050 $11,859,858 $18,145,582 $1,145,403 $1,752,468
Kentucky* $71,459,160 $109,332,520 $80,100,712 $122,554,096 -$8,641,552 -$13,221,576
Minnesota $18,078,686 $27,660,388 $27,121,396 $41,495,736 -$9,042,710 -$13,835,348
Missouri $19,189,630 $29,360,132 $19,676,086 $30,104,412 -$486,456 -$744,280
Nebraska* $3,058,389 $4,679,335 $6,386,302 $9,771,042 -$3,327,913 -$5,091,707
New Jersey $30,716,260 $46,995,876 $27,240,260 $41,677,596 $3,476,000 $5,318,280
New York $78,264,808 $119,745,160 $207,520,272 $317,506,016 -$129,255,464 -$197,760,856
North Carolina $54,418,336 $83,260,056 $79,493,728 $121,625,408 -$25,075,392 -$38,365,352
Ohio* $82,372,280 $126,029,584 $175,974,240 $269,240,576 -$93,601,960 -$143,210,992
Oregon* $3,561,356 $5,448,875 $3,987,902 $6,101,490 -$426,546 -$652,615
Pennsylvania $59,687,276 $91,321,536 $28,954,706 $44,300,700 $30,732,570 $47,020,836
South Carolina $38,828,412 $59,407,468 $24,629,948 $37,683,820 $14,198,464 $21,723,648
Tennessee* $21,213,616 $32,456,832 $51,440,200 $78,703,504 -$30,226,584 -$46,246,672
Texas $21,633,534 $33,099,308 $77,440,504 $118,483,968 -$55,806,970 -$85,384,660
Virginia $9,085,335 $13,900,562 $29,694,764 $45,432,988 -$20,609,429 -$31,532,426
Washington* $6,276,865 $9,603,603 $10,163,857 $15,559,701 $3,886,992 $5,956,098
West Virginia $1,695,955 $2,594,811 $6,278,012 $9,605,358 -$4,582,017 -$7,010,547
* These states, using “Multiple” matching, allowed multiple Public matches per PND institution, and with the exception of Ohio, used a match strength of 0.3 instead of 0.2. Ohio used a match strength of 0.4. Outlier institutions were omitted from the Washington and West Virginia analyses.
Source: Analysis by authors.
19 COUNCIL OF INDEPENDENT COLLEGES

20 UTILIZING INDEPENDENT COLLEGES TO FULFILL STATES’ DEGREE ATTAINMENT GOALS
addition to the hypothesized grant increase. Since we assume that the students shifted are already aid-eligible, this is the most logical conclusion. The net state costs in these states are higher under the more expansive elasticity assumption. This is because more students are thereby assumed to shift sectors and each student would cost the state more in increased aid than would be saved from reduced public sector appropriations.
Because of its increased cost, the hypothetical $2,000 grant increase for students shifting their enrollment plans from public to matched private colleges and universities depicted in Table 4 has less favorable fiscal results than the $1,000 increase. Built into the simu-lation model is the assumption that the larger grant boost (assuming the same price elasticity values as for the $1,000 grant increase) shifts more students across sectors. This additional shift of students is modest, however. The shift ranges from just 13 addi-tional students in Oregon and 15 in Nebraska under the assumption that elasticity is -1, up to over 500 additional students in larger states such as New York, Ohio, and Pennsylvania under the more expansive elasticity assumption (-1.53). In the large majority of states where the PND institutions’ graduation rates are higher, these higher rates eventually (after six years) lead to only a modest additional gain in bachelor’s degrees granted.17
These additional gains, however, generally come at a high price to state budgets because the larger grants of $2,000 must apply to all students who moved across sectors. Thus, state grant costs increase substantially
while additional savings on per-student appropriations to affected public universities are relatively modest. The overall fiscal result is smaller estimated net annual sav-ings to the states, by amounts ranging from $486,000 per year in Arkansas to nearly $130 million in New York (using the more conservative elasticity assump-tion). In the cases of California and South Carolina, where even the $1,000 grant increase was estimated to increase state costs very modestly, these costs would increase by several million dollars per year (by $9 mil-lion in California and $14 million in South Carolina). Another consideration is that the magnitude of state savings on appropriations to public institutions are more speculative than increased aid costs. Therefore, it seems wise to keep aid cost increases to a minimum. Hence, our main focus is on the effects of the smaller ($1,000) hypothetical increase in state grants to stu-dents who shift their enrollment plans to matched PND colleges and universities.
Estimated Capital Costs Avoided in High Growth StatesFor states forecasted by WICHE (Bransberger and Michelau 2016) to see rapid growth in high school grad-uate cohorts (Florida, Georgia, Kansas, North Carolina, South Carolina, and Texas), we also estimate the potential for state savings on capital expansion costs, as public institutions in those states may soon meet capacity constraints. Our thesis is that some portion of these costs could potentially be avoided by moving students to PND campuses. We calculate potential capital cost savings using estimates from the Higher Education Space Standards Study (HESSS) (Paulien and Associates 2011).18 We calculate the capital cost to accommodate an additional FTE student at a public nondoctoral college to be $81,775.19 This figure is a rough estimate, especially given that it was generated using information from the single state of Utah. We use this cost per FTE estimate in our assessment of capital expansion costs saved by the state, while also taking into account WICHE’s growth projections and the numbers of students our primary simulation models estimate would be shifted annually to the private sector by the $1,000 grant increase.20
Our main focus is on the effects of the smaller ($1,000) hypothetical increase in state grants to students who shift their enrollment plans to matched PND colleges and universities.
21 COUNCIL OF INDEPENDENT COLLEGES
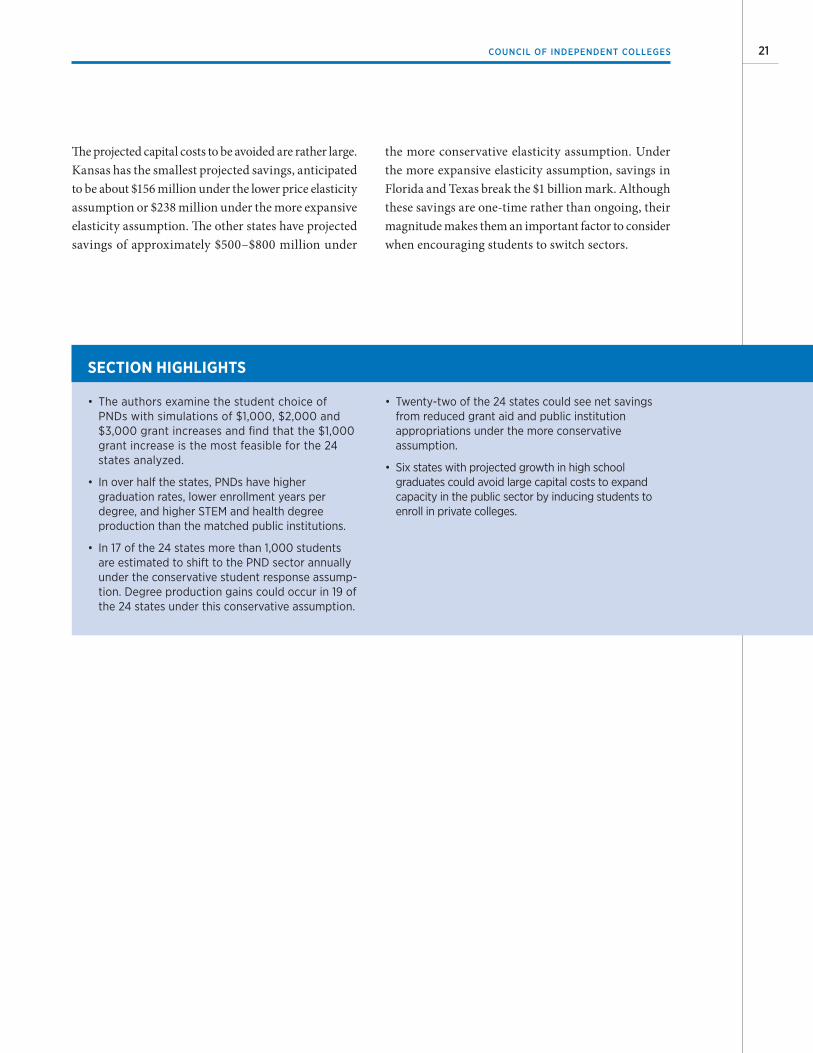
The projected capital costs to be avoided are rather large. Kansas has the smallest projected savings, anticipated to be about $156 million under the lower price elasticity assumption or $238 million under the more expansive elasticity assumption. The other states have projected savings of approximately $500–$800 million under
SECTION HIGHLIGHTS
• The authors examine the student choice of PNDs with simulations of $1,000, $2,000 and $3,000 grant increases and find that the $1,000 grant increase is the most feasible for the 24 states analyzed.
• In over half the states, PNDs have higher graduation rates, lower enrollment years per degree, and higher STEM and health degree production than the matched public institutions.
• In 17 of the 24 states more than 1,000 students are estimated to shift to the PND sector annually under the conservative student response assump-tion. Degree production gains could occur in 19 of the 24 states under this conservative assumption.
• Twenty-two of the 24 states could see net savings from reduced grant aid and public institution appropriations under the more conservative assumption.
• Six states with projected growth in high school graduates could avoid large capital costs to expand capacity in the public sector by inducing students to enroll in private colleges.
the more conservative elasticity assumption. Under the more expansive elasticity assumption, savings in Florida and Texas break the $1 billion mark. Although these savings are one-time rather than ongoing, their magnitude makes them an important factor to consider when encouraging students to switch sectors.
Simulation Results for Individual States
In this section, we describe the simulation results for each of the 24 states analyzed. The states are presented in alphabetical sequence. The reader will find the state-specific data discussed here in Table 2 (page 12) and
Table 3 (pages 14–15). Avoided capital expansion costs also are considered in the six high-growth states.
The analysis matches eight private colleges and univer-sities in Alabama to 14 public institutions using the
matching methods described above. In this case, multi-ple institutional matches were allowed, and the standard applied for maximum match distance was 0.3 standard deviations within the national distribution of private-pub-lic pairs. Basic comparisons show that the six-year graduation rate is 50.8 percent at these PND institutions compared with 40.1 percent at the matched public colleges and universities. The PND institutions require 6.5 enrolled student-years to produce one bachelor’s degree, compared with 7.6 student-years for the matched public colleges and universities. Of the bachelor’s degrees awarded by these colleges, STEM and health degrees make up 29.9 percent at the PND institutions and 25.7 percent at the matched publics. Average state grant funding per degree produced is $5,879 at the PND colleges and universities and $12,630 at the matched public institutions.
AlabamaThe study matched 8 PND colleges and universities with 14 public institutions.
PND colleges and universities (compared with matched publics):• Cost state $6,751 less in grant funding per degree• Achieve a graduation rate that is 10.7 percentage
points higher • Require 1.1 fewer student-years per degree • Produce 4.2 percentage points more health and
STEM degrees
Impact of $1,000 grant increase (based on the conservative student response assumption):• Total estimated annual savings to state: $20.9 million• Additional bachelor’s degrees produced
annually: 76
22
Offering an additional grant of $1,000 to each state res-ident student who selected a PND college or university rather than a matched public institution, assum-ing a price elasticity of demand of -1 (as previously explained), would lead an estimated 709 students to switch from public to PND colleges and universities among the matched institutions. With the currently higher state grant spending at public institutions in Alabama, this would translate into $169,870 of state savings in grant spending alone.
Using our standard assumption that enrollment shifts from public institutions lead to savings in state appropriations equal to half the current per-student level, the simulation also suggests substantial savings in annual appropriations to these public institutions of $20,766,112. In total, the grant and appropriations savings to the state would total $20,935,982. In addi-tion, as a result of the higher degree productivity in the PND colleges and universities, after six years the state would see an estimated increase of 76 bachelor’s degrees produced per year.
Using the more expansive price elasticity of response assumption (-1.53), an estimated 1,085 students would shift from public to private colleges and universi-ties; state grant savings would total about $259,901 annually; and savings on appropriations to public insti-tutions would equal $31,772,150. Summing these two sources brings total estimated annual state savings to $32,032,051. Additional bachelor’s degrees produced after six years are estimated at 116 annually under this elasticity assumption.
ArkansasThe study matched 4 PND colleges and universities with 3 public institutions.
PND colleges and universities (compared with matched publics):• Achieve a graduation rate that is 15 percentage
points higher • Require 1.4 fewer student-years per degree• Produce 4.4 percentage points fewer health and
STEM degrees
Impact of $1,000 grant increase (based on the conservative student response assumption):• Total estimated annual savings to state: $2.9 million • Additional bachelor’s degrees produced
annually: 23
We are able to link four Arkansas private colleges and universities to three public matched insti-
tutions using the matching methods described above. In this state all the matches are single, and the stan-dard applied for maximum match distance was 0.2 standard deviations within the national distribution of private-public pairs. For these small groups of matched institutions, the overall six-year gradu-ation rate is 46.7 percent at the PND colleges and universities and 31.7 percent at the matched publics. Overall, the PND colleges and universities require 6.7 student-years to produce one bachelor’s degree, com-pared with 8.1 student-years for the matched publics. Of these bachelor’s degrees, STEM and health degrees make up 11.9 percent at the PND institutions and 16.3 percent at the matched public colleges and universi-ties. Average current state grant funding per degree is $22,091 at the PND institutions and $20,499 at the matched public colleges and universities.
With an assumed price elasticity of demand of -1 (as explained above), a $1,000 grant increase offered to students choosing a PND college or university rather than a matched public institution would lead an esti-mated 155 additional students to choose PND colleges
23 COUNCIL OF INDEPENDENT COLLEGES
and universities. As mentioned, even without this additional grant spending, state grant spending at pri-vate colleges and universities is higher, so such grant spending would increase with the larger grant by an estimated $1,288,737. Using our standard assumption that enrollment shifts from public institutions lead to savings in state appropriations equal to half the current per student amount, we calculate that the state would save $4,178,272 in appropriations, for an overall annual net savings of $2,889,535. The number of degrees pro-duced annually would be expected to rise by 23 after six years, because of the higher degree productivity of the PND colleges and universities.
Applying the alternative, more expansive price elastic-ity of response assumption (-1.53) to the $1,000 grant increase, we estimate that 237 students would shift from public to private institutions, costing the state $1,971,768 in additional spending on grants but saving it $6,392,755 in reduced appropriations to the public institutions. The result would be a net state savings of $4,420,987 annually. In addition, after six years, an estimated 36 additional bachelor’s degrees would be granted annually due to the higher degree productivity of private nondoctoral colleges and universities.
CaliforniaThe study matched 24 PND colleges and universities with 29 public institutions.
PND colleges and universities (compared with matched publics):• Achieve a graduation rate
that is 3.5 percentage points higher
• Require 0.8 fewer student-years per degree• Produce 2.5 percentage points fewer health
and STEM degrees
Impact of $1,000 grant increase (based on the conservative student response assumption):• Total estimated annual savings to state: None,
due to fairly generous grants to students currently attending PNDs
• Additional bachelor’s degrees produced annually: 55
Using the matching methods described above, in California we allowed multiple institutional
matches where necessary and applied the criterion of 0.3 standard deviations within the national distribution of private-public pairs to determine adequate matches. Basic comparisons between the 24 PND colleges and universities and the 29 matched public institutions show that the six-year graduation rate is 59.5 percent at these PND colleges and universities and 56.0 percent at the matched publics. PND institutions require 5.4 years of education to produce one degree compared with 6.2 for the matched publics. STEM and health fields make up 19.1 percent of all bachelor’s degrees produced at the PND colleges and universities and 21.6 percent at the matched publics. Since California’s Cal Grants program is fairly generous to students attending independent col-leges, average state grant funding per degree produced is $40,928 at the PND colleges and universities compared with $19,687 at the matched publics.
Unsurprisingly, given that California’s state grant spending per degree at PND colleges and universities
24 UTILIZING INDEPENDENT COLLEGES TO FULFILL STATES’ DEGREE ATTAINMENT GOALS

is more than double the figure for the matched publics, a $1,000 grant increase targeted at students who select a private nondoctoral college or university rather than a matched public institution, with an assumed -1 price elasticity of demand response (per earlier explanation), would increase annual state grant spending substan-tially by approximately $41,890,520. This increase would be the result of an estimated 1,571 additional students enrolling in PND colleges and universities rather than public institutions. This would, in turn, lead to 55 more bachelor’s degrees produced six years later (and annually thereafter) as a result of the higher PND college and university degree production efficiency. Using our standard assumption that enrollment shifts from public institutions lead to savings in state appro-priations equal to half of the current appropriation per student, California could save an estimated $41,594,624 by moving 1,571 students from public institutions to private nondoctoral colleges and universities. These savings would not quite offset the increase in grant spending. Thus, we estimate that overall annual state spending would increase slightly, by $295,896 per year.
Applying the alternate price elasticity assumption (-1.53) yields an estimate that 2,404 students would shift from public to private colleges within the matched groups, leading to higher state grant spending by $64,092,496, which is largely offset by state savings on appropriations to public institutions of $63,639,772. Overall, the state would spend approximately $452,724 annually above the baseline figure but would after six years produce an estimated 84 additional bachelor’s degrees annually.
FloridaThe study matched 15 PND colleges and universities with 11 public institutions.
PND colleges and universities (compared with matched publics):• Have a graduation rate that is 5.2 percentage
points lower• Require 0.1 more student-years per degree• Produce 5.8 percentage points fewer health and
STEM degrees
Impact of $1,000 grant increase (based on the conservative student response assumption):• Total estimated annual savings to the state:
$33.1 million • Fewer bachelor’s degree produced annually: 140• Total saved on capital costs at public institutions
not needed to accommodate increased enrollment: $732.5 million
Using the matching methods described above, we allowed multiple institutional matches where
necessary in Florida and applied the criterion of 0.3 standard deviations within the national distribution of private-public pairs to determine adequate matches. The analysis matches 15 PND colleges and universities to 11 public institutions. The overall six-year gradu-ation rate is 48.2 percent at these PND colleges and universities and 53.4 percent at the set of matched public institutions. Combined with differences in time-to-degree, this means that these PND colleges and universities require 6.2 enrolled years of education to produce one degree, which is slightly more than the 6.1 years for the matched publics. Of the bachelor’s degrees produced by the matched sets of institutions, STEM or health degrees make up 17.0 percent at the PND institutions and 22.8 percent at the matched pub-lics. Average state grant funding per degree produced is $26,604 at PND colleges and universities and $17,451 at the matched public institutions.
25 COUNCIL OF INDEPENDENT COLLEGES
The simulation estimates that 2,682 students would switch to PND colleges and universities in response to a $1,000 grant increase targeted to incentivize stu-dents to choose a PND institution over a matched public, assuming that the price elasticity of demand is -1. After six years, this shift would lead to an even-tual decrease in annual degree production of 140 because of the matched public institutions’ slightly higher degree productivity. As a result of the higher state grant spending at PND colleges and universities combined with the relatively large number of students shifting sectors, the $1,000 additional grant to private college students would increase state grant spending by an estimated $41,219,868. This additional cost, however, would be offset by appropriations savings, given our standard assumption that half of current per-student appropriations to public institutions could be saved for each student moved. We estimate that the state would save $74,339,136 on public sector appro-priations, which, when combined with the additional grant costs, would yield overall net annual savings to the state of $33,119,268.
Applying the alternate, more expansive price elasticity of response assumption (-1.53) increases the estimate of students induced to switch from public to private colleges and universities to 4,103. Since the public institutions have slightly higher degree production efficiency, we estimate that bachelor’s degree produc-tion would be reduced by 215 degrees annually (after six years) as a result of these student sector shifts. State spending on grants would increase by $63,066,400 annually, but this amount would be offset by savings on reduced appropriations to public institutions of $113,738,880. Combining these two estimates leads to projected net annual savings to the state of more than $50 million ($50,672,480).
In addition to the estimated annual operating savings brought about by the hypothesized enhanced grant for students choosing a private nondoctoral college or university over a public one, Florida is projected to have substantial future growth in its high school cohort
according to WICHE (Bransberger and Michelau 2016), which could lead to campus capacity constraints. WICHE projects that Florida’s annual high school graduate cohort will increase by 9.5 percent between 2012–2013 and 2024–2025 (or by some 16,700 students). We assume that this percentage growth figure provides a reasonable basis for a conservative estimate of the additional demand for public higher education capac-ity. Thus, we also consider the potential for Florida to save on capital costs in the public higher education sector as a result of the hypothesized enhanced grant to students choosing a private college or university. Using our assumption that each student FTE shifted across sectors would save the state half of $81,775 (Florida’s assumed one-time capital cost per student for public sector expansion), savings would be $732,475,807 under our basic assumed price elasticity value of -1, or $1,120,551,405 under the alternate assumed elasticity of -1.53. Of course, if the state chose not to build a new campus or campuses, it might be able to expand public sector capacity at lower cost but with a presumably lower quality of service.
26 UTILIZING INDEPENDENT COLLEGES TO FULFILL STATES’ DEGREE ATTAINMENT GOALS
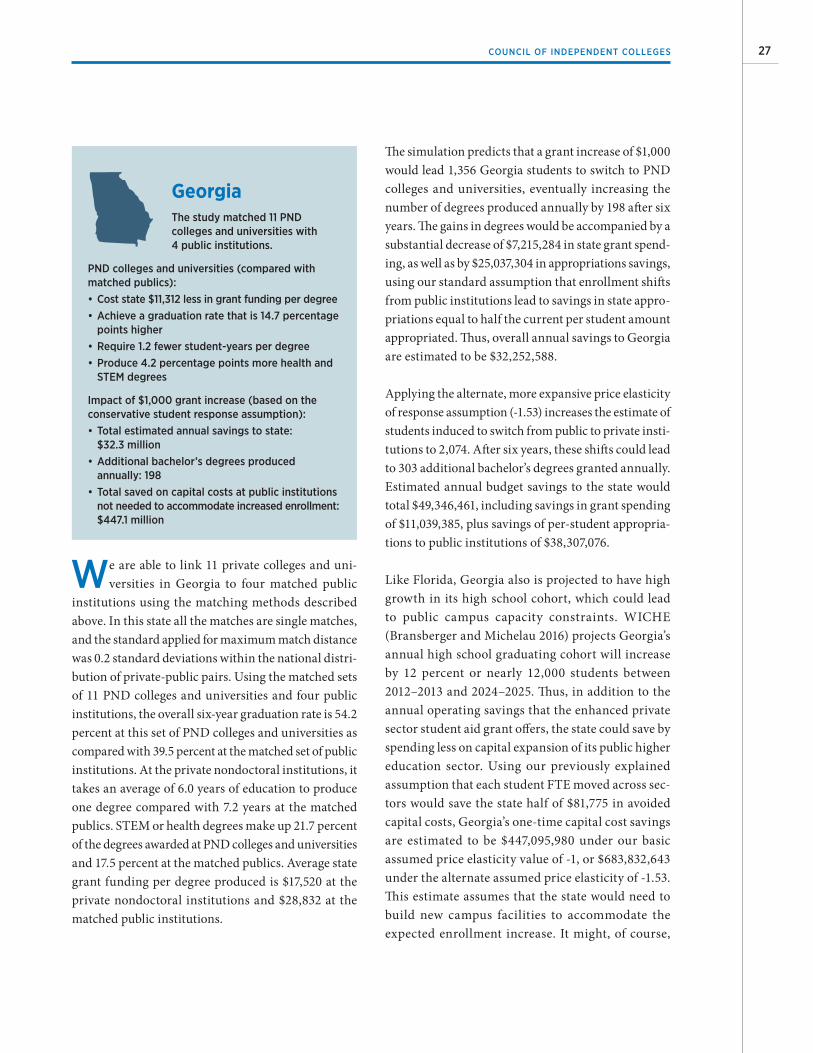
GeorgiaThe study matched 11 PND colleges and universities with 4 public institutions.
PND colleges and universities (compared with matched publics):• Cost state $11,312 less in grant funding per degree• Achieve a graduation rate that is 14.7 percentage
points higher• Require 1.2 fewer student-years per degree • Produce 4.2 percentage points more health and
STEM degrees
Impact of $1,000 grant increase (based on the conservative student response assumption):• Total estimated annual savings to state:
$32.3 million • Additional bachelor’s degrees produced
annually: 198 • Total saved on capital costs at public institutions
not needed to accommodate increased enrollment: $447.1 million
We are able to link 11 private colleges and uni-versities in Georgia to four matched public
institutions using the matching methods described above. In this state all the matches are single matches, and the standard applied for maximum match distance was 0.2 standard deviations within the national distri-bution of private-public pairs. Using the matched sets of 11 PND colleges and universities and four public institutions, the overall six-year graduation rate is 54.2 percent at this set of PND colleges and universities as compared with 39.5 percent at the matched set of public institutions. At the private nondoctoral institutions, it takes an average of 6.0 years of education to produce one degree compared with 7.2 years at the matched publics. STEM or health degrees make up 21.7 percent of the degrees awarded at PND colleges and universities and 17.5 percent at the matched publics. Average state grant funding per degree produced is $17,520 at the private nondoctoral institutions and $28,832 at the matched public institutions.
The simulation predicts that a grant increase of $1,000 would lead 1,356 Georgia students to switch to PND colleges and universities, eventually increasing the number of degrees produced annually by 198 after six years. The gains in degrees would be accompanied by a substantial decrease of $7,215,284 in state grant spend-ing, as well as by $25,037,304 in appropriations savings, using our standard assumption that enrollment shifts from public institutions lead to savings in state appro-priations equal to half the current per student amount appropriated. Thus, overall annual savings to Georgia are estimated to be $32,252,588.
Applying the alternate, more expansive price elasticity of response assumption (-1.53) increases the estimate of students induced to switch from public to private insti-tutions to 2,074. After six years, these shifts could lead to 303 additional bachelor’s degrees granted annually. Estimated annual budget savings to the state would total $49,346,461, including savings in grant spending of $11,039,385, plus savings of per-student appropria-tions to public institutions of $38,307,076.
Like Florida, Georgia also is projected to have high growth in its high school cohort, which could lead to public campus capacity constraints. WICHE (Bransberger and Michelau 2016) projects Georgia’s annual high school graduating cohort will increase by 12 percent or nearly 12,000 students between 2012–2013 and 2024–2025. Thus, in addition to the annual operating savings that the enhanced private sector student aid grant offers, the state could save by spending less on capital expansion of its public higher education sector. Using our previously explained assumption that each student FTE moved across sec-tors would save the state half of $81,775 in avoided capital costs, Georgia’s one-time capital cost savings are estimated to be $447,095,980 under our basic assumed price elasticity value of -1, or $683,832,643 under the alternate assumed price elasticity of -1.53. This estimate assumes that the state would need to build new campus facilities to accommodate the expected enrollment increase. It might, of course,
27 COUNCIL OF INDEPENDENT COLLEGES

choose less costly options (with associated lower ser-vice quality), but some expansion to accommodate so many additional students seems inevitable.
IllinoisThe study matched 23 PND colleges and universities with 3 public institutions.
PND colleges and universities (compared with matched publics):• Cost state $568 less in grant funding per degree• Achieve a graduation rate that is 4.9 percentage
points higher • Require 0.3 fewer student-years per degree • Produce 7.3 percentage points more health
and STEM degrees
Impact of $1,000 grant increase (based on the conservative student response assumption):• Total estimated annual savings to state:
$60.7 million • Additional bachelor’s degrees produced
annually: 136
In Illinois we matched 23 private colleges and uni-versities to three public institutions using the
matching methods described above. In this state all the matches are single matches, and the standard applied for maximum distance was 0.2 standard deviations within the national distribution of private-public pairs. Comparing these two groups of institutions, the six-year graduation rate is 58.3 percent at the pri-vate nondoctoral institutions and 53.4 percent at the matched public colleges and universities. Accordingly, while the public institutions require an average of 6.1 years of education to produce a degree, the matched PND colleges and universities take only 5.8 years. Of the bachelor’s degrees awarded, STEM or health degrees make up 23.8 percent of the bachelor’s degrees at the PND colleges and universities and 16.5 percent of the bachelor’s degrees at the matched public institutions. Average state grant funding per degree produced is very
similar: $25,088 at the PND colleges and universities and $25,656 at the matched public institutions. Taking these facts into account, we perform a simulation using a price elasticity of demand of -1 to predict the response to a $1,000 increase in state grants providing an incen-tive to students to switch their enrollment choice from one of the public institutions to a private nondoctoral institution in the matched set.
Our simulation estimates that an additional $1,000 grant would lead 2,755 Illinois students to switch to PND colleges and universities who otherwise would have attended one of the matched public institutions, eventually increasing annual degree production by 136 after six years. The increase in annual grants for private nondoctoral college and university students would push the average state grant aid per degree at PND colleges and universities slightly above that for public institutions, which would lead to an estimated increase of $14,308,756 in annual state grant spending. Using our standard assumption that half of per-stu-dent appropriations could be saved for every student shifting from the public to the private sector, the pro-jected increase in grant spending would be offset by $75,052,976 in appropriations savings each year for an overall net annual savings of $60,744,220.
As an alternative scenario, we also apply a stronger assumed response to the enhanced grant for private sector enrollees, using an elasticity of -1.53. Under this alternate assumption, 4,215 students who would other-wise have attended the matched public institutions switch to PND colleges and universities, eventually increasing annual degree production by 207 in six years. The anticipated effect on the state budget is that the grant would lead to annual net savings of $92,938,652, made up of $21,892,396 in additional grant spending, offset by $114,831,048 in appropriations savings.
28 UTILIZING INDEPENDENT COLLEGES TO FULFILL STATES’ DEGREE ATTAINMENT GOALS

IndianaThe study matched 24 PND colleges and universities with 14 public institutions.
PND colleges and universities (compared with matched publics):• Cost state $4,534 less in grant funding per degree• Achieve a graduation rate that is 28.8 percentage
points higher• Require 3.4 fewer student-years per degree • Produce 2.4 percentage points fewer health and
STEM degrees
Impact of $1,000 grant increase (based on the conservative student response assumption):• Total estimated annual savings to state:
$51.6 million • Additional bachelor’s degrees produced
annually: 689
In Indiana we allowed multiple institutional matches where necessary and applied 0.3 standard deviations
within the national distribution of private-public pairs to determine adequate matches. This allowed us to match 24 PND colleges and universities with 14 similar public institutions. A comparison of these two groups reveals a large difference in graduation rates—63.8 per-cent compared with 35.0 percent in favor of the private nondoctoral institutions. This result translates into very different levels of efficiency in degree production. At these PND institutions, it takes 5.2 years of educa-tion to produce one degree, compared with 8.6 years at the matched public colleges and universities. STEM or health degrees represent 23.3 percent of bachelor’s degrees at the PND colleges and universities compared with 25.7 percent at the matched public institutions. The average state grant funding per degree produced is $26,658 at this set of PND colleges and universities and $31,192 at the matched public institutions.
Our simulation of the response to an additional $1,000 state aid grant incentivizing students to switch their enrollment choice to a PND college or university from a matched public institution assumes a demand elasticity
of -1. Applying this assumption, we estimate that such a grant would lead 2,384 students to switch their college choice from a public institution to a matched private nondoctoral college or university.
Although the state currently spends less on student grants at PND colleges and universities than at the matched public institutions, the figures are similar enough that an additional $1,000 for each year of college at private nondoctoral institutions would increase overall annual state grant spending mod-estly, by an estimated $1,527,751. Under our standard assumption that the state could save half of per-student appropriations to public institutions, there would be $53,170,812 in appropriations savings, for overall net savings to the state of $51,643,061. In addition, we esti-mate that the private nondoctoral institutions’ higher degree production efficiency would mean an increase in annual degree production of 689 within six years.
Applying the alternate, more expansive price elastic-ity of response assumption (-1.53) would increase the estimate of Hoosier students induced to switch from public to private colleges and universities to 3,647. This would lead to a modest increase in state grant spend-ing of $2,337,459, but it also would save a much larger amount, $81,351,344, in assumed per-student appropri-ations to public colleges and universities. Netting these two amounts leads to overall projected state savings of $79,013,885 annually. In addition, after six years, the more degree-efficient private nondoctoral institutions would be expected to graduate 1,054 more bachelor’s candidates annually.
29 COUNCIL OF INDEPENDENT COLLEGES

KansasThe study matched 14 PND colleges and universities with 7 public institutions.
PND colleges and universities (compared with matched publics):• Have a graduation rate that is 2.8 percentage
points lower• Require the same number of student-years
per degree• Produce 1.9 percentage points fewer health
and STEM degrees
Impact of $1,000 grant increase (based on the conservative student response assumption):• Total estimated annual savings to state: $2.4 million • Fewer bachelor’s degrees produced annually: 15• Total saved on capital costs at public institutions
not needed to accommodate increased enroll-ment: $155.7 million
In Kansas we allowed multiple institutional matches where necessary and applied the criterion of 0.3
standard deviations within the national distribution of private-public pairs to determine adequate matches. This allowed us to match 14 PND colleges and univer-sities with seven similar public institutions. On degree productivity, these two groups of institutions are fairly similar, with six-year graduation rates of 46.2 percent at the private nondoctoral institutions and 49.0 percent at the matched public institutions. Both groups of colleges and universities require an average of 6.3 student-years of education to produce one bachelor’s degree. STEM or health degrees are 22.8 percent of the degrees at the private nondoctoral institutions and 24.7 percent of the degrees at the matched public colleges. PND college and university students receive larger amounts of state grant funding. Average state grant funding per degree produced is $17,009 at the PND colleges and univer-sities and $7,474 at the matched public institutions.
We simulate the response to an additional $1,000 state grant incentivizing students to shift their enrollment choices from public to PND colleges and universities,
assuming an elasticity of demand of -1. Our simula-tion model predicts that such a grant would lead 546 students to switch to a PND college or university who would otherwise have enrolled at one of the matched public institutions. Due to the slightly higher degree production efficiency of the public institutions in the matched set, this shift would reduce the annual number of degrees produced by 15 after six years.
Since grant spending at private nondoctoral institutions is already higher, the new aid policy would increase total state grant spending by $8,622,571 per year. But under our standard assumption that the state could save half of per-student appropriations to public institutions for each student shifted across sectors, Kansas should be able to save $10,976,922 in annual appropriations to the affected colleges. Combining these two figures produces a total estimated net annual savings of $2,354,351.
Applying the alternate, more expansive price elasticity assumption (-1.53) in response to the hypothesized grant would increase the estimate of students that move to the private sector to 836. Because of the small advantage of the matched public institutions in degree productivity, this would eventually lead to a slight decrease in annual bachelor’s degree production of 23 awards after six years. We estimate that the state would spend an additional $13,192,534 on student grants but would save more, $16,794,690, on appropriations to public institutions. Combining these two figures pro-duces a net annual state savings estimate of $3,602,156.
In addition to the annual operating savings brought about by the enhanced grant for resident students choosing private nondoctoral institutions over public institutions, Kansas also may be able to save on capital costs by moving some students to the private sector. As a state with high projected growth in its high school cohort, Kansas may run into capacity constraints in its public institutions and have to build if it does not take advantage of available private sector capacity. According to WICHE’s (Bransberger and Michelau 2016) projections, Kansas can expect a 10.7 percent growth in its annual high school graduate cohort from
30 UTILIZING INDEPENDENT COLLEGES TO FULFILL STATES’ DEGREE ATTAINMENT GOALS

2012–2013 to 2024–2025. Thus, we consider the poten-tial for the state to save on public sector capital costs as a result of the hypothesized grant increase for targeted private sector enrollees. As previously explained, we assume that each student FTE moved to the private sector would save the state half of $81,775 in per-student capital expansion costs. Under this assumption, Kansas would reap one-time capital cost savings estimated to be $155,693,818 under our basic response elasticity assumption of -1, or $238,388,337 under the alternate assumed elasticity of -1.53.
KentuckyThe study matched 15 PND
colleges and universities with 8 public institutions.
PND colleges and universities (compared with matched publics):• Achieve a graduation rate that is 5.1 percentage
points higher • Require 0.6 fewer student-years per degree • Produce 0.5 percentage points more health and
STEM degrees
Impact of $1,000 grant increase (based on the conservative student response assumption):• Total estimated annual savings to the state:
$24.9 million • Additional bachelor’s degrees produced
annually: 136
Using the matching methods described above, in the state of Kentucky we allowed multiple institutional
matches where necessary and applied the criterion of 0.3 standard deviations within the national distribution of private-public pairs to determine adequate matches. This allowed us to match 15 private nondoctoral col-leges and universities to eight public institutions. At these PND institutions, the six-year graduation rate is 47.9 percent, and it takes 6.4 enrolled years of education to produce one degree, as opposed to the matched public institutions, where the graduation rate is 42.8 percent and it takes 7.0 enrolled student-years to
produce one bachelor’s degree. STEM or health degrees comprise 22.9 percent of the degrees awarded by PND institutions and 22.4 percent of the degrees awarded by the matched public colleges and universities. Average state grant funding per degree produced is $25,822 at the PND institutions and $13,929 at the matched public institutions.
Assuming a demand elasticity of -1, we simulate that an additional $1,000 state grant that gives students the incentive to shift their enrollment choice to a private nondoctoral institution would lead 2,658 students to switch sectors. After six years, owing to the higher degree production efficiency of the matched PND insti-tutions, an estimated 136 additional bachelor’s degrees would be produced in the state each year.
As a result of the students switching sectors, state spending on student aid grants would increase by an estimated $48,621,484 per year because private sector students receive more state grant aid. But using our standard assumption that half of per-student appro-priations could be saved for each student moved from the state-supported sector, this shift suggests savings in state appropriations of $73,563,152. In total, the state could annually save $24,941,668 with the pro-posed incentive.
Applying the alternate, more expansive price elasticity assumption (-1.53) in response to the hypothesized grant increases the estimate of students moved to the private sector to 4,067. Since the PND institutions are more efficient in producing bachelor’s degrees per student enrolled, we estimate additional annual degree output at 209 after six years. Additional state spending on student aid would come to $74,390,872 per year, but savings on per-student appropriations to public colleges and universities would be larger at $112,551,616. Combining these two figures produces an estimated total annual state savings of $38,160,744.
31 COUNCIL OF INDEPENDENT COLLEGES

MinnesotaThe study matched 12 PND colleges and universities with 5 public institutions.
PND colleges and universities (compared with matched publics):• Achieve a graduation rate that is 21.8 percentage
points higher • Require 1.5 fewer student-years per degree • Produce 1.1 percentage points more health and
STEM degrees
Impact of $1,000 grant increase (based on the conservative student response assumption):• Total estimated annual savings to the state:
$16.0 million • Additional bachelor’s degrees produced
annually: 331
We match 12 private colleges and universities to five public institutions in Minnesota using
the matching methods described above. In this state all the matches are single matches, and the standard applied for maximum distance was 0.2 standard devia-tions within the national distribution of private-public pairs. There are marked differences between these two groups of colleges. Although state grant funding levels are fairly similar—$17,862 per bachelor’s degree at the private nondoctoral institutions and $16,510 at the matched set of public institutions—the six-year graduation rate is much higher (68.9 percent compared with 47.1 percent) and the degree production efficiency is much better (requiring 4.9 student-years to produce one degree compared with 6.4 years) at the PND col-leges and universities. The STEM/health degree share is slightly higher in the private nondoctoral institutions at 25.6 percent compared with 24.5 percent.
We simulate the impact of an additional $1,000 state grant encouraging students to enroll at one of these PND colleges and universities rather than one of the matched set of public institutions, assuming a demand elasticity of -1. Our simulation model projects that 1,517 students would switch sectors in response to such an
enhanced grant incentive. While this would lead to a $9,550,045 increase in annual state grant spending, it also could increase annual degree production by 331 after six years. Using our standard assumption that half of per-student appropriations could be saved for each student moved, however, the increase in grant spending would be offset by savings in appropriations to the public institutions of $25,575,860, for an overall annual savings to the state of $16,025,815.
Applying the alternate, more expansive price elasticity assumption (-1.53) in response to the hypothesized additional grant increases the estimate of students moved from the public to the private higher educa-tion sector to 2,322. This implies an increase in annual bachelor’s degree production (after six years) estimated at 507 because of the higher degree production effi-ciency of the private nondoctoral institutions. State spending on student aid would increase annually by an estimated $14,611,568, but savings in per-student appropriations to public colleges and universities would be larger, at $39,131,064. Combining these two figures leads to an estimate of net annual savings to the state of $24,519,496.
32 UTILIZING INDEPENDENT COLLEGES TO FULFILL STATES’ DEGREE ATTAINMENT GOALS

MissouriThe study matched 11 PND colleges and universities with 4 public institutions.
PND colleges and universities (compared with matched publics):• Achieve the same graduation rate • Require similar student-years per degree• Produce 4.5 percentage points more health and
STEM degrees
Impact of $1,000 grant increase (based on the conservative student response assumption):• Total estimated annual savings to the state:
$6.8 million • No change expected in bachelor’s degree
production
In Missouri we are able to match 11 private non-doctoral colleges and universities to four public
institutions using the matching methods described earlier. In this state all the matches are single, and the standard applied for maximum match distance was 0.2 standard deviations within the national distribu-tion of private-public pairs. Comparing these sets of colleges, we find that the six-year graduation rate is 51.3 percent in both sectors, and it takes almost exactly six years of education to produce one degree at both the PND colleges and universities and the matched public institutions. STEM or health degrees make up 22.1 percent of bachelor’s degrees at PND institutions and 17.6 percent of bachelor’s degrees at the matched public colleges and universities. Average state grant funding per bachelor’s degree produced is $14,989 at these PND colleges and universities and $10,446 at the matched public institutions. These facts drive the results of our simulation of a $1,000 state grant enhancement that provides students an incentive to select private non-doctoral institutions over matched public colleges and universities, assuming a demand elasticity of -1.
Our simulation model estimates that this additional state incentive grant would cause 1,056 students to switch to PND colleges and universities, leading to an
annual increase in state grant spending of $11,123,074. This increase in grant spending would be offset under our standard assumption that half of per-student appropriations to public institutions could be saved for each student moved. Under this assumption, the state would save $17,890,658 on appropriations to the affected public institutions, resulting in a total annual savings to the state of $6,767,584 when these two figures are combined. Since the two groups of matched insti-tutions are so similar in degree production efficiency, there would be essentially no change in expected annual bachelor’s degree output from the policy change.
Applying the additional $1,000 grant under the more expansive price elasticity assumption (-1.53) increases the estimate of students moved from the public to the private higher education sector to 1,616. Again, this would produce no significant change in degree production because of the nearly identical degree production efficiency of the two matched sectors in Missouri. Additional state spending on student grants as a result of the policy change is estimated at $17,018,304 annually, but this would be offset by savings in appropriations to public institutions of $27,372,706. Combining these two figures produces an annual state savings estimate of $10,354,402.
33 COUNCIL OF INDEPENDENT COLLEGES
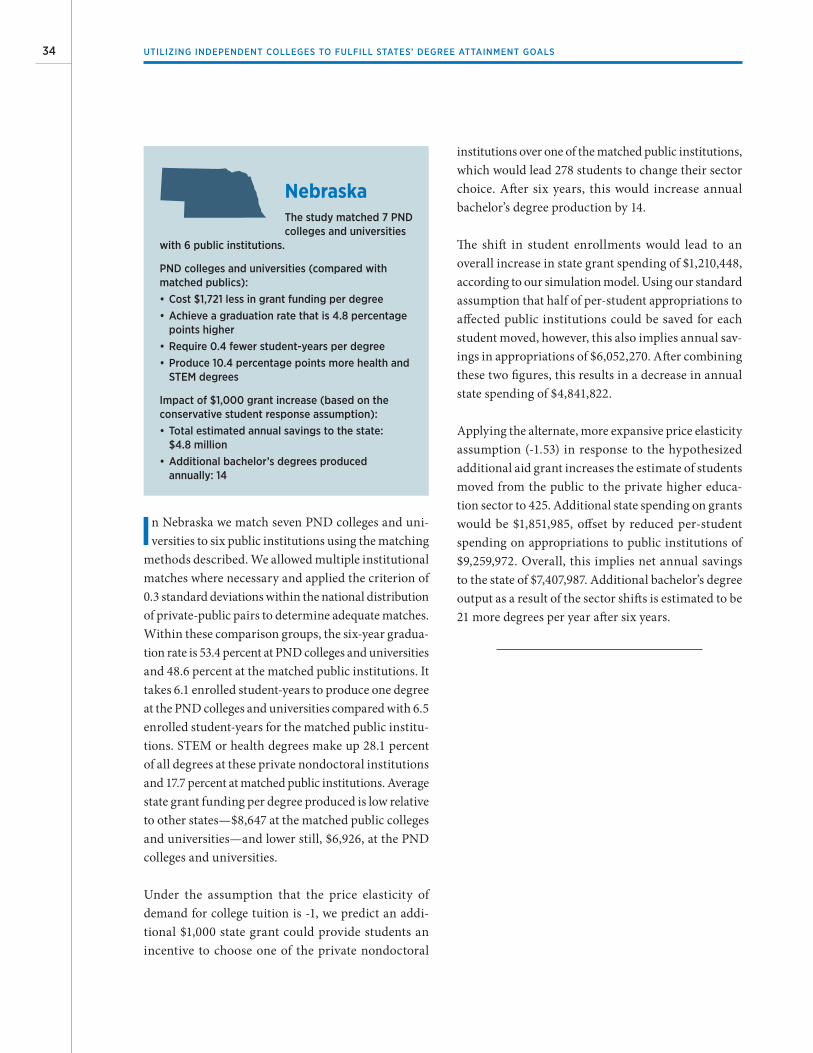
NebraskaThe study matched 7 PND colleges and universities
with 6 public institutions.
PND colleges and universities (compared with matched publics):• Cost $1,721 less in grant funding per degree• Achieve a graduation rate that is 4.8 percentage
points higher • Require 0.4 fewer student-years per degree • Produce 10.4 percentage points more health and
STEM degrees
Impact of $1,000 grant increase (based on the conservative student response assumption):• Total estimated annual savings to the state:
$4.8 million• Additional bachelor’s degrees produced
annually: 14
In Nebraska we match seven PND colleges and uni-versities to six public institutions using the matching
methods described. We allowed multiple institutional matches where necessary and applied the criterion of 0.3 standard deviations within the national distribution of private-public pairs to determine adequate matches. Within these comparison groups, the six-year gradua-tion rate is 53.4 percent at PND colleges and universities and 48.6 percent at the matched public institutions. It takes 6.1 enrolled student-years to produce one degree at the PND colleges and universities compared with 6.5 enrolled student-years for the matched public institu-tions. STEM or health degrees make up 28.1 percent of all degrees at these private nondoctoral institutions and 17.7 percent at matched public institutions. Average state grant funding per degree produced is low relative to other states—$8,647 at the matched public colleges and universities—and lower still, $6,926, at the PND colleges and universities.
Under the assumption that the price elasticity of demand for college tuition is -1, we predict an addi-tional $1,000 state grant could provide students an incentive to choose one of the private nondoctoral
institutions over one of the matched public institutions, which would lead 278 students to change their sector choice. After six years, this would increase annual bachelor’s degree production by 14.
The shift in student enrollments would lead to an overall increase in state grant spending of $1,210,448, according to our simulation model. Using our standard assumption that half of per-student appropriations to affected public institutions could be saved for each student moved, however, this also implies annual sav-ings in appropriations of $6,052,270. After combining these two figures, this results in a decrease in annual state spending of $4,841,822.
Applying the alternate, more expansive price elasticity assumption (-1.53) in response to the hypothesized additional aid grant increases the estimate of students moved from the public to the private higher educa-tion sector to 425. Additional state spending on grants would be $1,851,985, offset by reduced per-student spending on appropriations to public institutions of $9,259,972. Overall, this implies net annual savings to the state of $7,407,987. Additional bachelor’s degree output as a result of the sector shifts is estimated to be 21 more degrees per year after six years.
34 UTILIZING INDEPENDENT COLLEGES TO FULFILL STATES’ DEGREE ATTAINMENT GOALS

New JerseyThe study matched 9 PND colleges and universities with 3 public institutions.
PND colleges and universities (compared with matched publics):• Have a graduation rate that is 4.0 percentage
points lower• Require 0.1 fewer student-years per degree • Produce 1.1 percentage points more health and
STEM degrees
Impact of $1,000 grant increase (based on the conservative student response assumption):• Total estimated annual savings to the state:
$3.3 million• Fewer bachelor’s degrees produced annually: 43
Our analysis of New Jersey compares a set of nine PND colleges and universities to a matched set
of three public institutions based on the matching methods described earlier. In this state all the matches are single matches, and the standard applied for max-imum match distance was 0.2 standard deviations within the national distribution of private-public pairs. At the PND colleges and universities, the over-all six-year graduation rate is 54 percent; it takes on average 5.8 enrolled student-years to produce one degree; and 17.2 percent of these degrees are in STEM or health fields. At the matched public institutions, the six-year graduation rate is 58 percent; it takes 5.9 student-years to produce a degree; and 16.1 percent of those degrees are in STEM or health fields. On these metrics, the two sector sets are fairly similar. State grant support is higher at the PND colleges and uni-versities—at $43,063 per degree produced compared with $29,464 at the matched public institutions.
We simulate the student response to an additional $1,000 state grant incentivizing students to choose one of the private nondoctoral institutions instead of a matched public institution, assuming that the price elasticity of demand is -1. We expect that 1,145 students would take advantage of such a grant
incentive to make their choice a PND college or uni-versity. Because degree production efficiency is slightly higher at the matched public institutions, the state’s annual degree production would decrease after six years by 43 baccalaureate degrees.
Since grant costs are already higher at PND colleges and universities, the new, larger grant amount for pri-vate sector students would increase annual state grant spending by $22,152,730. This additional expenditure would be offset, using our standard assumption that half of per-student appropriations could be saved for each student moved. These savings come to $25,487,164 annually. Thus, overall state spending would decrease by an estimated $3,334,434 each year as a result of the policy change.
The more expansive price elasticity assumption (-1.53) would increase the response to the $1,000 grants, which could lead 1,751 students to move from the public to the private higher education sector. Again, owing to the slightly higher degree production efficiency of the matched public institutions, bach-elor’s degree production would annually decrease by 66 awards after six years. The state would spend $33,893,680 more on grant aid to students, but this would be offset by savings in per-student appropria-tions to public institutions of $38,995,360. Thus, we estimate that New Jersey would annually save a total of $5,101,680 under this scenario.
35 COUNCIL OF INDEPENDENT COLLEGES

New YorkThe study matched 34 PND colleges and universities with 8 public institutions.
PND colleges and universities (compared with matched publics):• Achieve a graduation rate that is 7.5 percentage
points higher• Require 0.6 fewer student-years per degree • Produce a similar amount of health and
STEM degrees
Impact of $1,000 grant increase (based on the conservative student response assumption):• Total estimated annual savings to the state:
$159.0 million• Additional bachelor’s degrees produced
annually: 490
We match 34 private colleges and universities in New York to eight public institutions using the
matching methods described above. All the matches in this state are single matches, and the standard applied for maximum match distance was 0.2 standard devia-tions within the national distribution of private-public pairs. The PND colleges and universities in the matched sample have an overall six-year graduation rate of 56.2 percent, and it takes 5.6 enrolled student-years to pro-duce one bachelor’s degree, 24.8 percent of which are in STEM or health fields. The matched public institutions have a six-year graduation rate of 48.7 percent, and it takes on average 6.2 years to earn a degree, 25.4 percent of which are in STEM or health fields. Average state grant funding per degree produced is $15,228 at PND colleges and universities and a very similar $15,054 at matched public institutions. These basic facts point toward the result of our grant simulation.
With an assumed price elasticity of demand of -1, we simulate the response to an additional $1,000 state grant leading New York students to shift their enrollment choice from these public institutions to the matched private nondoctoral institutions. Our simu-lation model predicts that 6,512 more students would
choose a PND institution than would be the case with-out the grant increase. This substantial movement of students to PND colleges and universities, with each receiving the new grant amount, would increase state grant spending by $37,660,340. But combining our standard assumption that half of per-student appropriations to public institutions could be saved for each student moved from this sector to the private sector leads to annual savings in appropriations of $196,702,608. In total, the policy change could save the state $159,042,268 annually while increasing annual degree production by 490 after six years due to the private nondoctoral institutions’ greater degree production efficiency.
The more expansive price elasticity assumption (-1.53) related to the $1,000 grant increases the estimate of students moved from the public to the private higher education sector to 9,963. This shift implies additional annual state grant spending of $57,620,320, which is offset by assumed savings in state appropriations to public institutions of $300,954,976. Combining these two figures produces a net overall state savings esti-mate of $243,334,656. In addition, approximately 749 more bachelor’s degrees would be produced annually after six years.
36 UTILIZING INDEPENDENT COLLEGES TO FULFILL STATES’ DEGREE ATTAINMENT GOALS
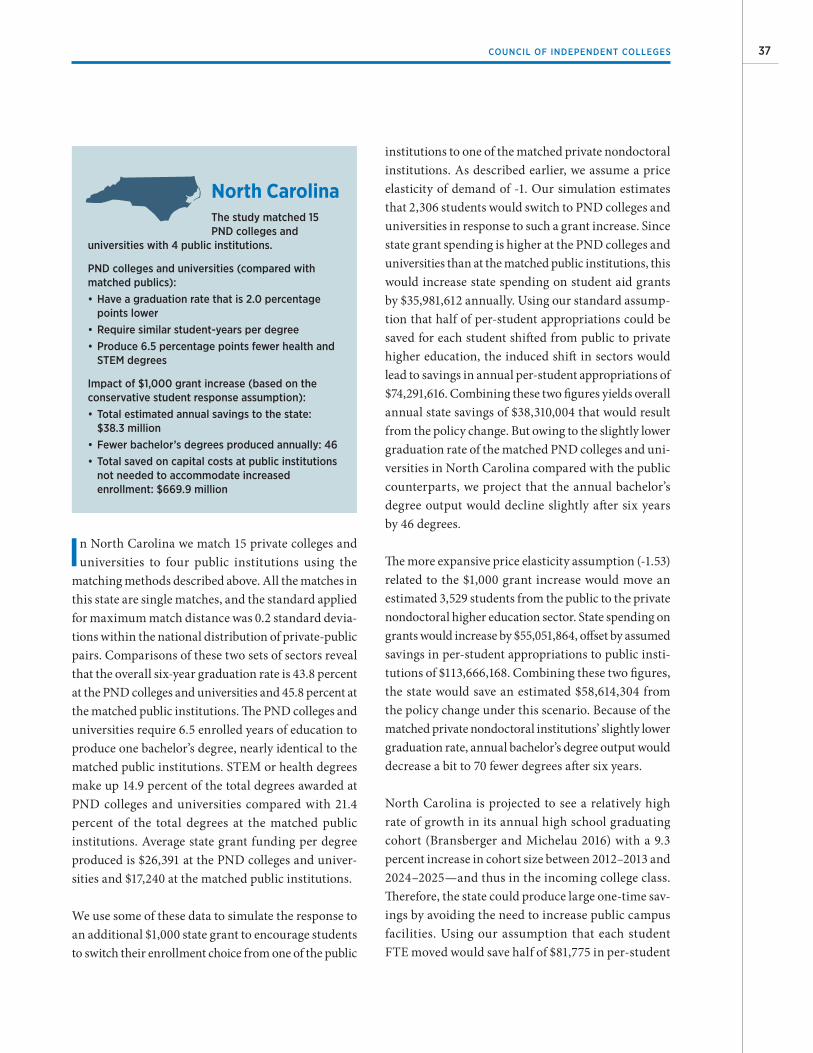
North CarolinaThe study matched 15 PND colleges and
universities with 4 public institutions.
PND colleges and universities (compared with matched publics):• Have a graduation rate that is 2.0 percentage
points lower• Require similar student-years per degree• Produce 6.5 percentage points fewer health and
STEM degrees
Impact of $1,000 grant increase (based on the conservative student response assumption):• Total estimated annual savings to the state:
$38.3 million• Fewer bachelor’s degrees produced annually: 46 • Total saved on capital costs at public institutions
not needed to accommodate increased enrollment: $669.9 million
In North Carolina we match 15 private colleges and universities to four public institutions using the
matching methods described above. All the matches in this state are single matches, and the standard applied for maximum match distance was 0.2 standard devia-tions within the national distribution of private-public pairs. Comparisons of these two sets of sectors reveal that the overall six-year graduation rate is 43.8 percent at the PND colleges and universities and 45.8 percent at the matched public institutions. The PND colleges and universities require 6.5 enrolled years of education to produce one bachelor’s degree, nearly identical to the matched public institutions. STEM or health degrees make up 14.9 percent of the total degrees awarded at PND colleges and universities compared with 21.4 percent of the total degrees at the matched public institutions. Average state grant funding per degree produced is $26,391 at the PND colleges and univer-sities and $17,240 at the matched public institutions.
We use some of these data to simulate the response to an additional $1,000 state grant to encourage students to switch their enrollment choice from one of the public
institutions to one of the matched private nondoctoral institutions. As described earlier, we assume a price elasticity of demand of -1. Our simulation estimates that 2,306 students would switch to PND colleges and universities in response to such a grant increase. Since state grant spending is higher at the PND colleges and universities than at the matched public institutions, this would increase state spending on student aid grants by $35,981,612 annually. Using our standard assump-tion that half of per-student appropriations could be saved for each student shifted from public to private higher education, the induced shift in sectors would lead to savings in annual per-student appropriations of $74,291,616. Combining these two figures yields overall annual state savings of $38,310,004 that would result from the policy change. But owing to the slightly lower graduation rate of the matched PND colleges and uni-versities in North Carolina compared with the public counterparts, we project that the annual bachelor’s degree output would decline slightly after six years by 46 degrees.
The more expansive price elasticity assumption (-1.53) related to the $1,000 grant increase would move an estimated 3,529 students from the public to the private nondoctoral higher education sector. State spending on grants would increase by $55,051,864, offset by assumed savings in per-student appropriations to public insti-tutions of $113,666,168. Combining these two figures, the state would save an estimated $58,614,304 from the policy change under this scenario. Because of the matched private nondoctoral institutions’ slightly lower graduation rate, annual bachelor’s degree output would decrease a bit to 70 fewer degrees after six years.
North Carolina is projected to see a relatively high rate of growth in its annual high school graduating cohort (Bransberger and Michelau 2016) with a 9.3 percent increase in cohort size between 2012–2013 and 2024–2025—and thus in the incoming college class. Therefore, the state could produce large one-time sav-ings by avoiding the need to increase public campus facilities. Using our assumption that each student FTE moved would save half of $81,775 in per-student
37 COUNCIL OF INDEPENDENT COLLEGES
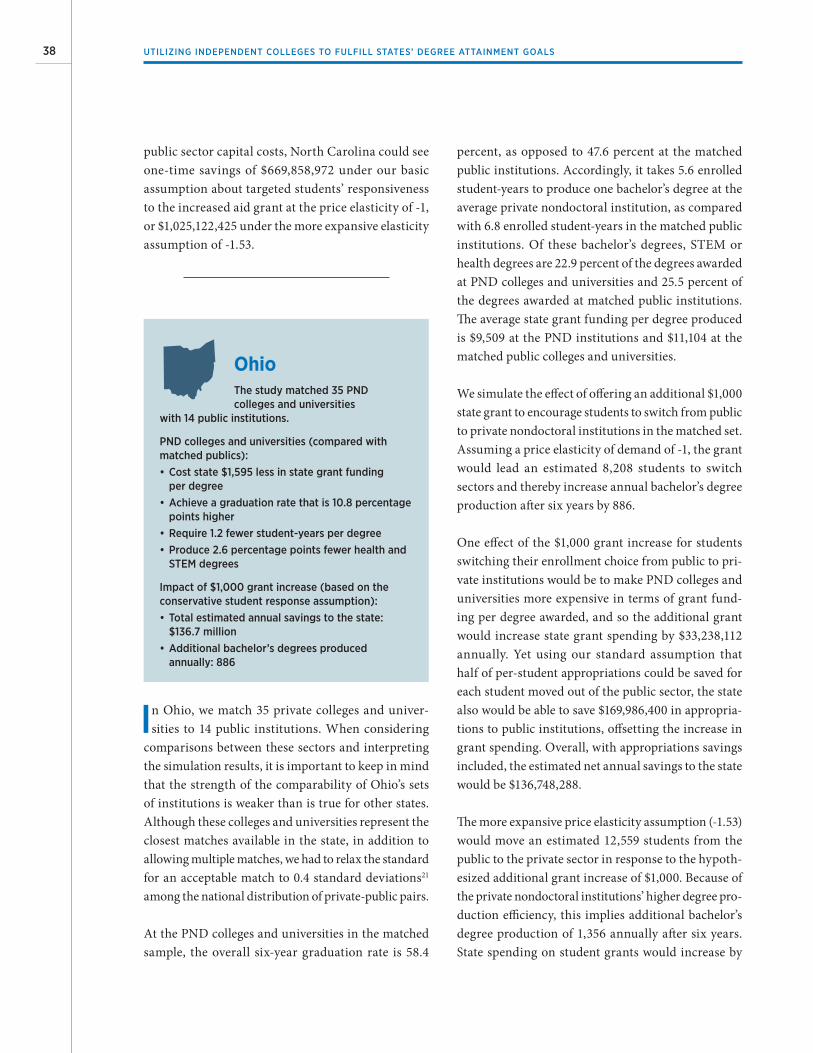
public sector capital costs, North Carolina could see one-time savings of $669,858,972 under our basic assumption about targeted students’ responsiveness to the increased aid grant at the price elasticity of -1, or $1,025,122,425 under the more expansive elasticity assumption of -1.53.
OhioThe study matched 35 PND colleges and universities
with 14 public institutions.
PND colleges and universities (compared with matched publics):• Cost state $1,595 less in state grant funding
per degree• Achieve a graduation rate that is 10.8 percentage
points higher • Require 1.2 fewer student-years per degree • Produce 2.6 percentage points fewer health and
STEM degrees
Impact of $1,000 grant increase (based on the conservative student response assumption):• Total estimated annual savings to the state:
$136.7 million • Additional bachelor’s degrees produced
annually: 886
In Ohio, we match 35 private colleges and univer-sities to 14 public institutions. When considering
comparisons between these sectors and interpreting the simulation results, it is important to keep in mind that the strength of the comparability of Ohio’s sets of institutions is weaker than is true for other states. Although these colleges and universities represent the closest matches available in the state, in addition to allowing multiple matches, we had to relax the standard for an acceptable match to 0.4 standard deviations21 among the national distribution of private-public pairs.
At the PND colleges and universities in the matched sample, the overall six-year graduation rate is 58.4
percent, as opposed to 47.6 percent at the matched public institutions. Accordingly, it takes 5.6 enrolled student-years to produce one bachelor’s degree at the average private nondoctoral institution, as compared with 6.8 enrolled student-years in the matched public institutions. Of these bachelor’s degrees, STEM or health degrees are 22.9 percent of the degrees awarded at PND colleges and universities and 25.5 percent of the degrees awarded at matched public institutions. The average state grant funding per degree produced is $9,509 at the PND institutions and $11,104 at the matched public colleges and universities.
We simulate the effect of offering an additional $1,000 state grant to encourage students to switch from public to private nondoctoral institutions in the matched set. Assuming a price elasticity of demand of -1, the grant would lead an estimated 8,208 students to switch sectors and thereby increase annual bachelor’s degree production after six years by 886.
One effect of the $1,000 grant increase for students switching their enrollment choice from public to pri-vate institutions would be to make PND colleges and universities more expensive in terms of grant fund-ing per degree awarded, and so the additional grant would increase state grant spending by $33,238,112 annually. Yet using our standard assumption that half of per-student appropriations could be saved for each student moved out of the public sector, the state also would be able to save $169,986,400 in appropria-tions to public institutions, offsetting the increase in grant spending. Overall, with appropriations savings included, the estimated net annual savings to the state would be $136,748,288.
The more expansive price elasticity assumption (-1.53) would move an estimated 12,559 students from the public to the private sector in response to the hypoth-esized additional grant increase of $1,000. Because of the private nondoctoral institutions’ higher degree pro-duction efficiency, this implies additional bachelor’s degree production of 1,356 annually after six years. State spending on student grants would increase by
38 UTILIZING INDEPENDENT COLLEGES TO FULFILL STATES’ DEGREE ATTAINMENT GOALS
$50,854,308, but this is offset by assumed savings in per-student appropriations to public institutions of $260,079,184. Combining the two figures produces an estimate of annual state savings of $209,224,876.
Our estimates of student enrollment shifts, additional degree production, and annual state savings are larger for Ohio than for any other state. The limitations in the comparability of the matched institutions across the two sectors in this state, however, must be kept in mind when assessing the practical significance of these data.
OregonThe study matched 9 PND colleges and universities with 6 public institutions.
PND colleges and universities (compared with matched publics):• Achieve a graduation rate that is 21 percentage
points higher• Require 1.5 fewer student-years per degree• Produce 7.3 percentage points fewer health and
STEM degrees
Impact of $1,000 grant increase (based on the conservative student response assumption):• Total estimated annual savings to the state:
$1.8 million• Additional bachelor’s degrees produced
annually: 55
Our comparison in Oregon is between nine private colleges and universities and six public institu-
tions. Using the same matching methods, we allowed multiple institutional matches where necessary in Oregon and applied the criterion of 0.3 standard devia-tions within the national distribution of private-public pairs to determine adequate matches. In these com-parison groups, the overall six-year graduation rate is 66.1 percent at the PND colleges and universities and 45.1 percent at the matched public institutions. The large difference in graduation rates means that it takes
considerably more enrolled student-years to produce a bachelor’s degree at one of these public institutions (6.8 years) than at one of the private nondoctoral institu-tions (5.3 years). Public institutions in Oregon produce STEM and health degrees at a higher rate, however. STEM or health degrees make up 15.2 percent of all bachelor’s degrees awarded at PND colleges and uni-versities compared with 22.5 percent of the degrees at the matched public institutions. Average state grant funding per degree produced is $14,295 at PND insti-tutions and $11,897 at the matched public colleges and universities.
With these comparisons in mind, we simulate the student response to an additional $1,000 state grant designed to encourage students to shift their enrollment choices from public institutions to private nondoctoral institutions. With a price elasticity of demand of -1, we expect that 259 students would switch their sector of choice, increasing annual degree production by 55 after six years.
Our simulation model predicts that this movement of students across sectors would increase overall state grant spending by $2,006,405 annually. This is offset by appropriations savings of $3,796,788, which is determined by assuming that half of per-student appro-priations to affected public institutions could be saved for each student moved. In total, the hypothesized policy change is predicted to reduce state spending annually by $1,790,383.
The more expansive price elasticity assumption (-1.53) would move an estimated 397 students from the public to private sector in response to the hypothesized addi-tional grant increase of $1,000, which after six years increases annual bachelor’s degree production by 84. State grant spending increases from the current level by an estimated $3,069,800, while per-student appropria-tions to public institutions decreases by $5,809,086. The net effect is an annual savings to the state of $2,739,286.
39 COUNCIL OF INDEPENDENT COLLEGES
PennsylvaniaThe study matched 50 PND colleges and universities
with 10 public institutions.
PND colleges and universities (compared with matched publics):• Cost state $1,406 less in state grant funding
per degree• Achieve a graduation rate that is 11.4 percentage
points higher• Require 0.8 fewer student-years per degree • Produce 1.0 percentage points more health and
STEM degrees
Impact of $1,000 grant increase (based on the conservative student response assumption):• Total estimated annual savings to the state:
$3.7 million • Additional bachelor’s degrees produced
annually: 739
Pennsylvania has a large number of private colleges and universities that perform well compared with
the public institutions that share similar matching characteristics. Using the methods described earlier, we matched 50 PND colleges and universities to 10 public institutions. In this state all the matches are single matches, and the standard applied for max-imum match distance was 0.2 standard deviations within the national distribution of private-public pairs, so the matches are quite strong. Comparing across these groups of colleges, the six-year graduation rate is 65.4 percent at the PND institutions and 54.0 percent at the comparison group of matched public institutions, leading to PND colleges and universities requiring 5.1 enrolled student-years to produce one bachelor’s degree compared with 5.9 enrolled stu-dent-years for matched public institutions. Of these degrees, STEM or health degrees make up 27.2 percent of the bachelor’s degrees awarded at the private non-doctoral institutions and 26.2 percent of the bachelor’s degrees awarded at the matched public institutions. Pennsylvania spends slightly less on grant funding per degree awarded at PND colleges and universities
($16,532 per degree produced) than at the matched public institutions ($17,938).
Under the assumption that students have a price elas-ticity of demand in response to tuition price differences of -1, our simulation model estimates that an addi-tional $1,000 grant to encourage attendance at a PND institution over a matched public college or university would shift 6,468 students to PND institutions. This would increase annual state degree production by 739 after six years.
The additional grant size would increase state grant spending at PND colleges and universities such that the state would spend more per degree on grants at private nondoctoral colleges and universities than at the matched public institutions. Overall, state grant spending would increase by an estimated $23,789,522 annually. These losses, however, are offset by savings in appropriations to public institutions, given our standard assumption that half of per-student appro-priations to public institutions could be saved for each student moved from the public to the private sector. We thus predict that the state would save $27,492,138 annu-ally in appropriations spending and that the overall change in state spending would be a spending decrease of $3,702,616 annually.
The more expansive price elasticity assumption (-1.53) would move an estimated 9,897 students from the public to private sector in response to the hypoth-esized additional grant increase of $1,000. After six years, this would lead to 1,131 additional bachelor’s degree awards in the state per year. State spending on student grants would rise by $36,397,968, which is offset by assumed savings in appropriations to public institutions of $42,062,972. After combining these two sums, we estimate that the policy change would decrease overall annual state spending by $5,665,004 under this scenario.
40 UTILIZING INDEPENDENT COLLEGES TO FULFILL STATES’ DEGREE ATTAINMENT GOALS

South Carolina The study matched 12 PND colleges and universities
with 4 public institutions.
PND colleges and universities (compared with matched publics):• Achieve a graduation rate that is 1.0 percentage
points higher • Require 0.2 fewer student-years per degree • Produce 3.1 percentage points fewer health and
STEM degrees
Impact of $1,000 grant increase (based on the conservative student response assumption):• Total estimated annual operating savings to
state: None• Additional bachelor’s degrees produced annually: 18• Total saved on capital costs at public institutions
not needed to accommodate increased enrollment: $500.7 million
We match 12 private colleges and universities to four South Carolina public institutions using
the matching methods described earlier. In this state all the matches are single matches, and the standard maximum match distance was 0.2 standard deviations within the national distribution of private-public pairs, so the matches are quite strong. Basic comparisons show that the overall six-year graduation rate is 54.6 percent at these private nondoctoral institutions and 53.6 percent at matched public institutions. The PND colleges and universities require 5.7 enrolled student-years to produce one degree compared with 5.9 years for the matched public institutions. STEM or health degrees comprise 14.4 percent of the bachelor’s degrees at PND institutions and 17.5 percent of bachelor’s degrees at matched public institutions. Average state grant funding per degree pro-duced is $35,274 at the PND institutions and $27,841 at the matched public colleges and universities.
We take these basic facts and simulate the response to an additional $1,000 grant designed to encourage students to switch enrollment plans from public to PND institutions. Assuming a price elasticity of demand of -1, we estimate
that the larger grant would lead 1,865 students to switch sectors. Consistent with the already higher grant spending per student at PND colleges and universities, this would induce an increase of $24,500,950 in state grant spending. Using our standard assumption that half of per-student appropriations to public institutions could be saved for each student moved, this also suggests savings in appro-priations of $22,291,390. Because these savings do not fully offset the increase in grant spending, overall state spending would increase by $2,209,560. South Carolina is one of two of the 24 states studied for which we estimate that the $1,000 increased grant incentive would actually increase annual state operating costs. In addition, as a result of the higher degree production efficiency of the matched PND colleges and universities, the state’s annual degree production would increase after six years by 18.
The more expansive price elasticity assumption (-1.53) would move an estimated 2,853 students from the public to private sector in response to the hypothesized addi-tional grant increase of $1,000. After six years, this would lead to an annual increase in bachelor’s degrees of 28. State spending on grants would rise by an estimated $37,486,456 while, under our assumptions, offsetting savings on appropriations to public colleges and universities could reach $34,105,828. Taken together, these figures imply an overall increase in annual state costs of $3,380,628.
South Carolina is a state that is projected to see a rap-idly increasing high school graduate cohort. WICHE (Bransberger and Michelau 2016) projects that South Carolina will see growth of 11.3 percent in its annual high school graduate numbers between 2012–2013 and 2024–2025. The implied increase in first-year students could well strain current public campus facilities and require further capital construction, unless some of those students are diverted to private colleges. Using our standard assumption that each student FTE diverted would save half of $81,775 in state capital costs, South Carolina’s one-time capital cost savings are estimated to be $500,744,939 under our basic response elasticity assumption of -1, or $766,018,934 under the alternate assumed elasticity of -1.53.
41 COUNCIL OF INDEPENDENT COLLEGES
Tennessee The study matched
18 PND colleges and universities with 9 public institutions.
PND colleges and universities (compared with matched publics):• Cost state $2,295 less in state grant funding
per degree• Achieve a graduation rate that is 7.9 percentage
points higher • Require 0.8 fewer student-years per degree • Produce 1.4 percentage points fewer health and
STEM degrees
Impact of $1,000 grant increase (based on the conservative student response assumption):• Total estimated annual savings to the state:
$38.8 million• Additional bachelor’s degrees produced
annually: 155
In Tennessee we allowed multiple institutional matches where necessary and applied the criterion of 0.3 stan-
dard deviations within the national distribution of private-public pairs to determine adequate matches. The sets of matched institutions include 18 private nondoctoral institutions and nine public colleges and universities. Within these matched sets, the overall six-year graduation rate is 50.9 percent at the PND insti-tutions and 43.0 percent at the matched public colleges and universities. Accordingly, it takes fewer years of instruction to produce one degree at a PND college or university (6.0 years) compared with a matched public institution (6.8 years). Yet the state pays less in terms of per-student grant support for the higher PND institution graduation rate. Average state grant funding per bach-elor’s degree produced is $26,860 at PND colleges and universities as compared with $29,155 at the matched public institutions. STEM or health degrees comprise 22.3 percent of the bachelor’s degrees produced at PND institutions and 23.7 percent of the bachelor’s degrees at matched public colleges and universities.
Given these comparative figures, we simulate the response to an additional $1,000 grant encouraging students to switch enrollment plans from one of the matched public institutions to a PND institution. We expect that such a grant increase for private sector stu-dents, assuming a price elasticity of -1, would induce 1,952 students to switch sectors, increasing annual bachelor’s degree production by 155 after six years.
We estimate that state spending on grants would increase by $7,255,397 per year. Tennessee, however, could also save a significant amount in appropria-tions by easing pressure on the public colleges and universities. Using our standard assumption that half of per-student appropriations to public colleges and universities could be saved for each student shifted across sectors, the increased grant for private nondoc-toral institution students who shifted sectors would lead to savings in appropriations of $46,051,332 for net overall annual savings to the state of $38,795,935.
The more expansive price elasticity assumption (-1.53) would move an estimated 2,987 students from the public to private sector in response to the hypothesized grant increase of $1,000. We project that this would lead to additional annual bachelor’s degree output of 236 awards after six years, owing to the higher degree pro-duction efficiency of the private nondoctoral colleges and universities. We estimate that the increase in state grant spending would be just over $11 million annually ($11,100,757), while savings on per-student appropri-ations to public institutions would be $70,458,536 per year. Combining these two amounts leads to our esti-mate of net annual savings to the state of $59,357,779 under this scenario.
42 UTILIZING INDEPENDENT COLLEGES TO FULFILL STATES’ DEGREE ATTAINMENT GOALS

TexasThe study matched 14 PND colleges and universities with 8 public institutions.
PND colleges and universities (compared with matched publics):
• Cost state $3,606 less in state grant funding per degree
• Achieve a graduation rate that is 16.1 percentage points higher
• Require 1.4 fewer student-years per degree • Produce a similar amount of health and
STEM degrees
Impact of $1,000 grant increase (based on the conservative student response assumption):• Total estimated annual savings to the state:
$66.6 million • Additional bachelor’s degrees produced
annually: 368• Total saved on capital costs at public institutions
not needed to accommodate increased enrollment: $856.4 million
In Texas we match 14 private colleges and universi-ties to eight public institutions using the matching
methods described earlier. In this state all the matches are single matches, and the standard applied for max-imum match distance was 0.2 standard deviations within the national distribution of private-public pairs, so the matches are quite strong. These matched institutional samples are rather different in terms of graduation rates. Basic comparisons show that the overall six-year graduation rate of 50.9 percent at PND colleges and universities is much higher than the 34.8 percent rate at the matched public institutions. As a result, the PND colleges and universities take only 6.3 years of education to produce one degree compared with 7.7 years for the matched public institutions. STEM or health degrees make up 17.0 of total bach-elor’s degrees at PND colleges and universities and 16.6 percent at matched public institutions. Average state grant funding per degree is $22,645 at the PND
institutions and $26,251 at matched public colleges and universities.
Assuming a price elasticity of demand of -1, an addi-tional $1,000 grant incentivizing students who select private nondoctoral colleges and universities over one of the matched public institutions would entice 2,282 students to switch sectors, increasing annual degree production by 368 after six years. This sector shift would lead to an increase in state spending on grants of $6,033,900 per year. Moving students to PND insti-tutions should reduce appropriations to affected public institutions. Using our standard assumption that half of per-student appropriations could be saved for each student moved, Texas would save $72,648,108 per year in appropriations, leading to overall net annual savings of $66,614,208.
The more expansive price elasticity assumption (-1.53) would move an estimated 3,491 students from the public to private sector in response to the hypothesized additional grant increase of $1,000. After six years, we project that this assumption would lead to addi-tional annual bachelor’s degree output of 563 awards; this is due to the substantially higher degree produc-tion efficiency of the private nondoctoral colleges and universities. We estimate that additional state grant spending would come to $9,231,867 annually, while savings on per-student appropriations to public insti-tutions would reach $111,151,592 per year. Combining these two amounts leads to our estimate of net annual savings to the state of $101,919,725 under this scenario.
In addition, Texas is projected to see the largest rate of growth in the country in its already very large annual high school graduating cohort, which seems likely to lead to public campus capacity constraints. WICHE (Bransberger and Michelau 2016) projects that Texas will see more than 70,000 additional high school graduates per year in 2024–2025 as compared with 2012–2013, an increase of 19.2 percent. Therefore, we also take into account the potential for Texas to save on public sector capital expansion costs as a result of the enhanced grant for targeted students enrolling in
43 COUNCIL OF INDEPENDENT COLLEGES
private nondoctoral colleges and universities instead of public institutions. Using our previously explained assumption that each student FTE moved across sectors would save half of $81,775 in avoided public capital costs, Texas’s one-time capital cost savings are esti-mated to be $856,393,137 under our basic response elasticity assumption of -1, or $1,310,108,868 under the alternate assumed elasticity of -1.53.
Virginia The study matched 13 PND colleges and
universities with 4 public institutions.
PND colleges and universities (compared with matched publics):• Cost state $4,944 less in state grant funding
per degree• Have a graduation rate that is 4.1 percentage
points lower• Require 0.1 more student-years per degree• Produce 5.0 percentage points more health and
STEM degrees
Impact of $1,000 grant increase (based on the conservative student response assumption):• Total estimated annual savings to the state:
$27.4 million• Fewer bachelor’s degrees produced annually: 59
In Virginia, we match 13 private colleges and uni-versities and four public institutions. In this state all
the matches are single, and the standard maximum match distance was 0.2 standard deviations within the national distribution of private-public pairs, so the matches are strong. The matched PND colleges and universities have a somewhat lower graduation rate in Virginia, although their graduation rates compare favorably to other states. The overall six-year graduation rate is 60.4 percent for the matched private nondoctoral institutions and 64.5 percent for the matched public colleges and universities. Consequently, it takes 5.4 enrolled student-years to produce a degree at one of
these PND institutions compared with 5.3 enrolled student-years at a matched public college or university. PND institutions, however, produce a larger proportion of STEM and health degrees, 18.7 percent, compared with 13.7 percent at the matched publics. The matched private nondoctoral institutions also are less expensive for the state in terms of student aid grant funding. This funding is $14,920 per bachelor’s degree awarded at the PND colleges and universities as opposed to $19,864 at the matched public colleges and universities.
Our simulation model projects that 1,450 students would be induced to switch their enrollment plans to PND colleges and universities by an additional $1,000 state grant, assuming that the price elasticity of demand is -1. The slightly lower graduation rate at the PND colleges and universities would eventually decrease annual degree production by 59 after six years. The additional grant would make PND institutions more expensive to the state in terms of grant funding per degree, but grant spending would increase by only $718,014 per year. Using our standard assumption that half of per-student appropriations to affected public institutions could be saved for each student moved, however, we expect that the new grant would reduce appropriations spending by $28,127,484 annually. Overall, balancing these savings against the increase in grant spending results in a net decrease in annual state spending of $27,409,470.
The more expansive price elasticity assumption (-1.53) would move an estimated 2,219 students from the public to private sector in response to the hypothesized additional grant increase of $1,000. After six years, this would lead to a decrease of an estimated 91 bachelor’s degree awards per year owing to the unusually high degree production efficiency of Virginia’s matched public colleges and universities. Additional state grant spending is estimated at $1,098,562 per year, offset by savings in per-student appropriations to public insti-tutions of $43,035,048, for a net annual saving to the state under this scenario estimated at $41,936,486.
44 UTILIZING INDEPENDENT COLLEGES TO FULFILL STATES’ DEGREE ATTAINMENT GOALS

Washington The study matched 8 PND colleges and universities with
6 public institutions.
PND colleges and universities (compared with matched publics):• Achieve a graduation rate that is 11.2 percentage
points higher • Require 0.6 fewer student-years per degree • Produce 1.3 percentage points fewer health
and STEM degrees
Impact of $1,000 grant increase (based on the conservative student response assumption):• Total estimated annual savings to the state:
$6.3 million • Additional bachelor’s degrees produced
annually: 59
We match nine private colleges and universities to six public institutions in Washington state
using the matching methods described above. We drop one outlier PND institution with a very low graduation rate, however, resulting in only eight PND colleges and universities being used in our primary simulation.22 In Washington we allowed multiple institutional matches where necessary and applied the criterion of 0.3 stan-dard deviations within the national distribution of private-public pairs to determine adequate matches. Basic comparisons between these groups show that the six-year graduation rate is high in both sectors, 72.7 percent at private nondoctoral institutions and 61.5 percent at matched public colleges and universities. It takes on average 4.9 years of education to produce one degree at the PND institutions compared with 5.5 years at the matched public colleges and universities. Of the degrees produced, STEM or health degrees make up 20.7 percent of bachelor’s degrees awarded at the PND institutions and 22.0 percent of bachelor’s degrees awarded at the matched public colleges and universi-ties. Average state grant funding per degree produced is $25,418 at the PND institutions and $23,716 at the matched public colleges and universities.
With an assumed price elasticity of demand of -1, we simulate the response to an additional $1,000 state grant providing an incentive to students to switch their enrollment plans from matched public to PND institutions. Our simulation model projects that 524 students would switch in response to such an increased grant for private college attendees.
The hypothesized grant increase would lead to an overall increase in state grant spending of $3,440,320 annually, consistent with the fact that the matched PND institutions already draw more state grant spending per degree. Using our standard assumption that half of per-student appropriations to public institutions could be saved for each student moved, the grant also would imply annual appropriations savings of $9,698,118. In total, overall annual state spending would decrease by $6,257,798, while annual bachelor’s degree production would increase by 59 after six years.
The more expansive price elasticity assumption (-1.53) would move an estimated 801 students from the public to private sector in response to the hypothesized addi-tional grant increase of $1,000. This assumption leads to a projected annual increase in degrees awarded of 90 after six years. Annual state spending on grants would increase by $5,263,689 from the baseline, but this would be offset by savings on per-student appropriations to public institutions of $14,838,121. Combining these two figures produces an estimate of net annual savings to the state of $9,574,432.
45 COUNCIL OF INDEPENDENT COLLEGES

West Virginia The study matched 7 PND colleges
and universities with 3 public institutions.
PND colleges and universities (compared with matched publics):• Cost state $8,099 less in state grant funding
per degree• Achieve a graduation rate that is 16.2 percentage
points higher• Require 1.8 fewer student-years per degree • Produce 7.6 percentage points more health and
STEM degrees
Impact of $1,000 grant increase (based on the conservative student response assumption):• Total estimated annual savings to the state:
$6.7 million • Additional bachelor’s degrees produced
annually: 73
In West Virginia, we are able to match seven private colleges and universities to four public institutions
using the matching methods described earlier. We drop one outlier public institution with a very low graduation rate from the analysis, however, resulting in only three public institutions being used in the primary simula-tion.23 In this state all the matches are single matches, and the standard applied for maximum match distance was 0.2 standard deviations within the national dis-tribution of private-public pairs, so the matches are strong. The two groups of matched institutions perform quite differently on our key efficiency measures. The six-year graduation rate is 52.7 percent at the PND colleges and universities as compared with 36.5 percent at the matched public institutions; the PND colleges and universities take only 5.7 years of education to produce one degree as compared with 7.5 years at the matched public colleges. The PND colleges and univer-sities produce a higher proportion of STEM and health degrees as well. STEM or health degrees make up 31.1 percent of bachelor’s degrees awarded at these PND colleges and universities compared with 23.5 percent of bachelor’s degrees at the matched public institutions. Finally, the PND colleges and universities cost the state
less in terms of grant funding. Average state student grant funding per degree produced is $18,404 at PND colleges and universities compared with $26,503 at the matched public colleges. These basic facts point toward the results of our grant increase simulation.
In this simulation we assume a price elasticity of demand of -1, in which case the grant would lead 452 students to switch sectors. After six years, we would expect an increase in annual degree production of 73. Because of the much lower current state grant spending at the PND colleges and universities, the addition of the new grant would reduce annual state grant spend-ing by $1,074,706. In addition, using our standard assumption that half of per-student appropriations to the affected public institutions could be saved for each student moved, the state also would see savings in appropriations spending of $5,610,183. Adding these two sources of savings together, total estimated annual savings would be $6,684,889 for the state.
The more expansive price elasticity assumption (-1.53) would move an estimated 692 students from the public to private sector in response to the hypothesized addi-tional grant increase of $1,000. This assumption leads to an increase in annual bachelor’s degree awards of 112 after six years. State grant spending decreases by an estimated $1,644,300, while per-student state appro-priations to affected public institutions decrease by $8,583,580. Expected state savings under this scenario total $10,227,880.
46 UTILIZING INDEPENDENT COLLEGES TO FULFILL STATES’ DEGREE ATTAINMENT GOALS
In this study, we first examined the performance of private nondoctoral colleges and universities relative
to a closely matched set of similar public institutions and have shown that, on the whole, the PND sector is more cost-effective, especially with respect to taxpayer costs. Since this comparison appears to offer potential advantages to state policymakers seeking to increase bachelor’s degree production while being economical with state tax funds, we simulated the effects in 24 states of hypothetical increases in already existing state student aid grants targeted at state resident students “on the margin” (i.e., those whose enrollment plans could be shifted from a public institution to a similar private college or university in the state).
The results showed that, using plausible response elas-ticity values from the higher education economics literature, substantial numbers of aid-eligible students could likely be induced to enroll in private nondoc-toral institutions in response to an increased state aid grant of just $1,000 per year of enrollment. Since pri-vate nondoctoral colleges and universities generally
have superior graduation rates, in most states this shift would eventually lead to increased bachelor’s degree production. We also estimate that in all but two of the 24 states studied there would be net operating savings to the state budget, taking account of both student aid costs and (conservatively estimated) potential sav-ings in per-student appropriations to affected public institutions. Finally, in states expected to face sizeable near-term growth in high school graduating classes, which is likely to necessitate costly public sector capac-ity expansion, large sums could be saved by diverting some of this increased enrollment demand to private colleges and universities within the state.
In sum, state policymakers should seriously consider such a feasible, cost-effective approach to increasing high quality bachelor’s degree production while reduc-ing costs to taxpayers.
Conclusion
47

1 About 650 of these PND colleges and universities are mem-bers of the Council of Independent Colleges. The primary focus of most of these institutions is baccalaureate educa-tion, although many award master’s degrees as well. We focus here on their bachelor’s degree production.
2 The states studied include Alabama, Arkansas, California, Florida, Georgia, Illinois, Indiana, Kansas, Kentucky, Minnesota, Missouri, Nebraska, New Jersey, New York, North Carolina, Ohio, Oregon, Pennsylvania, South Carolina, Tennessee, Texas, Virginia, Washington, and West Virginia.
3 We assume that state student aid officials would be able to identify students whose decisions could be affected by the larger grant and target them for this benefit.
4 We used a well-established multivariate matching tech-nique to identify PND colleges and universities in each state with good public sector matches within the state in terms of various student and institutional characteristics available in IPEDS. We assumed that students respond-ing to the hypothesized increased state grants would shift their enrollment plans from one of these public institu-tions to a closely comparable PND college or university.
5 These estimates come from recent authoritative projections of high school graduate numbers by state from the Western Interstate Commission on Higher Education (Bransberger and Michelau 2016).
6 See Zumeta (1999) for an early version of the basic idea.
7 CIC is an association of 654 private nonprofit four-year colleges and universities. This report uses the term PND (private nondoctoral), which represents the majority of CIC membership. The authors use doctoral institutions in some of the matching of CIC members to public insti-tutions. For additional information, visit www.cic.edu.
8 We assume that these appropriations are reduced by half the per-student amount that affected public institutions currently receive from the state. This takes account of fixed institutional costs that cannot readily be altered in response to modest changes in enrollment.
9 These comparisons are from IPEDS and focus on the public comparison institutions that were closely matched to PND colleges. They cover the period from 2005 to 2012.
10 A large gap in net price appears when comparing PND colleges and universities with in-state public tuition costs. Out-of-state net price per degree in public institutions, however, is more similar: $57,428, compared with $62,566 for PND colleges and universities.
11 Note that we assume that the increased aid grants could be effectively targeted to students “on the margin” of choice between a public college and a comparable pri-vate college in the state. Otherwise, if all private students got the additional aid money regardless of their original intent, program costs would rise considerably. A proce-dure would thus need to be devised by state aid program authorities for identifying students at the margin of choice and enhancing their grants for choosing the pri-vate option.
12 The matching procedure is based on selecting, for each PND college, the public college with the smallest Mahalonobis distance score based on the respective colleges’ admissions rate (percentage of applicants accepted), the number of undergraduates, the propor-tion of undergraduates who are: (i) receiving state or federal financial aid, (ii) taking out federal loans, and (iii) receiving Pell grants, (iv) the proportion of students who are undergraduates, and (v) the proportion of BA recipients who major in STEM or health fields. The insti-tutional data come from the federal IPEDS data system.
13 We use six-year graduation rates to be consistent with the federal data standard.
14 The latest year of actual data on high school graduates reported by WICHE is 2012–2013 (Bransberger and Michelau 2016), while 2024–2025 is the year within the projection period when the majority of states see the peak number of such graduates.
15 A unit (-1) price elasticity means that, for example, a 10 percent reduction in an institution’s net price would lead to a 10 percent increase in affected new students (i.e., presumably mostly first-year students) attending it.
Endnotes48
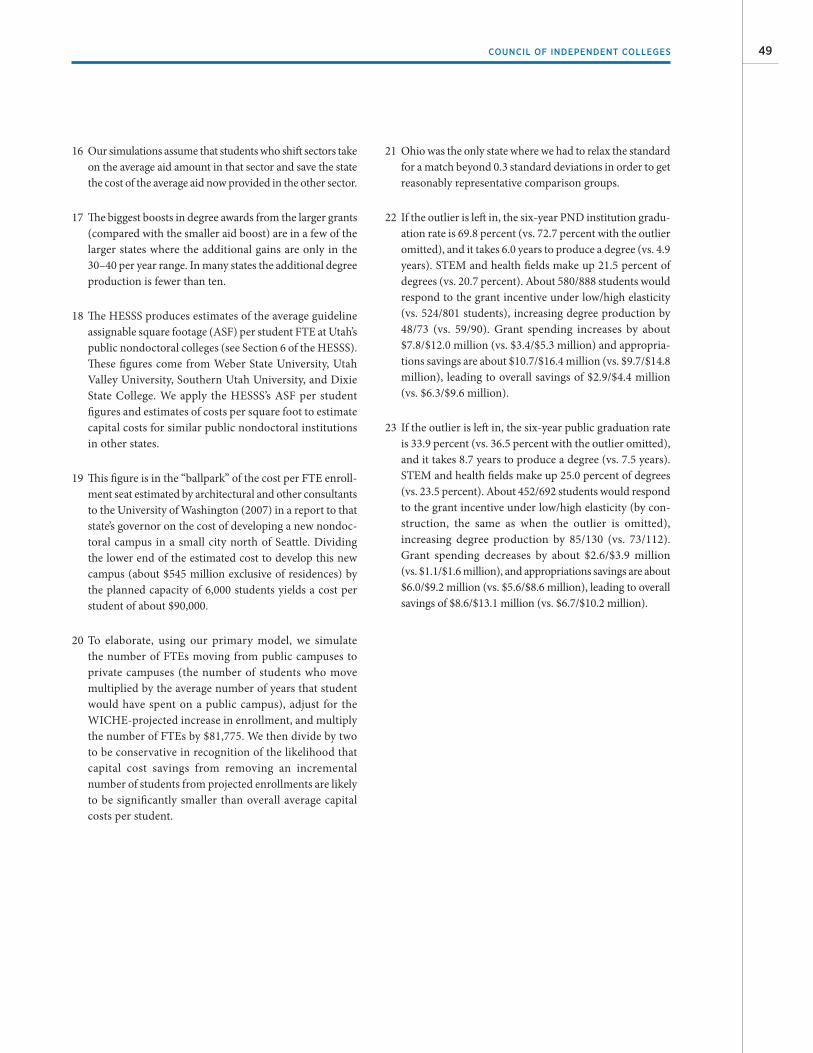
16 Our simulations assume that students who shift sectors take on the average aid amount in that sector and save the state the cost of the average aid now provided in the other sector.
17 The biggest boosts in degree awards from the larger grants (compared with the smaller aid boost) are in a few of the larger states where the additional gains are only in the 30–40 per year range. In many states the additional degree production is fewer than ten.
18 The HESSS produces estimates of the average guideline assignable square footage (ASF) per student FTE at Utah’s public nondoctoral colleges (see Section 6 of the HESSS). These figures come from Weber State University, Utah Valley University, Southern Utah University, and Dixie State College. We apply the HESSS’s ASF per student figures and estimates of costs per square foot to estimate capital costs for similar public nondoctoral institutions in other states.
19 This figure is in the “ballpark” of the cost per FTE enroll-ment seat estimated by architectural and other consultants to the University of Washington (2007) in a report to that state’s governor on the cost of developing a new nondoc-toral campus in a small city north of Seattle. Dividing the lower end of the estimated cost to develop this new campus (about $545 million exclusive of residences) by the planned capacity of 6,000 students yields a cost per student of about $90,000.
20 To elaborate, using our primary model, we simulate the number of FTEs moving from public campuses to private campuses (the number of students who move multiplied by the average number of years that student would have spent on a public campus), adjust for the WICHE-projected increase in enrollment, and multiply the number of FTEs by $81,775. We then divide by two to be conservative in recognition of the likelihood that capital cost savings from removing an incremental number of students from projected enrollments are likely to be significantly smaller than overall average capital costs per student.
21 Ohio was the only state where we had to relax the standard for a match beyond 0.3 standard deviations in order to get reasonably representative comparison groups.
22 If the outlier is left in, the six-year PND institution gradu-ation rate is 69.8 percent (vs. 72.7 percent with the outlier omitted), and it takes 6.0 years to produce a degree (vs. 4.9 years). STEM and health fields make up 21.5 percent of degrees (vs. 20.7 percent). About 580/888 students would respond to the grant incentive under low/high elasticity (vs. 524/801 students), increasing degree production by 48/73 (vs. 59/90). Grant spending increases by about $7.8/$12.0 million (vs. $3.4/$5.3 million) and appropria-tions savings are about $10.7/$16.4 million (vs. $9.7/$14.8 million), leading to overall savings of $2.9/$4.4 million (vs. $6.3/$9.6 million).
23 If the outlier is left in, the six-year public graduation rate is 33.9 percent (vs. 36.5 percent with the outlier omitted), and it takes 8.7 years to produce a degree (vs. 7.5 years). STEM and health fields make up 25.0 percent of degrees (vs. 23.5 percent). About 452/692 students would respond to the grant incentive under low/high elasticity (by con-struction, the same as when the outlier is omitted), increasing degree production by 85/130 (vs. 73/112). Grant spending decreases by about $2.6/$3.9 million (vs. $1.1/$1.6 million), and appropriations savings are about $6.0/$9.2 million (vs. $5.6/$8.6 million), leading to overall savings of $8.6/$13.1 million (vs. $6.7/$10.2 million).
49 COUNCIL OF INDEPENDENT COLLEGES
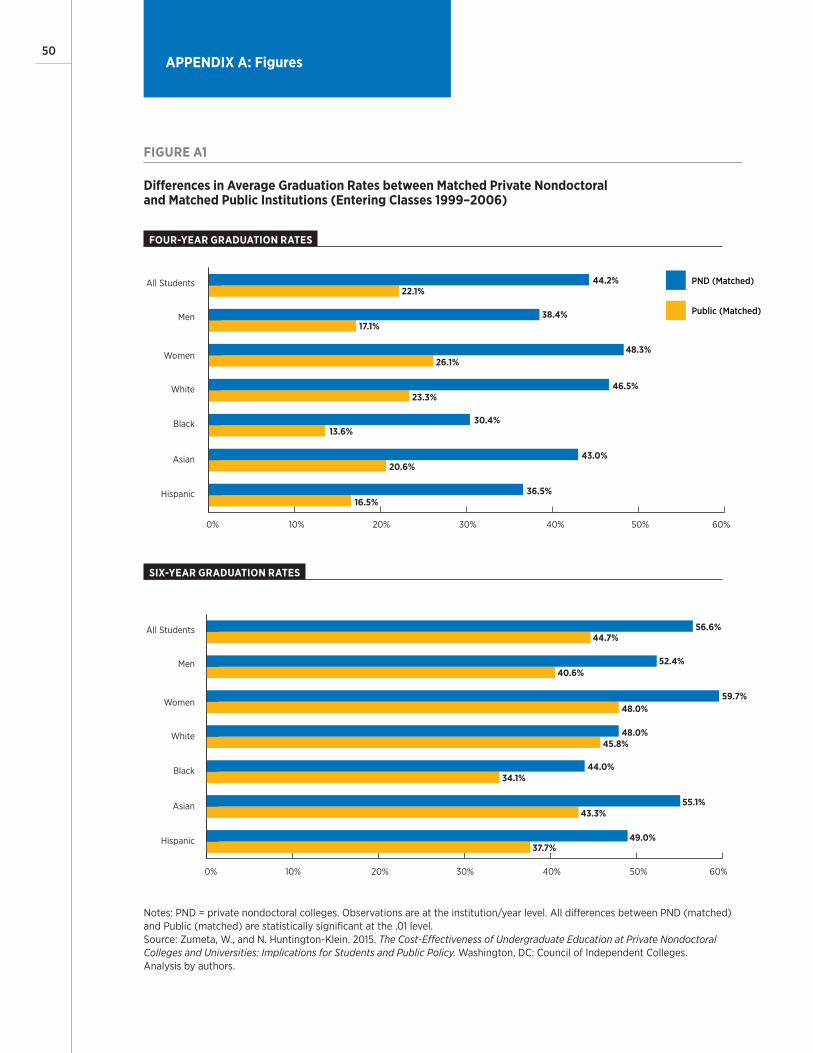
50 APPENDIX A: Figures
FIGURE A1
Differences in Average Graduation Rates between Matched Private Nondoctoral and Matched Public Institutions (Entering Classes 1999–2006)
Figure 5 Four-Year
Six-Year
All Students
Men
Women
White
Black
Asian
Hispanic
All Students
Men
Women
White
Black
Asian
Hispanic
0% 10% 20% 30% 40% 50% 60%
0% 10% 20% 30% 40% 50% 60%
Public (Matched)
PND (Matched)44.2%22.1%
38.4%17.1%
48.3%26.1%
23.3%46.5%
20.6%43.0%
16.5%36.5%
13.6%30.4%
56.6%44.7%
52.4%40.6%
59.7%48.0%
45.8%48.0%
43.3%55.1%
37.7%49.0%
34.1%44.0%
Notes: PND = private nondoctoral colleges. Observations are at the institution/year level. All differences between PND (matched) and Public (matched) are statistically significant at the .01 level. Source: Zumeta, W., and N. Huntington-Klein. 2015. The Cost-Effectiveness of Undergraduate Education at Private Nondoctoral Colleges and Universities: Implications for Students and Public Policy. Washington, DC: Council of Independent Colleges.Analysis by authors.
FOUR-YEAR GRADUATION RATES
SIX-YEAR GRADUATION RATES

51 COUNCIL OF INDEPENDENT COLLEGES
FIGURE A2
Enrolled Student-Years of College per Degree among Graduates and All Students, 2005–2012
Figure A2
PND (Matched) Public (Matched)
0
1
2
3
4
5
6
7
Years per Degree among All Students Years per Degree among Graduates
Year
s of
Col
lege
Per
Deg
ree
4.24
5.18
4.60
6.10
Note: PND = private nondoctoral colleges.Source: Zumeta, W., and N. Huntington-Klein. 2015. The Cost-Effectiveness of Undergraduate Education at Private Nondoctoral Colleges and Universities: Implications for Students and Public Policy. Washington, DC: Council of Independent Colleges.Analysis by authors.

52 APPENDIX B: List of Colleges Included in Analysis, by State
AlabamaPrivate Nondoctoral (PND):
Birmingham-Southern CollegeHuntingdon CollegeOakwood UniversitySamford UniversitySpring Hill CollegeStillman CollegeTalladega CollegeTuskegee University
Public:
Alabama A&M UniversityAlabama State UniversityAthens State UniversityAuburn University Main Campus*Auburn University at
MontgomeryJacksonville State UniversityThe University of Alabama at
Birmingham*The University of Alabama at
Huntsville*The University of Alabama
Main Campus*Troy UniversityUniversity of MontevalloUniversity of North AlabamaUniversity of South Alabama*University of West Alabama
ArkansasPND:
John Brown UniversityLyon CollegePhilander Smith CollegeUniversity of the Ozarks
Public:
Henderson State University
Southern Arkansas University Main Campus
University of Arkansas at Pine Bluff
CaliforniaPND:
American Jewish UniversityAzusa Pacific University*Biola University*California Baptist UniversityCalifornia Lutheran UniversityChapman UniversityConcordia University IrvineDominican University of CaliforniaFresno Pacific UniversityHoly Names UniversityMills CollegeMount Saint Mary’s UniversityNational UniversityNotre Dame de Namur UniversityPacific Union CollegePoint Loma Nazarene UniversityScripps CollegeSimpson UniversitySt. Thomas Aquinas CollegeUniversity of La Verne*University of RedlandsWestmont CollegeWhittier CollegeWoodbury University
Public:
California Polytechnic State University-San Luis Obispo
California State Polytechnic University-Pomona
California State University, Bakersfield
California State University, Chico
California State University, Dominguez Hills
California State University, East Bay
California State University, Fresno*
California State University, Fullerton*
California State University, Long Beach
California State University, Los Angeles
California State University, Monterey Bay
California State University, Northridge
California State University, Sacramento
California State University, San Bernardino
California State University, San Marcos
California State University, Stanislaus
Humboldt State UniversitySan Diego State University*San Francisco State University*San Jose State UniversitySonoma State UniversityUniversity of California,
Berkeley*University of California, Davis*University of California, Irvine*University of California,
Los Angeles*University of California,
Riverside*University of California,
San Diego*University of California,
Santa Barbara*University of California,
Santa Cruz*

53 COUNCIL OF INDEPENDENT COLLEGES
FloridaPND:
Beacon CollegeBethune-Cookman UniversityClearwater Christian CollegeEckerd CollegeFlagler CollegeFlorida Memorial UniversityJacksonville UniversityLynn UniversityPalm Beach Atlantic UniversityRollins CollegeSaint Leo UniversitySt. Thomas UniversitySoutheastern UniversityStetson UniversityWarner University
Public:
Florida A& M University*Florida Atlantic University*Florida Gulf Coast University*Florida International University*Florida State University*New College of FloridaUniversity of Central Florida*University of Florida*University of North FloridaUniversity of South Florida
Main Campus*University of West Florida*
GeorgiaPND:
Agnes Scott CollegeBerry CollegeClark Atlanta University*Covenant CollegeLaGrange College
Morehouse CollegeOglethorpe UniversityPaine CollegeSpelman CollegeThomas UniversityWesleyan College
Public:
Albany State UniversityGeorgia College & State UniversityGeorgia Southwestern State
UniversityUniversity of North Georgia
IllinoisPND:
Aurora UniversityBenedictine University*DePaul University*Dominican UniversityElmhurst CollegeGreenville CollegeIllinois Wesleyan UniversityJudson UniversityKnox CollegeLewis UniversityMacMurray CollegeMcKendree CollegeMillikin UniversityNational-Louis University*North Central CollegeNorth Park UniversityQuincy UniversityRockford UniversitySaint Xavier UniversityShimer CollegeTrinity Christian CollegeUniversity of St. FrancisWheaton College
Public:
Chicago State UniversitySouthern Illinois University
Carbondale*University of Illinois Springfield
IndianaPND:
Anderson UniversityBethel CollegeButler UniversityCalumet College of St. JosephDePauw UniversityEarlham CollegeFranklin CollegeGoshen CollegeGrace College and SeminaryHanover CollegeHuntington UniversityIndiana Wesleyan UniversityManchester UniversityMarian UniversitySaint Joseph’s CollegeSaint Mary’s CollegeSaint Mary-of-the-Woods CollegeTaylor UniversityTrine UniversityUniversity of EvansvilleUniversity of IndianapolisUniversity of Saint FrancisValparaiso UniversityWabash College
Public:
Ball State University*Indiana State University*Indiana University-Bloomington*Indiana University-EastIndiana University-Kokomo
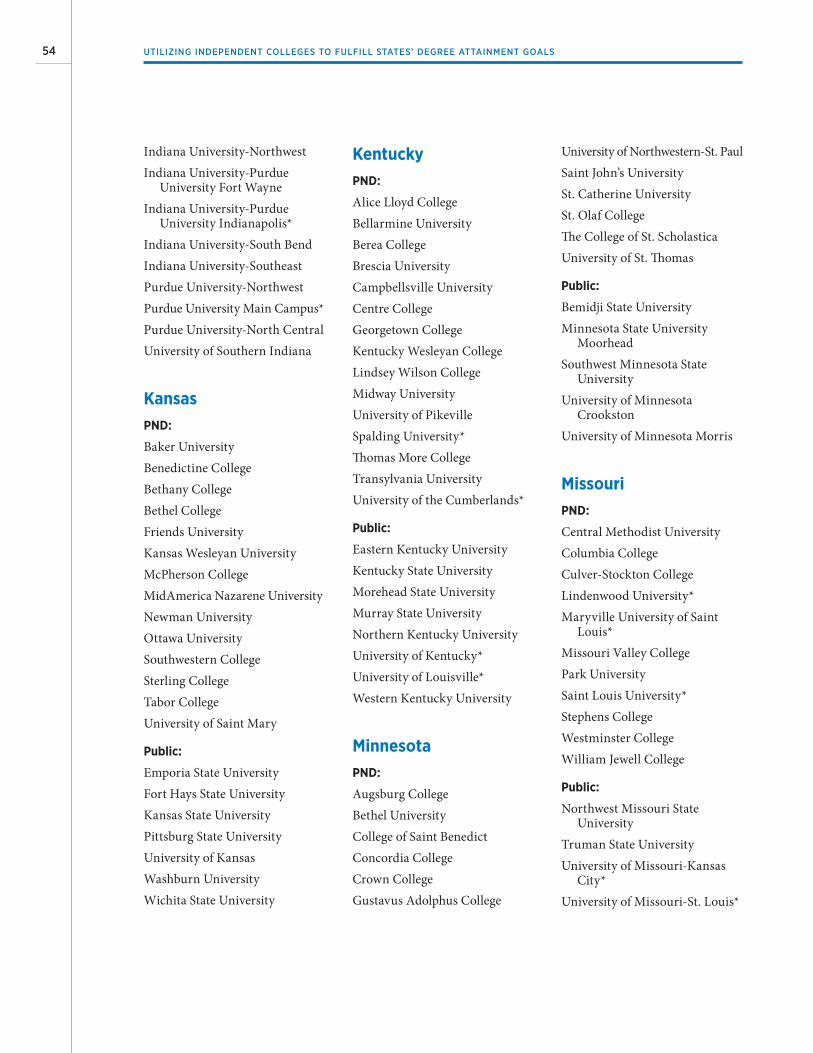
54 UTILIZING INDEPENDENT COLLEGES TO FULFILL STATES’ DEGREE ATTAINMENT GOALS
Indiana University-NorthwestIndiana University-Purdue
University Fort WayneIndiana University-Purdue
University Indianapolis*Indiana University-South BendIndiana University-SoutheastPurdue University-NorthwestPurdue University Main Campus*Purdue University-North Central University of Southern Indiana
KansasPND:
Baker UniversityBenedictine CollegeBethany CollegeBethel CollegeFriends UniversityKansas Wesleyan UniversityMcPherson CollegeMidAmerica Nazarene UniversityNewman UniversityOttawa UniversitySouthwestern CollegeSterling CollegeTabor CollegeUniversity of Saint Mary
Public:
Emporia State UniversityFort Hays State UniversityKansas State UniversityPittsburg State UniversityUniversity of KansasWashburn UniversityWichita State University
KentuckyPND:
Alice Lloyd CollegeBellarmine UniversityBerea CollegeBrescia UniversityCampbellsville UniversityCentre CollegeGeorgetown CollegeKentucky Wesleyan CollegeLindsey Wilson CollegeMidway UniversityUniversity of PikevilleSpalding University*Thomas More CollegeTransylvania UniversityUniversity of the Cumberlands*
Public:
Eastern Kentucky UniversityKentucky State UniversityMorehead State UniversityMurray State UniversityNorthern Kentucky UniversityUniversity of Kentucky*University of Louisville*Western Kentucky University
MinnesotaPND:
Augsburg CollegeBethel UniversityCollege of Saint BenedictConcordia CollegeCrown CollegeGustavus Adolphus College
University of Northwestern-St. PaulSaint John’s UniversitySt. Catherine UniversitySt. Olaf CollegeThe College of St. ScholasticaUniversity of St. Thomas
Public:
Bemidji State UniversityMinnesota State University
MoorheadSouthwest Minnesota State
UniversityUniversity of Minnesota
CrookstonUniversity of Minnesota Morris
MissouriPND:
Central Methodist UniversityColumbia CollegeCulver-Stockton CollegeLindenwood University*Maryville University of Saint
Louis*Missouri Valley CollegePark UniversitySaint Louis University*Stephens CollegeWestminster CollegeWilliam Jewell College
Public:
Northwest Missouri State University
Truman State UniversityUniversity of Missouri-Kansas
City*University of Missouri-St. Louis*
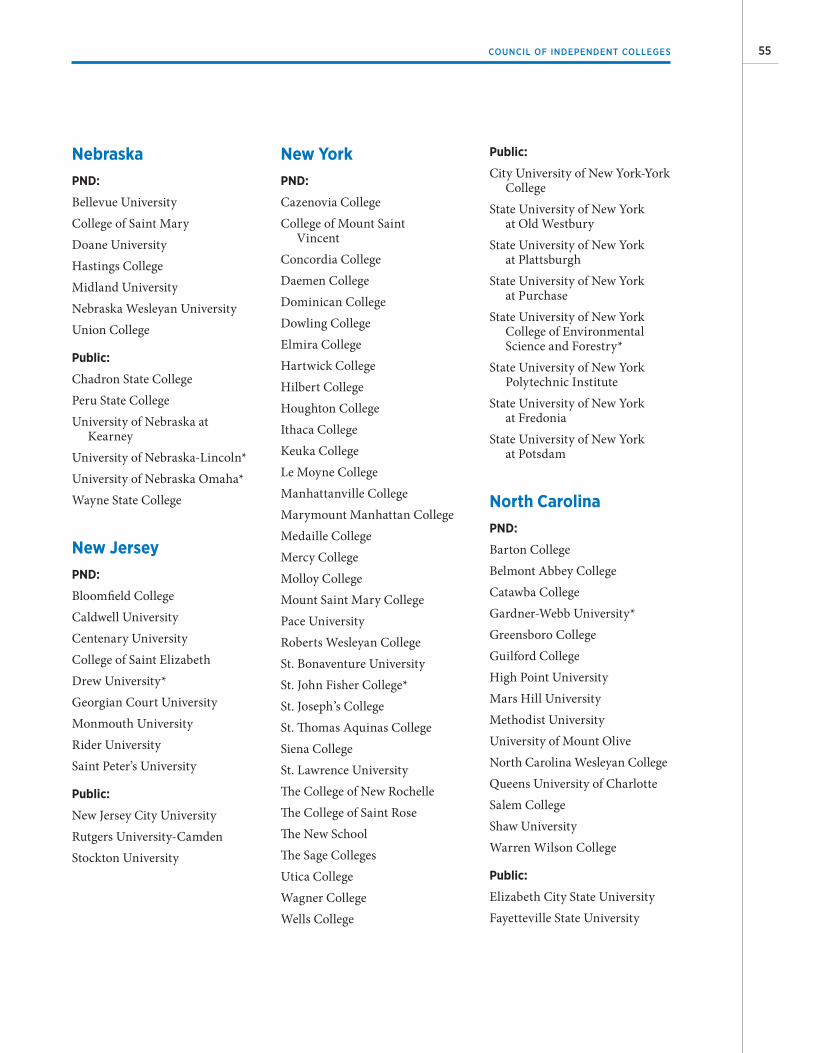
55 COUNCIL OF INDEPENDENT COLLEGES
NebraskaPND:
Bellevue UniversityCollege of Saint MaryDoane UniversityHastings CollegeMidland UniversityNebraska Wesleyan UniversityUnion College
Public:
Chadron State CollegePeru State CollegeUniversity of Nebraska at
KearneyUniversity of Nebraska-Lincoln*University of Nebraska Omaha*Wayne State College
New JerseyPND:
Bloomfield CollegeCaldwell UniversityCentenary UniversityCollege of Saint ElizabethDrew University*Georgian Court UniversityMonmouth UniversityRider UniversitySaint Peter’s University
Public:
New Jersey City UniversityRutgers University-CamdenStockton University
New YorkPND:
Cazenovia CollegeCollege of Mount Saint
VincentConcordia CollegeDaemen CollegeDominican CollegeDowling CollegeElmira CollegeHartwick CollegeHilbert CollegeHoughton CollegeIthaca CollegeKeuka CollegeLe Moyne CollegeManhattanville CollegeMarymount Manhattan CollegeMedaille CollegeMercy CollegeMolloy CollegeMount Saint Mary CollegePace UniversityRoberts Wesleyan CollegeSt. Bonaventure UniversitySt. John Fisher College*St. Joseph’s College St. Thomas Aquinas CollegeSiena CollegeSt. Lawrence UniversityThe College of New RochelleThe College of Saint RoseThe New SchoolThe Sage CollegesUtica CollegeWagner CollegeWells College
Public:
City University of New York-York College
State University of New York at Old Westbury
State University of New York at Plattsburgh
State University of New York at Purchase
State University of New York College of Environmental Science and Forestry*
State University of New York Polytechnic Institute
State University of New York at Fredonia
State University of New York at Potsdam
North CarolinaPND:
Barton CollegeBelmont Abbey CollegeCatawba CollegeGardner-Webb University*Greensboro CollegeGuilford CollegeHigh Point UniversityMars Hill UniversityMethodist UniversityUniversity of Mount OliveNorth Carolina Wesleyan CollegeQueens University of CharlotteSalem CollegeShaw UniversityWarren Wilson College
Public:
Elizabeth City State UniversityFayetteville State University

56 UTILIZING INDEPENDENT COLLEGES TO FULFILL STATES’ DEGREE ATTAINMENT GOALS
University of North Carolina at Asheville
Western Carolina University
OhioPND:
Ashland University*Baldwin Wallace CollegeBluffton UniversityCapital UniversityCedarville UniversityMount St. Joseph UniversityDefiance CollegeDenison UniversityFranciscan University of
SteubenvilleHeidelberg UniversityHiram CollegeJohn Carroll UniversityKenyon CollegeLake Erie CollegeLourdes UniversityMalone UniversityMarietta CollegeMount Vernon Nazarene UniversityMuskingum UniversityNotre Dame CollegeOberlin CollegeOhio Dominican UniversityOhio Northern UniversityOhio Wesleyan UniversityOtterbein UniversityThe College of WoosterThe University of FindlayUniversity of Mount UnionUniversity of Rio GrandeUrbana UniversityUrsuline CollegeWalsh University
Wilberforce UniversityWilmington CollegeWittenberg University
Public:
Bowling Green State University*Central State UniversityCleveland State University*Kent State University-Main
Campus*Miami University*Ohio State University, Lima CampusOhio University*Shawnee State UniversityThe Ohio State University*The University of Akron*University of Cincinnati*University of Toledo*Wright State University*Youngstown State University
OregonPND:
Corban UniversityGeorge Fox UniversityLewis & Clark CollegeLinfield CollegeMarylhurst UniversityNorthwest Christian UniversityPacific UniversityWarner Pacific CollegeWillamette University
Public:
Eastern Oregon UniversityOregon State University*Portland State University*Southern Oregon UniversityUniversity of Oregon*Western Oregon University
PennsylvaniaPND:
Albright CollegeAllegheny CollegeAlvernia UniversityArcadia UniversityBucknell UniversityCabrini UniversityCarlow UniversityCedar Crest CollegeChestnut Hill CollegeDeSales UniversityDelaware Valley UniversityDuquesne University*Eastern UniversityElizabethtown CollegeGannon UniversityGeneva CollegeGettysburg CollegeGrove City CollegeGwynedd Mercy UniversityHoly Family UniversityImmaculata University*Juniata CollegeKing’s CollegeLa Roche CollegeLafayette CollegeLebanon Valley CollegeLycoming CollegeMarywood UniversityMercyhurst UniversityMessiah CollegeMisericordia UniversityMoravian College Muhlenberg CollegeNeumann UniversityPoint Park UniversityRobert Morris University*
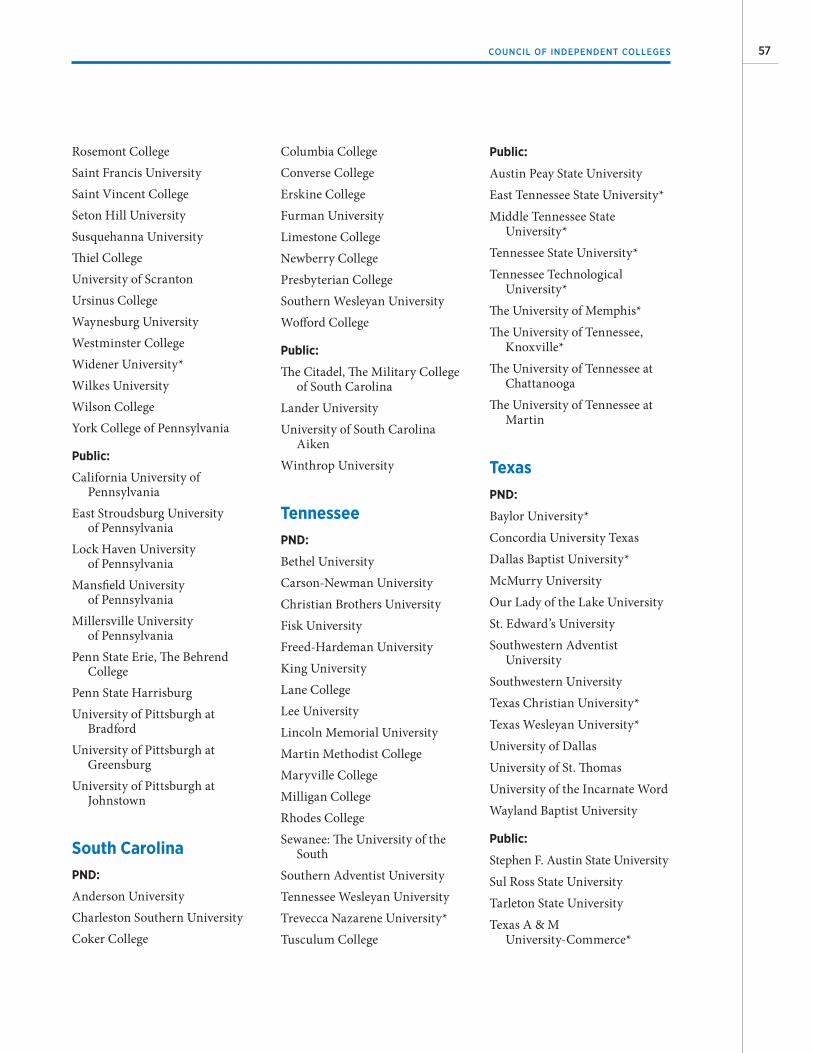
57 COUNCIL OF INDEPENDENT COLLEGES
Rosemont CollegeSaint Francis UniversitySaint Vincent CollegeSeton Hill UniversitySusquehanna UniversityThiel CollegeUniversity of ScrantonUrsinus CollegeWaynesburg UniversityWestminster CollegeWidener University*Wilkes UniversityWilson CollegeYork College of Pennsylvania
Public:
California University of Pennsylvania
East Stroudsburg University of Pennsylvania
Lock Haven University of Pennsylvania
Mansfield University of Pennsylvania
Millersville University of Pennsylvania
Penn State Erie, The Behrend College
Penn State HarrisburgUniversity of Pittsburgh at
BradfordUniversity of Pittsburgh at
GreensburgUniversity of Pittsburgh at
Johnstown
South CarolinaPND:
Anderson UniversityCharleston Southern UniversityCoker College
Columbia CollegeConverse CollegeErskine CollegeFurman UniversityLimestone CollegeNewberry CollegePresbyterian CollegeSouthern Wesleyan UniversityWofford College
Public:
The Citadel, The Military College of South Carolina
Lander UniversityUniversity of South Carolina
AikenWinthrop University
TennesseePND:
Bethel UniversityCarson-Newman UniversityChristian Brothers UniversityFisk UniversityFreed-Hardeman UniversityKing UniversityLane CollegeLee UniversityLincoln Memorial UniversityMartin Methodist CollegeMaryville CollegeMilligan CollegeRhodes CollegeSewanee: The University of the
SouthSouthern Adventist UniversityTennessee Wesleyan UniversityTrevecca Nazarene University*Tusculum College
Public:
Austin Peay State UniversityEast Tennessee State University*Middle Tennessee State
University*Tennessee State University*Tennessee Technological
University*The University of Memphis*The University of Tennessee,
Knoxville*The University of Tennessee at
ChattanoogaThe University of Tennessee at
Martin
TexasPND:
Baylor University*Concordia University TexasDallas Baptist University*McMurry UniversityOur Lady of the Lake UniversitySt. Edward’s UniversitySouthwestern Adventist
UniversitySouthwestern UniversityTexas Christian University*Texas Wesleyan University*University of DallasUniversity of St. ThomasUniversity of the Incarnate WordWayland Baptist University
Public:
Stephen F. Austin State UniversitySul Ross State UniversityTarleton State UniversityTexas A & M
University-Commerce*
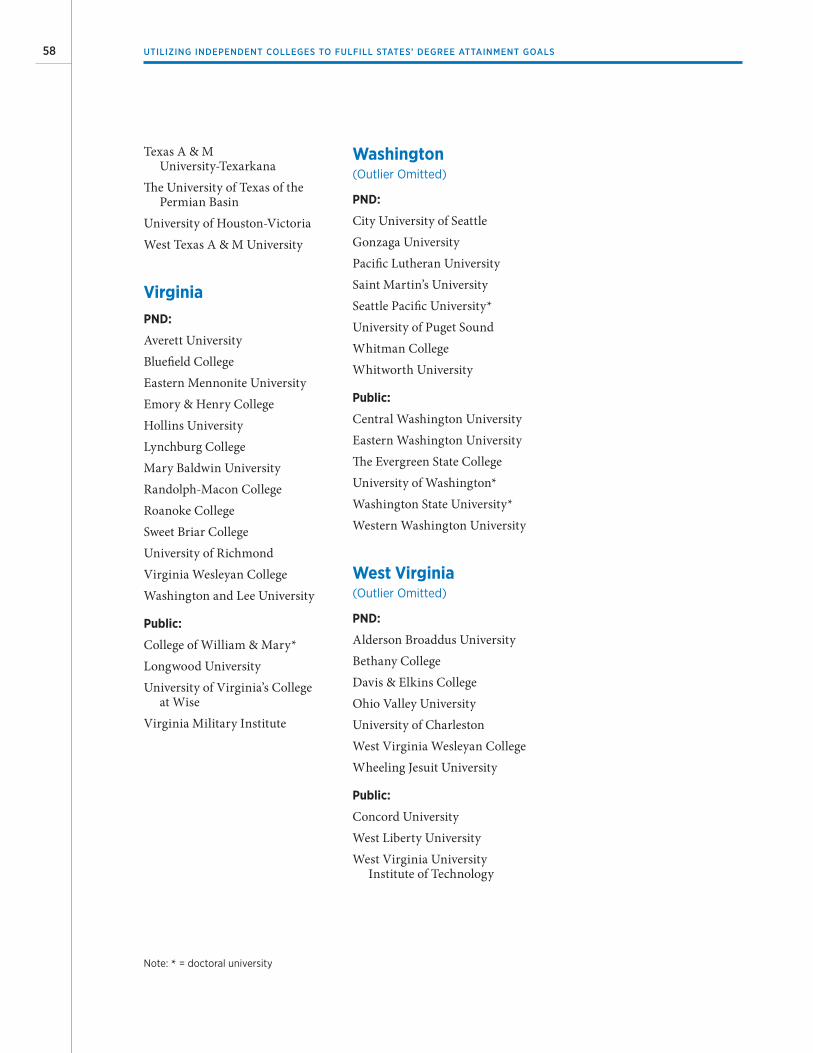
58 UTILIZING INDEPENDENT COLLEGES TO FULFILL STATES’ DEGREE ATTAINMENT GOALS
Texas A & M University-Texarkana
The University of Texas of the Permian Basin
University of Houston-VictoriaWest Texas A & M University
VirginiaPND:
Averett UniversityBluefield CollegeEastern Mennonite UniversityEmory & Henry CollegeHollins UniversityLynchburg CollegeMary Baldwin UniversityRandolph-Macon CollegeRoanoke CollegeSweet Briar CollegeUniversity of RichmondVirginia Wesleyan CollegeWashington and Lee University
Public:
College of William & Mary*Longwood UniversityUniversity of Virginia’s College
at WiseVirginia Military Institute
Washington (Outlier Omitted)
PND:
City University of SeattleGonzaga UniversityPacific Lutheran UniversitySaint Martin’s UniversitySeattle Pacific University*University of Puget SoundWhitman CollegeWhitworth University
Public:
Central Washington UniversityEastern Washington UniversityThe Evergreen State CollegeUniversity of Washington*Washington State University*Western Washington University
West Virginia (Outlier Omitted)
PND:
Alderson Broaddus UniversityBethany CollegeDavis & Elkins CollegeOhio Valley UniversityUniversity of CharlestonWest Virginia Wesleyan CollegeWheeling Jesuit University
Public:
Concord UniversityWest Liberty UniversityWest Virginia University
Institute of Technology
Note: * = doctoral university

59
Allen, R. F., and J. Shen. 1999. “Some New Evidence of the Character of Competition among Higher Education Institutions.” Economics of Education Review, 18(4), 465–470.
Althauser, R. P., and D. Rubin. 1970. “The Computerized Construction of a Matched Sample.” American Journal of Sociology, 76(2), 325–346.
Bransberger, P., and D. K. Michelau. 2016. Knocking at the College Door: Projections of High School Graduates. Boulder, CO: Western Interstate Commission for Higher Education.
Buss, C., J. Parker, and J. Rivenburg. 2004. “Cost, Quality and Enrollment Demand at Liberal Arts Colleges.” Economics of Education Review, 23(1), 57–65.
Curs, B., and L. D. Singell. 2002. “An Analysis of the Application and Enrollment Processes for In-State and Out-of-State Students at a Large Public University. ” Economics of Education Review, 21(2), 111–124.
Lunt, M. 2014. “Selecting an Appropriate Caliper Can Be Essential for Achieving Good Balance with Propensity Score Matching.” American Journal of Epidemiology, 179(2), 226–235.
National Association of State Student Grant and Aid Programs. 2016. 46th Annual Survey Report on State-Sponsored Student Financial Aid 2014–2015 Academic Year.
Paulien and Associates. 2011. Utah System of Higher Education, Higher Education Space Standards Study. Denver, CO: Paulien & Associates, Inc.
Steiner, P. M., and D. Cook. 2013. “Matching and Propensity Scores.” In The Oxford Handbook of Quantitative Methods in Psychology Vol. 1, edited by T. D. Little. New York, NY: Oxford University Press.
University of Washington. 2007. Preliminary Academic Plan for the UW North Sound Campus: A Report to Governor Christine Gregoire and the Washington State Legislature. Seattle, WA: University of Washington.
van der Klaauw, W. 2002. “Estimating the Effect of Financial Aid Offers on College Enrollment: A Regression Discontinuity Approach.” International Economic Review, 43(4), 1249–1287.
Zumeta, W. 1999. “Utilizing Private Higher Education for Public Purposes: Policy Design Challenges Facing Efforts to Help Meet Higher Education Access Demands through the Private Sector.” In The Substance of Public Policy, edited by S. Nagel. Commack, NY: Nova Science.
Zumeta, W., and N. Huntington-Klein. 2015. The Cost-Effectiveness of Undergraduate Education at Private Nondoctoral Colleges and Universities: Implications for Students and Public Policy. Washington, DC: Council of Independent Colleges.
References

60
Project on the Future of Independent Higher Education
Steering Committee Member Presidents
Chris Kimball, California Lutheran University (Chair)
Steven C. Bahls, Augustana College (IL)
Ronald L. Carter, Johnson C. Smith University
Roger N. Casey, McDaniel College
Jeffrey R. Docking, Adrian College
Margaret L. Drugovich, Hartwick College
Elizabeth A. Fleming, Converse College (Retired)
Thomas F. Flynn, Alvernia University
Christopher B. Howard, Robert Morris University
Todd S. Hutton, Utica College (Retired)
Walter M. Kimbrough, Dillard University
Larry D. Large, Oregon Alliance of Independent Colleges and Universities (Retired)
Paul J. LeBlanc, Southern New Hampshire University
Mary B. Marcy, Dominican University of California
John McCardell, Sewanee: The University of the South
Kevin M. Ross, Lynn University
Ed L. Schrader, Brenau University
Elizabeth J. Stroble, Webster University
Henry N. Tisdale, Claflin University
Edwin H. Welch, University of Charleston
John S. Wilson, Morehouse College
Cynthia Zane, Hilbert College
Securing America’s Future: The Power of Liberal Arts Education
Advisory Committee Members
William L. Fox, President, St. Lawrence University (Chair)
Brian Eckert, Executive Director of Communications and Public Affairs, Washington and Lee University
Brad Harsha, Dean of Admissions and Financial Aid, Defiance College
Chris Kimball, President, California Lutheran University
L. Jay Lemons, President, Susquehanna University
Tom Morris, President, Virginia Foundation for Independent Colleges (Retired)
S. Georgia Nugent, Senior Fellow, CIC, and President Emerita, Kenyon College
Michele D. Perkins, President, New England College
Carolyn J. Stefanco, President, The College of Saint Rose
Haywood Strickland, President, Wiley College
Karl Stumo, Vice President for Enrollment and Marketing, Concordia College (MN)
Eileen Wilson-Oyelaran, President, Kalamazoo College (Retired)
Steering Committees for CIC Initiatives
Other Reports in This Series
This research report is part of a series that explores the distinctive elements of indepen-dent higher education and the liberal arts educational experience. These research reports have been commissioned to support two CIC initiatives: The Project on the Future of Independent Higher Education and Securing America’s Future: The Power of Liberal Arts Education, a public information campaign. Other reports in the series include:.
Expanding Access and Opportunity: How Small and Mid-Sized Independent Colleges Serve First-Generation and Low-Income Students (CIC staff, March 2015)
Independent Colleges and Student Engagement: Descriptive Analysis by Institutional Type (Robert M. Gonyea and Jillian Kinzie, June 2015)
Mission-Driven Innovation: An Empirical Study of Adaptation and Change among Independent Colleges (James C. Hearn and Jarrett B. Warshaw, July 2015)
Cost-Effectiveness of Undergraduate Education at Private Nondoctoral Colleges and Universities: Implications for Students and Public Policy (William M. Zumeta and Nick Huntington-Klein, September 2015)
Strategic Change and Innovation in Independent Colleges: Nine Mission-Driven Campuses (James C. Hearn, Jarrett B. Warshaw, and Erin B. Ciarimboli, April 2016)
Changes in Faculty Composition at Independent Colleges (Christopher Morphew, Kelly Ward, and Lisa Wolf-Wendel, June 2016)
Research reports and other CIC research projects on the future of independent higher education may be downloaded from www.cic.edu/ResearchFuture.

One Dupont Circle, NW, Suite 320
Washington, DC 20036-1142
Phone (202) 466-7230 • Fax (202) 466-7238
www.cic.edu