Utilization of Z Codes for Social Determinants of Health ...
28
DATA HIGHLIGHT NO. 24 |SEPTEMBER 2021 Utilization of Z Codes for Social Determinants of Health among Medicare Fee-for-Service Beneficiaries, 2019 Background Healthy People 2030 defines social determinants of health as “the conditions in the environments where people are born, live, learn, work, play, worship, and age that affect a wide range of health, functioning, and quality-of-life outcomes and risks.” These determinants are now widely recognized as important predictors of access to and engagement in health care, as well as health outcomes (Artiga & Hinton, 2018). Positive social, as well as economic and environmental, conditions are associated with a wide array of positive or improved patient medical outcomes and lower or reduced costs, while worse conditions negatively affect health and health-related outcomes, e.g. hospital readmissions rates, length of hospital stay, and use of post-acute care services (Green & Zook, 2019; Kangovi, Shreya, & Grande, 2011; Virapongse & Misky, 2018). According to the 2016 National Academies of Medicine (NAM) report (Adler et al., 2016), the collection of social, economic, and environmental data in an electronic health record (EHR) format is necessary to empower providers to identify and track psychosocial and economic hardships faced by their patients. The collection of these data will also support further research into various social determinants of health and resulting health inequalities. Past-published literature on coding practices in ambulatory care identified challenges to consistent data collection of social determinants of health information (Cantor & Thorpe, 2018). Examples of barriers to data collection included the non-existence of a standardized EHR-based screening tool, the multiplicity of codes, and the lack of knowledge among providers and medical coding professionals alike (Gottlieb et al., 2016). Improving provider and medical coder education related to the effects of social, economic, and environmental contexts on health, as well as filling gaps in codes, would likely improve the reporting of these issues across care settings. The International Classification of Diseases, Tenth Revision, Clinical Modification (ICD-10-CM) psychosocial risk and economic Key Findings: Among the 33.1 million continuously enrolled Medicare FFS beneficiaries in 2019, 1.59% had claims with Z codes, as compared to 1.31% in 2016. The 5 most utilized Z codes were: 1) Z59.0 Homelessness 2) Z63.4 Disappearance and death of family member 3) Z60.2 Problems related to living alone 4) Z59.3 Problems related to living in a residential institution 5) Z63.0 Problems in relationship with spouse or partner Beneficiaries dually eligible for Medicare and full-benefit Medicaid were overrepresented among the top 5 Z code claims. Beneficiaries in rural areas were overrepresented (39.7%) among those with a Z59.3 – Problems related to living in a residential institution claim. Male beneficiaries who accounted for 45.4% of the overall FFS population represented 67.1% of those with a Z59.0 – Homelessness claim. Black and Hispanic beneficiaries accounted for 8.8% and 5.9% of the overall FFS population, respectively, but represented 24.8% and 9.2%, respectively, of those with a Z59.0 – Homelessness claim. Most (49.6%) Z codes were billed on Medicare Part B non- institutional claims. The top 5 provider types representing the largest proportions of Z codes were family practice physicians (15%), internal medicine physicians (14%), nurse practitioners (14%), psychiatry physicians (13%), and licensed clinical social workers (12%).
Transcript of Utilization of Z Codes for Social Determinants of Health ...

DATA HIGHLIGHT NO. 24 |SEPTEMBER 2021
Utilization of Z Codes for Social Determinants of Health among Medicare Fee-for-Service Beneficiaries, 2019 Background Healthy People 2030 defines social determinants of health as “the conditions in the environments where people are born, live, learn, work, play, worship, and age that affect a wide range of health, functioning, and quality-of-life outcomes and risks.” These determinants are now widely recognized as important predictors of access to and engagement in health care, as well as health outcomes (Artiga & Hinton, 2018). Positive social, as well as economic and environmental, conditions are associated with a wide array of positive or improved patient medical outcomes and lower or reduced costs, while worse conditions negatively affect health and health-related outcomes, e.g. hospital readmissions rates, length of hospital stay, and use of post-acute care services (Green & Zook, 2019; Kangovi, Shreya, & Grande, 2011; Virapongse & Misky, 2018). According to the 2016 National Academies of Medicine (NAM) report (Adler et al., 2016), the collection of social, economic, and environmental data in an electronic health record (EHR) format is necessary to empower providers to identify and track psychosocial and economic hardships faced by their patients. The collection of these data will also support further research into various social determinants of health and resulting health inequalities.
Past-published literature on coding practices in ambulatory care identified challenges to consistent data collection of social determinants of health information (Cantor & Thorpe, 2018). Examples of barriers to data collection included the non-existence of a standardized EHR-based screening tool, the multiplicity of codes, and the lack of knowledge among providers and medical coding professionals alike (Gottlieb et al., 2016). Improving provider and medical coder education related to the effects of social, economic, and environmental contexts on health, as well as filling gaps in codes, would likely improve the reporting of these issues across care settings. The International Classification of Diseases, Tenth Revision, Clinical Modification (ICD-10-CM) psychosocial risk and economic
Key Findings: Among the 33.1 million continuously enrolled Medicare FFS beneficiaries in 2019, 1.59% had claims with Z codes, as compared to 1.31% in 2016. The 5 most utilized Z codes were: 1) Z59.0 Homelessness 2) Z63.4 Disappearance and
death of family member 3) Z60.2 Problems related to
living alone 4) Z59.3 Problems related
to living in a residential institution
5) Z63.0 Problems in relationship with spouse or partner
Beneficiaries dually eligible for Medicare and full-benefit Medicaid were overrepresented among the top 5 Z code claims. Beneficiaries in rural areas were overrepresented (39.7%) among those with a Z59.3 – Problems related to living in a residential institution claim. Male beneficiaries who accounted for 45.4% of the overall FFS population represented 67.1% of those with a Z59.0 – Homelessness claim. Black and Hispanic beneficiaries accounted for 8.8% and 5.9% of the overall FFS population, respectively, but represented 24.8% and 9.2%, respectively, of those with a Z59.0 – Homelessness claim. Most (49.6%) Z codes were billed on Medicare Part B non-institutional claims. The top 5 provider types representing the largest proportions of Z codes were family practice physicians (15%), internal medicine physicians (14%), nurse practitioners (14%), psychiatry physicians (13%), and licensed clinical social workers (12%).

determinant-related codes (i.e., “Z codes”) can be used to capture standardized information on social determinants of health.
Z codes (i.e., Z55-Z65; see below) are a set of ICD-10-CM codes (see here for the Centers for Disease Control and Prevention (CDC)’s National Center for Health Statistics (NCHS)’s ICD-10-CM Browser Tool) used to report social, economic, and environmental determinants known to affect health and health-related outcomes (Weeks, Cao, Lester, Weinstein, & Morden, 2020). Z codes are a tool for identifying a range of issues related – but not limited – to education and literacy, employment, housing, ability to obtain adequate amounts of food or safe drinking water, and occupational exposure to toxic agents, dust, or radiation. Z codes can be used in any health setting (e.g., doctor’s office, hospital, skilled nursing facility (SNF) and by any provider (e.g., physician, nurse practitioner). As shown below, there are nine broad categories of Z codes that represent various hazardous social, economic, and environmental conditions, each with several sub-codes (refer to Appendix Table 1A for the full list of Z codes included in the analyses).
This data highlight provides an update to the past-published data highlight focused on Z code claims for Medicare fee-for-service (FFS) beneficiaries in 2017 (Mathew, Hodge, & Khau, 2020). The study objectives are as follows:
(1) Describe the number of total Z code claims and the proportion of continuously enrolled beneficiaries with Z code claims in 2016, 2017, 2018, and 2019.
(2) Report the top five most utilized Z codes in 2019.
(3) Describe the proportions of beneficiaries with Z codes across various sociodemographic characteristics, including dual eligibility status for Medicare and Medicaid, age, sex, and race and ethnicity, as well as the proportions of beneficiaries with Z codes across urban/rural strata.
(4) Characterize the top five states with the largest shares of all Z code claims as well as proportion of Z code claims by claim type, service category, and provider/supplier type.
(5) Highlight potential strategies that may aid in increasing utilization of Z codes representing key social, environmental, and economic risks to health.
DATA HIGHLIGHT | SEPTEMBER 2021Paid for by the U.S. Department of Health and Human Services.
2
Methods Medicare claims and enrollment data used in this study were obtained from the CMS Chronic Condition Data Warehouse (CCW) (www.ccwdata.org). Within the CCW environment, SAS Enterprise Guide (V.7.15; SAS, Cary, NC USA) was used to produce Z code utilization, claims type, and service category characteristics statistics, as well as beneficiary sociodemographic and clinical characteristics statistics.
We used complete Medicare FFS claims data in the Geographic Variation Database (GVDB), which covers both Medicare Part A inpatient hospital care, post-acute care (e.g. skilled nursing facility care, home health) and hospice care, and Medicare Part B, which primarily covers physician services, outpatient hospital care, and durable medical equipment, to identify beneficiaries with ICD-10-CM diagnosis codes within the Z55-65 range related to adverse psychosocial or economic circumstances (Guo et al., 2020).
The CCW contains a unique beneficiary identifier (i.e. “bene ID”) that was used to link claims files with individual-level beneficiary files containing demographic (e.g. age, gender, race and ethnicity [as determined by the Research Triangle Institute (RTI) Race Code [Eicheldinger & Bonito, 2008]), enrollment, and clinical (e.g. chronic condition) characteristics data. Further, only those beneficiaries who had Medicare Part A and Part B FFS coverage for the entire portion of the year they were enrolled in Medicare (i.e. N=33,172,987/64,450,729) were examined. Of note, Medicare FFS enrollment has decreased from 33.7 million in 2017 to 33.1 million in 2019, while Medicare Advantage enrollment has increased over time.
While 2016, 2017, and 2018 Medicare FFS claims data were analyzed and reported in Figure 1, the focus of this data highlight is on the most recent data from 2019. Results from 2019 were considered preliminary at the time of this analysis, as the data were not fully complete due to a “claims lag” between when a service occurs and when the claim is collected by CMS and, ultimately, appears in the CCW database. The length of the lag depends on the service type and program; historically, 90% of Medicare FFS claims across all claim types are submitted within the three months following the service date. However, providers have a maximum of 12 months (or one full calendar year) after services are provided to file a claim.
In this analysis, we first reported on the number of total Z code claims and the proportion of continuously enrolled beneficiaries with Z code claims in 2016, 2017, 2018, and 2019 (Figures 1 and 2), followed by the top five most utilized Z codes in 2019 (Figure 3). After identifying the top five most often utilized Z codes, we then reported the proportions of beneficiaries with Z codes across various sociodemographic characteristics, including dual eligibility status for Medicare and Medicaid, age, sex, and race and ethnicity (Figures 4-8). We also reported on proportions of beneficiaries with Z codes across urban/rural strata (Figure 9). Finally, we characterized the top five states with the largest shares of all Z code claims (Figure 10), followed by the proportion of Z code claims by claim type (i.e. Medicare Part A, Part B Institutional, and Part B Non-institutional) and then further broken down by service category (Figures 11 and 12). The top five Medicare Specialty Codes and accompanying provider/supplier types for Part B Non-institutional providers with the largest shares of all Z code claims were also examined (Figure 13).
All analyses were performed from September 2020 through December 2020.
DATA HIGHLIGHT | SEPTEMBER 2021Paid for by the U.S. Department of Health and Human Services.
3

Results
Overall Figure 1. Change in Total Number of Z Code Claims, 2016 to 2019.
The total number of Z code claims was 945,755 in 2016, 1,039,790 in 2017, and 1,135,642 in 2018.
In 2019, there were 1,262,563 Z code claims, representing 0.11% of all FFS claims that year (N=1,124,319,144) and an increase of 95,852 (9.2%) from 2018 and an increase of 189,887 (20.1%) from 2016.
DATA HIGHLIGHT | SEPTEMBER 2021Paid for by the U.S. Department of Health and Human Services.
4

Figure 2. Change in Proportion of Medicare FFS Beneficiaries with Z Code Claims, 2016 to 2019.
The number of beneficiaries with Z code claims was 446,171 in 2016, 467,136 in 2017, 495,472 in 2018, and 525,987 in 2019.
There was an increase of 30,515 (6.2%) from 2018 to 2019 and an increase of 79,816 (17.9%) from 2016 to 2019.
DATA HIGHLIGHT | SEPTEMBER 2021Paid for by the U.S. Department of Health and Human Services.
5
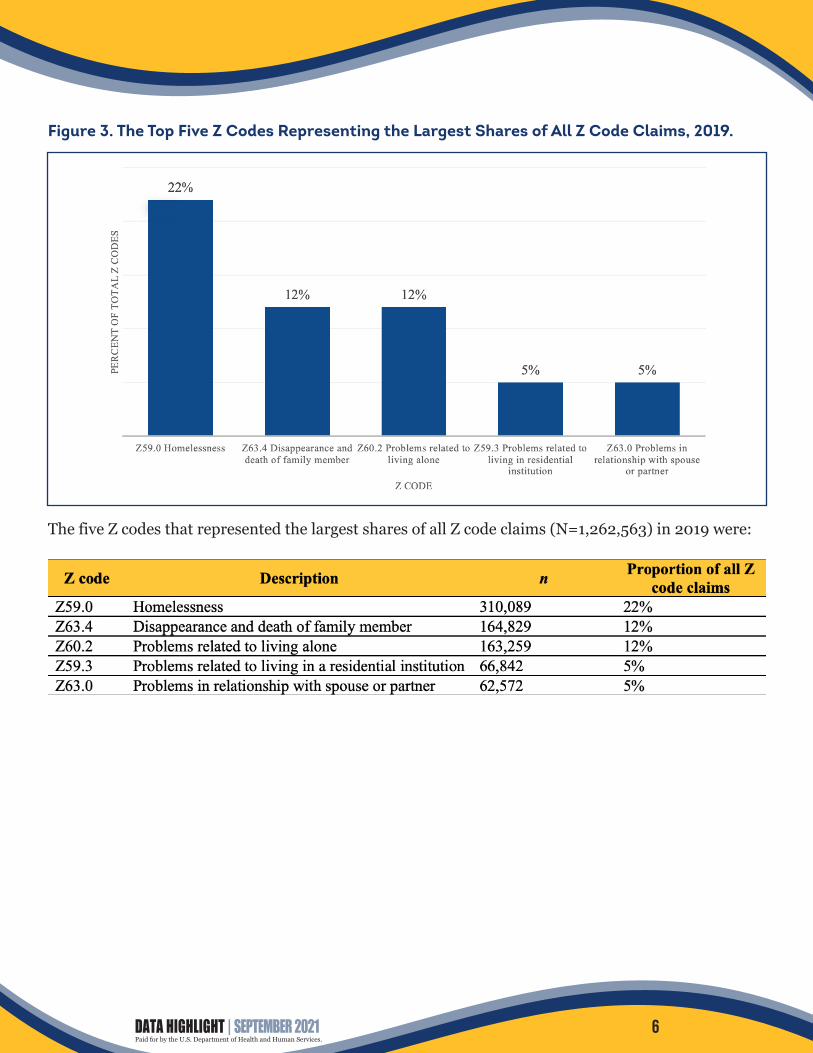
Figure 3. The Top Five Z Codes Representing the Largest Shares of All Z Code Claims, 2019.
The five Z codes that represented the largest shares of all Z code claims (N=1,262,563) in 2019 were:
DATA HIGHLIGHT | SEPTEMBER 2021Paid for by the U.S. Department of Health and Human Services.
6

Beneficiaries Figure 4. Proportion of Medicare FFS Beneficiaries with Z Code Claims by Original Reason for Medicare Entitlement, Any Z Code and Top Five Most Utilized Z Codes, 2019.
NOTE: Original reason for Medicare entitlement refers to the ways in which individuals first become eligible for Medicare benefits. Old age and survivors insurance (OASI) = monthly benefits to retired-worker beneficiaries and their spouses and children or to survivors of deceased insured workers; disability insurance benefits (DIB) = benefits to disabled workers and their dependents; end-stage renal disease (ESRD) = permanent kidney failure requiring dialysis or transplant.
The above figure and below table reports on the proportion of beneficiaries by original reason for Medicare entitlement: overall, for any Z code, and for each of the top five most utilized Z codes (i.e. Z59.0 – homelessness, Z63.4 – disappearance and death of a family member, Z60.2 – problems related to living alone, Z59.3 – problems related to living in a residential institution, and Z63.0 – problems in relationship with spouse or partner).
DATA HIGHLIGHT | SEPTEMBER 2021Paid for by the U.S. Department of Health and Human Services.
7

Relative to their share of the overall continuously enrolled Medicare FFS population, beneficiaries with OASI as their original reason for Medicare entitlement appear to be underrepresented among those with any Z code claim, as well as those with any of the top five Z codes. The opposite was true for beneficiaries with DIB as their original reason for Medicare entitlement who represented 22.1% of the overall population but 44.1% of beneficiaries with any Z code, claim, 76.3% of beneficiaries with a Z59.0 claim (homelessness), 34.5% of beneficiaries with a Z63.4 claim (disappearance and death of a family member), 35.8% of beneficiaries with a Z59.3 claim (problems related to living in a residential institution, and 45.1% of beneficiaries with a Z63.0 claim (problems in relationship with spouse or partner).
DATA HIGHLIGHT | SEPTEMBER 2021Paid for by the U.S. Department of Health and Human Services.
8

Figure 5. Proportion of Medicare FFS Beneficiaries with Z Code Claims across Dual Eligibility Status, Any Z Code and Top Five Most Utilized Z Codes, 2019.
NOTE: Fully eligible (“full”) = individuals enrolled in Medicare while also receiving full Medicaid benefits; not dually eligible (“non-dual”) = individuals not eligible for Medicare and Medicaid; partially dually eligible (“partial”) = Medicare beneficiaries receiving financial assistance for certain Medicare costs from their state Medicaid program who do not qualify for full Medicaid benefits from their state; Qualified Medicare Beneficiary (“QMB”) = an individual for which the government covers Medicare Part A and Part B premiums and cost sharing to low-income Medicare beneficiaries. Of note, beneficiaries were assigned to only one category.
The above figure and below table report on the proportion of beneficiaries by dual eligibility status (i.e. fully dually eligible, not dually eligible, partially dually eligible, and Qualified Medicare Beneficiary [QMB]): overall, for any Z code, and for each of the top five most utilized Z codes.
DATA HIGHLIGHT | SEPTEMBER 2021Paid for by the U.S. Department of Health and Human Services.
9

For three of the top five Z codes (i.e. Z63.4, Z59.3, and Z63.0), most beneficiaries were not dually eligible in terms of crude prevalence; however, fully dually eligible beneficiaries were all overrepresented among those with these three Z codes as compared to their share of the overall continuously enrolled Medicare FFS population in 2019 (i.e. 14.3% overall versus 21.1% for Z63.4, 19.9% for Z59.3, and 19.9% for Z63.0). For the remaining two Z codes (i.e. Z59.0 and Z60.2), fully dually eligible beneficiaries represented the majority (66.0% and 63.9%, respectively).
DATA HIGHLIGHT | SEPTEMBER 2021Paid for by the U.S. Department of Health and Human Services.
10

Figure 6. Proportion of Medicare FFS Beneficiaries with Z Code Claims across Age Groups, Any Z Code and Top Five Most Utilized Z Codes, 2019.
The above figure and below table report on the proportion of beneficiaries in each age group (i.e. <65 years, 65-74 years, 75-84 years, and ≥85 years groups): overall, for any Z code, and for each of the top five most utilized Z codes. While beneficiaries <65 years of age represented 14.2% of the overall Medicare FFS population in 2019, they appeared to be overrepresented among beneficiaries with any Z code claim as well as beneficiaries with either a Z59.0, Z63.4, Z59.3, or a Z63.0 claim. Further, beneficiaries who were ≥85 years of age appeared to be overrepresented among beneficiaries with either a Z60.2 or Z59.3 claim as compared to their share of the overall population.
DATA HIGHLIGHT | SEPTEMBER 2021Paid for by the U.S. Department of Health and Human Services.
11

Figure 7. Proportion of Medicare FFS Beneficiaries with Z Code Claims across Sex Groups, Any Z Code and Top Five Most Utilized Z Codes, 2019.
The above figure and below table report on the proportion of beneficiaries in each sex group (i.e. female, male), overall and for each of the top five most utilized Z codes (i.e. Z59.0 – homelessness, Z63.4 – disappearance and death of a family member, Z60.2 – problems related to living alone, Z59.3 – problems related to living in a residential institution, and Z63.0 – problems in relationship with spouse or partner). Relative to their share of the overall FFS population, beneficiaries who were female appear overrepresented among those with any Z code, Z63.4, Z60.2, Z59.3, and Z63.0. Beneficiaries who were male appear overrepresented among those with a Z59.0 – homelessness claim.
DATA HIGHLIGHT | SEPTEMBER 2021Paid for by the U.S. Department of Health and Human Services.
12
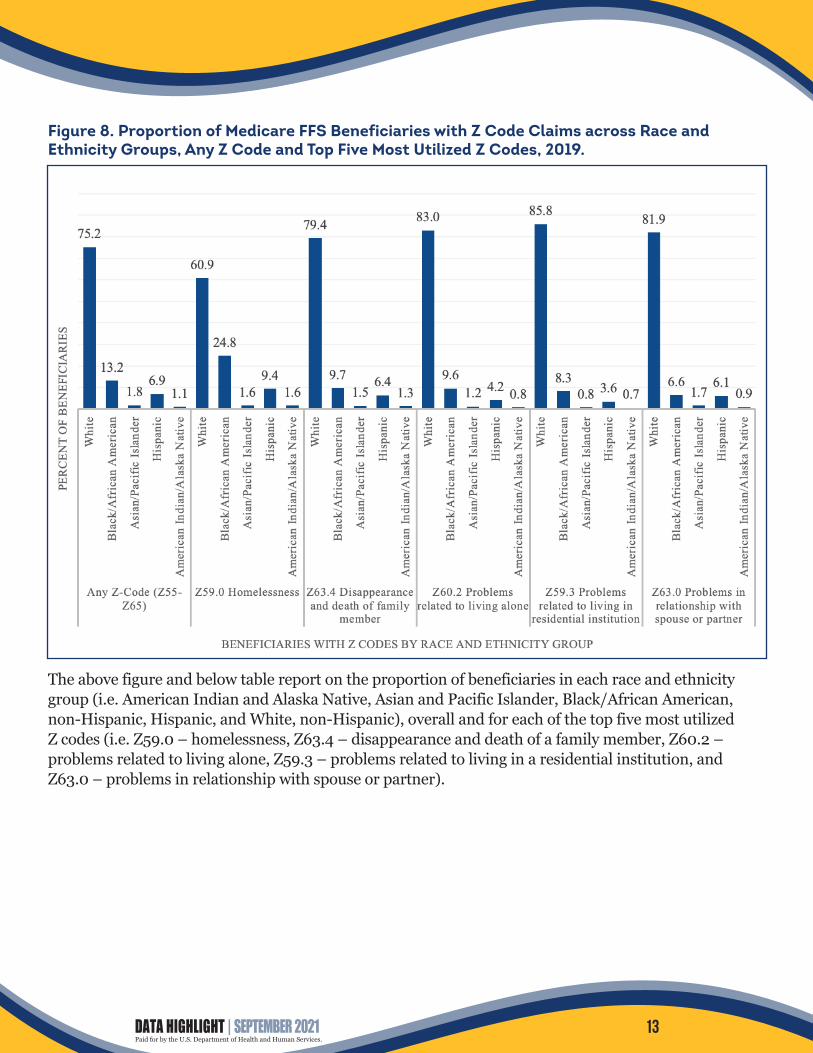
Figure 8. Proportion of Medicare FFS Beneficiaries with Z Code Claims across Race and Ethnicity Groups, Any Z Code and Top Five Most Utilized Z Codes, 2019.
The above figure and below table report on the proportion of beneficiaries in each race and ethnicity group (i.e. American Indian and Alaska Native, Asian and Pacific Islander, Black/African American, non-Hispanic, Hispanic, and White, non-Hispanic), overall and for each of the top five most utilized Z codes (i.e. Z59.0 – homelessness, Z63.4 – disappearance and death of a family member, Z60.2 – problems related to living alone, Z59.3 – problems related to living in a residential institution, and Z63.0 – problems in relationship with spouse or partner).
DATA HIGHLIGHT | SEPTEMBER 2021Paid for by the U.S. Department of Health and Human Services.
13
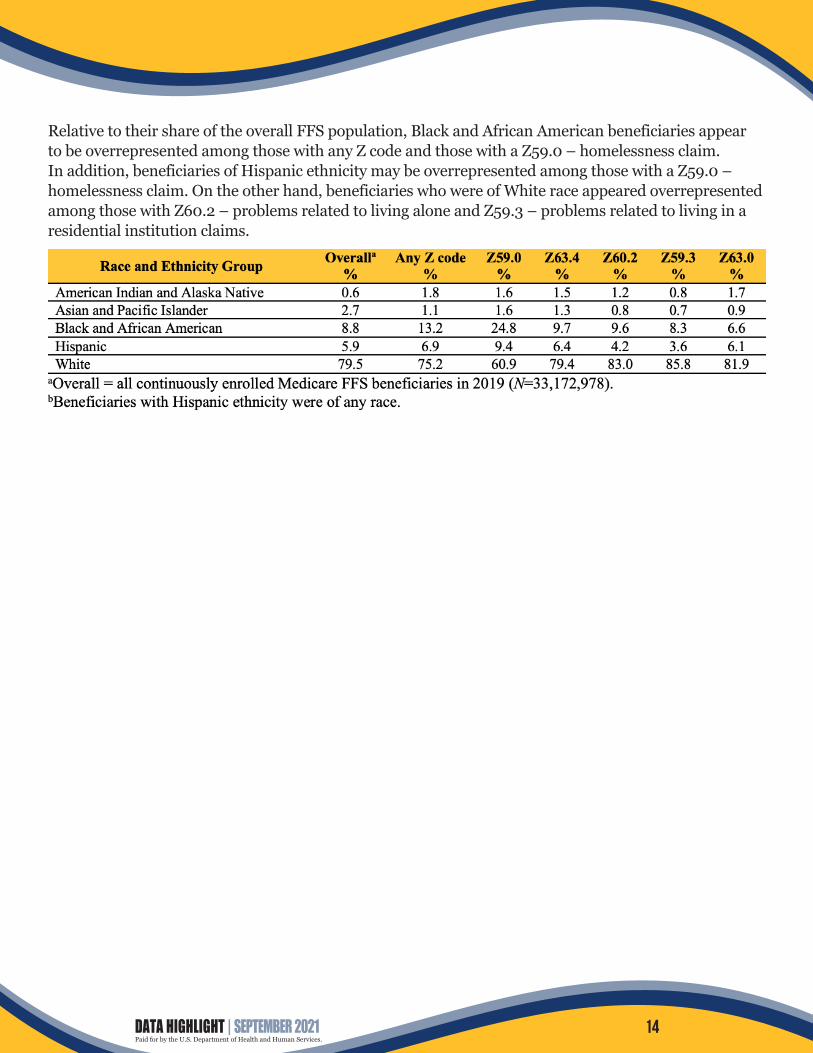
Relative to their share of the overall FFS population, Black and African American beneficiaries appear to be overrepresented among those with any Z code and those with a Z59.0 – homelessness claim. In addition, beneficiaries of Hispanic ethnicity may be overrepresented among those with a Z59.0 – homelessness claim. On the other hand, beneficiaries who were of White race appeared overrepresented among those with Z60.2 – problems related to living alone and Z59.3 – problems related to living in a residential institution claims.
DATA HIGHLIGHT | SEPTEMBER 2021Paid for by the U.S. Department of Health and Human Services.
14
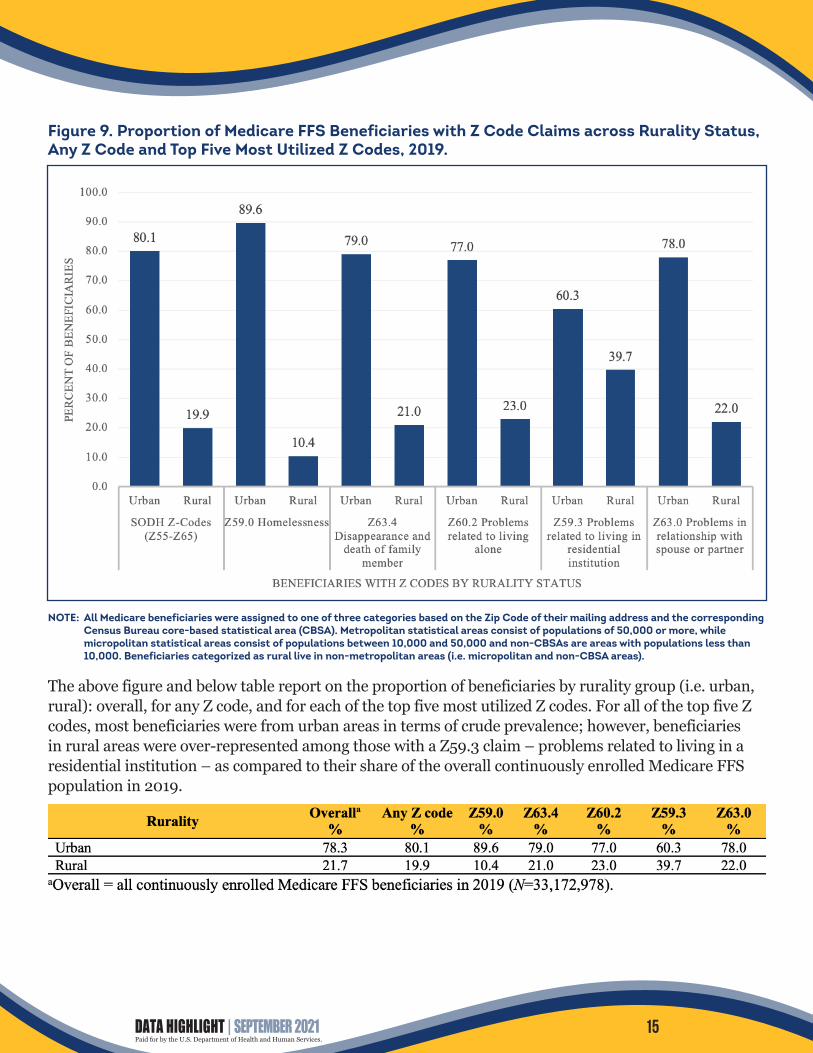
Figure 9. Proportion of Medicare FFS Beneficiaries with Z Code Claims across Rurality Status, Any Z Code and Top Five Most Utilized Z Codes, 2019.
NOTE: All Medicare beneficiaries were assigned to one of three categories based on the Zip Code of their mailing address and the corresponding Census Bureau core-based statistical area (CBSA). Metropolitan statistical areas consist of populations of 50,000 or more, while micropolitan statistical areas consist of populations between 10,000 and 50,000 and non-CBSAs are areas with populations less than 10,000. Beneficiaries categorized as rural live in non-metropolitan areas (i.e. micropolitan and non-CBSA areas).
The above figure and below table report on the proportion of beneficiaries by rurality group (i.e. urban, rural): overall, for any Z code, and for each of the top five most utilized Z codes. For all of the top five Z codes, most beneficiaries were from urban areas in terms of crude prevalence; however, beneficiaries in rural areas were over-represented among those with a Z59.3 claim – problems related to living in a residential institution – as compared to their share of the overall continuously enrolled Medicare FFS population in 2019.
DATA HIGHLIGHT | SEPTEMBER 2021Paid for by the U.S. Department of Health and Human Services.
15

Claims Figure 10. Proportion of Medicare FFS Z Code Claims by State, 2019.
DATA HIGHLIGHT | SEPTEMBER 2021Paid for by the U.S. Department of Health and Human Services.
16

Figure 11. Proportion of Medicare FFS Z Code Claims by Type, 2019.
In 2019, Medicare Part B Non-institutional claims represented 82% of all claims submitted, while Medicare Part B Institutional represented 16% and Part A represented 2%. Among Medicare FFS beneficiaries in 2019, Z codes were billed most often on Medicare Part B Non-institutional claims. Non-institutional claims covered under Medicare Part B, consisting of professional services (e.g. physician services, imaging, laboratory tests, and durable medical equipment [DME]), contained the largest number – almost half (49.6%) – of all Z code claims. There were 297,438 Medicare Part A, 338,772 Part B Institutional, and 626,353 Part B Non-Institutional claims with Z codes in 2019.
DATA HIGHLIGHT | SEPTEMBER 2021Paid for by the U.S. Department of Health and Human Services.
17
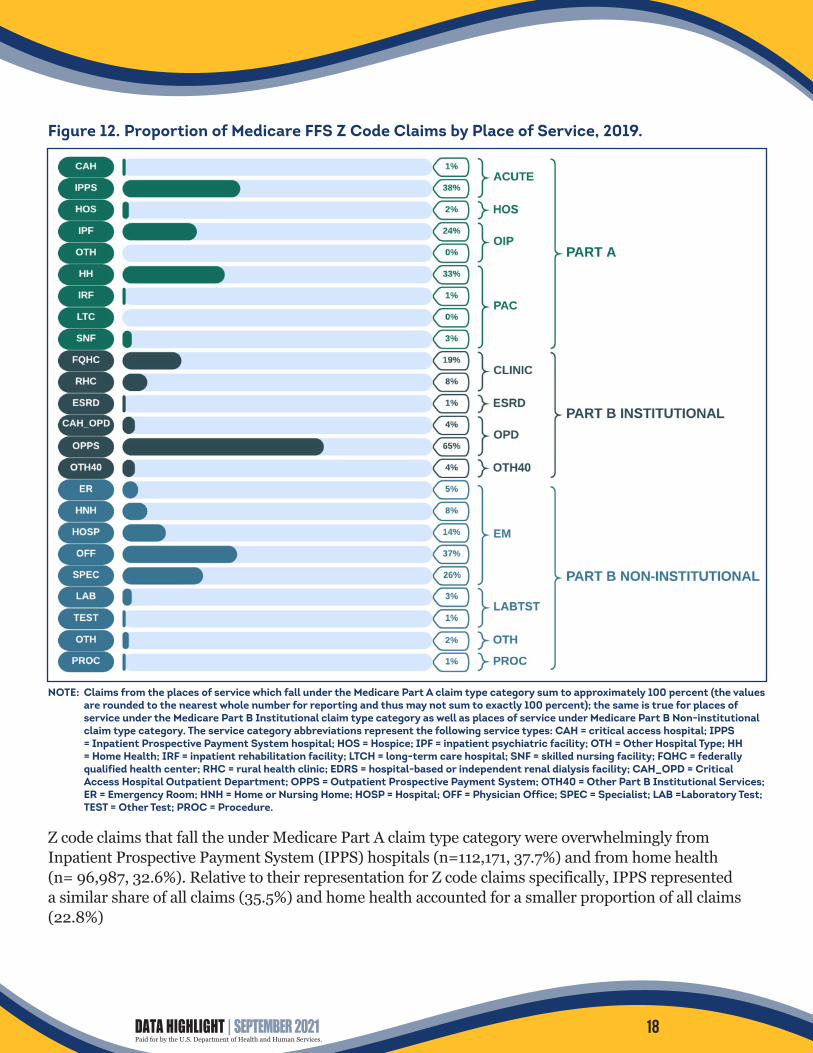
Figure 12. Proportion of Medicare FFS Z Code Claims by Place of Service, 2019.
NOTE: Claims from the places of service which fall under the Medicare Part A claim type category sum to approximately 100 percent (the values are rounded to the nearest whole number for reporting and thus may not sum to exactly 100 percent); the same is true for places of service under the Medicare Part B Institutional claim type category as well as places of service under Medicare Part B Non-institutional claim type category. The service category abbreviations represent the following service types: CAH = critical access hospital; IPPS = Inpatient Prospective Payment System hospital; HOS = Hospice; IPF = inpatient psychiatric facility; OTH = Other Hospital Type; HH = Home Health; IRF = inpatient rehabilitation facility; LTCH = long-term care hospital; SNF = skilled nursing facility; FQHC = federally qualified health center; RHC = rural health clinic; EDRS = hospital-based or independent renal dialysis facility; CAH_OPD = Critical Access Hospital Outpatient Department; OPPS = Outpatient Prospective Payment System; OTH40 = Other Part B Institutional Services; ER = Emergency Room; HNH = Home or Nursing Home; HOSP = Hospital; OFF = Physician Office; SPEC = Specialist; LAB =Laboratory Test; TEST = Other Test; PROC = Procedure.
Z code claims that fall the under Medicare Part A claim type category were overwhelmingly from Inpatient Prospective Payment System (IPPS) hospitals (n=112,171, 37.7%) and from home health (n= 96,987, 32.6%). Relative to their representation for Z code claims specifically, IPPS represented a similar share of all claims (35.5%) and home health accounted for a smaller proportion of all claims (22.8%)
DATA HIGHLIGHT | SEPTEMBER 2021Paid for by the U.S. Department of Health and Human Services.
18

Z code claims under Medicare Part B Institutional, on the other hand, were predominately from the Outpatient Prospective Payment System (OPPS; n= 218,538, 64.5%), followed by Federally Qualified Health Centers (FQHC; n= 64,801, 19.1%). By comparison, claims from OPPS and FQHC represented 67.6% and 5.0% of all claims, respectively.
Finally, for Medicare Part B Non-institutional claims, Z code claims were most often from physician offices (n= 234,336, 37.4%), followed by specialists (n= 159,749, 25.5%) and hospitals (n= 88,572, 14.1%).
For the total population of Medicare FFS claims, 26.32% of all claims were from physician offices, 5.5% of all claims were from specialists, and 8.1% of all claims were from hospitals.
DATA HIGHLIGHT | SEPTEMBER 2021Paid for by the U.S. Department of Health and Human Services.
19

Figure 13. Top Five Medicare Specialty Codes and Medicare Provider/Supplier Types for Medicare Part B Non-institutional Providers Billing Z Code Claims, 2019.
The Medicare Specialty Codes and corresponding Provider/Supplier Types representing the largest shares of all Z code claims in 2019 (N=528,506), in order, were:
DATA HIGHLIGHT | SEPTEMBER 2021Paid for by the U.S. Department of Health and Human Services.
20

Discussion This study represents a follow-up to, and expansion of, the first report published on Z code utilization among Medicare FFS beneficiaries in 2017 (Mathew, Hodge, & Khau, 2020). While the utilization of Z codes, overall, remains relatively low (i.e., 0.11% of all Medicare FFS claims, (i.e. N=1,124,319,144 Medicare FFS claims), were Z code claims in 2019), there was an increase in Z code claims from 2017 to 2019 (n=222,773), representing a 21.4% upward change. Similarly, there was an increase in total number of beneficiaries with Z code claims from 2017 to 2019 (n=58,851): a 12.6% change.
Homelessness (Z59.0) was the most frequently utilized Z code in 2019 (Figure 3); it was also the most frequently utilized Z code in 2016, 2017, and 2018 (not shown). According to the 2019 Annual Homeless Assessment Report (AHAR) to Congress from the Department of Housing and Urban Development (HUD), an individual who is homeless “lacks a fixed, regular, and adequate nighttime residence.” Results from 2019 show that, relative to their share of the overall Medicare FFS population, Black and Hispanic beneficiaries appear overrepresented among those with Z59.0 code claims, as do male beneficiaries, beneficiaries dually eligible for Medicare and full-benefit Medicaid, beneficiaries with DIB as their original reason for Medicare entitlement, and beneficiaries who are less than 65 years of age. Of note, the intended scope of the present study was for it to be descriptive in nature (i.e., inferential statistics were not performed) and thus it is unclear whether these differences in representativeness across all of the Medicare FFS population (i.e. the total population) and only those individuals with Z code claims are statistically significant; thus, future research using inferential statistics is needed. Still, given the stable trend of homelessness being the most frequently documented (via Z code claims) social, economic, and environmental determinant among Medicare FFS beneficiaries, further attention to this issue is warranted.
Older beneficiaries (≥85 years of age), White beneficiaries, female beneficiaries, and beneficiaries residing in rural areas, relative to their shares of the overall FFS population, appeared to be overrepresented among those with Z codes related to: (a) problems related to living alone; and (b) problems related to living in residential institutions. Studies (e.g. Shaw et al., 2017) show that older Medicare beneficiaries who are isolated (i.e., have limited social contact) have higher Medicare spending (due to increased hospitalization, emergency department visits and institutionalization rates). One study by Flowers et al. (2017) estimated that social isolation results in $6.7 billion of additional health care costs annually for Medicare beneficiaries. Past research also shows that isolation drives lower levels of quality of life and patient satisfaction for Medicare beneficiaries (Musich et al., 2015). One commonly used tool for screening for loneliness, isolation, and other social risks to health, is the Accountable Health Communities (AHC) Health-Related Social Needs Screening Tool; however, currently the tool does not differentiate between subjective loneliness and objective isolation. A targeted, validated, easy-to-implement screening tool for isolation may be needed, specifically one that could be implemented in settings like annual wellness visits as an opportunity to support clinicians’ ability to link their patients and clients to needed social support services. Screening beneficiaries for isolation may be especially important now, during the COVID-19 pandemic, where many older adults, including those in residential institutions, are suffering from social isolation and its downstream health consequences (Abbasi, 2020).
DATA HIGHLIGHT | SEPTEMBER 2021Paid for by the U.S. Department of Health and Human Services.
21

Together, Z code claims submitted by family practice, internal medicine, and psychiatry physicians, nurse practitioners, and licensed clinical social workers represented approximately 68% of all Z code claims in 2019. While the results of the present study do support claims made around there being some growing traction within the medical field for improving social, economic, and environmental history taking and integrating more formal screening for social determinants of health in clinical practice, they also suggest the need for additional and broader training efforts, especially those which will assist other providers, including specialty clinicians and clinicians other than patients’ primary providers, in understanding the importance of, and how to use, Z codes. Further, borrowing from the Accountable Health Communities (AHC) Model framework, non-provider staff, including screeners and navigators, may also play a key role in screening for social determinants of health. Trainings might include issues around standardizing identifying SDOH-related issues, as well as coding.
Further, while a 12.6% upward change from 2017 to 2018 was observed in the total number of beneficiaries with Z codes, the findings of this study may still represent a, potentially significant, undercount of beneficiaries with social, economic, and/or environmental conditions hazardous to their health. While higher rates of screening and documentation of these determinants may be occurring relative to 2017, it is unclear to what extent they are all being documented, shared amongst providers, and acted upon. Estimates from one study (Fraze et al., 2019) suggest that approximately one in four hospitals and one in six physician practices screen for social determinants of health, e.g. food insecurity, housing instability, utilities, transportation, and interpersonal violence.
A number of barriers exist to increasing documentation of Z codes: first, Z code claims are not generally used for payment purposes (i.e., thus, there lacks financial incentive); second, there are a limited number of Z codes and sub-codes (see Appendix 1A) and thus some social, economic, and environmental determinants may not be captured; third, while some providers may have had trainings in these topics, or otherwise recognize the social, economic, and environmental challenges that some of their patients face, they may feel limited in what they can do and/or may require guidance on how best to assist their patients in addressing their non-medical needs. For example, a survey study of N=621 physicians by Winfield, DeSalvo, and Muhlestein (2018) found that most physicians felt that help with social, economic, and environmental concerns would assist their patients to a moderate or a great extent: 74% agreed that help arranging transportation to health care would assist their patients, 54% endorsed help to increase income, 48% endorsed help getting sufficient food, 45% endorsed getting affordable housing, and 32% endorsed information about water quality. However, relatively few physicians saw themselves as responsible for helping patients with these issues: 18% saw themselves as responsible for providing help with arranging transportation to care, 4% for help increasing income, 5% for getting sufficient food, 3% for getting affordable housing, and 4% for information about water quality.
Of note, the Centers for Medicare & Medicaid Services’ Office of Minority Health (CMS OMH) recently released an infographic: “Using Z Codes: The Social Determinants of Health (SDOH) Data Journey to Better Outcomes” that outlines steps to collect, report, and use Z codes, as well as guidance specific to health care administrators, coding professionals, and providers regarding Z codes.
DATA HIGHLIGHT | SEPTEMBER 2021Paid for by the U.S. Department of Health and Human Services.
22

Limitations These findings should be considered in light of several limitations. First, analyses were limited to continuously enrolled Medicare FFS beneficiaries only; thus, conclusions are not generalizable to those with discontinuous enrollment, those enrolled in Medicare Advantage (MA) plans, or to the general population. Second, descriptive analyses were performed and therefore no definitive conclusions can be drawn regarding over- or under-representation of beneficiary sub-groups among those with any, or particular Z code claims. Third, many of the social, economic, and environmental determinants captured through Z codes are highly stigmatized; therefore, it is likely that a reliance on claims data alone – which is dependent on the willingness of both providers and beneficiaries to discuss and address any issues at hand – undercounts the number of beneficiaries with hazardous social, economic, and/or environmental conditions. Fourth, ascertainment bias in screening for SDOH may occur, which could skew the distribution of Z code claims by, for example, age group, race or ethnicity group, or sex group.
Conclusions This data highlight provides a follow up to the previously published highlight, “Z Codes Utilization among Medicare Fee-for-Service (FFS) Beneficiaries in 2017,” (Mathew, Hodge, & Khau, 2020). Given that social, economic, and environmental determinants explain substantial variance in health and health-related outcomes, more widely adopted and consistent documentation of them is needed to comprehensively identify non-medical factors affecting health and to track progress toward addressing them; doing so could aid in work toward achieving health equity and ensuring highest quality and best-value care for all beneficiaries.
Given that COVID-19 has both disproportionately impacted underserved communities and has “shined a spotlight” on extant health inequities (Hooper, Nápoles, & Pérez-Stable, 2020, p. 2466), it will be critically important to carefully analyze data from 2020 and 2021 to understand whether and to what extent the public health emergency (PHE) may have had an impact on social, economic, and environmental determinants, and/or the rate of documentation of those determinants via Z codes. Finally, all members of the US health system: payers, patient-centered medical homes, hospitals, national organizations, governments at the local, State, and Federal level, communities, providers, patients, as well as other stakeholders all have an important role to play in identifying social, economic, and environmental determinants, and ultimately improving health outcomes.
DATA HIGHLIGHT | SEPTEMBER 2021Paid for by the U.S. Department of Health and Human Services.
23

References Abbasi, J. (2020). Social isolation – Te other COVID-19 threat in nursing homes. JAMA, 324(7), 619-620.
Adler, N.E., Cutler, D.M., Fielding, J.E., Galea, S., Glymour, M.M., Koh, H.K., & Satcher, D. (2016). Addressing social determinants of health and health disparities: A vital direction for health and health care. NAM Perspectives. Discussion Paper, National Academy of Medicine, Washington, DC.
Artiga, S., & Hinton, E. (2018, May 10). Beyond health care: Te role of social determinants in promoting health and health equity. Kaiser Family Foundation website. https://www.kf.org/racial-equity-and-health-policy/issue-brief/beyond-health-care-the-role-of-social-determinants-in-promoting-health-and-health-equity/
Cantor, M. N., & Torpe, L. (2018). Integrating data on social determinants of health into electronic health records. Health Afairs, 37(4), 585-590.
Eicheldinger, C., & Bonito, A. (2008). More accurate racial and ethnic codes for Medicare administrative data. Health Care Financing Review, 29(3), 27-42.
Gottlieb, L., Tobey, R., Cantor, J., Hessler, D., & Adler, N. E. (2016). Integrating social and medical data to improve population health: Opportunities and barriers. Health Afairs, 35(11), 2116-2123.
Green, K. & Zook, M. (2019, October 29). When talking about social determinants, precision matters. Health Afairs Blog website. https://www.healthafairs.org/do/10.1377/hblog20191025.776011/full/
Guo, Y., Chen, Z., Xu, K., George, T. J., Wu, Y., Hogan, W.,...& Bian, J. (2020). International Classifcation of Diseases, Tenth Revision, Clinical Modifcation social determinants of health codes are poorly used in electronic health records. Medicine, 99(52), e23818.
Hooper, M. W., Nápoles, A. M., & Pérez-Stable, E. J. (2020). COVID-19 and racial/ethnic disparities. JAMA, 323(24), 2466-2467.
Flowers, L., Houser, A., Noel-Miller, C., Shaw, J., Bhattacharya, J., Schoemaker, L., & Farid, M. (2017). Insight on the issues: Medicare spends more on socially isolated older adults. AARP Public Policy Institute. https://www. aarp.org/content/dam/aarp/ppi/2017/10/medicare-spends-more-on-socially-isolated-older-adults.pdf
Fraze, T.K., Brewster, A.L., Lewis, V.A., Beidler, L.B., Murray, G.F., & Colla, C.H. (2019). Prevalence of screening for food insecurity, housing instability, utility needs, transportation needs, and interpersonal violence by US physician practices and hospitals. JAMA Network Open, 2(9), e1911514-e1911514.
Jain, S.H., Baackes, J., & O’Connell, J.J. (2020). Homeless special needs plans for people experiencing homelessness. JAMA, 323(10), 927-928.
Kangovi, S., & Grande, D. (2011). Hospital readmissions – Not just a measure of quality. JAMA, 306(16), 1796-1797.
Mathew, J., Hodge, C., and Khau, M.T. Z codes utilization among Medicare fee-for-service (FFS) benefciaries in 2017. (2020). CMS OMH Data Highlight No. 17. Baltimore, MD: CMS Ofce of Minority Health.
DATA HIGHLIGHT | SEPTEMBER 2021Paid for by the U.S. Department of Health and Human Services.
24
https://www.kff.org/racial-equity-and-health-policy/issue-brief/beyond-health-care-the-role-of-socia
https://www.kff.org/racial-equity-and-health-policy/issue-brief/beyond-health-care-the-role-of-socia

Musich, S., Wang, S. S., Hawkins, K., & Yeh, C. S. (2015). Te impact of loneliness on quality of life and patient satisfaction among older, sicker adults. Gerontology and Geriatric Medicine, 1, 1-9.
Nelson, R.E., Suo, Y., Pettey, W., Vanneman, M., Montgomery, A.E., Byrne, T.,...& Gundlapalli, A.V. (2018). Costs associated with health care services accessed through VA and in the community through Medicare for veterans experiencing homelessness. Health Services Research, 53(S3), 5352-5374.
Shaw, J.G., Farid, M., Noel-Miller, C., Joseph, N., Houser, A., Asch, S.M.,...& Flowers, L. (2017). Social isolation and Medicare spending: Among older adults, objective isolation increases expenditures while loneliness does not. Journal of Aging and Health, 29(7), 1119-1143.
Virapongse, A., & Misky, G. J. (2018). Self-identifed social determinants of health during transitions of care in the medically underserved: A narrative review. Journal of General Internal Medicine, 33(11), 1959-1967.
Weeks, W. B., Cao, S. Y., Lester, C. M., Weinstein, J. N., & Morden, N. E. (2020). Use of Z-codes to record social determinants of health among fee-for-service Medicare benefciaries in 2017. Journal of General Internal Medicine, 35(3), 952-955.
Winfeld L. DeSalvo K.B., & Muhlestein D. (2018, June 25). Social determinants matter, but who is responsible? 2017 physician survey on social determinants of health. Poster presented at the Academy Health Annual Research Meeting, Seattle, Washington. Retrieved from https://academyhealth.confex.com/ academyhealth/2018arm/meetingapp.cgi/Paper/24695.
DATA HIGHLIGHT | SEPTEMBER 2021Paid for by the U.S. Department of Health and Human Services.
25
About the Authors Dr. Jessica L Maksut, Ms. Carla J Hodge, Ms. Amaya Razmi, and Ms. Meagan T Khau are with the Data and Policy Analytics Group (DPAG) in the Office of Minority Health (OMH) and Ms. Charlayne D Van is with the Center for Clinical Standards and Quality (CCSQ) at the Centers for Medicare & Medicaid Services.
Copyright Information This communication was produced, published, and disseminated at US taxpayer expense. All material appearing in this report is in the public domain and may be reproduced or copied without permission. Citation as to source, however, is appreciated.
Suggested Citation Maksut JL, Hodge C, Van CD, Razmi, A, & Khau MT. Utilization of Z Codes for Social Determinants of Health among Medicare Fee-For-Service Beneficiaries, 2019. Office of Minority Health (OMH) Data Highlight No. 24. Centers for Medicare and Medicaid Services (CMS), Baltimore, MD, 2021.
Disclaimer This work was sponsored by the Centers for Medicare and Medicaid Services’ Office of Minority Health and was produced, published, and disseminated at US taxpayer expense.
Contact CMS Office of Minority Health 7500 Security Blvd, MS S2-12-17 Baltimore, MD 21244 [email protected] go.cms.gov/cms-omh
DATA HIGHLIGHT | SEPTEMBER 2021Paid for by the U.S. Department of Health and Human Services.
26
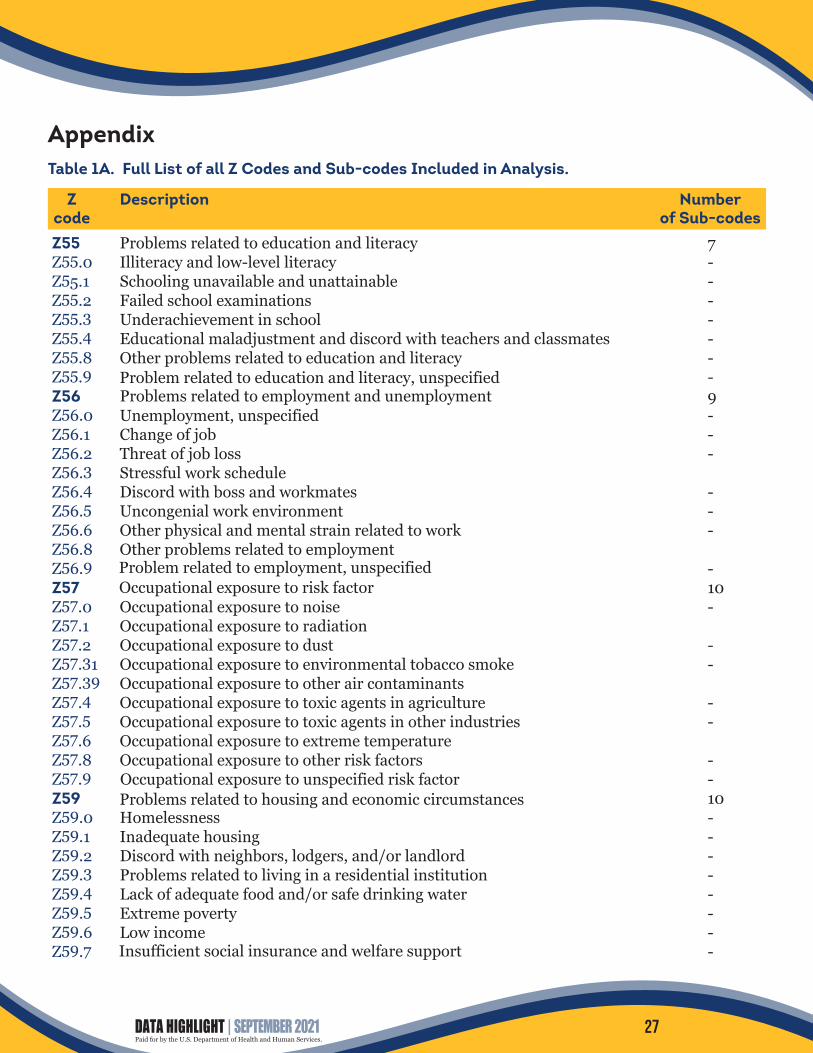
Appendix Table 1A. Full List of all Z Codes and Sub-codes Included in Analysis.
Z Description Number code of Sub-codes Z55 Z55.0 Z55.1 Z55.2 Z55.3 Z55.4 Z55.8 Z55.9 Z56 Z56.0 Z56.1 Z56.2 Z56.3 Z56.4 Z56.5 Z56.6 Z56.8 Z56.9 Z57 Z57.0 Z57.1 Z57.2 Z57.31 Z57.39 Z57.4 Z57.5 Z57.6 Z57.8 Z57.9 Z59 Z59.0 Z59.1 Z59.2 Z59.3 Z59.4 Z59.5 Z59.6 Z59.7
Problems related to education and literacy 7 Illiteracy and low-level literacy -Schooling unavailable and unattainable -Failed school examinations -Underachievement in school -Educational maladjustment and discord with teachers and classmates -Other problems related to education and literacy -Problem related to education and literacy, unspecified -Problems related to employment and unemployment 9 Unemployment, unspecified -Change of job -Threat of job loss -Stressful work schedule Discord with boss and workmates -Uncongenial work environment -Other physical and mental strain related to work -Other problems related to employment Problem related to employment, unspecified -Occupational exposure to risk factor 10 Occupational exposure to noise -Occupational exposure to radiation Occupational exposure to dust -Occupational exposure to environmental tobacco smoke -Occupational exposure to other air contaminants Occupational exposure to toxic agents in agriculture -Occupational exposure to toxic agents in other industries -Occupational exposure to extreme temperature Occupational exposure to other risk factors -Occupational exposure to unspecified risk factor -Problems related to housing and economic circumstances 10 Homelessness -Inadequate housing -Discord with neighbors, lodgers, and/or landlord -Problems related to living in a residential institution -Lack of adequate food and/or safe drinking water -Extreme poverty -Low income -Insufficient social insurance and welfare support -
DATA HIGHLIGHT | SEPTEMBER 2021Paid for by the U.S. Department of Health and Human Services.
27

Z59.8 Z59.9 Z60 Z60.0 Z60.2 Z60.3 Z60.4 Z60.5 Z60.8 Z60.9 Z62 Z62.0 Z62.1 Z62.2 Z62.3 Z62.6 Z62.8 Z62.9 Z63 Z63.0 Z63.1 Z63.3 Z63.4 Z63.5 Z63.6 Z63.7 Z63.8 Z63.9 Z64 Z64.0 Z64.1 Z64.4 Z65 Z65.0 Z65.1 Z65.2 Z65.3 Z65.4 Z65.5 Z65.8 Z65.9
Other problems related to housing and economic circumstances -Problem related to housing and economic circumstances, unspecified -Problems related to social environment 7 Problems of adjustment to life-cycle transitions -Problems related to living alone -Acculturation difficulty -Social exclusion and rejection -Target of (perceived) adverse discrimination and persecution -Other problems related to social environment -Problem related to social environment, unspecified -Problems related to upbringing 7 Inadequate parental supervision and control -Parental overprotection -Upbringing away from parents -Hostility towards and scapegoating of child -Inappropriate (excessive) parental pressure -Other problems related to upbringing -Problem related to upbringing, unspecified -Other problems related to primary support group, including family circumstances 9 Problems in relationship with spouse or partner -Problems in relationship with in-laws -Absence of family member -Disappearance and/or death of family member -Disruption of family by separation and/or divorce -Dependent relative needing care at home -Other stressful life events affecting family and household -Other problems related to primary support group -Problem related to primary support group, unspecified -Problems related to certain psychosocial circumstances 3 Problems related to unwanted pregnancy -Problems related to multiparity -Discord with counselors -Problems related to other psychosocial circumstances 8 Conviction in civil and/or criminal proceedings without imprisonment -Imprisonment and other incarceration -Problems related to release from prison -Problems related to other legal circumstances -Victim of crime and/or terrorism -Exposure to disaster, war, and other hostilities -Other problems related to psychosocial circumstances -Problem related to unspecified psychosocial circumstances -
DATA HIGHLIGHT | SEPTEMBER 2021Paid for by the U.S. Department of Health and Human Services.
28