On the use of seasonal to decadal climate predictions for ...

Utilization of seasonal climate predictions for
application fields
Yonghee Shin/APEC Climate CenterBusan, South Korea
NIES, Japan
The 20th AIM International WorkshopJanuary 23-24, 2015

2
Background
l Recently abnormal weathers such as heatwaves, droughts, floods increased all over the world
l Increase of abnormal weather occurrence is major threat to the agricultural sector
l To response to the food crisis, development of crop yield prediction technology using seasonal forecast data is important
Source: Center for Research on the Epidemiology of Disasters(CRED)Drought: 1988, 1995, 2002, 2012 yearFlood: 1993 year
Natural Disaster

3
Background
l APEC Climate Center produces and offers Multi-Model Ensemble(MME) seasonal forecast data evaluated as a world-class. However, utilization of seasonal forecasts for the agricultural sector is still very low
l In this study, we carried out bias correction to take advantage of the APCC MME seasonal forecasts in agriculture research and developed multi-scale temporal and spatial downscaling methods
http://www.apcc21.org

4
MME Climate Forecast
o Global climate forecast data from 17 institutes (9 economies)o Monthly rolling 3-month and 6-month MME climate forecasto Cooperation on decadal prediction and climate change projection
Multi-Model Ensemble

5
Bridging the gap between climate models and agricultural models
Seasonal Forecastsfrom dynamic models
Agricultural models
Daily & Highresolution forecaststemperature, precipitation,
relative humidity, solar radiation,
Daily & Highresolution forecaststemperature, precipitation,
relative humidity, solar radiation,
Spatial
downscaling
Temporaldownscaling
l Field scale, high spatial resolution (=paddy field, individual farms)
l Daily or hourly scale, hightemporal resolution
l Temp., prec., relative humidity, solar radiation…
l Global scale, low spatial resolution (2.5° x 2.5°)
l Monthly scale, low temporalresolution
l Temperature, precipitation
Monthly & Lowresolution forecaststemperature, precipitation
Monthly & Lowresolution forecaststemperature, precipitation

6
Downscaling Approaches
There are two fundamental approaches for the downscaling of large-scale GCM output to a finer spatial resolution.
§A dynamical approach where a higher resolutionclimate model is embedded within a GCM. §Statistical methods to establish empirical relationships between GCM climate and local climate.

7
Statistical Downscaling
Statistical downscalingGenerally classified into three groups
§ Weather Typing schemes§ Generation daily weather series at a local site.§ Classification schemes are somewhat subjective.
§ Regression Models § Generation daily weather series at a local site.§ Results limited to local climatic conditions.§ Long series of historical data needed.§ Large-scale and local-scale parameter relations remain valid for
future climate conditions.§ Simple computational requirements.
§ Stochastic Weather Generators§ Generation of realistic statistical properties of daily weather series
at a local site.§ Inexpensive computing resources.§ Climate change scenarios based on results predicted by GCM
(unreliable for precipitation)
Which is actually appropriate for seasonal forecasting application?

8
for agricultural applications of the APCC seasonal forecasts
Climate InformationSeasonal Forecast
Model 1
MME
Temp, PrcpModel 2
Dynamic models
Temp, Prcp
…
Crop GrowthDiseases/Pests
②Crop ModelingCrop Outlook
① Statistical Downscaling
Model 3 Spat
ial
Dow
nsc
alin
g
Simple Bias-Correction(SBC)
SLP, T850… Temp, Prcp Tem
pora
lD
ow
nsc
alin
g
DailyWeatherVariables
Agricultural models
Strategies
Field to Global Models
Moving Window Regression(MWR)
Best-Fit Sampling(BFS)
Weather Generator

9
for agricultural applications of the APCC seasonal forecasts
Climate InformationSeasonal Forecast
Model 1
MME
Temp, PrcpModel 2
Dynamic models
Temp, Prcp
…
Crop GrowthDiseases/Pests
②Crop ModelingCrop Outlook
① Statistical Downscaling
Model 3 Spat
ial
Dow
nsc
alin
gSLP, T850… Temp, Prcp Te
mpora
lD
ow
nsc
alin
g
DailyWeatherVariables
Agricultural models
Strategies
Field to Global Models
top
-dow
n
bott
om-u
p
Development of statistical downscaling methodsDevelopment of statistical downscaling methods
Statistical downscaling for global, regional crop modelsStatistical downscaling for global, regional crop models
Temporal downscaling for field crop modelsTemporal downscaling for field crop models
Development of crop models utilizing daily or monthly weather inputs
Development of crop models utilizing daily or monthly weather inputs
Downscaling method evaluationDownscaling method evaluation

Weather generator evaluationfor field-scale crop model
applications
Downscaling method evaluationDownscaling method evaluation

11
Background
Weather generatorsq Weather generators are statistical models of
sequences of weather variables with the samestatistical properties to the observed climate.
Two fundamental types of daily weather generators, based on the approach to model daily precipitation occurrence
§ The Markov chain approach: a random process is constructed which determines a day at a station as rainy or dry, conditional upon the state of the previous day, following given probabilities. (e.g. WGEN and SIMMETEO)
§ The spell-length approach: fitting probability distribution to observed relative frequencies of wet and dry spell lengths. (e.g. LARS-WG)
12
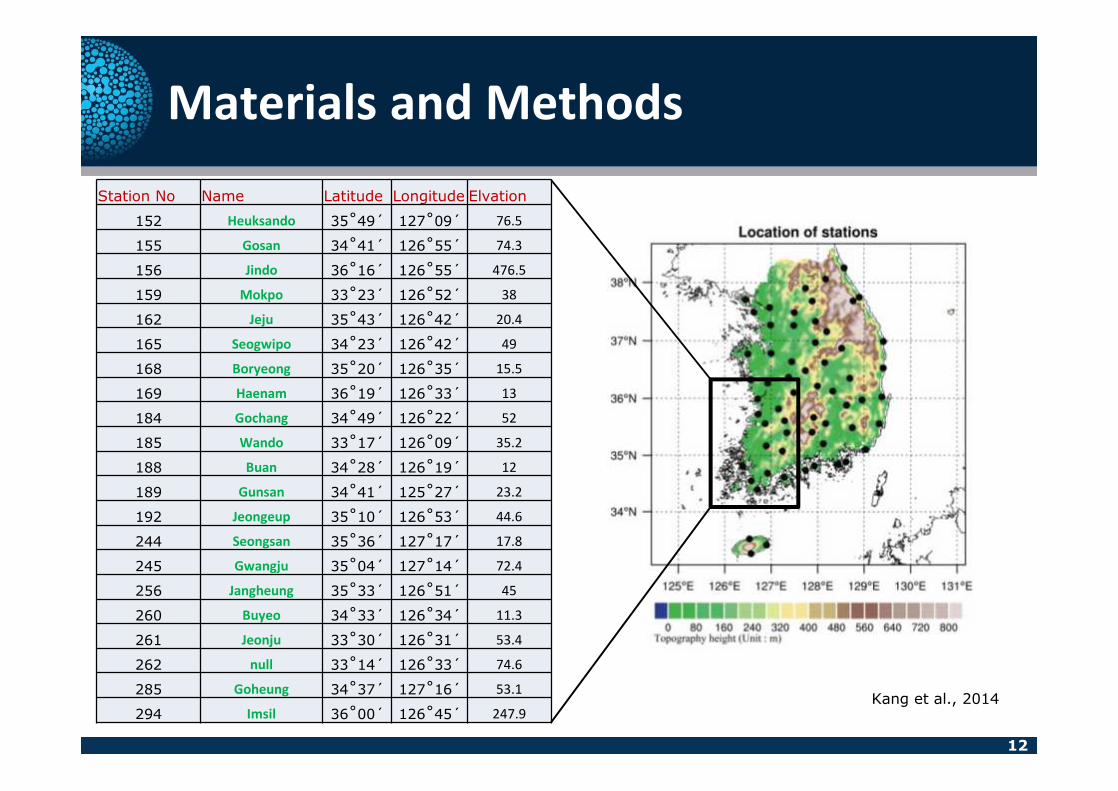
Materials and Methods Station No Name Latitude Longitude Elvation
152 Heuksando 35˚49´ 127˚09´ 76.5
155 Gosan 34˚41´ 126˚55´ 74.3
156 Jindo 36˚16´ 126˚55´ 476.5
159 Mokpo 33˚23´ 126˚52´ 38
162 Jeju 35˚43´ 126˚42´ 20.4
165 Seogwipo 34˚23´ 126˚42´ 49
168 Boryeong 35˚20´ 126˚35´ 15.5
169 Haenam 36˚19´ 126˚33´ 13
184 Gochang 34˚49´ 126˚22´ 52
185 Wando 33˚17´ 126˚09´ 35.2
188 Buan 34˚28´ 126˚19´ 12
189 Gunsan 34˚41´ 125˚27´ 23.2
192 Jeongeup 35˚10´ 126˚53´ 44.6
244 Seongsan 35˚36´ 127˚17´ 17.8
245 Gwangju 35˚04´ 127˚14´ 72.4
256 Jangheung 35˚33´ 126˚51´ 45
260 Buyeo 34˚33´ 126˚34´ 11.3
261 Jeonju 33˚30´ 126˚31´ 53.4
262 null 33˚14´ 126˚33´ 74.6
285 Goheung 34˚37´ 127˚16´ 53.1
294 Imsil 36˚00´ 126˚45´ 247.9Kang et al., 2014

13
Results
n PrecipitationTable. 1. An example of output data from the statistical tests, showing the comparison of
monthly means of total rainfall and standard deviation with synthetic data generated by LARS-WG, WGEN and SIMMETEO. Probability levels (p-value) calculated by the t test and F test for the monthly means and variances are shown. A probability of 0.05 or lower indicates a departure from the observation that is significant at the 5% level.
Jan Feb Mar Apr May Jun Jul Aug Sep Oct Nov DecObserved Obs.mean 33.77 39.35 56.92 90.96 88.89 194.64 274.43 301.89 144.26 47.35 50.54 29.03
Obs. std 27.357 28.366 32.024 60.211 46.762 116.987 150.291 149.963 94.973 35.869 32.73 20.738LARS-WG Gen.mean 33 45.24 56.84 88.12 116.64 160.58 255.51 296.02 167.58 59.6 54.35 23.71
Gen.std 29.067 28.3 41.029 48.626 56.662 80.461 120.434 166.057 86.819 39.121 30.817 22.732P-value for t-test 0.911 0.392 0.993 0.828 0.033 0.154 0.561 0.879 0.289 0.184 0.62 0.318P-value for F-test 0.742 0.976 0.168 0.212 0.285 0.03 0.196 0.573 0.594 0.633 0.717 0.613
WGEN Gen.mean 23.43 26.77 52.9 111 88.6 187.82 318.33 363.79 133.06 47.06 47.81 18.93Gen.std 24.576 17.231 40.19 57.802 62.051 111.536 142.176 121.858 84.164 37.044 35.283 13.035P-value for t-test 0.359 0.779 0.827 0.717 0.546 0.555 0.613 0.616 0.149 0.33 0.897 0.905P-value for F-test 0.023 0.256 0.422 0.525 0.453 0.674 0.258 0.034 0.505 0.338 0.832 0.693
SIMMETEO Gen.mean 36.13 32.43 52.76 113.25 79.48 188.69 304.14 367.05 136.78 40.98 49.1 23.56Gen.std 15.453 20.589 26.575 65.583 43.081 109.789 103.551 126.733 75.88 21.937 30.162 12.244P-value for t-test 0.542 0.602 0.777 0.708 0.851 0.393 0.868 0.982 0.152 0.22 0.585 0.614P-value for F-test 0.638 0.688 0.358 0.088 0.028 0.327 0.243 0.032 0.732 0.028 0.2 0.4

14
Results
n Maximum temperature
A (station 156, North) B (station 189 West) C(station 244, East and High)
D (station 261 Low) E (station 159 South)Comparison of monthly maximum temperature (oC) for observed data and synthetic data generated by LARS-WG, WGEN and SIMMETEO.

Statistical downscaling skills of Seasonal Forecasts
for a global-scale crop model
Statistical downscaling for global crop modelsStatistical downscaling for global crop models

6-Month Hindcast Data
16
MSC_CANCM3
MSC_CANCM4
NASA
NCEP
PNU
POAMA
ModelsCommon Period
(1983-2006)
1981-2010
1981-2010
10
10
1982-2012 11
1983-2009
1980-2012
20
5
1983-2006 30
PeriodsEnsem
bles
MSC_CANCM3
MSC_CANCM4
NASA
NCEP
PNU
POAMA
SingleModel
Ensemble
Available Climate Variables : Precipitation, TemperatureAvailable Climate Variables : Precipitation, Temperature

17
Planting Harvest0 365 day
Seasonal prediction (6 months)Observed daily data
ReproductionDaily data
ReproductionDaily data
Tmpm,d
Tmaxm,d
Tminm,d
Precm,d
Windm,d
Rsdsm,d
GCMsMonthly data
GCMsMonthly data
Tmpm,y
Tmpm,y+1
Tmpm,y+2
ObservationMonthly dataObservationMonthly data
Tmpm,1
Tmpm,j
Tmpm,40
Daily Seasonal Forecast Data for Global Crop Modeling

18
nasa25.0
pnu1 21.7
B.C. NCEP24.3 3.3
Bias Correction
Results of analysis - China
nasaTCC : 0.68 RMSE: 0.28

19
Results of analysis - each country
China India

Rice Yield Prediction using a Regional-scale Crop Model and
the APCC MME Seasonal Forecasts
Evaluation of the applicability of seasonal forecast in a regional crop model
Evaluation of the applicability of seasonal forecast in a regional crop model

21
APCC MME Seasonal Forecasts
Model InstitutionEnsemble number
Leadtime
CWB Central Weather Bureau (Taipei) 10 3
GDAPS_F Korea Meteorological Administration (Korea) 20 3
HMC Hydrometeorological Centre of Russia (Russia) 10 3
JMA Japan Meteorological Agency (Japan) 5 3
MSC_CANCM3 Meteorological Sevice of Canada (Canada) 10 3, 6
MSC_CANCM4 Meteorological Sevice of Canada (Canada) 10 3, 6
NASA National Aeronautics and Space Administration (USA) 11,10 3, 6
NCEP Climate Prediction Center / NCEP/NWS/NOAA (USA) 17 3, 6
PNU Pusan National University (Korea) 3,4 3, 6
POAMACentre for Australian Weather and Climate Research/ Bureau of Meteorology (Australia)
30 3, 6
POAMA_M24 3
SCM MME 3
- Daily maximum, minimum temperature and precipitaion were downscaled from APCC MME forecasts to 57 stations - Interpolated into 0.25°×0.25° grid cells using the nearest neighbor interpolation methods

22
Methodologiesregional rice forecasting
l The GLAM-rice was run using the historical weather data and APCC MME forecasts at a 0.25×0.25 grid cells
l The simulation results spatially aggregated to national level for validation and prediction for crop yield.
l Rice yield was predicted by updating seasonal forecast as season progresses for May, June, July and August

23
Skill of GLAM-rice at the national level when the model is run using 6 months seasonal forecast data-correlation coefficient between observed and simulated yield
By updating of seasonal forecast with observation, the skill of GLAM-rice was improved as season progresses
The most accurate predictions of observed yields came from the NCEP for July and August, and from the POAMA for July

Evaluation and Improvement of Weather generator-based
temporal downscaling for a field-scale crop model
Temporal downscaling for field crop modelsTemporal downscaling for field crop models

25
l Rice Disease Forecasting WorkflowAPCC Seasonal
Forecasts (3~6months)
Leaf Blast Risk Score
Control decisions▣ Concentrated spraying over high-risk diseases and pests
▣ Planning for practical and/or chemical controls based on predicted disease/pest risks
cultural practice
§ transplanting date§ cultivar resistance
§ temperature§ precipitation
Seasonal Disease Forecast with a rice disease model, EPIRICE
Seasonal Forecast DownscalingSeasonal Forecast Downscaling
Daily & Highresolution forecasts
temp, prcp & rhum
Monthly & Low resolution forecasts
temp & prcp
Monthly & Low resolution forecasts
temp & prcp
Spatial
downscaling
Temporaldownscaling
EPIRICE Disease Model
Test applicability

26
EVALUATION OF WG DOWNSCALING
☞ Is it possible to use Daily weather data downscaled from Monthly seasonal forecasts using Weather Generator to run Agri.Model?
l Objective 1
Daily min & max temperature,precipitation, relative humidityDaily min & max temperature,precipitation, relative humidity
Historical WeatherData (ASOS, 30yr)
Obs.
WeatherGeneratorWeather
Generatortraining
Syn.
VS
30yr syntheticweather data30yr syntheticweather data

27
EVALUATION OF WG DOWNSCALING
☞ Is there any ways to improve the Weather Generator-based downscaling methods?
l Objective 2
IMPROVING WG DOWNSCALING SKILL
Historical WeatherData (ASOS, 30yr)
WeatherGeneratorWeather
Generatortraining
SeasonalForecast data
Adjusting parameters+ weather generation
-10
-5
0
5
10
15
20
25
0 2 4 6 8 10 12
Historical WeatherWG-AWG-BWG-C
TminTminPrcpPrcp
0
50
100
150
200
250
300
350
0 2 4 6 8 10 12
Historical WeatherWG-AWG-BWG-C
Daily min & max temperature,precipitation, relative humidityDaily min & max temperature,precipitation, relative humidity

28
Statistical downscaling for global, regional crop modelsStatistical downscaling for global, regional crop models
Downscaling method evaluationDownscaling method evaluation
for agricultural applications of the APCC seasonal forecasts
Seasonal Forecast
Model 1
MME
Temp, PrcpModel 2
Dynamic models
Temp, Prcp
…
Crop GrowthDiseases/Pests
②Crop ModelingCrop Outlook
① Statistical Downscaling
Model 3 Spat
ial
Dow
nsc
alin
gSLP, T850… Temp, Prcp Te
mpora
lD
ow
nsc
alin
g
DailyWeatherVariables
Agricultural Information
Strategiesto
p-d
own
bott
om-u
p
Development of statistical downscaling methodsDevelopment of statistical downscaling methods
Development of crop models utilizing daily or monthly weather inputs
Development of crop models utilizing daily or monthly weather inputs
Field to Global Models
Temporal downscaling for field crop modelsTemporal downscaling for field crop models
Statistical downscaling for global, regional crop modelsStatistical downscaling for global, regional crop models
Downscaling method evaluationDownscaling method evaluationDevelopment of statistical downscaling methodsDevelopment of statistical downscaling methods
Development of crop models utilizing daily ormonthly weather inputs
Development of crop models utilizing daily ormonthly weather inputs
Spatial + Temporal downscaling for field crop modelsSpatial + Temporal downscaling for field crop models
Climate Information

THANK YOU!