Utility Case Study: Volt/VAR Control at DominionANSI C84.1 Standard System Voltages Service Voltage:...
31
Utility Case Study: Volt/VAR Control at Dominion Presented to EUCI VOLT/VAR OPTIMIZATION CONFERENCE June 11-12, 2012
Transcript of Utility Case Study: Volt/VAR Control at DominionANSI C84.1 Standard System Voltages Service Voltage:...

Utility Case Study: Volt/VAR Control at Dominion
Presented to EUCI VOLT/VAR OPTIMIZATION CONFERENCE
June 11-12, 2012
Dominion Leading Energy Provider in Northeast U.S.

Dominion
Dominion
Generation
Dominion
Virginia Power
Dominion
Energy
Gas Transmission
Gas Distribution
Producer Services
Appalachian E&P
Utility
Generation
Merchant
Generation
Electric
Transmission
Electric
Distribution
Unregulated
Retail
Dominion Resources Services, Inc. Alternative Energy Solutions Group
Alternative Energy Solutions: Supporting All of the Business Units
Dominion Voltage Inc.

Program Highlights • Achieves precise customer voltage control.
• Provides substantial customer savings.
• Requires no change in customer behavior
• Requires no customer purchases or incentives.
• Benefits all customer classes.
• Justifies investments in distribution and metering infrastructure.
• Integrates with other direct load control programs.
Key Deliverables • Delivers significant and sustainable energy savings.
• Delivers significant and sustainable demand savings.
• Reduces demand, conserves energy, and reduces impact on the environment.
• Adapts to real-time system changes.
Customer Voltage Based VVO

Traditional Circuit Voltage Design
1 to 6%
2 to 4%
1 to 2%
5

Customer Voltage Based VVO
1 to 6%
2 to 4%
1 to 2%
6

7
Management and Mapping of a Distribution Assets
• Change volume of assets on distribution is significant
• Common to re-configure distribution connectivity
• Significant change in assets for large storm restoration
• GIS tracking of assets does not address electrical connectivity information
• Distribution GIS systems have significant data problems because of volume, age, size, and location
The Problem with Distribution Grids

Plan
Manage Validate
Geospatial Distribution Analysis, Control & Validation
Voltage Management with DMS/SCADA, DA, & AMI
System Installation
Transformer #2Circuit 410 & 422
Circuit 422
Circuit 410
Circuit 410
Circuit 422
Trabue
Circuit Geography
9

AMI Integration Manager
AMI Environment
SCADA Environment
Substation Voltage Monitoring and Control
AMI Premise Voltage Monitoring
DMS /
SCADA
Planning and Validation Environment
Planner
Validate
Savings
Distribution
Planning
Weather
The Energy “EPAD”
10
Three Applications within the Customer Voltage based VVO: Planner – Studies operating voltages, determines the average expected energy savings for the candidate circuits, and recommends any distribution upgrades required to achieve maximum savings Manager – Configures CVR and coordinates the operation of Capacitors, Regulators, & LTC’s Validate – Confirms achievement of expected energy savings through verifiable statistical analysis

11
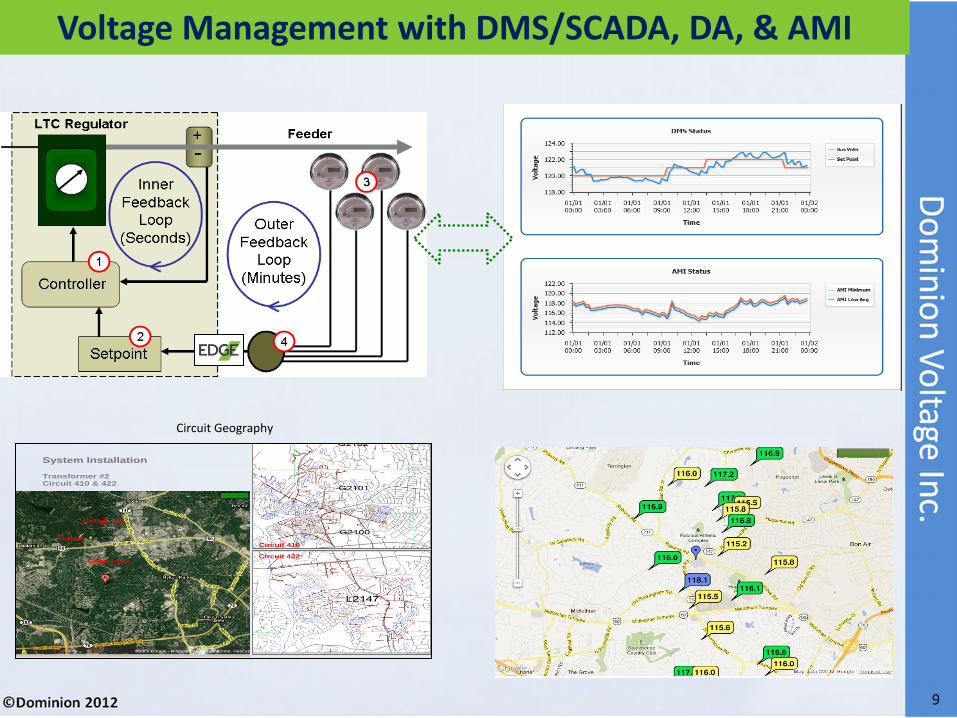
Statistically Analyze Customer Data
Customer Based Planning Model
1 to 6%
2 to 4%
1 to 2%
1. Target worst outliers with best fix 2. Fixing the additional points below 116 V
would give additional range for CVR.
Primary Service Transformer Secondary
Customer Voltages Mapped in Planning
Software
Voltage at Peak Load: Traditional Planning
Model Results
Integrate Customer Data into the Planning Software
12
> 126
120-126
118-120
116-118
114-116
> 114
1 to 6%
2 to 4%
1 to 2%
1 to 6%
2 to 4%
1 to 2% > 126
120-126
118-120
116-118
114-116
> 114
Wrong meter – to be replaced
Customer getting 113-114 V No visibility of isolated secondary voltage issues
SynerGEE® Electric model
SynerGEE® Electric model

Improvement in Customer Voltage Quality

14
CVR/VAR OFF CVR/VAR ON
Average Daily Data Samples
• The objective of the Measurement and Verification phase is to confirm through
verifiable statistical analysis that the expected energy savings by circuit was
achieved
• The rigorous statistical method incorporates a paired difference test that
compares daily/hourly samples of the baseline circuit data (“OFF” condition) to
the CVR circuit data (“ON” condition) under matched operating conditions.
Read DMS and Weather Data to Calculate Savings

15
Statistical Savings Analysis
Savings Results
Statistically Calculate Energy and Demand Savings

$267,000 in energy savings yielded for 8,760 hours
of CVR operations at the single Trabue Tx2
Demonstrated real-time feedback from premise level
readings enabled Dominion to continuously execute
voltage control to keep all customers in lower 5%
band
Trailing 180 day performance yields $292,000
(5,144 MWh) in annualized energy savings
2008 Voltage Control Operational Status: OFF
2009 Voltage Control Operational Status: ON
2010 Voltage Control Operational Status: ON & IMPROVED
System Installation
Transformer #2Circuit 410 & 422
Circuit 422
Circuit 410
Circuit 410
Circuit 422
Trabue
Circuit Geography
Successful precision control of voltage on two circuits in
the lower 5% band (114 to 120 volts) since January 28,
2009
6,697 meters deployed
Two 34.5 kV Urban Circuits
Direct Measurement and Validation of savings on circuits
implemented
Two Full Years of CVR Operation
Case Study – Midlothian Virginia
16
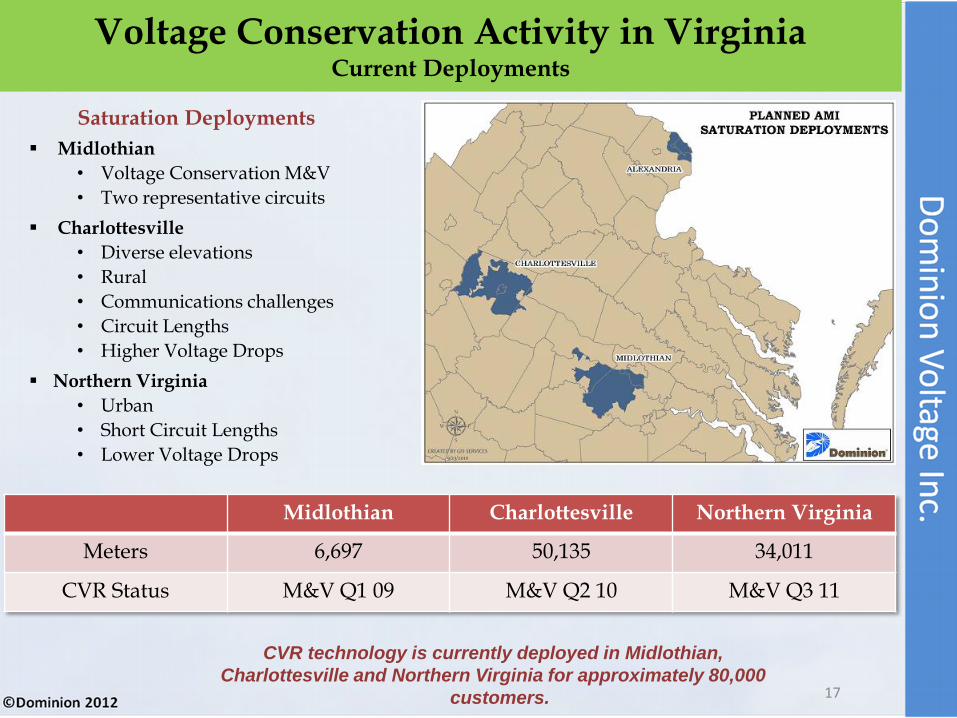
CVR technology is currently deployed in Midlothian,
Charlottesville and Northern Virginia for approximately 80,000
customers.
Saturation Deployments
Midlothian
• Voltage Conservation M&V
• Two representative circuits
Charlottesville
• Diverse elevations
• Rural
• Communications challenges
• Circuit Lengths
• Higher Voltage Drops
Northern Virginia
• Urban
• Short Circuit Lengths
• Lower Voltage Drops
Voltage Conservation Activity in Virginia Current Deployments
Midlothian Charlottesville Northern Virginia
Meters 6,697 50,135 34,011
CVR Status M&V Q1 09 M&V Q2 10 M&V Q3 11
17

Carbon Reduction
Fuel Reduction
Demand Reduction
Energy Reduction
Distribution Efficiency Program Benefits
Plan
Manage Validate
Plan
Manage Validate
Plan
Manage Validate
Plan
Manage Validate
Total CVR benefits increase as the Program is implemented across each circuit.
Tota
l Be
nef
its
Sustained Benefit Growth
Plan
Manage Validate
Year 1 Year 2 Year 3 Year 4 Year 5 Year 6 Year 7 Year 8
Not just a “one and done”, ensures achieved benefits are sustained & new benefits are added as your grid grows.
18

Cumulative Costs & Benefits over 10 Years
In August 2008, Dominion Virginia Power had developed a business case for its AMI solution for its 2.4 million Virginia jurisdictional customers. Projections based on data filed in Dominion Virginia Power rate case PUE – 2009-00019. Based on 2008 PJM Southern Region nodal forward price curves.
19

Peak Load Distribution Analysis, Control & Validation
Ckt 1
Ckt 2,3
Ckt 4,5,6
….
All Ckts
Slow
Voltage
Raise
CVR/VAR OFF CVR/VAR ON
Peak Hour Data Samples Water Heater Energy Storage Affect
Sequential Circuit Voltage Switching
Return to VVO level with no secondary peaks
No Customer impact
DSM VVO

Extending Measurement to the Utilization Level
ANSI C84.1 Standard System Voltages
Service Voltage: The voltage at the point where the electrical system of the supplier and
the electrical system of the user are connected.
Utilization Voltage: The voltage at the line terminals of utilization equipment.
Range A: Normal operational voltage range. Occurrence of voltage outside this range
should be infrequent.
Range B: Excursions of voltage above and below the Range A limits. While a part of
practical operations, these excursions shall be limited in extent, frequency, and
duration. Corrective action shall be taken to restore to Range A.

Plan
Manage Validate
Geospatial Distribution Analysis, Control & Validation

Power Tagging Technologies Sensors to measure grid device connectivity, voltage and load

Greenlet Technologies Sensors to measure and control utilization level voltage and Load
Centralized Application for Energy Service
Companies and Utilities: Manages usage of
millions of appliances in order to reduce peak
power consumption. The software application
monitors power, predicts power consumption and
power reduction potential, sends notifications to
customers prior to peak events, controls power
reduction via Greenlet units and Internet
communications, verifies actual power reduction
and provides the required information for billing to
help calculate payback to consumers for "Peak
Shaving".

Viridity Energy

Extending Measurement to the Utilization Level

Case Study & Demonstration: VCU MicroGrid

MicroGrid Vision: VCU Results to the Distribution Grid “Under Construction”

Carbon Reduction
Fuel Reduction
Demand Reduction
Energy Reduction
Sustainable Provisioning of the Distribution Grid
Plan
Provision
Manage Validate
Plan
Provision
Manage Validate
Plan
Provision
Manage Validate
Plan
Provision
Manage Validate
Total benefits increase as the Program is implemented across each Microgrid.
Tota
l Be
nef
its
Sustained Benefit Growth
Plan
Provision
Manage Validate
Year 1 Year 2 Year 3 Year 4 Year 5 Year 6 Year 7 Year 8
Not just a “one and done”, ensures achieved benefits are sustained & new benefits are added as your grid grows.
29

Summary
30
Using Geospatial Distribution technology Dominion has developed and demonstrated a measurement based voltage control algorithm which enables a practical execution of conservation voltage reduction with voltage optimization.
The Voltage optimization integrates between the existing DMS Software and AMI.
Independent Measurement and Verification module for Voltage Optimization confirms through verifiable statistical analysis demand and energy savings was achieved
The results of the demonstration prove that there are measurable reductions in energy usage using voltage optimization with customer voltage measurement also improves voltage service.
Dominion’s demonstration shows an average of 2.8% reduction in annual energy.
Energy savings do not depend on changing customer behavior, additional customer purchases or
adoption of in-home technology
AMI technology demonstrates a practical and sustainable method of controlling voltage, providing
continuous improvement of circuit performance and clear independent measurement of average circuit
savings per customer without the inaccuracies of a non-sustainable circuit model.

Questions & Answers


![[ANSI C84.1-2006] Electric Power Systems and Equipment - Voltage Ratings (60 Hertz)](https://static.fdocuments.in/doc/165x107/544b683eaf7959ac438b5204/ansi-c841-2006-electric-power-systems-and-equipment-voltage-ratings-60-hertz.jpg)