Utah’s Geology & the History of the Earth Utah’s Geologic Past: Hadeon to Proterozoic.

Utah’s Uninsured Rate
A review of recent data from the Gallup Healthways Survey, Utah Dept. of Health,
and U.S. Census Data
October 2016

Sources: U.S. Census: 2006-2015 American Community Survey 1-year, 5-year estimates, S2701 (https://www.census.gov/programs-surveys/acs/) DOH (BRFSS): http://ibis.health.utah.gov/pdf/opha/publication/ins/InsHighlights_2014.pdf Gallup Healthways: “Arkansas, Kentucky Set Pace in Reducing Uninsured Rate;” 2/4/16; [2015] http://www.well-beingindex.com/arkansas-kentucky-reduce-uninsured-rateBeing&utm_medium=newsfeed&utm_campaign=tiles
Utah’s uninsured rate is decreasing according to all three state and national surveys
Index
ACA Coverage Available
16.7%
15.7%
16.3% 15.9%
16.7% 16.6%
15.7%
14.0%
12.5%
10.5%
9.1%
10.2%
11.6%
11.9%
10.6% 10.7%
11.2%
10.6%
13.4%
13.2%
11.6%
10.3%
15.6%
13.3%
12.4%
8%
9%
10%
11%
12%
13%
14%
15%
16%
17%
18%
2003 2004 2005 2006 2007 2008 2009 2010 2011 2012 2013 2014 2015
UT: Census/SAHIE
UT:DOH (BRFSS)
UT: Gallup-Healthways

Census: Utah
Source: [2015] U.S. Census: 2006-2015 American Community Survey 1-year estimates , S2701 (https://www.census.gov/programs-surveys/acs/) [2014] www2.census.gov/programs-surveys/acs/tech_docs/accuracy/ACS_Accuracy_of_Data_2014.pdf [2006-2013] http://www.census.gov/did/www/sahie/data/interactive/sahie.html
The latest U.S. Census data shows a 16% drop in the Utah’s uninsured rate between 2014-15
ACA Coverage Available
16.7%
15.7%
16.3% 15.9%
16.7% 16.6%
15.7%
14.0%
12.5%
10.5%
8%
9%
10%
11%
12%
13%
14%
15%
16%
17%
18%
2006 2007 2008 2009 2010 2011 2012 2013 2014 2015
16%

Year Uninsured Percent Uninsured Number
2006 16.7% 400,573
2007 15.7% 388,199
2008 16.3% 399,117
2009 15.9% 397,784
2010 16.7% 414,476
2011 16.6% 417,274
2012 15.7% 398,299
2013 14.0% 402,000
2014 12.5% 366,000
2015 10.5% 311,000
The number of uninsured Utahns has declined by 103,000 since 2010
Source: [2015] U.S. Census: 2006-2015 American Community Survey 1-year estimates , S2701 (https://www.census.gov/programs-surveys/acs/) [2014] www2.census.gov/programs-surveys/acs/tech_docs/accuracy/ACS_Accuracy_of_Data_2014.pdf [2006-2013] http://www.census.gov/did/www/sahie/data/interactive/sahie.html
Census: Utah
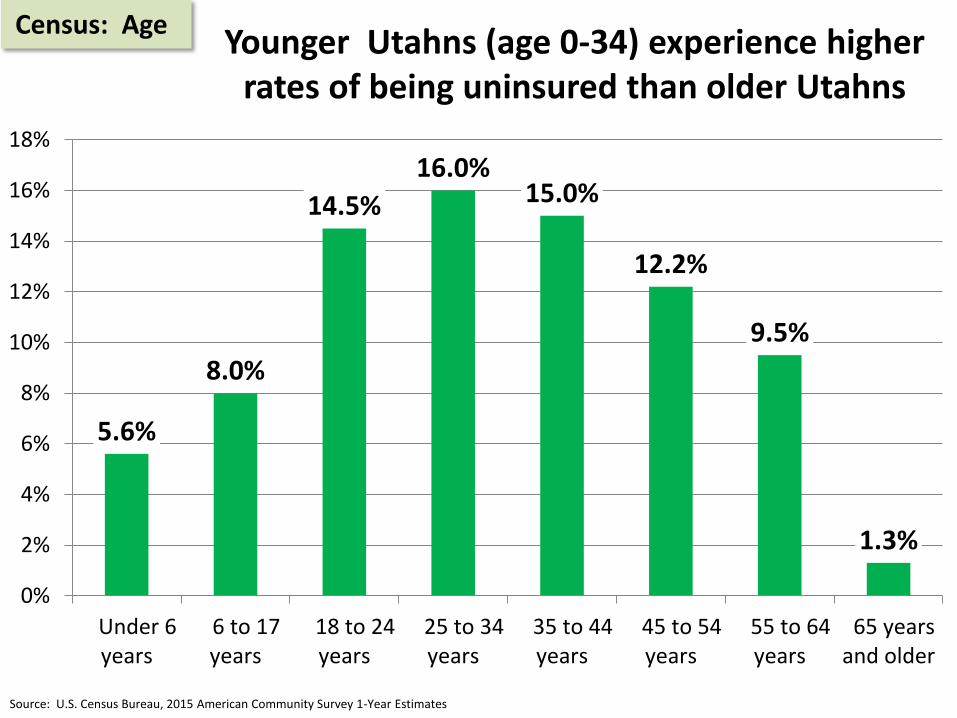
Younger Utahns (age 0-34) experience higher rates of being uninsured than older Utahns
Census: Age
5.6%
8.0%
14.5%
16.0% 15.0%
12.2%
9.5%
1.3%
0%
2%
4%
6%
8%
10%
12%
14%
16%
18%
Under 6years
6 to 17years
18 to 24years
25 to 34years
35 to 44years
45 to 54years
55 to 64years
65 yearsand older
Source: U.S. Census Bureau, 2015 American Community Survey 1-Year Estimates

Utah’s uninsured rate by age compares well to other Mountain West states except Colorado
Census: Age
Source: U.S. Census Bureau, 2015 American Community Survey 1-Year Estimates
7.2%
15.3%
13.8%
9.5%
1.3%
4.2%
13.5%
10.9%
6.3%
0.7%
7.6%
19.5%
15.0%
13.7%
0.3%
8.3%
18.1%
14.2%
8.7%
1.1%
4.5%
19.4%
16.3%
10.3%
1.0%
0%
5%
10%
15%
20%
25%
Age 0-17 Age 18-34 Age 35-54 Age 55-64 Over 65
Utah
Colorado
Montana
Arizona
New Mexico

Source: U.S. Census Bureau, 2015 American Community Survey 1-Year Estimates
American Indians and Hispanics experience the highest rates of being uninsured in Utah
Census: Race
7.1%
10.8% 13.4% 14.1%
22.5%
26.8%
32.8% 36.0%
0%
5%
10%
15%
20%
25%
30%
35%
40%
Whitealone, notHispanicor Latino
Two ormoreraces
Black orAfrican
Americanalone
Asianalone
NativeHawaiianand Other
PacificIslander
alone
Hispanicor Latino(of anyrace)
Someother race
alone
AmericanIndian and
AlaskaNativealone
Utah average: 10.5%
Source: B27001I: Health Insurance Coverage Status by Age (Hispanic or Latino) Universe: Hispanic or Latino civilian non-institutionalized population; American Community Survey, 1-years estimates, (2015)
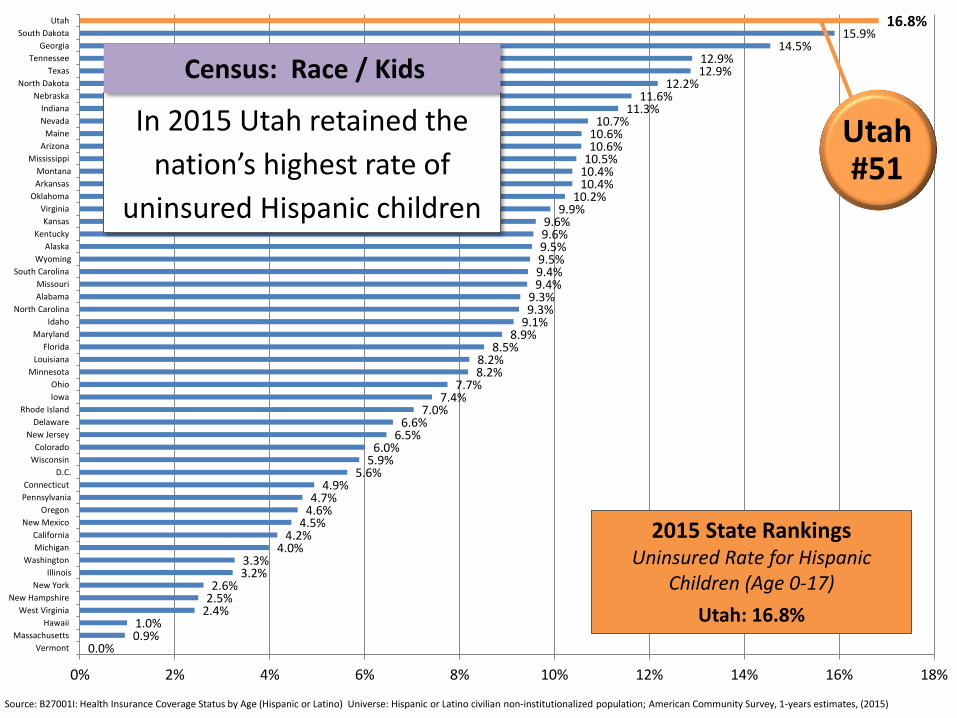
0.0% 0.9% 1.0%
2.4% 2.5% 2.6%
3.2% 3.3%
4.0% 4.2%
4.5% 4.6% 4.7%
4.9% 5.6%
5.9% 6.0%
6.5% 6.6%
7.0% 7.4%
7.7% 8.2% 8.2%
8.5% 8.9%
9.1% 9.3% 9.3%
9.4% 9.4% 9.5% 9.5% 9.6% 9.6%
9.9% 10.2%
10.4% 10.4% 10.5% 10.6% 10.6%
10.7% 11.3%
11.6% 12.2%
12.9% 12.9%
14.5% 15.9%
16.8%
0% 2% 4% 6% 8% 10% 12% 14% 16% 18%
Vermont
Massachusetts
Hawaii
West Virginia
New Hampshire
New York
Illinois
Washington
Michigan
California
New Mexico
Oregon
Pennsylvania
Connecticut
D.C.
Wisconsin
Colorado
New Jersey
Delaware
Rhode Island
Iowa
Ohio
Minnesota
Louisiana
Florida
Maryland
Idaho
North Carolina
Alabama
Missouri
South Carolina
Wyoming
Alaska
Kentucky
Kansas
Virginia
Oklahoma
Arkansas
Montana
Mississippi
Arizona
Maine
Nevada
Indiana
Nebraska
North Dakota
Texas
Tennessee
Georgia
South Dakota
Utah
Utah #51
2015 State Rankings Uninsured Rate for Hispanic
Children (Age 0-17)
Utah: 16.8%
In 2015 Utah retained the
nation’s highest rate of
uninsured Hispanic children
Census: Race / Kids
Source: Health Insurance Coverage Status by Age (Hispanic or Latino); Hispanic or Latino civilian non-institutionalized population; American Community Survey 1-Year Estimate (2012-2015)
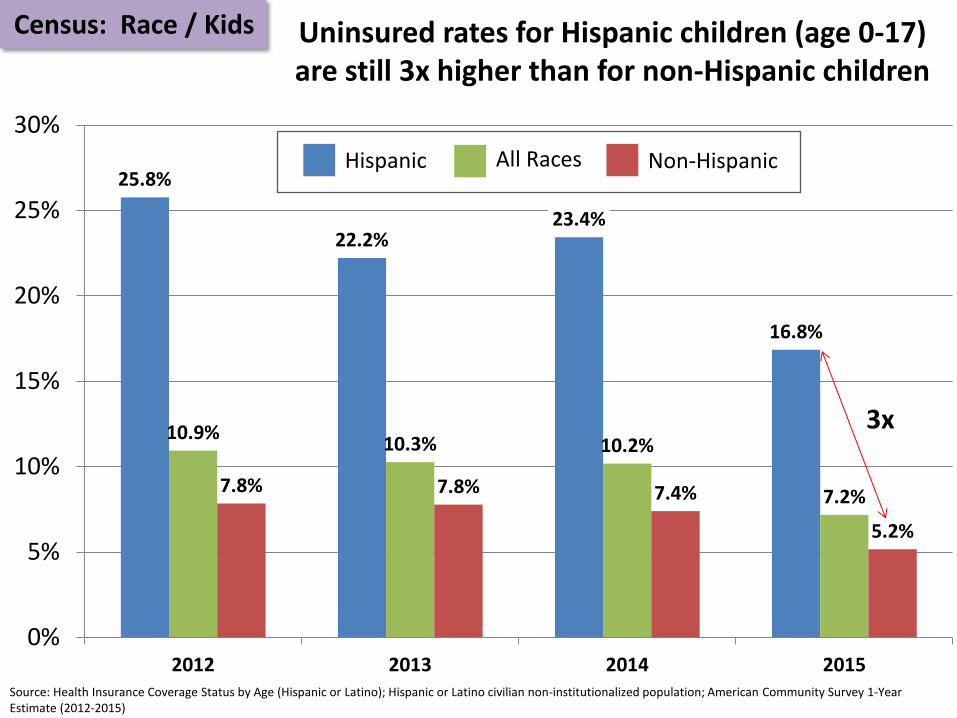
Census: Race / Kids
25.8%
22.2% 23.4%
16.8%
10.9% 10.3% 10.2%
7.2% 7.8% 7.8% 7.4%
5.2%
0%
5%
10%
15%
20%
25%
30%
2012 2013 2014 2015
Hispanic All Races Non-Hispanic
Uninsured rates for Hispanic children (age 0-17) are still 3x higher than for non-Hispanic children
3x

Source: Health Insurance Coverage Status by Age (Hispanic or Latino); Hispanic or Latino civilian non-institutionalized population; American Community Survey 1-Year Estimate (2012-2015)
Census: Race / Kids
25.8%
22.2%
23.4%
16.8%
10.9% 10.3% 10.2%
7.2% 7.8% 7.8% 7.4%
5.2%
0%
5%
10%
15%
20%
25%
30%
2012 2013 2014 2015
Hispanic All Races Non-Hispanic
3x
Uninsured rates for Hispanic children (age 0-17) are still 3x higher than for non-Hispanic children
Source: Health Insurance Coverage Status by Age (Hispanic or Latino); Hispanic or Latino civilian non-institutionalized population; American Community Survey 1-Year Estimate (2012-2015); 2015 American Community Survey 1-Year Estimates (2015)
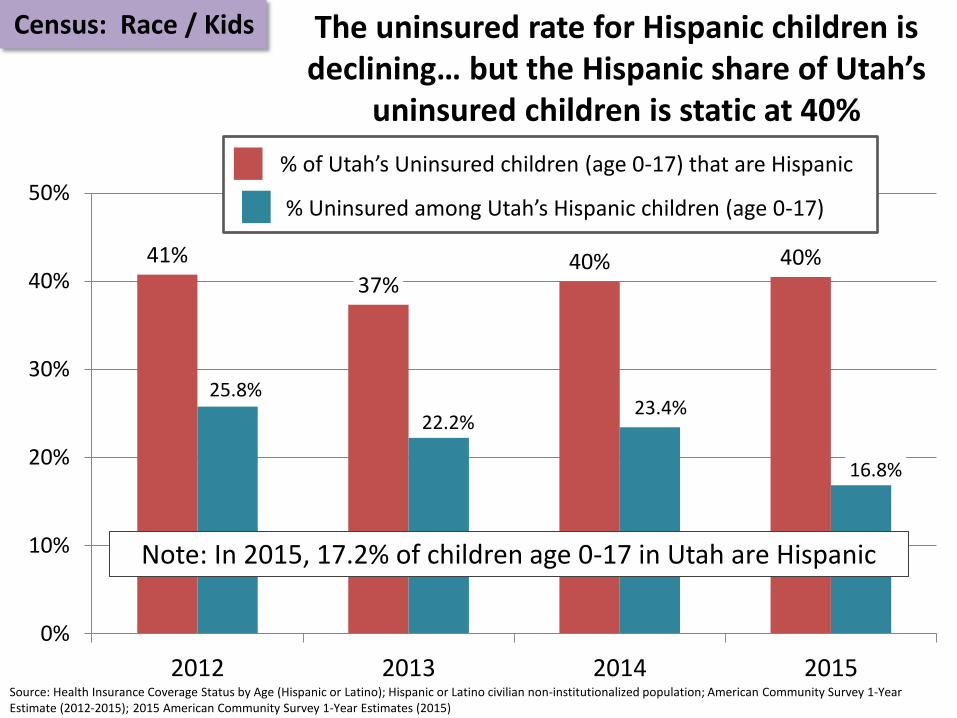
Census: Race / Kids
41%
37% 40% 40%
25.8%
22.2% 23.4%
16.8%
0%
10%
20%
30%
40%
50%
2012 2013 2014 2015
% of Utah’s Uninsured children (age 0-17) that are Hispanic
% Uninsured among Utah’s Hispanic children (age 0-17)
The uninsured rate for Hispanic children is declining… but the Hispanic share of Utah’s
uninsured children is static at 40%
Note: In 2015, 17.2% of children age 0-17 in Utah are Hispanic

Sources: [2009-2015] U.S. census American Community Survey, 1-year , 5-year estimates, (S2701)
Salt Lake County’s uninsured rate has dropped 30% since 2013
Census: Davis, Salt Lake, Utah Counties
9.1% 9.4%
10.3%
8.3%
9.0%
7.8% 7.8%
15.9%
17.2%
16.4%
16.2% 15.9%
13.7%
11.2%
12.4%
13.6%
14.4%
12.8% 12.5%
10.8%
9.5%
6.0%
8.0%
10.0%
12.0%
14.0%
16.0%
18.0%
2009 2010 2011 2012 2013 2014 2015
Davis
Salt Lake
Utah

Sources: [2009-2015] U.S. census American Community Survey, 1-year , 5-year estimates, (S2701)
Cache County’s uninsured rate has dropped 56% since 2013… while Washington County’s has increased 3%
Census: Cache, Washington, Weber Counties
11.6%
12.6% 12.5% 12.9%
12.2%
9.7%
5.3%
17.2% 16.9%
18.3%
17.3%
16.1%
18.0%
16.6%
18.6%
16.2% 15.9% 16.3%
14.3%
12.0%
9.4%
5.0%
7.0%
9.0%
11.0%
13.0%
15.0%
17.0%
19.0%
2009 2010 2011 2012 2013 2014 2015
Cache
Washington
Weber
8.6%
3.3%
8.2% 9.7%
-1.7%
-12.9%
-0.8%
9.6%
-4.7%
5.9% 8.3%
-1.9%
3.2%
-19.4%
-1.2%
-11.1%
-5.5%
2.5%
-5.4%
8.4%
-1.9% -2.3%
-6.9%
-12.3%
-20.5%
-13.3% -13.8% -13.6%
11.8%
-16.1%
-45.4%
0.0%
-18.2%
-12.0%
-7.8%
-21.7%
-50%
-40%
-30%
-20%
-10%
0%
10%
20%
Sources: [2009-2015] U.S. census American Community Survey, 1-year , 5-year estimates, (S2701)
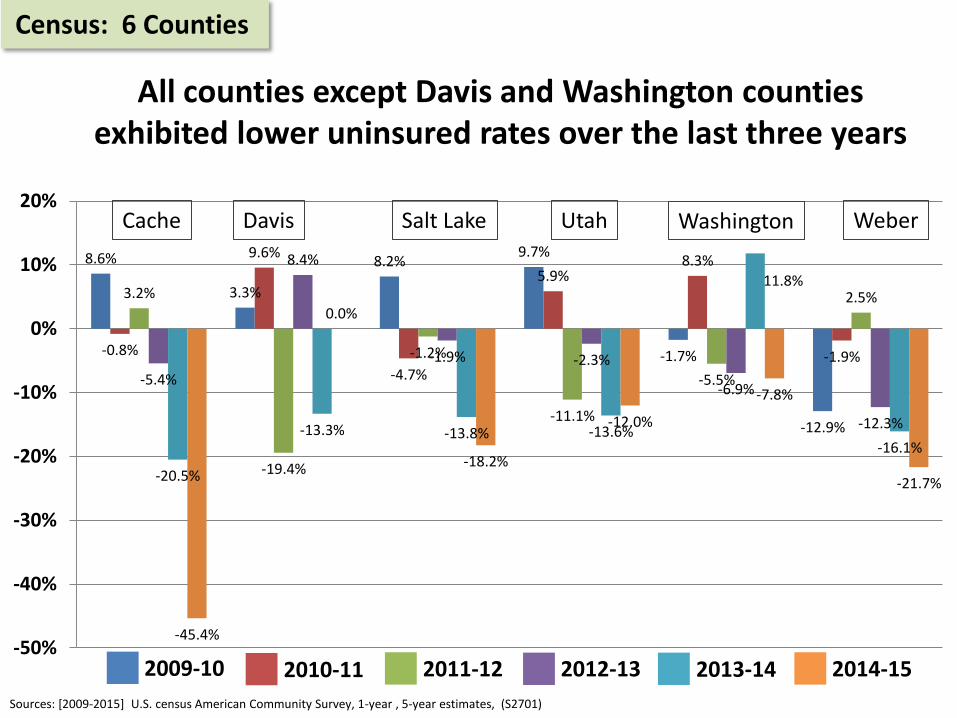
All counties except Davis and Washington counties exhibited lower uninsured rates over the last three years
Census: 6 Counties
Cache Salt Lake Davis Utah Washington Weber
2009-10 2010-11 2011-12 2012-13 2013-14 2014-15

Salt Lake County’s uninsured rate for 18-64 year-olds declined 17% between 2014 and 2015
Source: Source: [2015] U.S. Census: 2006-2015 American Community Survey 1-year estimates , S2701 (https://www.census.gov/programs-surveys/acs/); U.S. Census SAHIE, “Health Insurance Coverage Status” 2009-2014 American Community Survey 1-Year Estimates http://factfinder.census.gov/faces/tableservices/jsf/pages/productview.xhtml?pid=ACS_14_1YR_S2701&prodType=table
Census: Salt Lake
ACA Coverage Available
18.9%
19.9% 19.7%
18.9% 18.5%
16.2%
13.8%
20.1%
22.1%
20.4% 20.4% 20.0%
17.2%
14.3%
12%
14%
16%
18%
20%
22%
24%
2009 2010 2011 2012 2013 2014 2015
Age 18-64 | Utah Age 18-64 | Salt Lake County
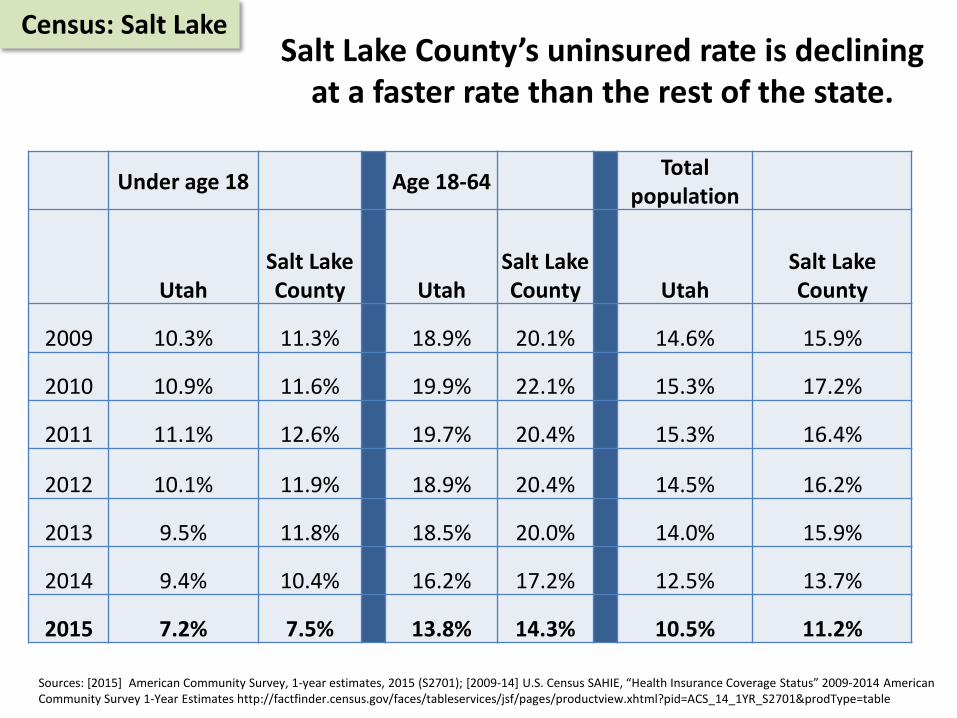
Under age 18 Age 18-64
Total population
Utah Salt Lake County Utah
Salt Lake County Utah
Salt Lake County
2009 10.3% 11.3% 18.9% 20.1% 14.6% 15.9%
2010 10.9% 11.6% 19.9% 22.1% 15.3% 17.2%
2011 11.1% 12.6% 19.7% 20.4% 15.3% 16.4%
2012 10.1% 11.9% 18.9% 20.4% 14.5% 16.2%
2013 9.5% 11.8% 18.5% 20.0% 14.0% 15.9%
2014 9.4% 10.4% 16.2% 17.2% 12.5% 13.7%
2015 7.2% 7.5% 13.8% 14.3% 10.5% 11.2%
Sources: [2015] American Community Survey, 1-year estimates, 2015 (S2701); [2009-14] U.S. Census SAHIE, “Health Insurance Coverage Status” 2009-2014 American Community Survey 1-Year Estimates http://factfinder.census.gov/faces/tableservices/jsf/pages/productview.xhtml?pid=ACS_14_1YR_S2701&prodType=table
Salt Lake County’s uninsured rate is declining at a faster rate than the rest of the state.
Census: Salt Lake