UTAH’S CURRENT ECONOMIC OVERVIEW April 2014 Mark Knold Supervising Economist Utah Department of...
46
UTAH’S CURRENT ECONOMIC OVERVIEW April 2014 Mark Knold Supervising Economist Utah Department of Workforce Services
-
Upload
owen-nichols -
Category
Documents
-
view
221 -
download
3
Transcript of UTAH’S CURRENT ECONOMIC OVERVIEW April 2014 Mark Knold Supervising Economist Utah Department of...

UTAH’S CURRENT ECONOMIC OVERVIEW
April 2014
Mark Knold
Supervising Economist
Utah Department of Workforce Services
Eco
no
my
Anatomy of a Business Cycle
Time
Peak
Trough
Contraction Expansion
Recovery Prosperity
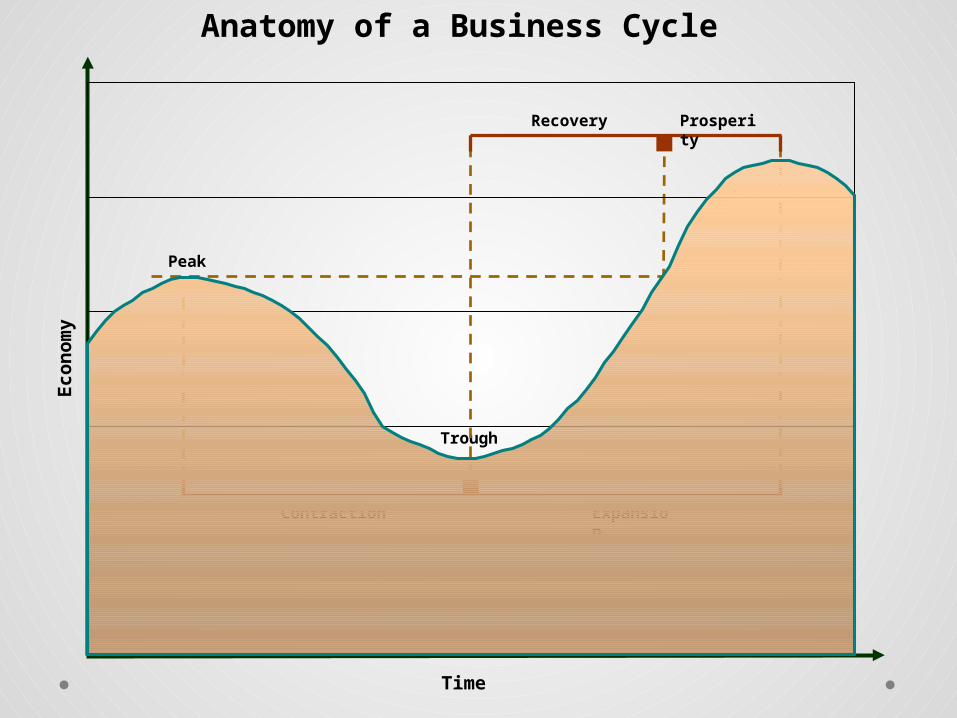
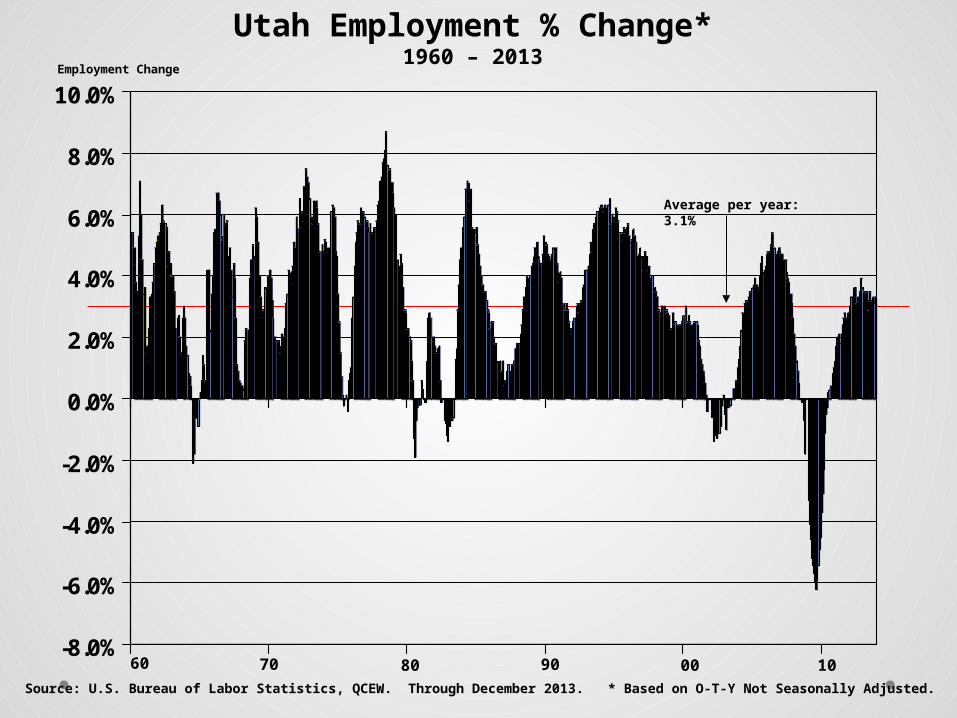
-14.5%-11.5%-11.4%
-9.9%-8.8%
-8.6%-8.6%-8.5%
-8.2%-8.0%-8.0%
-7.8%-7.8%-7.7%-7.7%-7.6%
-7.4%-7.4%
-6.9%-6.9%-6.8%-6.7%-6.6%-6.5%-6.4%-6.4%
-6.2%-6.0%-6.0%
-5.5%-5.5%
-5.0%-5.0%-4.9%-4.8%-4.8%
-4.6%-4.5%-4.4%-4.4%-4.3%-4.2%
-4.0%-3.6%-3.6%
-3.4%-3.2%
-3.0%-2.0%
-1.0%
NevadaFloridaArizonaMichiganCaliforniaIdahoSouth CarolinaOregonGeorgiaNorth CarolinaIndianaOhioDelawareTennesseeAlabamaRhode IslandHawaiiUtahIllinoisConnecticutWashingtonWyomingMississippiKentuckyColoradoNew JerseyMissouriWisconsinNew MexicoMinnesotaMarylandKansasArkansasVirginiaOklahomaNewMaineMontanaVermontPennsylvaniaMassachusettsIowaTexasLouisianaNew YorkNebraskaWest VirginiaSouth DakotaDCAlaskaNorth Dakota
State by State Employment Decline
Source: U.S. Bureau of Labor Statistics.
Peak to Trough Decline
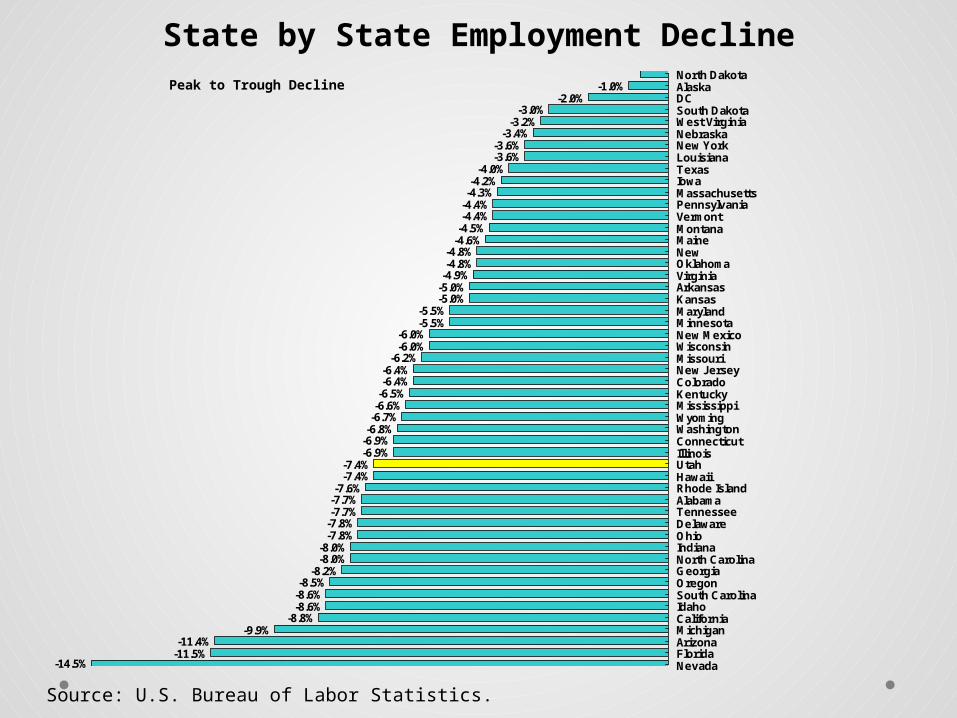
Utah Employment % Change*1960 – 2013
-8.0%
-6.0%
-4.0%
-2.0%
0.0%
2.0%
4.0%
6.0%
8.0%
10.0%
Source: U.S. Bureau of Labor Statistics, QCEW. Through December 2013. * Based on O-T-Y Not Seasonally Adjusted.
60 70 80 90 00 10
Average per year: 3.1%
Employment Change

Eco
no
my
Anatomy of a Business Cycle
Time
Peak
Trough
Contraction Expansion
Recovery Prosperity
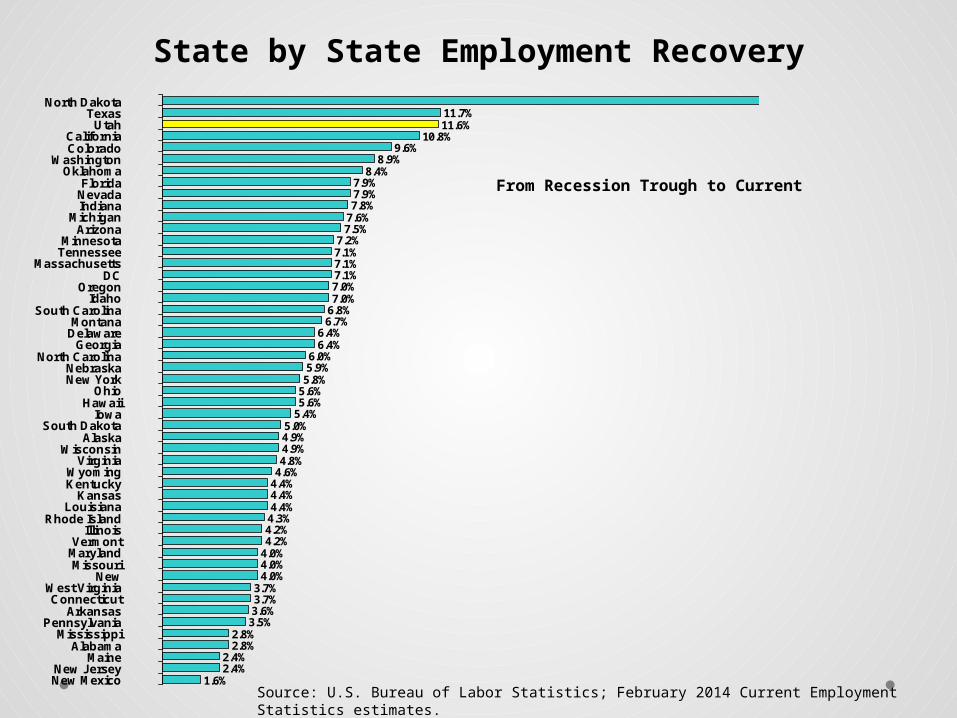
1.6%2.4%2.4%
2.8%2.8%
3.5%3.6%3.7%3.7%
4.0%4.0%4.0%4.2%4.2%4.3%4.4%4.4%4.4%4.6%4.8%4.9%4.9%5.0%
5.4%5.6%5.6%5.8%5.9%6.0%
6.4%6.4%
6.7%6.8%7.0%7.0%7.1%7.1%7.1%7.2%
7.5%7.6%7.8%7.9%7.9%
8.4%8.9%
9.6%10.8%
11.6%11.7%
New MexicoNew Jersey
MaineAlabama
MississippiPennsylvania
ArkansasConnecticut
West VirginiaNew
MissouriMarylandVermont
IllinoisRhode Island
LouisianaKansas
KentuckyWyoming
VirginiaWisconsin
AlaskaSouth Dakota
IowaHawaii
OhioNew YorkNebraska
North CarolinaGeorgia
DelawareMontana
South CarolinaIdaho
OregonDC
MassachusettsTennesseeMinnesota
ArizonaMichigan
IndianaNevadaFlorida
OklahomaWashington
ColoradoCalifornia
UtahTexas
North Dakota
State by State Employment Recovery
Source: U.S. Bureau of Labor Statistics; February 2014 Current Employment Statistics estimates.
From Recession Trough to Current

Eco
no
my
Anatomy of a Business Cycle
Time
Peak
Trough
Contraction Expansion
Recovery Prosperity
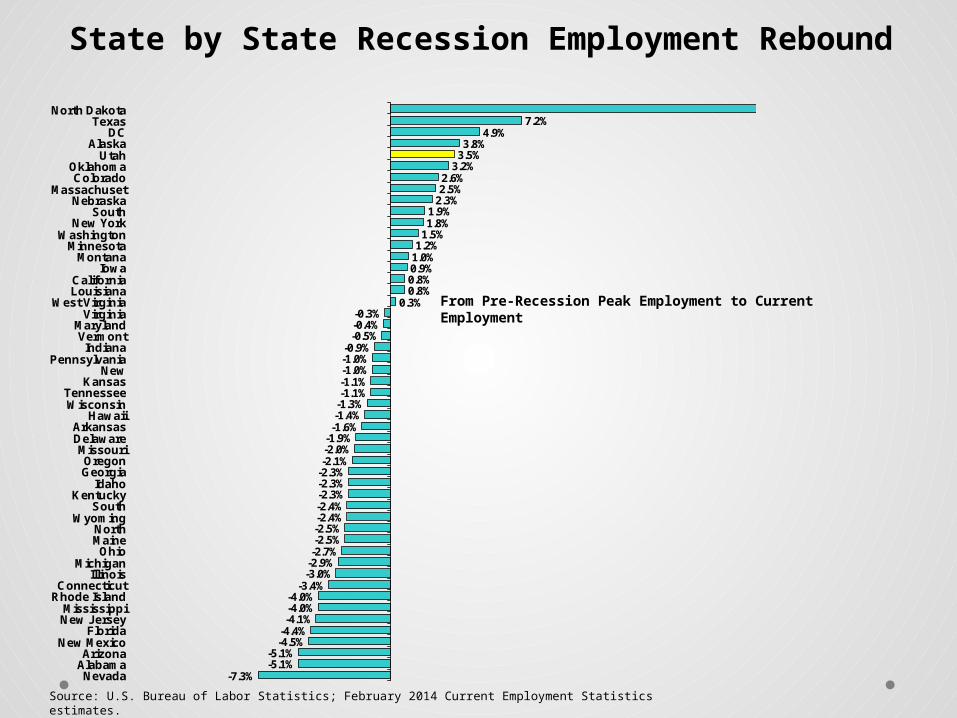
-7.3%-5.1%-5.1%
-4.5%-4.4%-4.1%-4.0%-4.0%
-3.4%-3.0%-2.9%-2.7%-2.5%-2.5%-2.4%-2.4%-2.3%-2.3%-2.3%-2.1%-2.0%-1.9%-1.6%-1.4%-1.3%-1.1%-1.1%-1.0%-1.0%-0.9%
-0.5%-0.4%-0.3%
0.3%0.8%0.8%0.9%1.0%1.2%1.5%1.8%1.9%
2.3%2.5%2.6%
3.2%3.5%3.8%
4.9%7.2%
NevadaAlabamaArizona
New MexicoFlorida
New JerseyMississippi
Rhode IslandConnecticut
IllinoisMichigan
OhioMaineNorth
WyomingSouth
KentuckyIdaho
GeorgiaOregon
MissouriDelawareArkansas
HawaiiWisconsinTennessee
KansasNew
PennsylvaniaIndiana
VermontMaryland
VirginiaWest Virginia
LouisianaCalifornia
IowaMontana
MinnesotaWashington
New YorkSouth
NebraskaMassachuset
ColoradoOklahoma
UtahAlaska
DCTexas
North Dakota
State by State Recession Employment Rebound
Source: U.S. Bureau of Labor Statistics; February 2014 Current Employment Statistics estimates.
From Pre-Recession Peak Employment to Current Employment
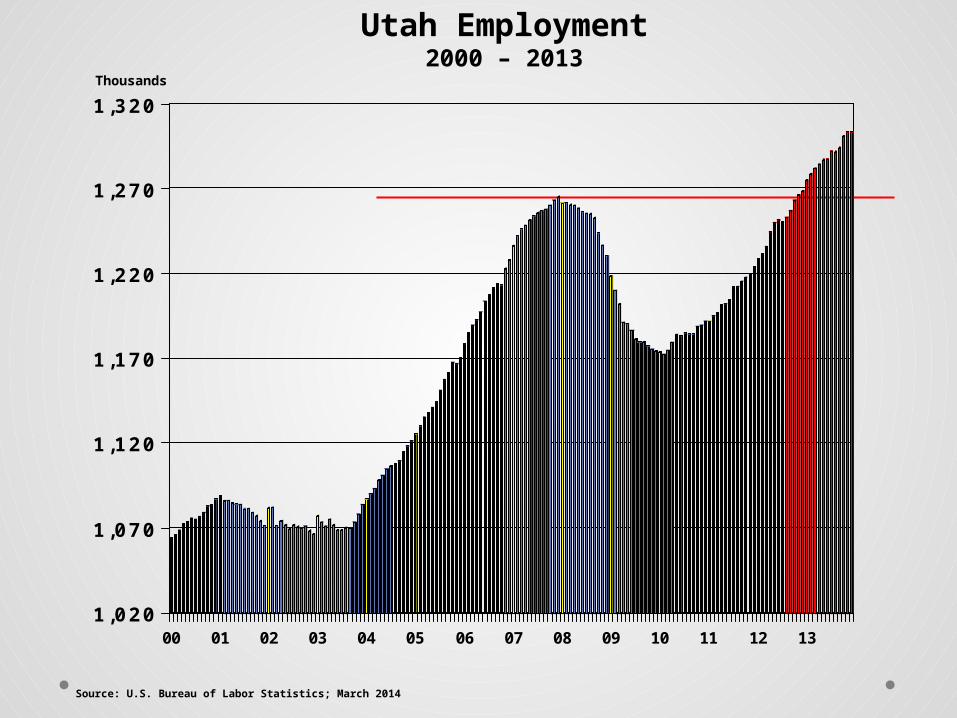
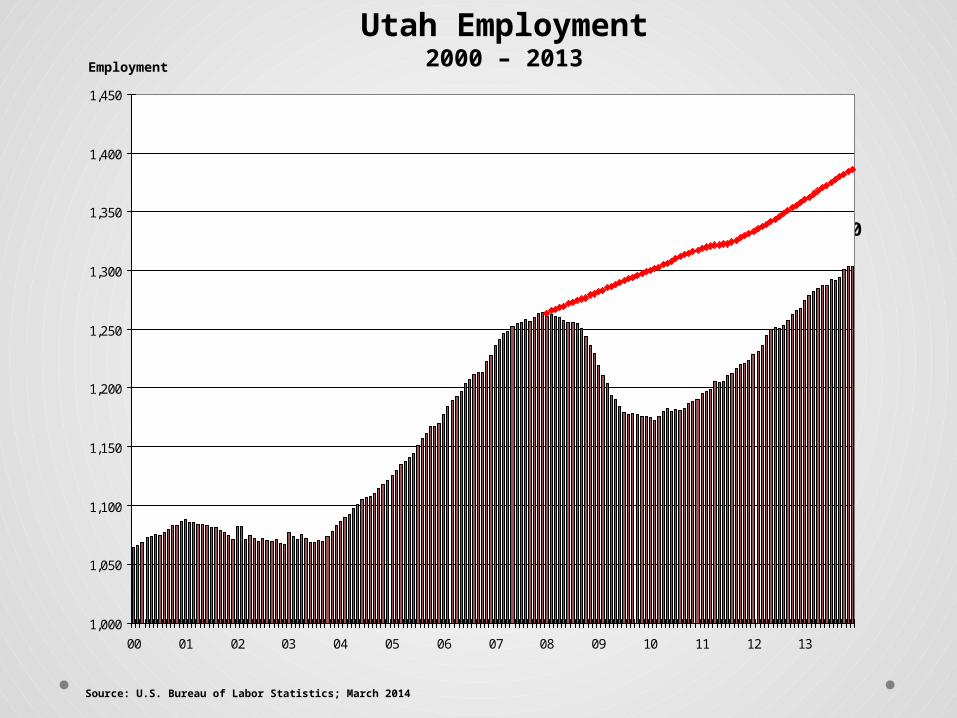
1,020
1,070
1,120
1,170
1,220
1,270
1,320
00 01 02 03 04 05 06 07 08 09 10 11 12 13
Source: U.S. Bureau of Labor Statistics; March 2014
Thousands
Utah Employment2000 – 2013
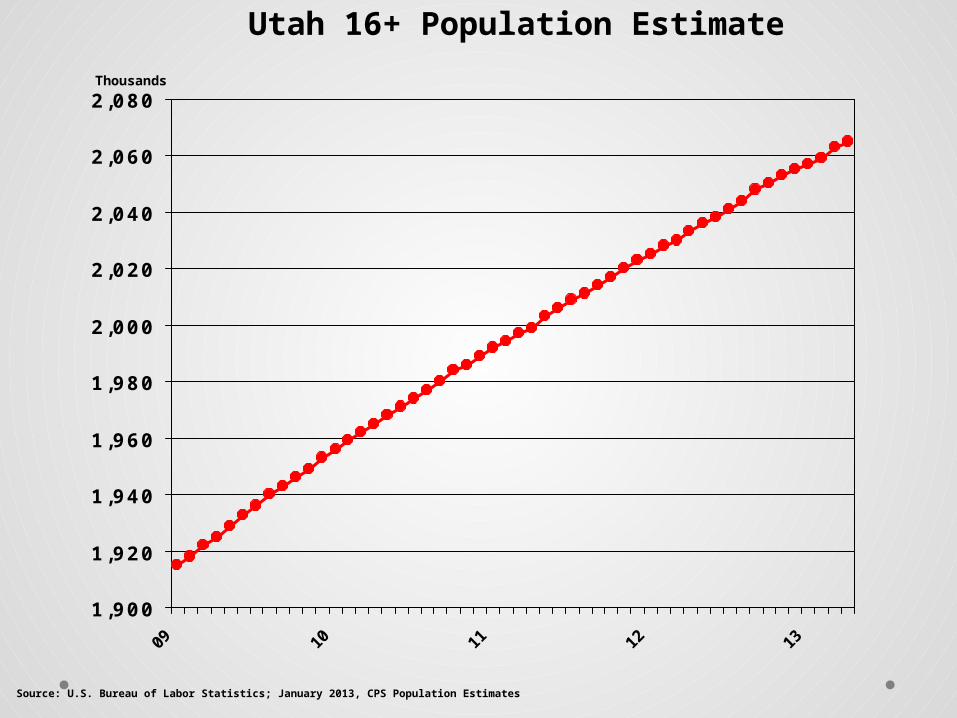
Utah 16+ Population Estimate
1,900
1,920
1,940
1,960
1,980
2,000
2,020
2,040
2,060
2,080
Source: U.S. Bureau of Labor Statistics; January 2013, CPS Population Estimates
Thousands
1,000
1,050
1,100
1,150
1,200
1,250
1,300
1,350
1,400
1,450
00 01 02 03 04 05 06 07 08 09 10 11 12 13
Employment
Labor Force Growth
Source: U.S. Bureau of Labor Statistics; March 2014
66,000
Utah Employment2000 – 2013
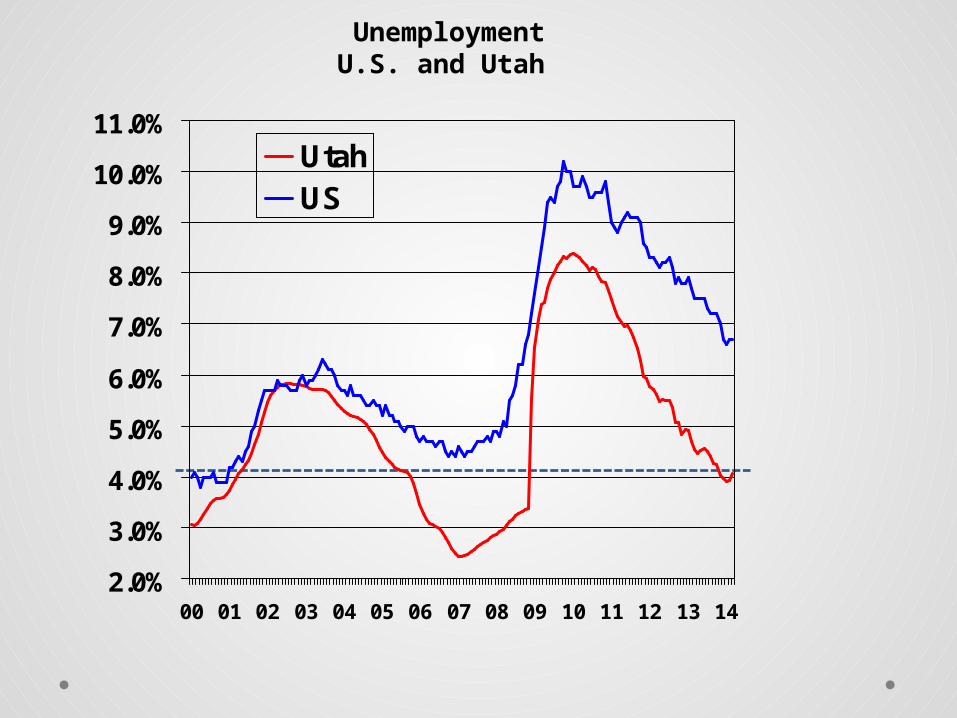
2.0%
3.0%
4.0%
5.0%
6.0%
7.0%
8.0%
9.0%
10.0%
11.0%
00 01 02 03 04 05 06 07 08 09 10 11 12 13 14
UtahUS
UnemploymentU.S. and Utah
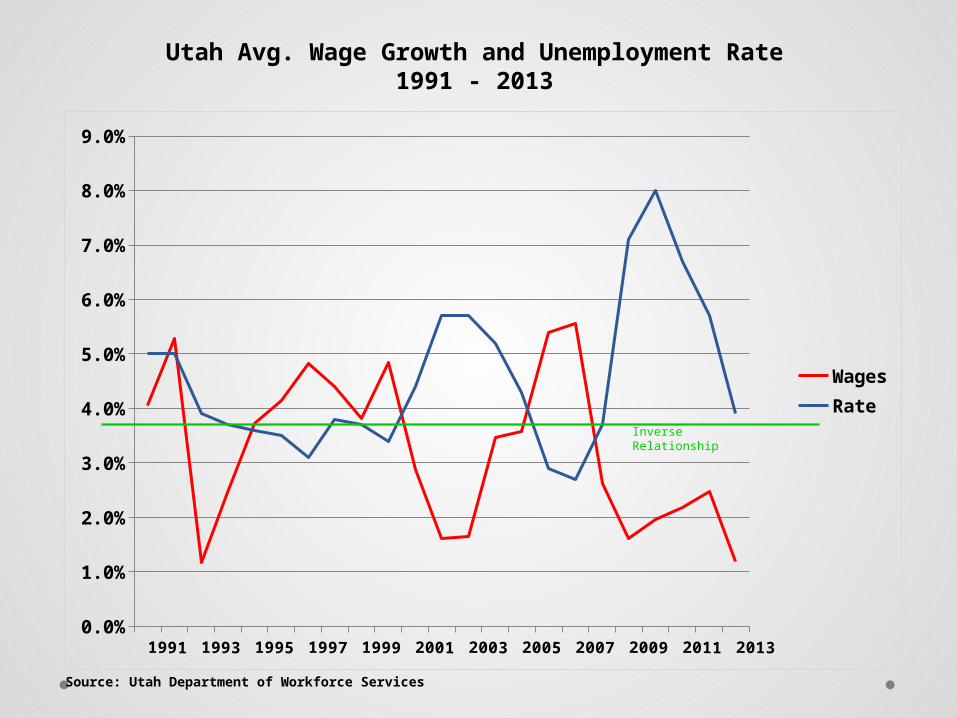
1991 1993 1995 1997 1999 2001 2003 2005 2007 2009 2011 20130.0%
1.0%
2.0%
3.0%
4.0%
5.0%
6.0%
7.0%
8.0%
9.0%
WagesRate
Utah Avg. Wage Growth and Unemployment Rate1991 - 2013
Source: Utah Department of Workforce Services
Inverse Relationship
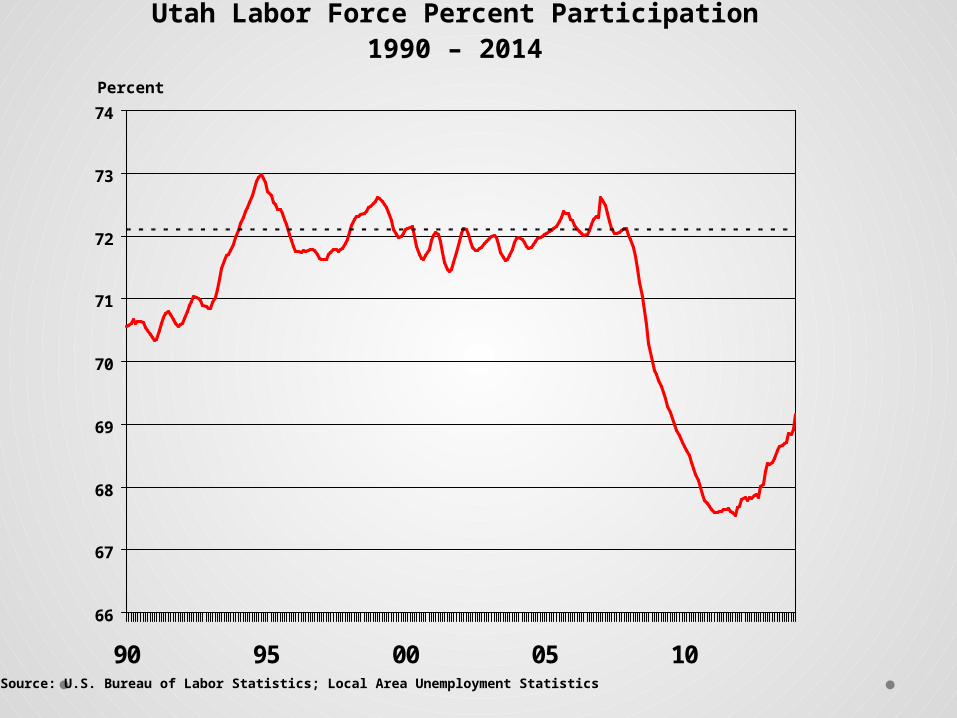
66
67
68
69
70
71
72
73
74
90 95 00 05 10
Utah Labor Force Percent Participation1990 – 2014
Percent
Source: U.S. Bureau of Labor Statistics; Local Area Unemployment Statistics
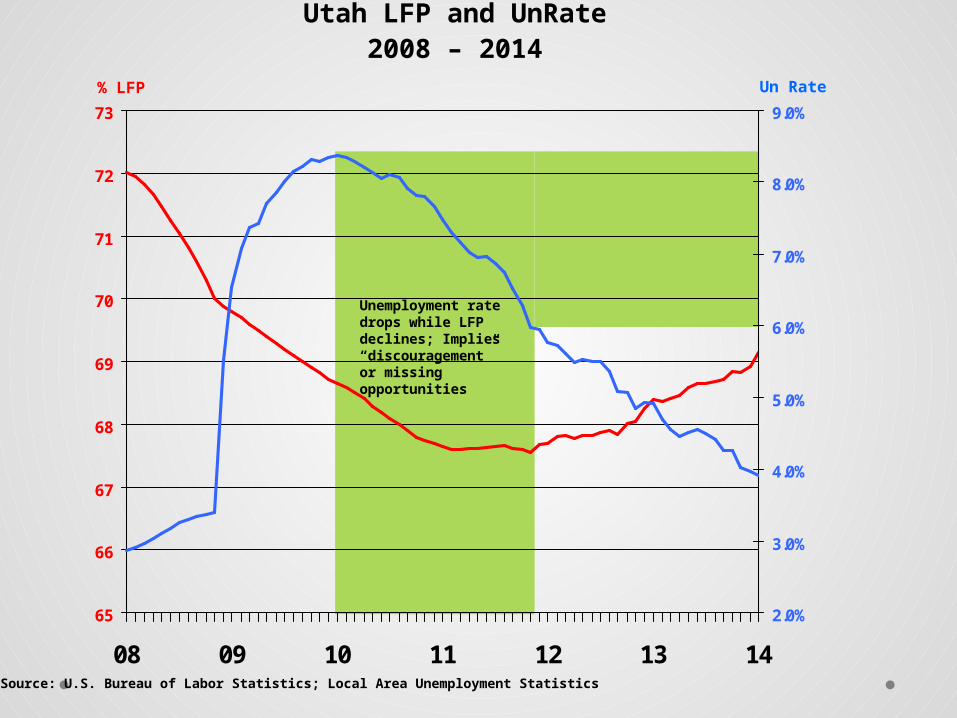
65
66
67
68
69
70
71
72
73
08 09 10 11 12 13 14
2.0%
3.0%
4.0%
5.0%
6.0%
7.0%
8.0%
9.0%
Utah LFP and UnRate2008 – 2014
% LFP
Source: U.S. Bureau of Labor Statistics; Local Area Unemployment Statistics
Un Rate
Unemployment rate drops while LFP declines; Implies “discouragement” or missing opportunities
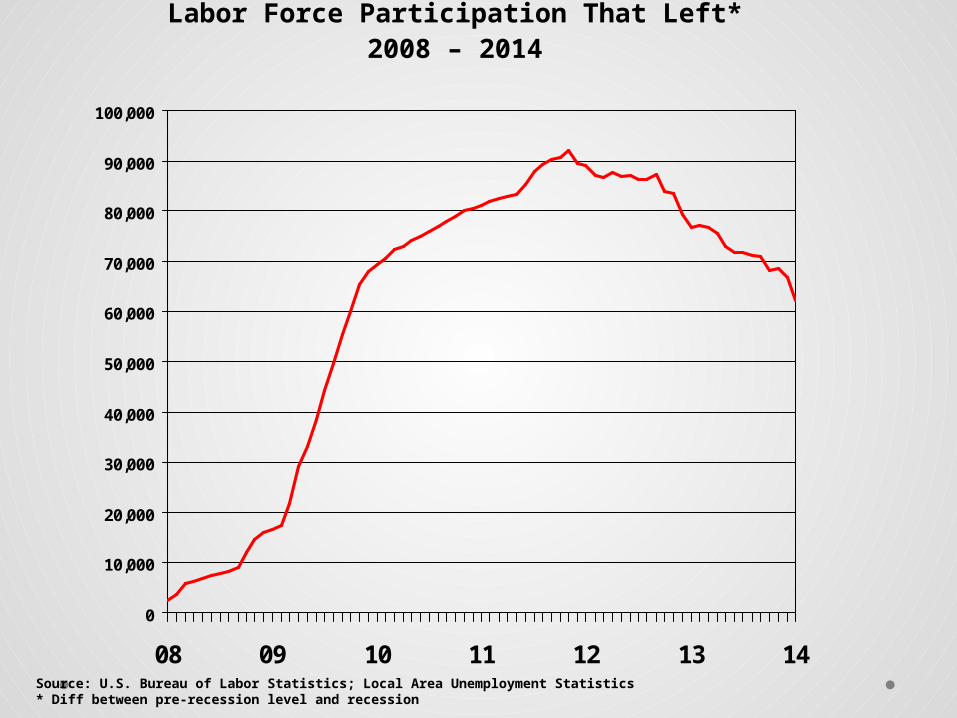
0
10,000
20,000
30,000
40,000
50,000
60,000
70,000
80,000
90,000
100,000
08 09 10 11 12 13 14
Labor Force Participation That Left*2008 – 2014
Source: U.S. Bureau of Labor Statistics; Local Area Unemployment Statistics* Diff between pre-recession level and recession
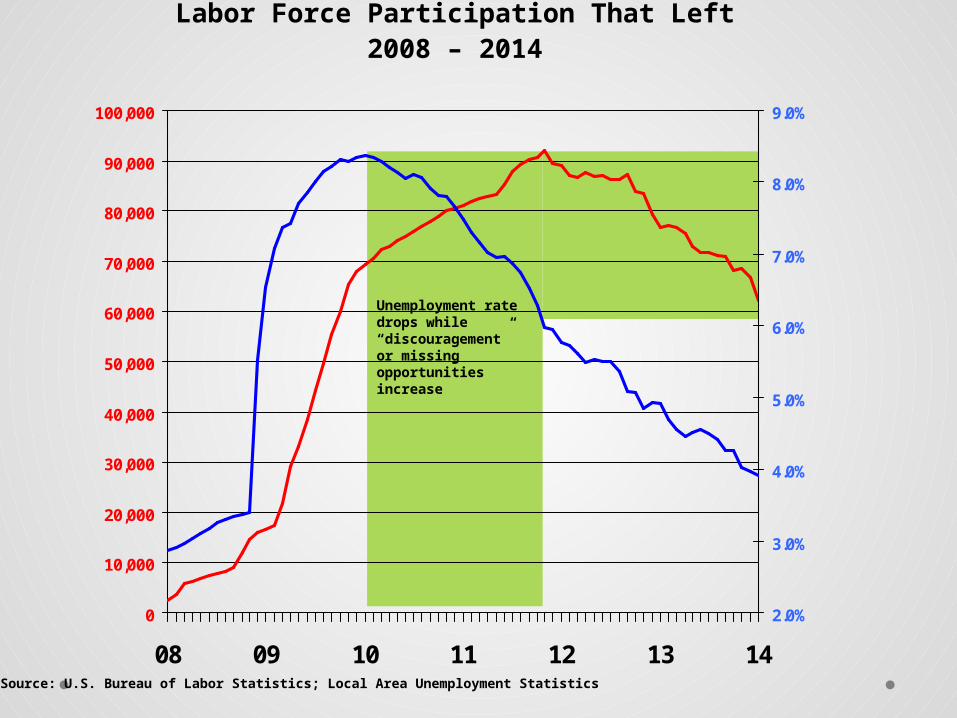
0
10,000
20,000
30,000
40,000
50,000
60,000
70,000
80,000
90,000
100,000
08 09 10 11 12 13 14
2.0%
3.0%
4.0%
5.0%
6.0%
7.0%
8.0%
9.0%
Labor Force Participation That Left2008 – 2014
Source: U.S. Bureau of Labor Statistics; Local Area Unemployment Statistics
Unemployment rate drops while “discouragement” or missing opportunities increase
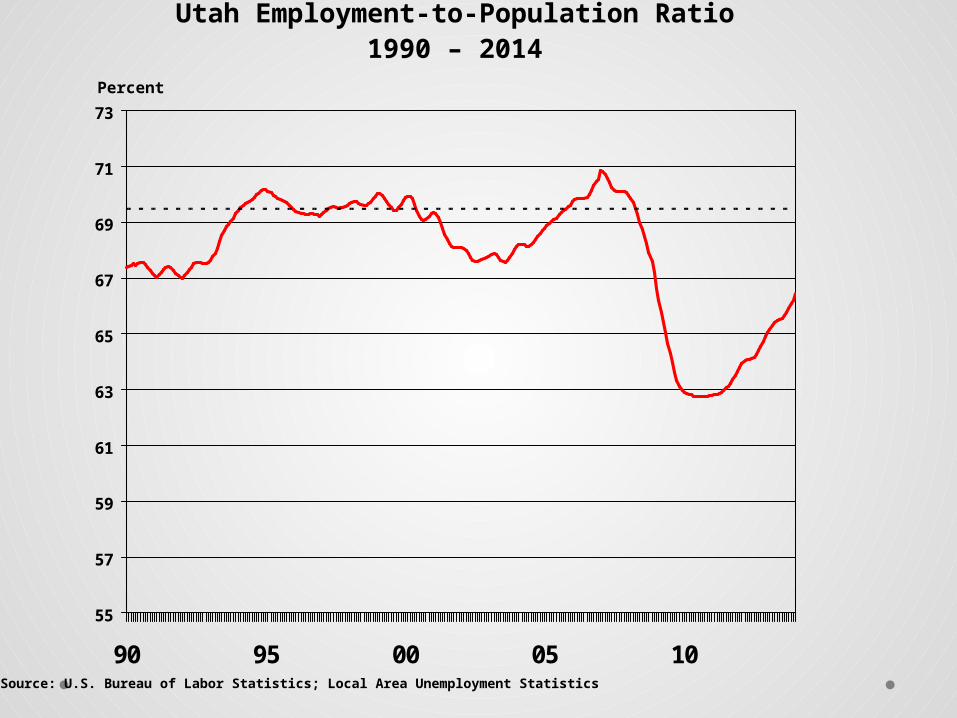
55
57
59
61
63
65
67
69
71
73
90 95 00 05 10
Utah Employment-to-Population Ratio1990 – 2014
Percent
Source: U.S. Bureau of Labor Statistics; Local Area Unemployment Statistics
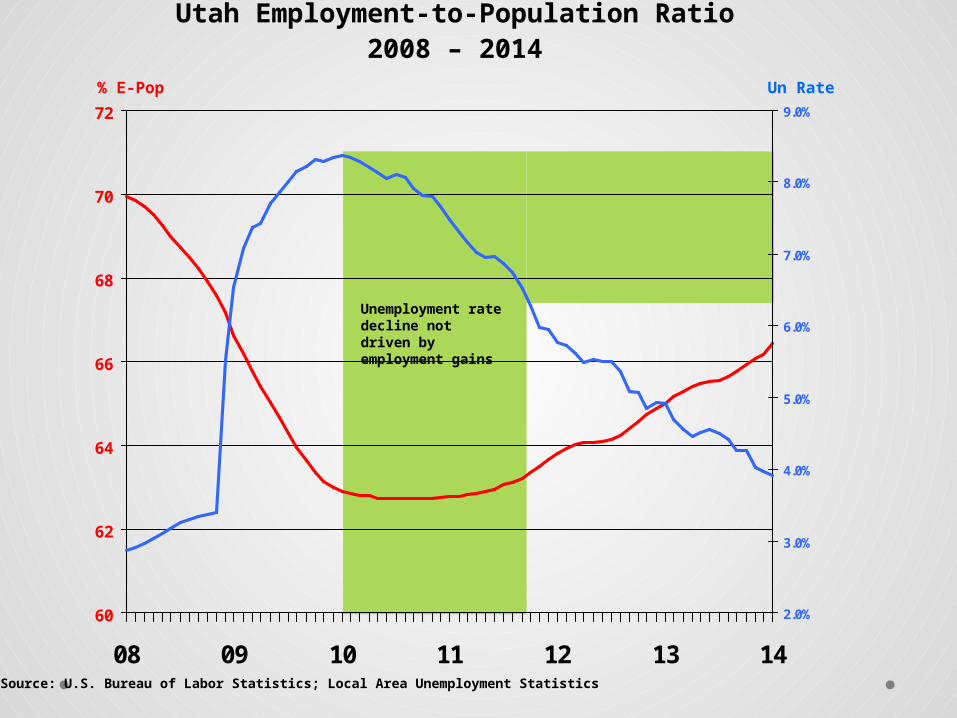
60
62
64
66
68
70
72
08 09 10 11 12 13 14
2.0%
3.0%
4.0%
5.0%
6.0%
7.0%
8.0%
9.0%
Utah Employment-to-Population Ratio2008 – 2014
% E-Pop
Source: U.S. Bureau of Labor Statistics; Local Area Unemployment Statistics
Un Rate
Unemployment rate decline not driven by employment gains
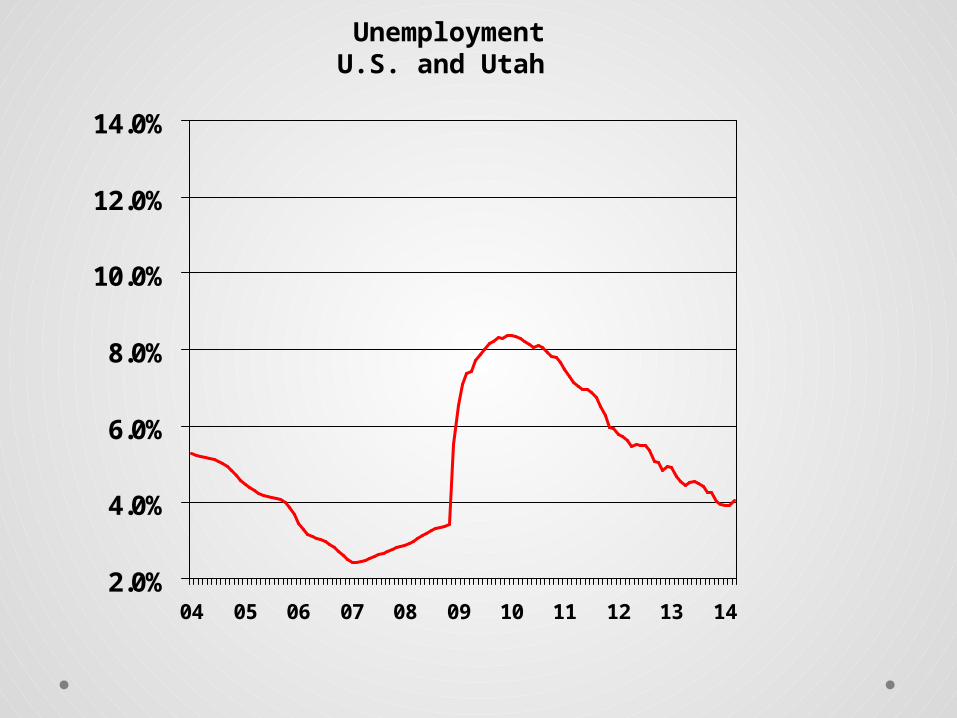
2.0%
4.0%
6.0%
8.0%
10.0%
12.0%
14.0%
04 05 06 07 08 09 10 11 12 13 14
UnemploymentU.S. and Utah
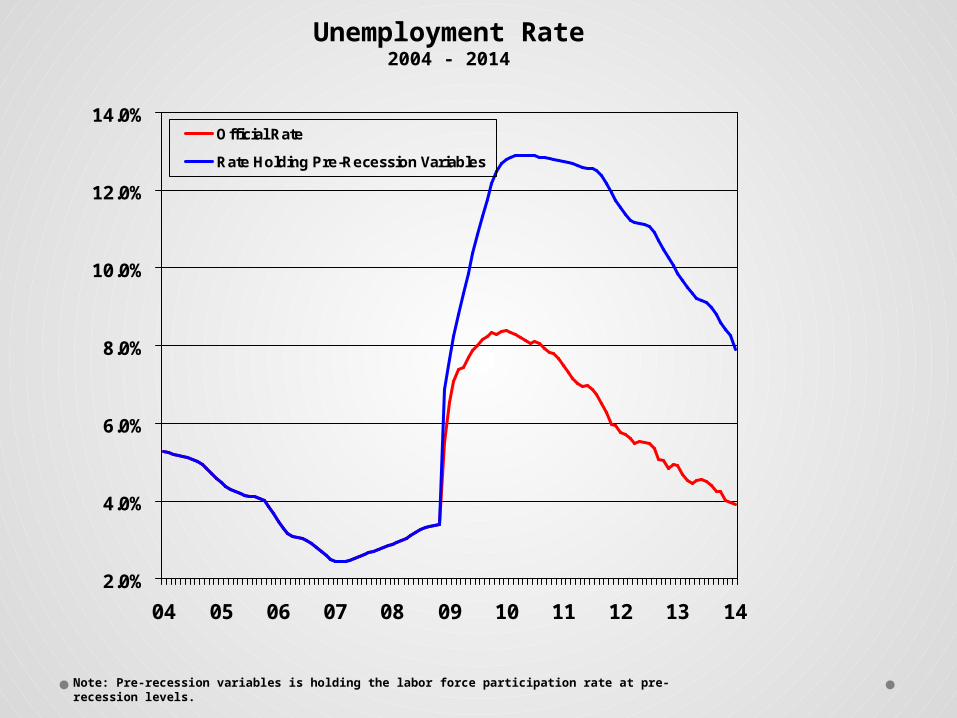
2.0%
4.0%
6.0%
8.0%
10.0%
12.0%
14.0%
04 05 06 07 08 09 10 11 12 13 14
Official Rate
Rate Holding Pre-Recession Variables
Unemployment Rate2004 - 2014
Note: Pre-recession variables is holding the labor force participation rate at pre-recession levels.
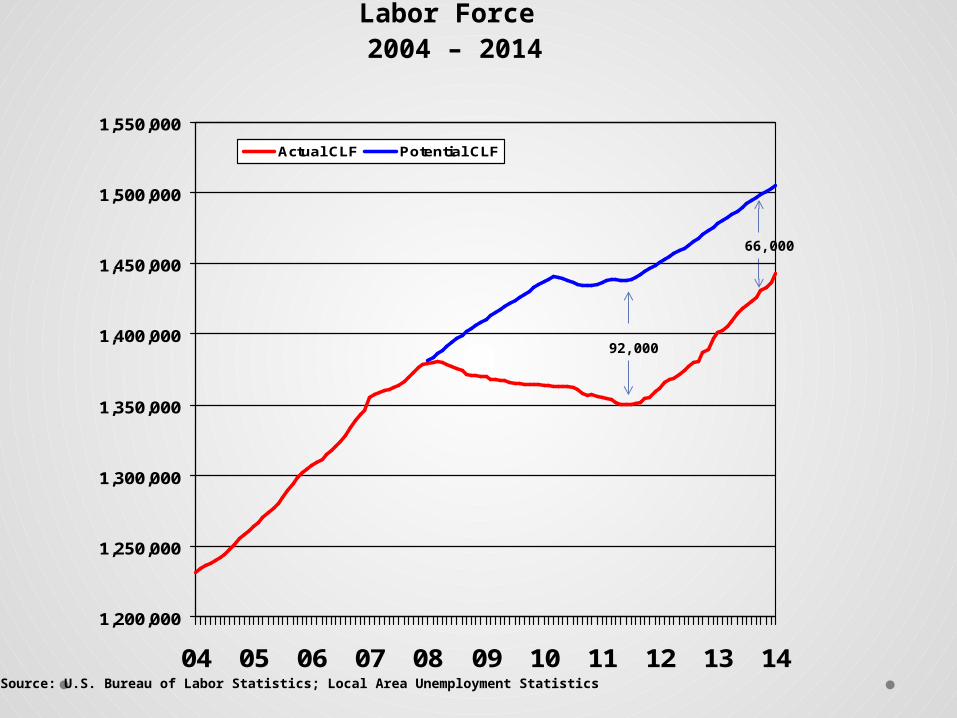
1,200,000
1,250,000
1,300,000
1,350,000
1,400,000
1,450,000
1,500,000
1,550,000
04 05 06 07 08 09 10 11 12 13 14
Actual CLF Potential CLF
Labor Force 2004 – 2014
Source: U.S. Bureau of Labor Statistics; Local Area Unemployment Statistics
92,000
66,000
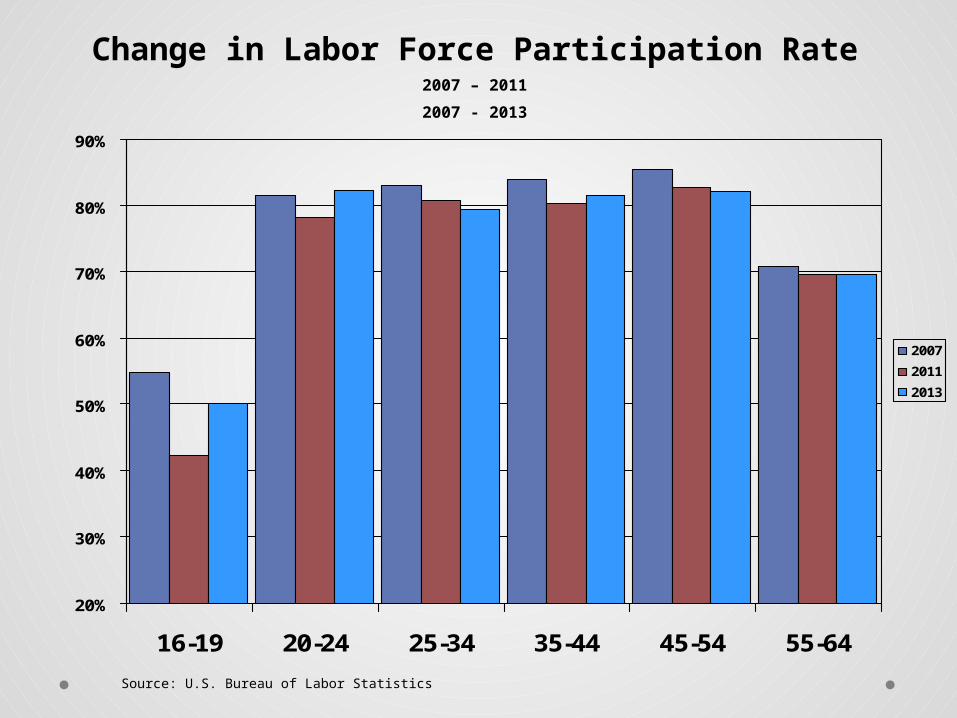
20%
30%
40%
50%
60%
70%
80%
90%
16-19 20-24 25-34 35-44 45-54 55-64
2007
2011
2013
Source: U.S. Bureau of Labor Statistics
Change in Labor Force Participation Rate2007 – 2011
2007 - 2013
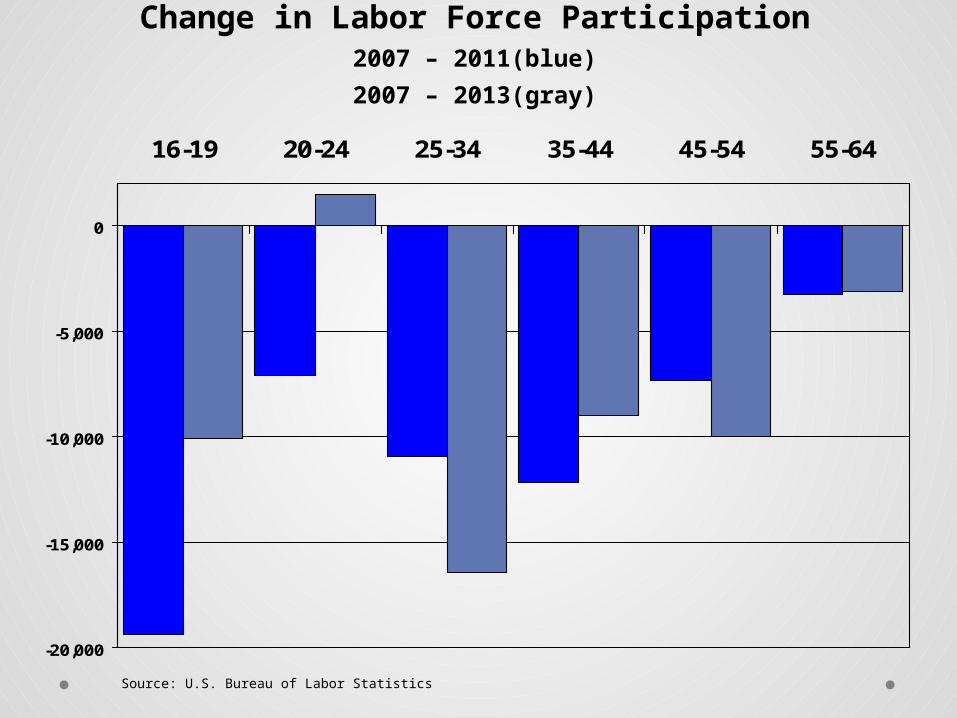
-20,000
-15,000
-10,000
-5,000
0
16-19 20-24 25-34 35-44 45-54 55-64
Change in Labor Force Participation2007 – 2011(blue)
2007 – 2013(gray)
Source: U.S. Bureau of Labor Statistics
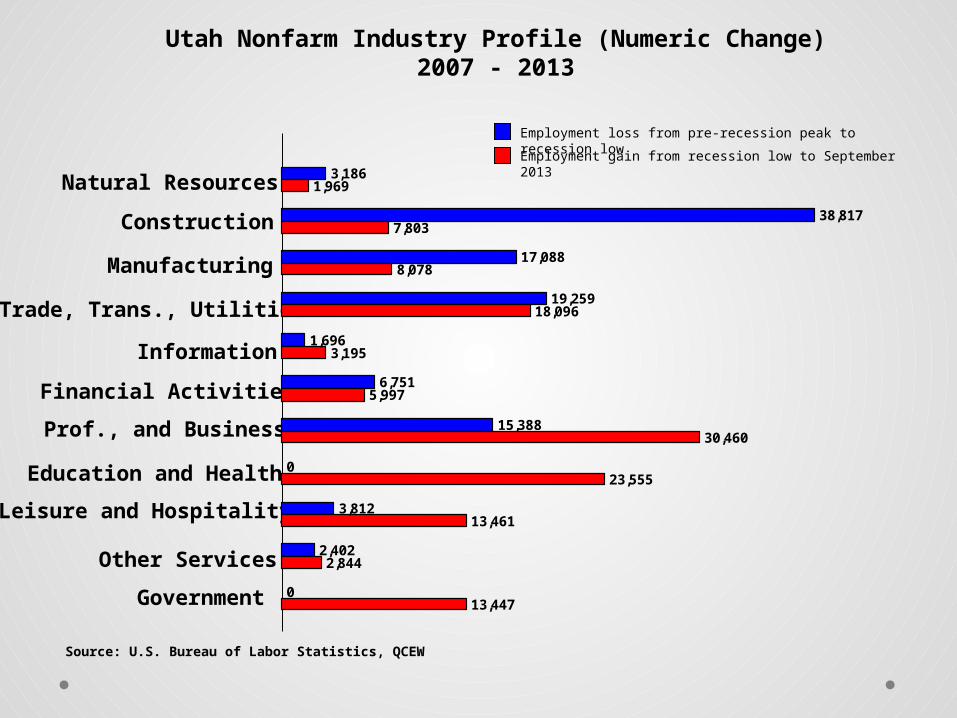
3,186
38,817
17,088
19,259
1,696
6,751
15,388
0
3,812
2,402
0
1,969
7,803
8,078
18,096
3,195
5,997
30,460
23,555
13,461
2,844
13,447
Natural Resources
Construction
Manufacturing
Trade, Trans., Utilities
Information
Financial Activities
Education and Health
Government
Utah Nonfarm Industry Profile (Numeric Change)2007 - 2013
Prof., and Business
Leisure and Hospitality
Other Services
Source: U.S. Bureau of Labor Statistics, QCEW
Employment loss from pre-recession peak to recession low
Employment gain from recession low to September 2013

400,000
420,000
440,000
460,000
480,000
500,000
520,000
540,000
560,000
580,000
600,000
20
00
20
01
20
02
20
03
20
04
20
05
20
06
20
07
20
08
20
09
20
10
20
11
20
12
20
13
Recession High Wage Industries Low Wage Industries
Source: Utah Dept. of Workforce Services; March 2014
The average wage for all industries is the dividing line between high-wage and low-wage.
Private Sector Employment in High Wage and Low Wage Industries 2000 - 2013
Employment
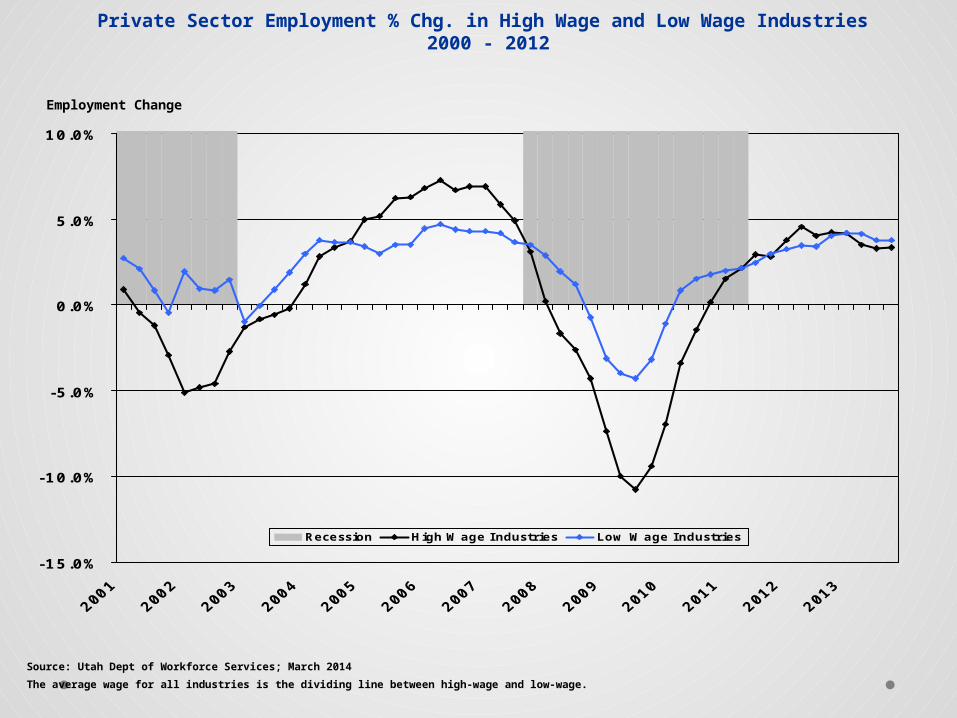
-15.0%
-10.0%
-5.0%
0.0%
5.0%
10.0%
Recession High Wage Industries Low Wage Industries
Source: Utah Dept of Workforce Services; March 2014
The average wage for all industries is the dividing line between high-wage and low-wage.
Private Sector Employment % Chg. in High Wage and Low Wage Industries 2000 - 2012
Employment Change
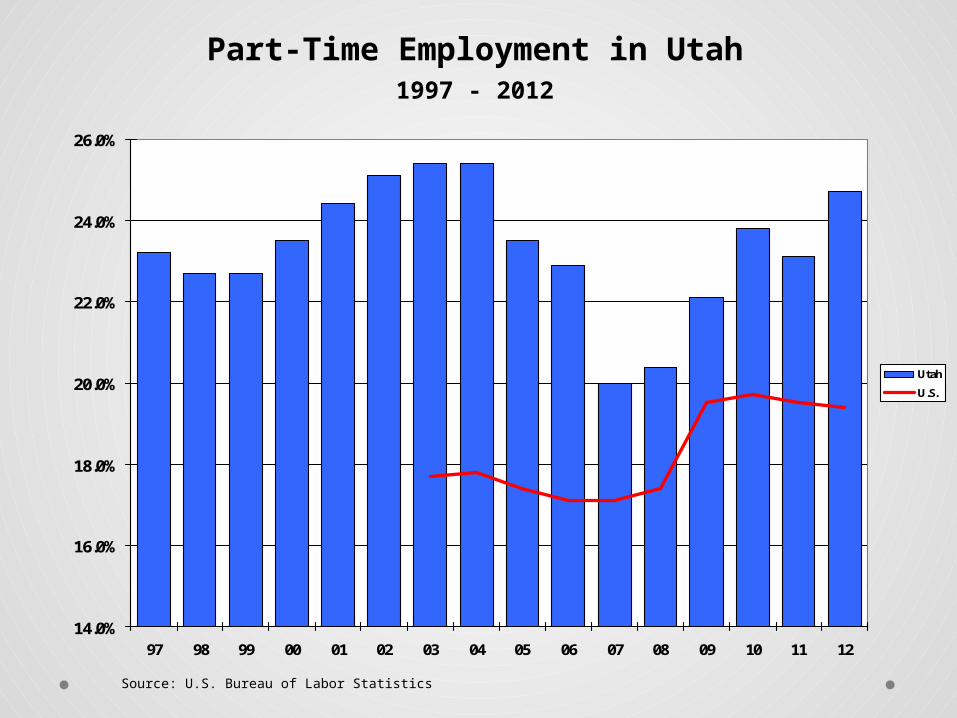
14.0%
16.0%
18.0%
20.0%
22.0%
24.0%
26.0%
97 98 99 00 01 02 03 04 05 06 07 08 09 10 11 12
Utah
U.S.
Source: U.S. Bureau of Labor Statistics
Part-Time Employment in Utah1997 - 2012
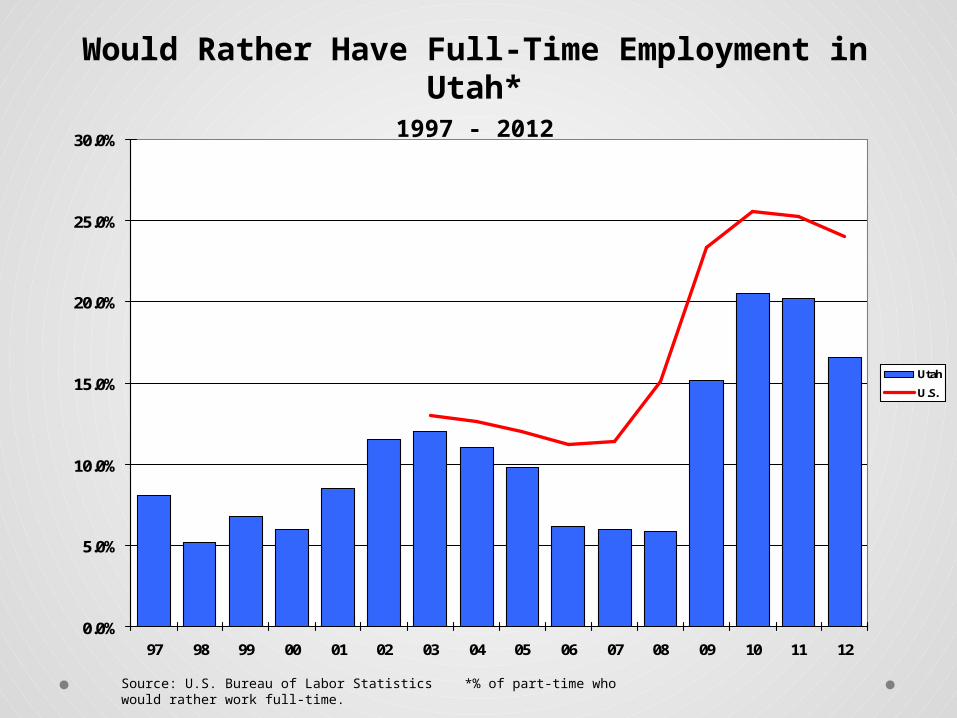
0.0%
5.0%
10.0%
15.0%
20.0%
25.0%
30.0%
97 98 99 00 01 02 03 04 05 06 07 08 09 10 11 12
Utah
U.S.
Source: U.S. Bureau of Labor Statistics *% of part-time who would rather work full-time.
Would Rather Have Full-Time Employment in Utah*1997 - 2012
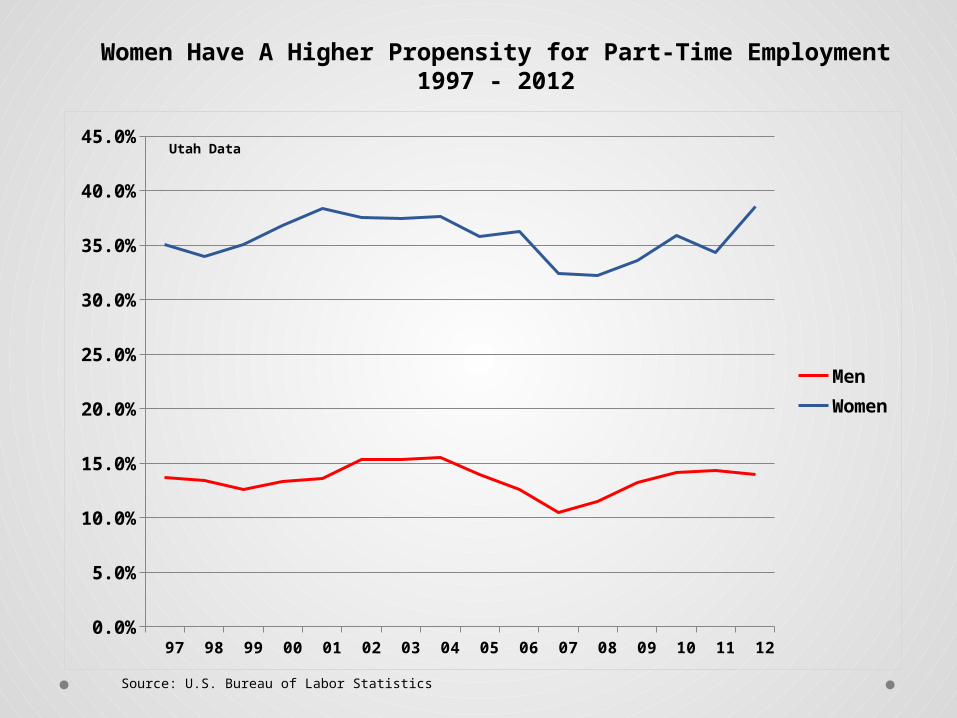
97 98 99 00 01 02 03 04 05 06 07 08 09 10 11 120.0%
5.0%
10.0%
15.0%
20.0%
25.0%
30.0%
35.0%
40.0%
45.0%
MenWomen
Women Have A Higher Propensity for Part-Time Employment1997 - 2012
Source: U.S. Bureau of Labor Statistics
Utah Data
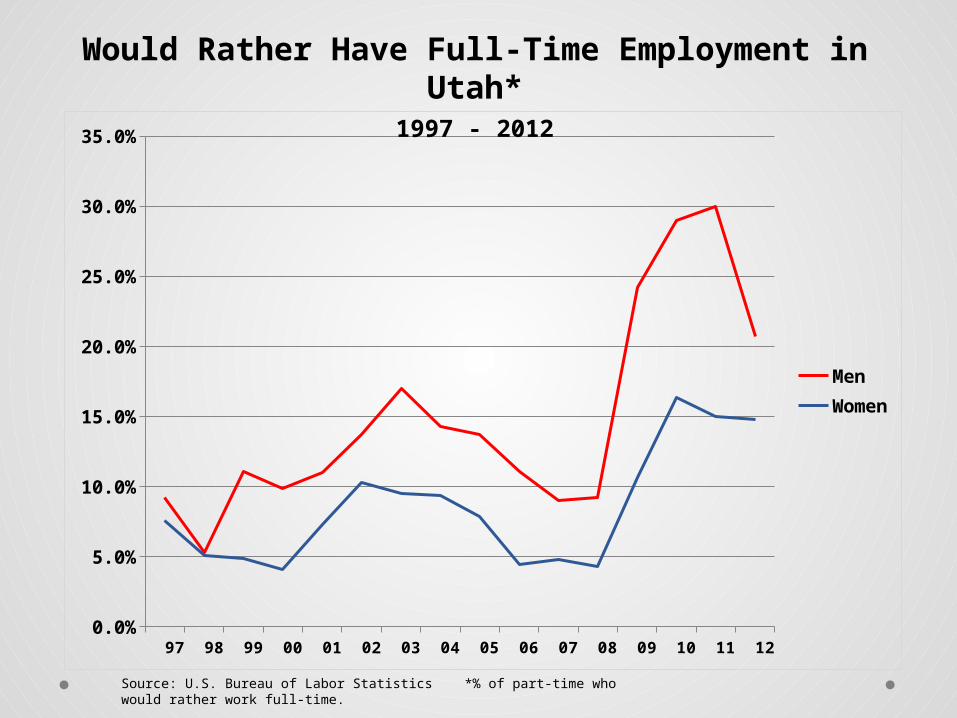
97 98 99 00 01 02 03 04 05 06 07 08 09 10 11 120.0%
5.0%
10.0%
15.0%
20.0%
25.0%
30.0%
35.0%
MenWomen
Would Rather Have Full-Time Employment in Utah*1997 - 2012
Source: U.S. Bureau of Labor Statistics *% of part-time who would rather work full-time.
2004 2005 2006 2007 2008 2009 2010 2011 2012 2013-12.0%
-10.0%
-8.0%
-6.0%
-4.0%
-2.0%
0.0%
2.0%
4.0%
6.0%
8.0%
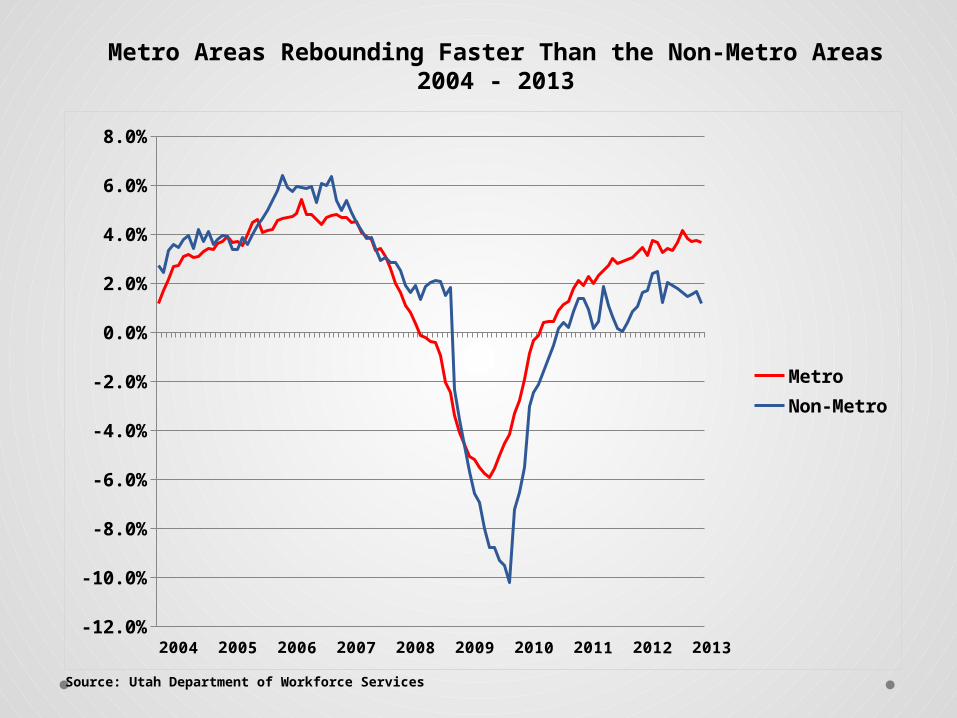
MetroNon-Metro
Metro Areas Rebounding Faster Than the Non-Metro Areas2004 - 2013
Source: Utah Department of Workforce Services
2004 2005 2006 2007 2008 2009 2010 2011 2012 2013-8.0%
-6.0%
-4.0%
-2.0%
0.0%
2.0%
4.0%
6.0%
8.0%
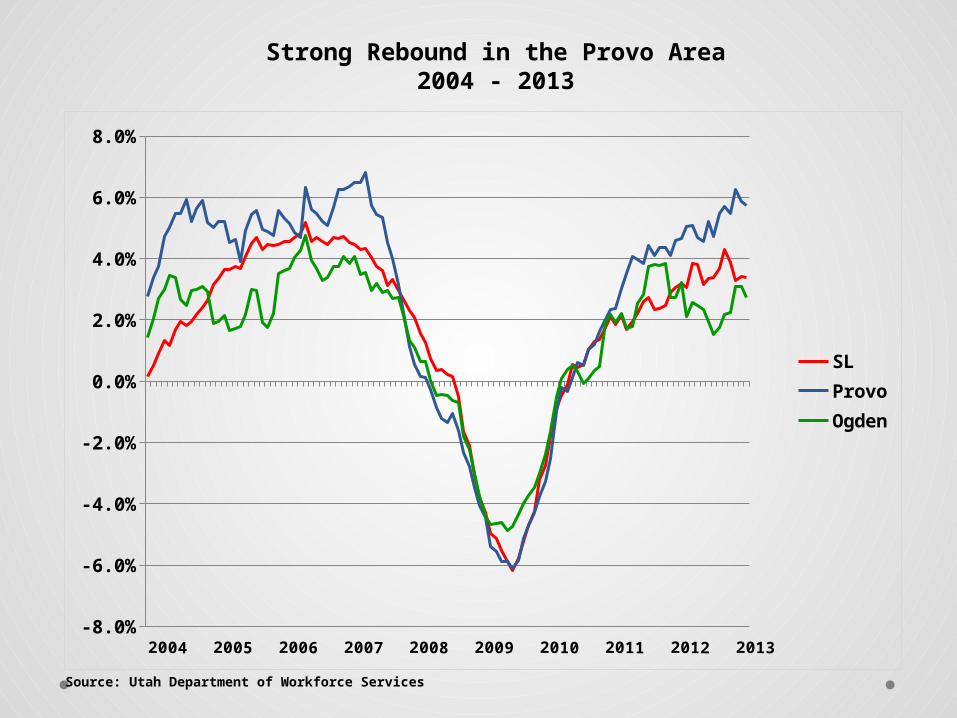
SLProvoOgden
Strong Rebound in the Provo Area2004 - 2013
Source: Utah Department of Workforce Services
0
50,000
100,000
150,000
200,000
250,000
300,000
350,000
400,000
450,000
500,000
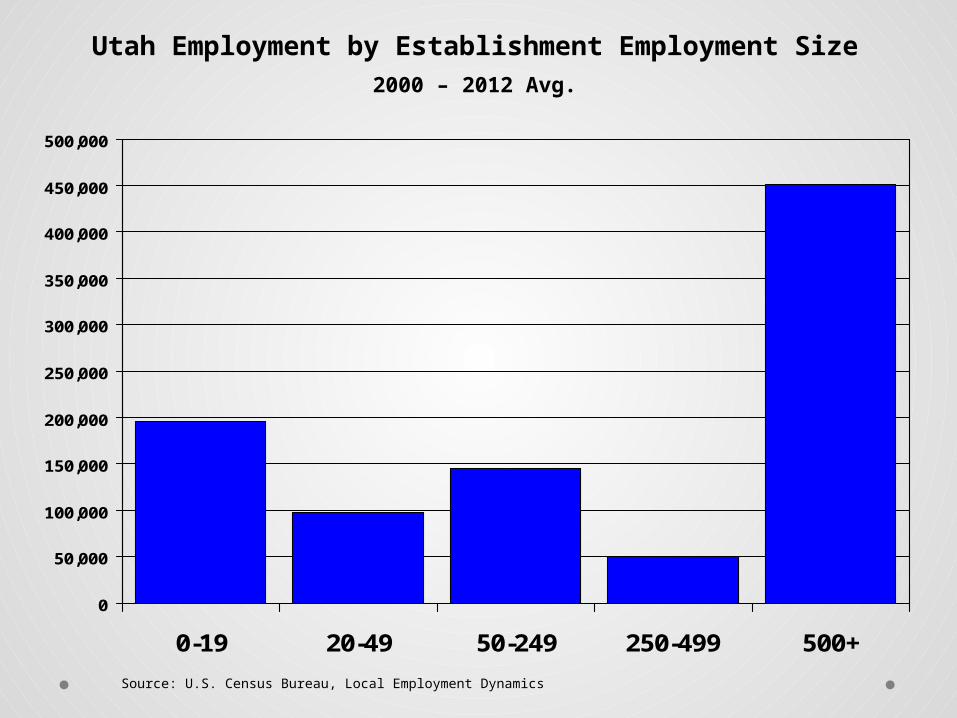
0-19 20-49 50-249 250-499 500+
Source: U.S. Census Bureau, Local Employment Dynamics
Utah Employment by Establishment Employment Size
2000 – 2012 Avg.
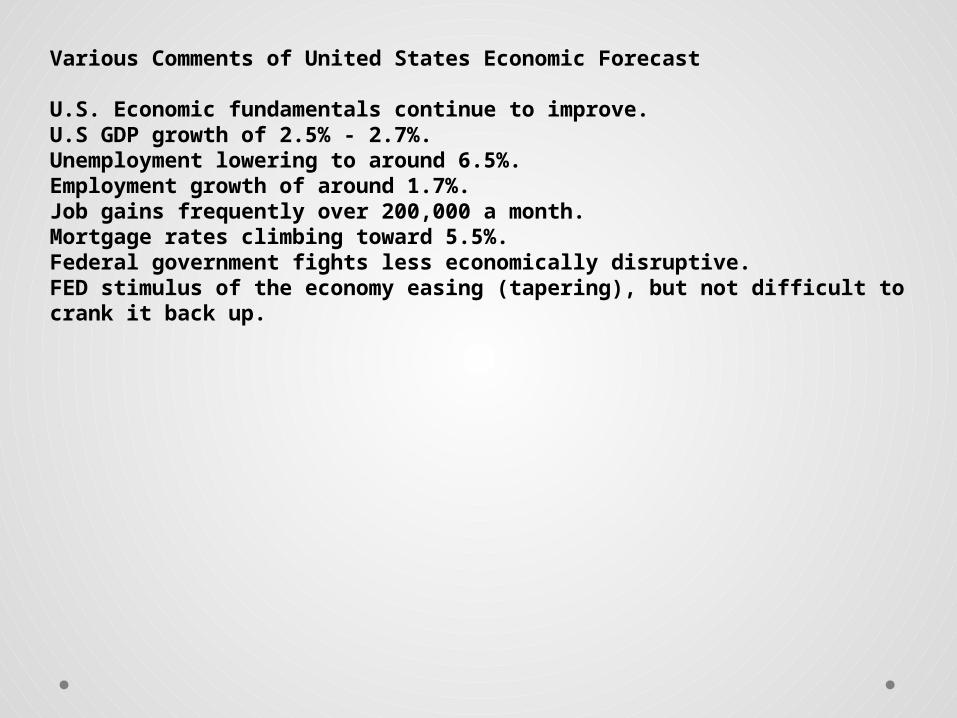
Various Comments of United States Economic Forecast
U.S. Economic fundamentals continue to improve.U.S GDP growth of 2.5% - 2.7%.Unemployment lowering to around 6.5%.Employment growth of around 1.7%.Job gains frequently over 200,000 a month.Mortgage rates climbing toward 5.5%.Federal government fights less economically disruptive.FED stimulus of the economy easing (tapering), but not difficult to crank it back up.
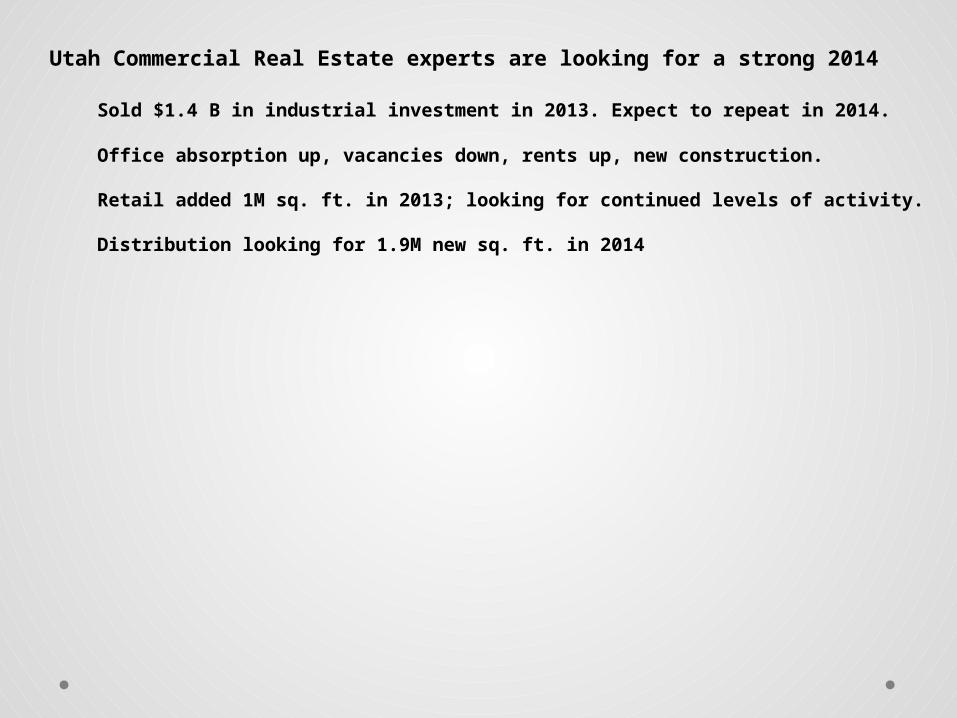
Utah Commercial Real Estate experts are looking for a strong 2014
Sold $1.4 B in industrial investment in 2013. Expect to repeat in 2014.
Office absorption up, vacancies down, rents up, new construction.
Retail added 1M sq. ft. in 2013; looking for continued levels of activity.
Distribution looking for 1.9M new sq. ft. in 2014
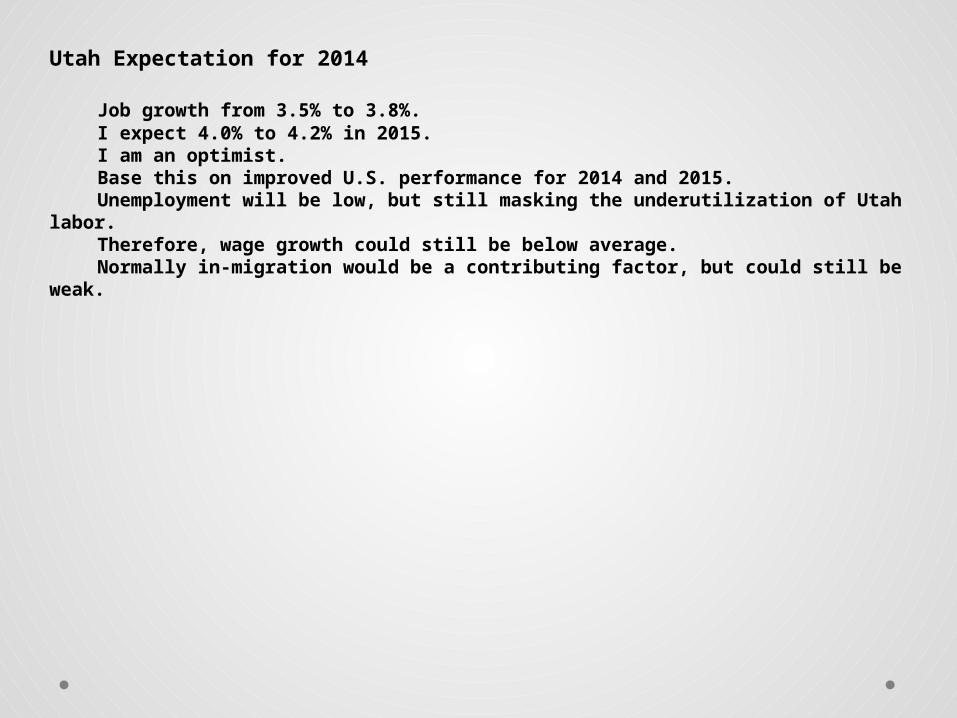
Utah Expectation for 2014
Job growth from 3.5% to 3.8%.I expect 4.0% to 4.2% in 2015.I am an optimist.Base this on improved U.S. performance for 2014 and 2015.Unemployment will be low, but still masking the underutilization of Utah labor.Therefore, wage growth could still be below average.Normally in-migration would be a contributing factor, but could still be weak.
1,020
1,070
1,120
1,170
1,220
1,270
1,320
1,370
1,420
1,470
03 04 05 06 07 08 09 10 11 12 13 14 15
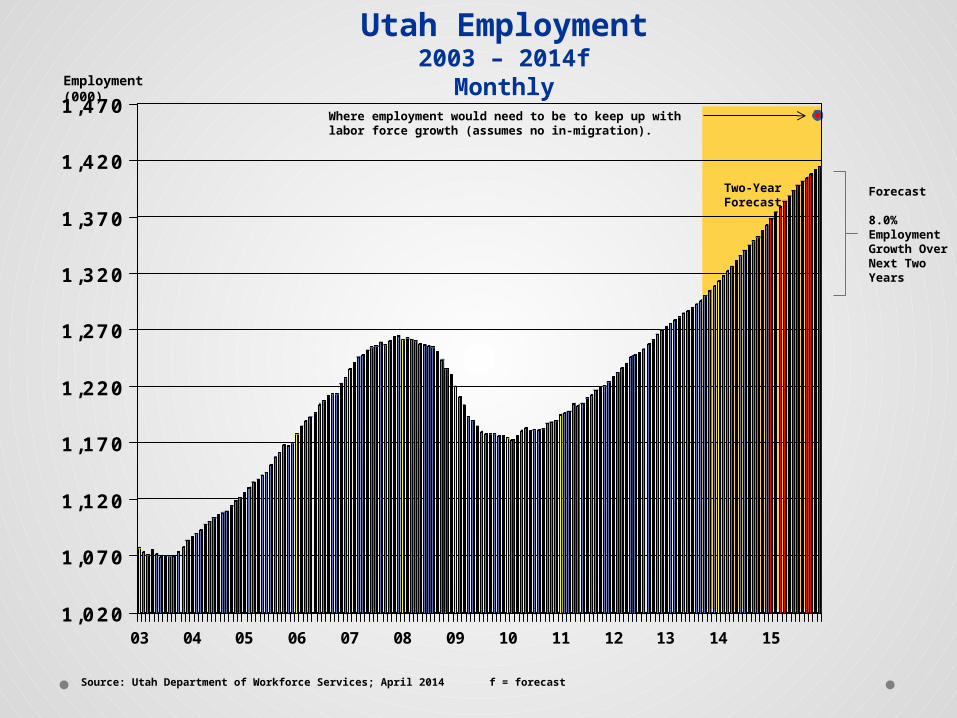
Source: Utah Department of Workforce Services; April 2014 f = forecast
Employment (000)
Utah Employment2003 – 2014f
Monthly
Forecast
8.0% Employment Growth Over Next Two Years
Where employment would need to be to keep up with labor force growth (assumes no in-migration).
Two-Year Forecast
0
1,000
2,000
3,000
4,000
5,000
6,000
7,000
8,000
9,000
0-19 20-49 50-249 250-499 500+
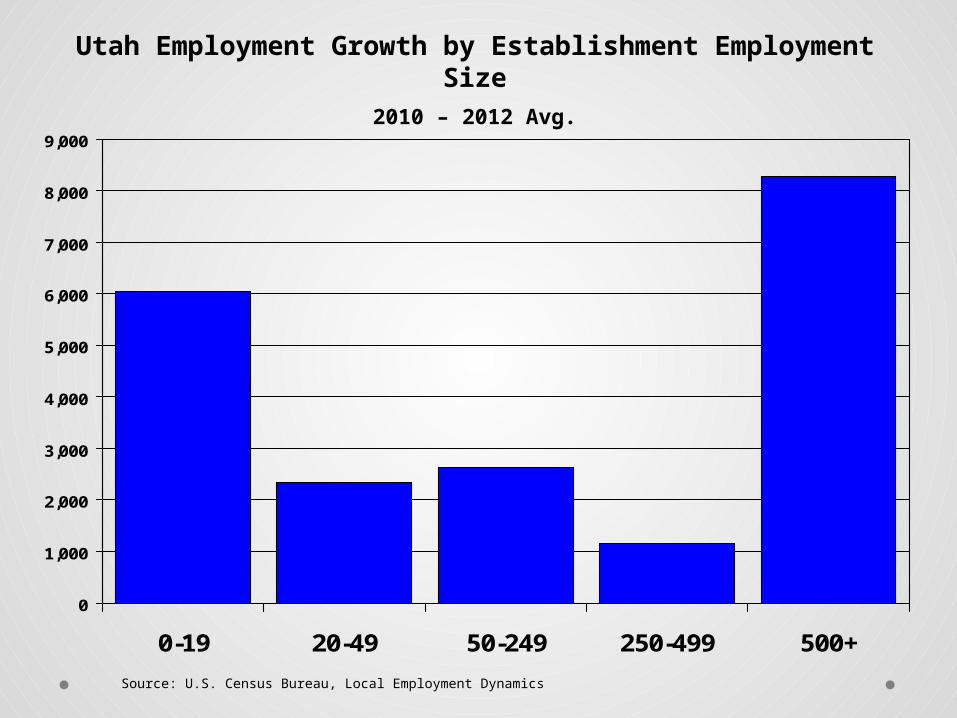
Utah Employment Growth by Establishment Employment Size
2010 – 2012 Avg.
Source: U.S. Census Bureau, Local Employment Dynamics
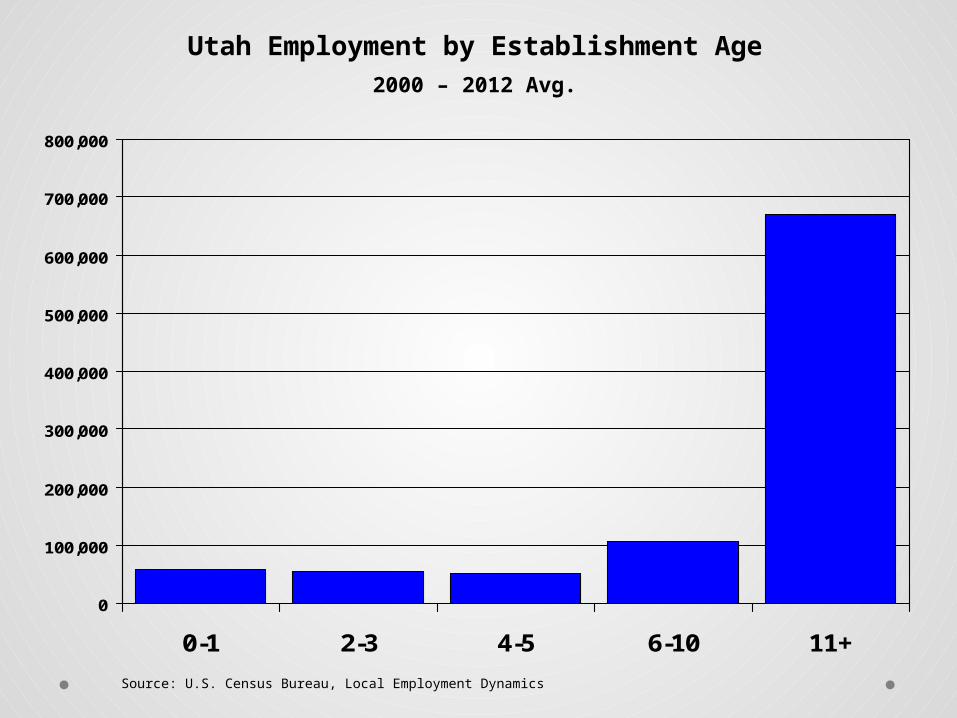
0
100,000
200,000
300,000
400,000
500,000
600,000
700,000
800,000
0-1 2-3 4-5 6-10 11+
Utah Employment by Establishment Age
2000 – 2012 Avg.
Source: U.S. Census Bureau, Local Employment Dynamics
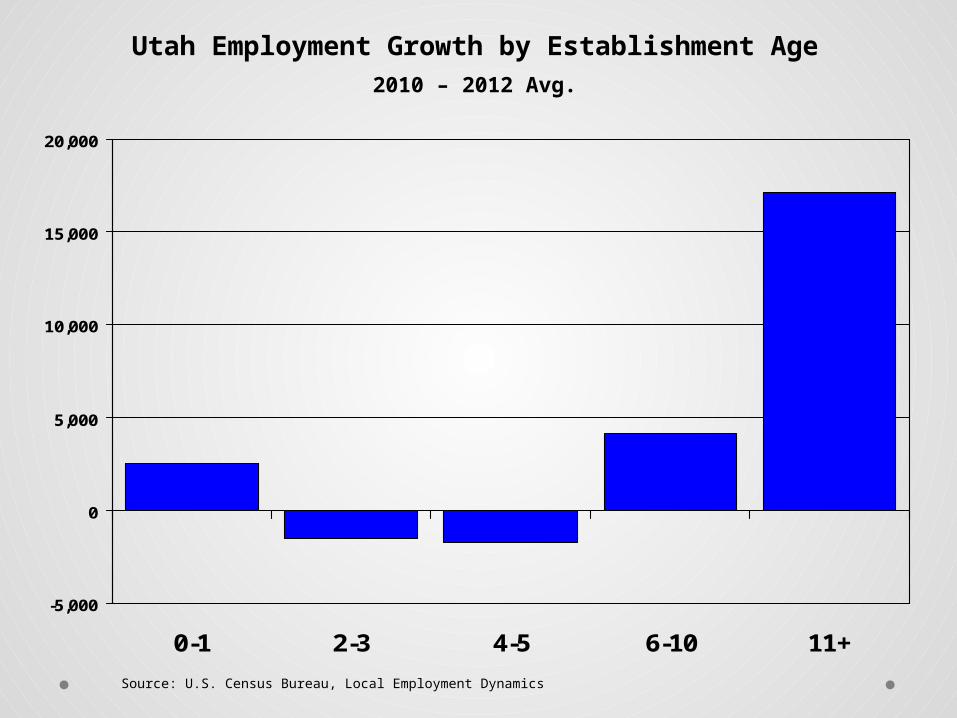
-5,000
0
5,000
10,000
15,000
20,000
0-1 2-3 4-5 6-10 11+
Utah Employment Growth by Establishment Age
2010 – 2012 Avg.
Source: U.S. Census Bureau, Local Employment Dynamics
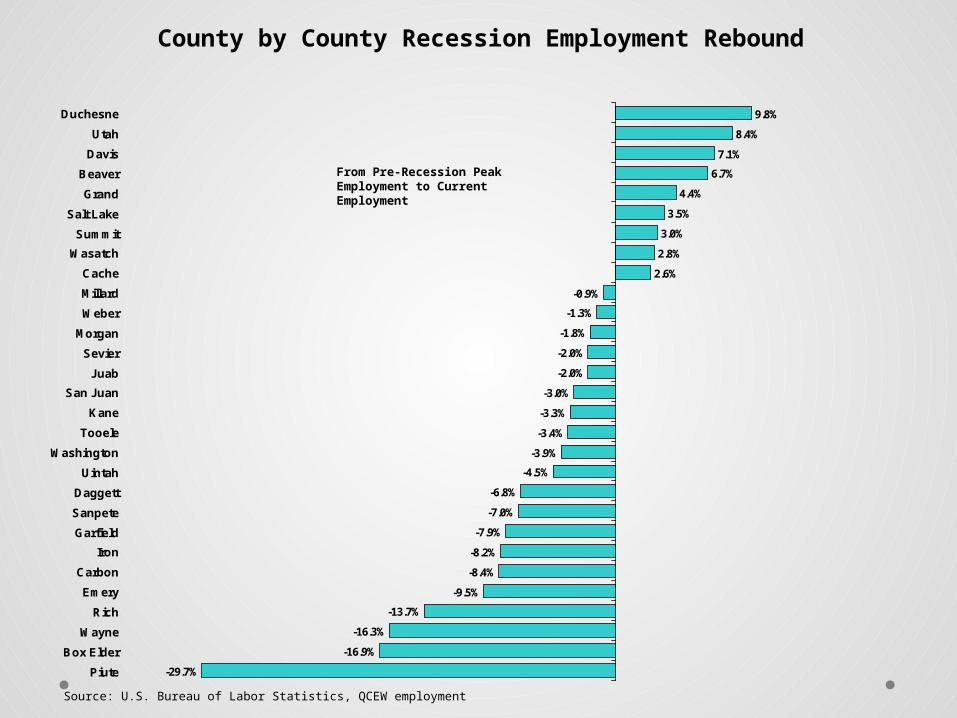
-29.7%
-16.9%
-16.3%
-13.7%
-9.5%
-8.4%
-8.2%
-7.9%
-7.0%
-6.8%
-4.5%
-3.9%
-3.4%
-3.3%
-3.0%
-2.0%
-2.0%
-1.8%
-1.3%
-0.9%
2.6%
2.8%
3.0%
3.5%
4.4%
6.7%
7.1%
8.4%
9.8%
Piute
Box Elder
Wayne
Rich
Emery
Carbon
Iron
Garfield
Sanpete
Daggett
Uintah
Washington
Tooele
Kane
San Juan
Juab
Sevier
Morgan
Weber
Millard
Cache
Wasatch
Summit
Salt Lake
Grand
Beaver
Davis
Utah
Duchesne
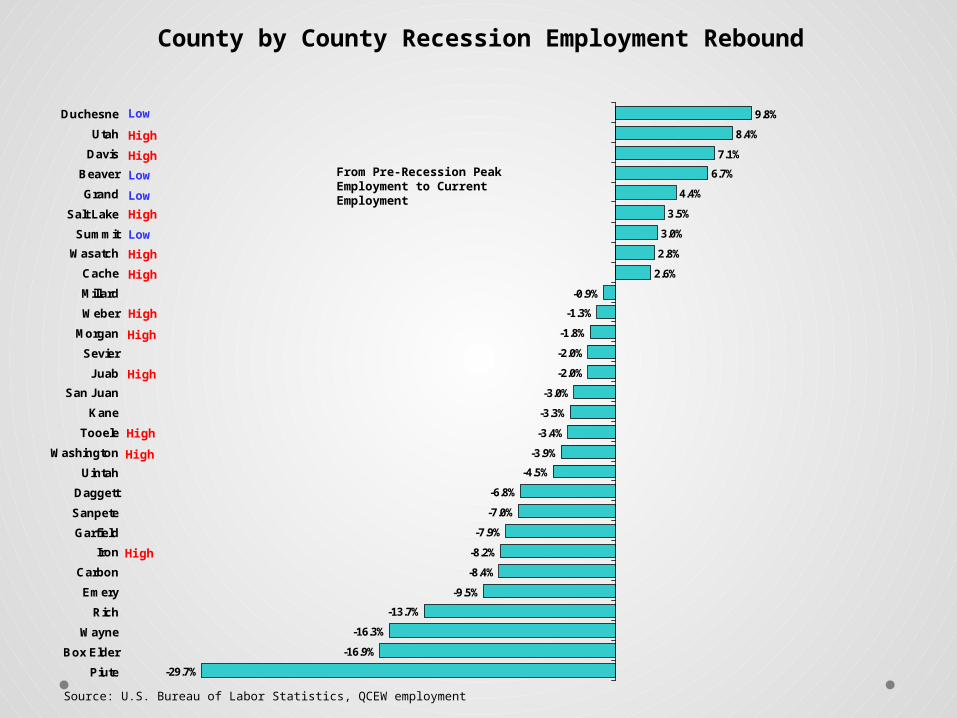
County by County Recession Employment Rebound
Source: U.S. Bureau of Labor Statistics, QCEW employment
From Pre-Recession Peak Employment to Current Employment
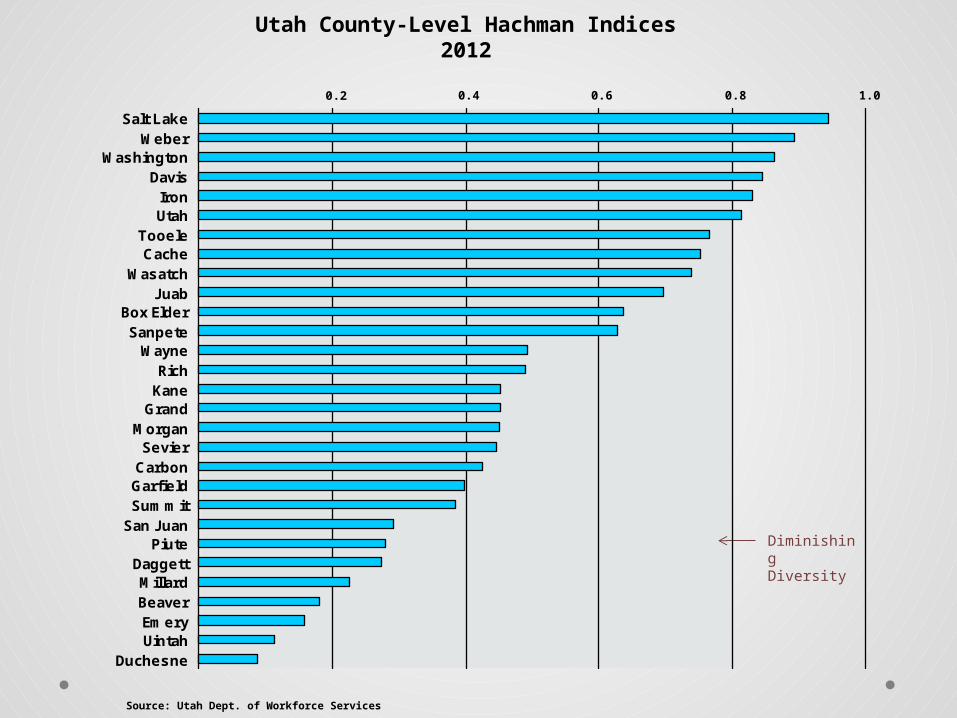
Salt LakeWeber
WashingtonDavis
IronUtah
TooeleCache
WasatchJuab
Box ElderSanpete
WayneRich
KaneGrand
MorganSevier
CarbonGarfieldSummit
San JuanPiute
DaggettMillardBeaverEmeryUintah
Duchesne
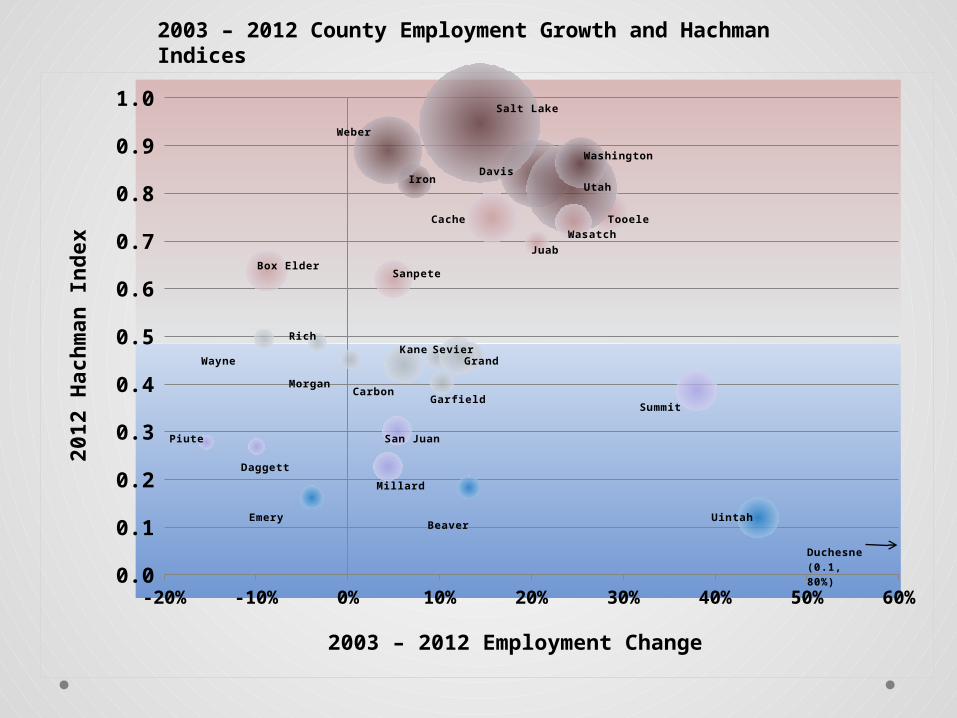
Utah County-Level Hachman Indices2012
Source: Utah Dept. of Workforce Services
Diminishing Diversity
0.2 0.4 0.6 1.00.8
-20% -10% 0% 10% 20% 30% 40% 50% 60%0.0
0.1
0.2
0.3
0.4
0.5
0.6
0.7
0.8
0.9
1.0
2003 – 2012 Employment Change
20
12
Ha
ch
ma
n I
nd
ex
Daggett
Beaver
Duchesne (0.1, 80%)
Carbon
Box Elder
Davis
Cache
Emery
Garfield
Grand
Iron
Juab
Sevier
Millard
Morgan
Piute
Rich
Salt Lake
San Juan
Sanpete
Kane
Summit
Tooele
Uintah
Utah
Wasatch
Washington
Weber
Wayne
2003 – 2012 County Employment Growth and Hachman Indices
-29.7%
-16.9%
-16.3%
-13.7%
-9.5%
-8.4%
-8.2%
-7.9%
-7.0%
-6.8%
-4.5%
-3.9%
-3.4%
-3.3%
-3.0%
-2.0%
-2.0%
-1.8%
-1.3%
-0.9%
2.6%
2.8%
3.0%
3.5%
4.4%
6.7%
7.1%
8.4%
9.8%
Piute
Box Elder
Wayne
Rich
Emery
Carbon
Iron
Garfield
Sanpete
Daggett
Uintah
Washington
Tooele
Kane
San Juan
Juab
Sevier
Morgan
Weber
Millard
Cache
Wasatch
Summit
Salt Lake
Grand
Beaver
Davis
Utah
Duchesne
County by County Recession Employment Rebound
Source: U.S. Bureau of Labor Statistics, QCEW employment
From Pre-Recession Peak Employment to Current Employment
Low
High
High
Low
Low
High
Low
High
High
High
High
High
High
High
High
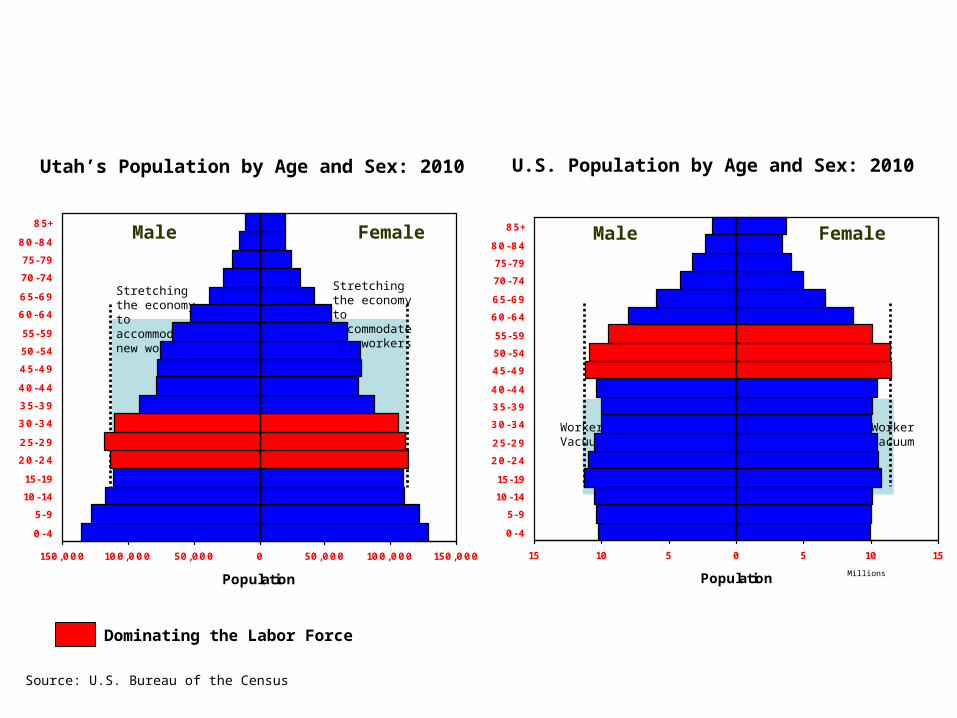
Source: U.S. Bureau of the Census
FemaleMale
Utah’s Population by Age and Sex: 2010
FemaleMale
U.S. Population by Age and Sex: 2010
Millions
Dominating the Labor Force
Stretching the economy to accommodate new workers
Stretching the economy to accommodate new workers
Worker Vacuum
Worker Vacuum
150,000 100,000 50,000 0 50,000 100,000 150,000
0-4
5-9
10-14
15-19
20-24
25-29
30-34
35-39
40-44
45-49
50-54
55-59
60-64
65-69
70-74
75-79
80-84
85+
Population
15 10 5 0 5 10 15
0-4
5-9
10-14
15-19
20-24
25-29
30-34
35-39
40-44
45-49
50-54
55-59
60-64
65-69
70-74
75-79
80-84
85+
Population