Staar Trek The Next Generation STAAR Trek: The Next Generation.

i
USP Technology Review: ASD QualitySpec® (Trek) Report Date: May 2019

ii
Disclaimer
This report is one of an ongoing series of reports evaluating the capabilities of various screening
technologies, performed under USP’s established Technology Review Program (see Introduction
for details). Although this evaluation was performed according to principles developed by the
USP Review of Surveillance and Screening Technologies for the Quality Assurance of
Medicines Expert Panel, this report does not represent certification or verification by USP that
the equipment evaluated meets compendial standards.
Certain commercial equipment, instruments, vendors, or materials may be identified in this
report to adequately specify the experimental procedure. Such identification does not imply
approval, endorsement, or certification by USP of a particular brand or product, nor does it imply
that the equipment, instrument, vendor, or material is necessarily the best available for the
purpose or that any other brand or product was judged to be unsatisfactory or inadequate. All
product names, logos, and brands are property of their respective owners.
Recommended Citation
This report may be reproduced when credit is given to the USP Technology Review Program.
Please use the following citation:
U.S. Pharmacopeia (2018). USP Technology Review: ASD QualitySpec®-Trek. The
Technology Review Program. Rockville, Maryland.
iii
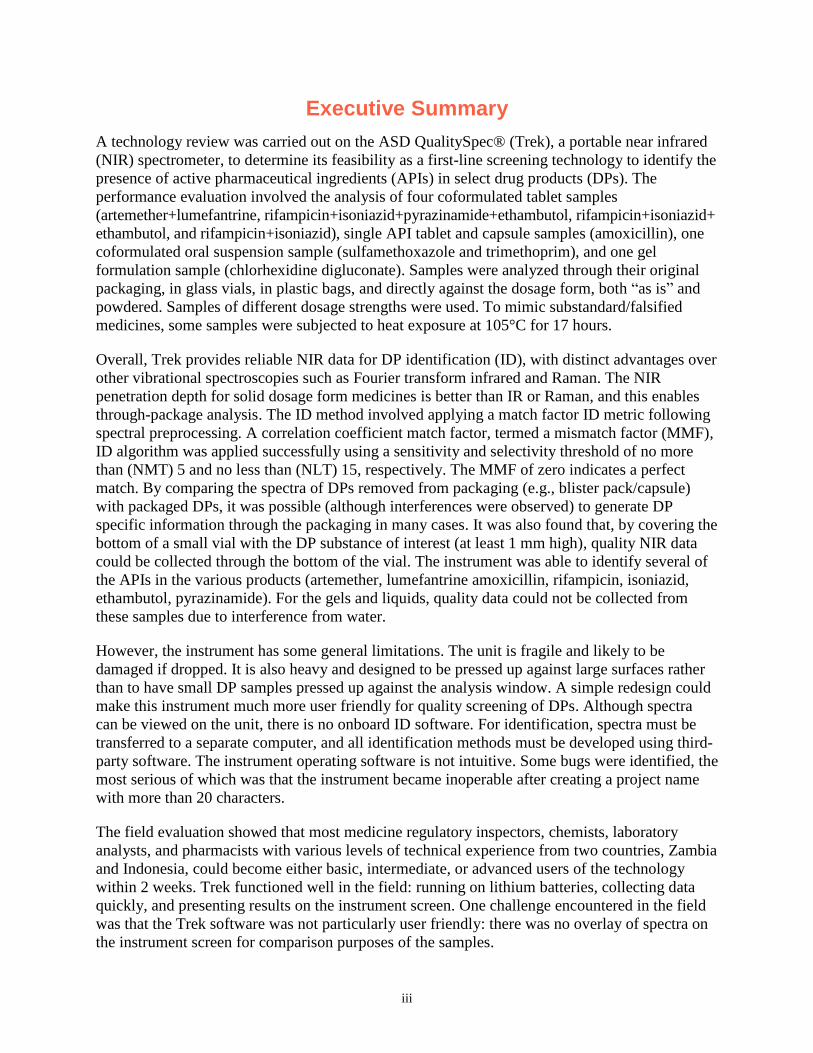
Executive Summary
A technology review was carried out on the ASD QualitySpec® (Trek), a portable near infrared
(NIR) spectrometer, to determine its feasibility as a first-line screening technology to identify the
presence of active pharmaceutical ingredients (APIs) in select drug products (DPs). The
performance evaluation involved the analysis of four coformulated tablet samples
(artemether+lumefantrine, rifampicin+isoniazid+pyrazinamide+ethambutol, rifampicin+isoniazid+
ethambutol, and rifampicin+isoniazid), single API tablet and capsule samples (amoxicillin), one
coformulated oral suspension sample (sulfamethoxazole and trimethoprim), and one gel
formulation sample (chlorhexidine digluconate). Samples were analyzed through their original
packaging, in glass vials, in plastic bags, and directly against the dosage form, both “as is” and
powdered. Samples of different dosage strengths were used. To mimic substandard/falsified
medicines, some samples were subjected to heat exposure at 105°C for 17 hours.
Overall, Trek provides reliable NIR data for DP identification (ID), with distinct advantages over
other vibrational spectroscopies such as Fourier transform infrared and Raman. The NIR
penetration depth for solid dosage form medicines is better than IR or Raman, and this enables
through-package analysis. The ID method involved applying a match factor ID metric following
spectral preprocessing. A correlation coefficient match factor, termed a mismatch factor (MMF),
ID algorithm was applied successfully using a sensitivity and selectivity threshold of no more
than (NMT) 5 and no less than (NLT) 15, respectively. The MMF of zero indicates a perfect
match. By comparing the spectra of DPs removed from packaging (e.g., blister pack/capsule)
with packaged DPs, it was possible (although interferences were observed) to generate DP
specific information through the packaging in many cases. It was also found that, by covering the
bottom of a small vial with the DP substance of interest (at least 1 mm high), quality NIR data
could be collected through the bottom of the vial. The instrument was able to identify several of
the APIs in the various products (artemether, lumefantrine amoxicillin, rifampicin, isoniazid,
ethambutol, pyrazinamide). For the gels and liquids, quality data could not be collected from
these samples due to interference from water.
However, the instrument has some general limitations. The unit is fragile and likely to be
damaged if dropped. It is also heavy and designed to be pressed up against large surfaces rather
than to have small DP samples pressed up against the analysis window. A simple redesign could
make this instrument much more user friendly for quality screening of DPs. Although spectra
can be viewed on the unit, there is no onboard ID software. For identification, spectra must be
transferred to a separate computer, and all identification methods must be developed using third-
party software. The instrument operating software is not intuitive. Some bugs were identified, the
most serious of which was that the instrument became inoperable after creating a project name
with more than 20 characters.
The field evaluation showed that most medicine regulatory inspectors, chemists, laboratory
analysts, and pharmacists with various levels of technical experience from two countries, Zambia
and Indonesia, could become either basic, intermediate, or advanced users of the technology
within 2 weeks. Trek functioned well in the field: running on lithium batteries, collecting data
quickly, and presenting results on the instrument screen. One challenge encountered in the field
was that the Trek software was not particularly user friendly: there was no overlay of spectra on
the instrument screen for comparison purposes of the samples.

iv
Acknowledgments
The authors would like to acknowledge the following for their guidance, contribution, support,
and feedback in the development of this report:
USP Review of Surveillance and Screening Technologies for the Quality Assurance of
Medicines Expert Panel
National Agency of Drug and Food Control of Indonesia (BBPOM)
Zambia Medicines Regulatory Authority (ZAMRA)

v
Table of Contents
EXECUTIVE SUMMARY .................................................................................................................... III
ACKNOWLEDGMENTS ..................................................................................................................... IV
ACRONYMS ..................................................................................................................................... VI
1. INTRODUCTION ............................................................................................................................ 1
2. METHODOLOGY ........................................................................................................................... 2
3. RESULTS ...................................................................................................................................... 6
4. REVIEW AND CONCLUSIONS ...................................................................................................... 17
5. REFERENCES .............................................................................................................................. 18
ANNEX 1. EQUIPMENT USED DURING PERFORMANCE EVALUATION ............................................. 19
ANNEX 2. SAMPLE MATERIALS USED DURING PERFORMANCE EVALUATION ................................ 20

vi
Acronyms
AL artemether–lumefantrine
AMX amoxicillin
API active pharmaceutical ingredient
CD chlorhexidine digluconate
DP drug product
ID identification
IR infrared
MMF mismatch factor
NIR near infrared
NLT no less than
NMT no more than
RH rifampicin–isoniazid
RHE rifampicin–isoniazid–ethambutol
RHZE rifampicin–isoniazid–pyrazinamide–ethambutol
ST sulfamethoxazole–trimethoprim
USP U.S. Pharmacopeial Convention
WHO World Health Organization

1
1. Introduction
Assuring the quality of medicines along all points of the supply chain is vital for promoting
positive health outcomes for patients around the world [1]. The importance of medicine quality
screening technologies as part of this endeavor is becoming increasingly recognized [2], and
USP has launched the Technology Review Program, an initiative guided by a technical expert
panel established through the organization’s collaborative and volunteer-driven governance. The
Technology Review Program works toward four objectives:
1. Develop standards and guidelines for evaluating medicine quality screening technologies.
2. Generate and disseminate tailored information on the capabilities of these technologies
through a two-step review process: a laboratory-based technical performance evaluation
and a collaborative field-based utility evaluation.
3. Build the knowledge of key stakeholders to appropriately procure and sustainably utilize
screening technologies for the purposes of combating substandard and falsified
medicines.
4. Foster the development and enhancement of new and emerging screening technologies.
This report contributes directly to objectives 2, 3, and 4, and is part of an ongoing series
evaluating the capabilities of various promising screening technologies.
Advances in near infrared (NIR) spectroscopy over the last decade have led to the development
and commercialization of an increasing number of handheld and portable spectrometers, some of
which can be used in low- and middle-income country settings to screen the quality of suspect
medicines. NIR screening technologies measure the absorption of NIR radiation diffusely
reflected from samples. All NIR screening technology instruments employ a 180° data collection
orientation, with contact generally occurring between the sample and device window (typically
made of sapphire). NIR radiation probes the combination and overtone vibrations of the
fundamental modes probed by infrared (IR) and, as a result, the NIR signal is much weaker and
less resolved than IR. NIR penetration depth for solid dosage form medicines can extend
~1–5 mm, enabling a more representative bulk evaluation of the formulation than IR or Raman.
The penetration depth and lower absorption of NIR radiation compared to IR also enables
through-package analysis. Unlike IR-based screening technologies, the signal measured by NIR
screening technologies is strongly dependent on particle size and packing density. Trek1 is one of
the handheld NIR spectrometers on the market with a spectral range of 350 nm–2500 nm. It was
selected for the first NIR review because of claims regarding its technical capabilities, novelty,
and simplicity of use. With input from the expert panel and other stakeholders, the Technology
Review Program decided to review it.
1 The Trek used for the review was purchased from ASD Inc., a brand of Malvern Panalytical, in 2017.
2
2. Methodology
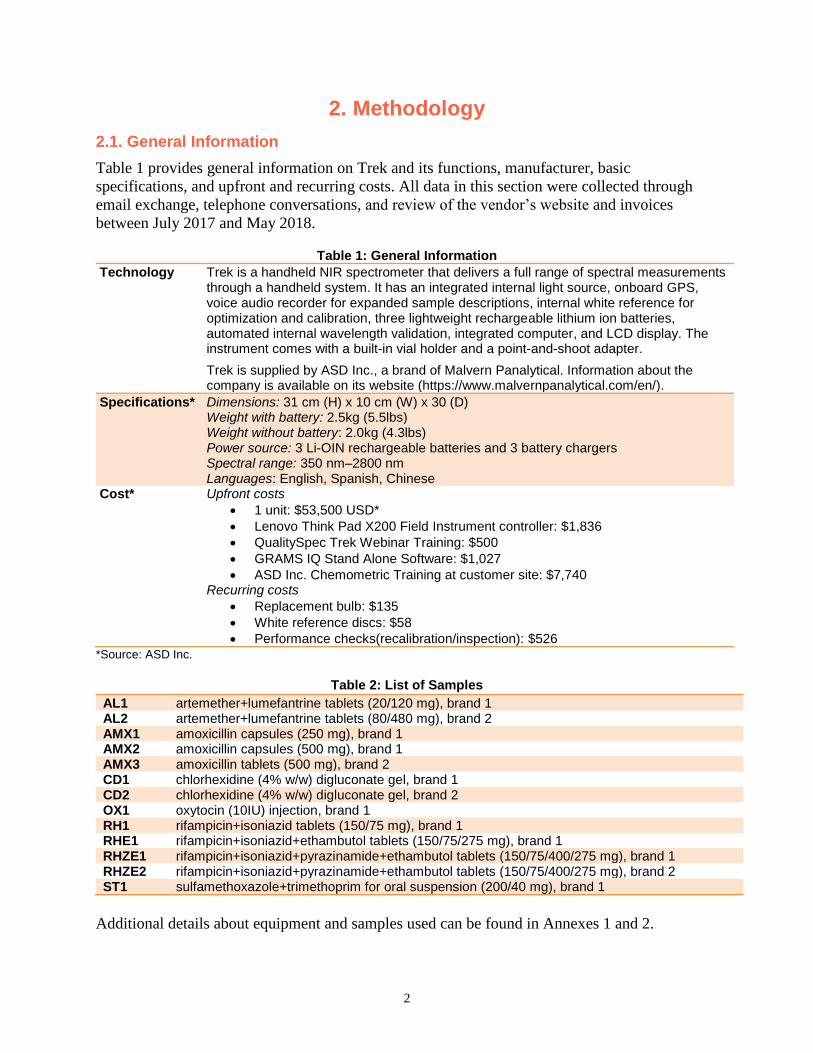
2.1. General Information
Table 1 provides general information on Trek and its functions, manufacturer, basic
specifications, and upfront and recurring costs. All data in this section were collected through
email exchange, telephone conversations, and review of the vendor’s website and invoices
between July 2017 and May 2018.
Table 1: General Information
Technology Trek is a handheld NIR spectrometer that delivers a full range of spectral measurements through a handheld system. It has an integrated internal light source, onboard GPS, voice audio recorder for expanded sample descriptions, internal white reference for optimization and calibration, three lightweight rechargeable lithium ion batteries, automated internal wavelength validation, integrated computer, and LCD display. The instrument comes with a built-in vial holder and a point-and-shoot adapter.
Trek is supplied by ASD Inc., a brand of Malvern Panalytical. Information about the company is available on its website (https://www.malvernpanalytical.com/en/).
Specifications* Dimensions: 31 cm (H) x 10 cm (W) x 30 (D) Weight with battery: 2.5kg (5.5lbs) Weight without battery: 2.0kg (4.3lbs) Power source: 3 Li-OIN rechargeable batteries and 3 battery chargers Spectral range: 350 nm–2800 nm Languages: English, Spanish, Chinese
Cost* Upfront costs
• 1 unit: $53,500 USD*
• Lenovo Think Pad X200 Field Instrument controller: $1,836
• QualitySpec Trek Webinar Training: $500
• GRAMS IQ Stand Alone Software: $1,027
• ASD Inc. Chemometric Training at customer site: $7,740 Recurring costs
• Replacement bulb: $135
• White reference discs: $58
• Performance checks(recalibration/inspection): $526 *Source: ASD Inc.
Table 2: List of Samples
AL1 artemether+lumefantrine tablets (20/120 mg), brand 1 AL2 artemether+lumefantrine tablets (80/480 mg), brand 2 AMX1 amoxicillin capsules (250 mg), brand 1 AMX2 amoxicillin capsules (500 mg), brand 1 AMX3 amoxicillin tablets (500 mg), brand 2 CD1 chlorhexidine (4% w/w) digluconate gel, brand 1 CD2 chlorhexidine (4% w/w) digluconate gel, brand 2 OX1 oxytocin (10IU) injection, brand 1 RH1 rifampicin+isoniazid tablets (150/75 mg), brand 1 RHE1 rifampicin+isoniazid+ethambutol tablets (150/75/275 mg), brand 1 RHZE1 rifampicin+isoniazid+pyrazinamide+ethambutol tablets (150/75/400/275 mg), brand 1 RHZE2 rifampicin+isoniazid+pyrazinamide+ethambutol tablets (150/75/400/275 mg), brand 2 ST1 sulfamethoxazole+trimethoprim for oral suspension (200/40 mg), brand 1
Additional details about equipment and samples used can be found in Annexes 1 and 2.
3
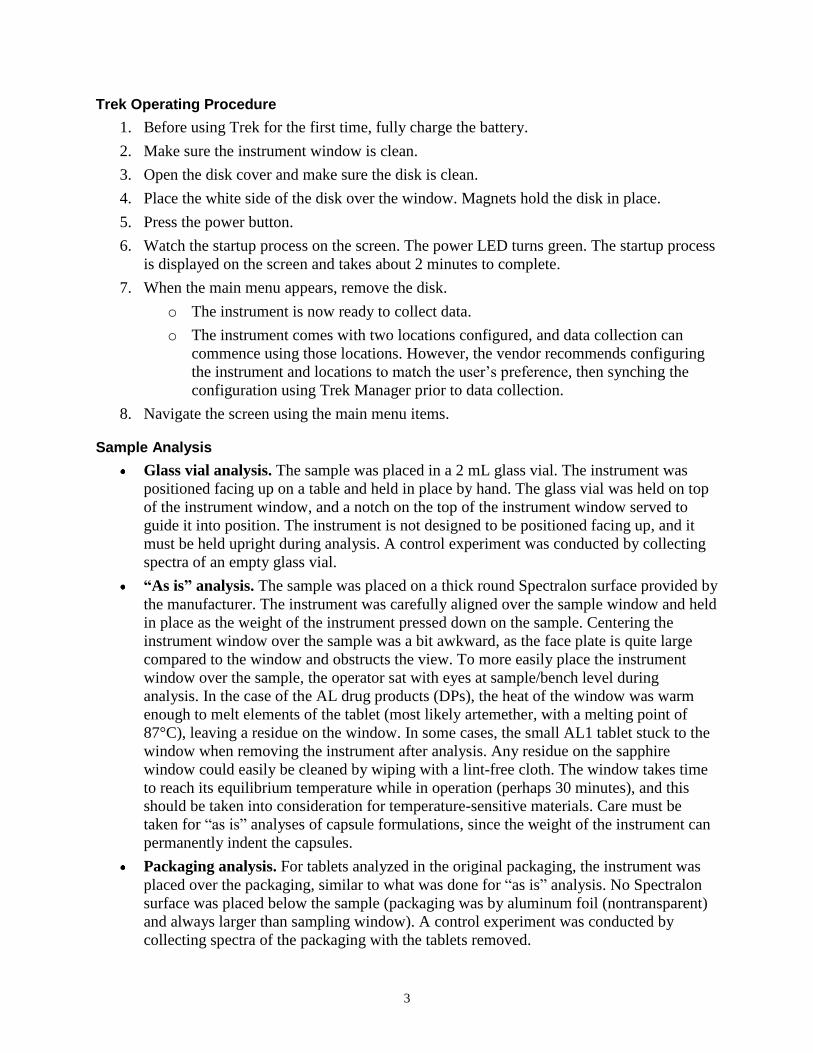
Trek Operating Procedure
1. Before using Trek for the first time, fully charge the battery.
2. Make sure the instrument window is clean.
3. Open the disk cover and make sure the disk is clean.
4. Place the white side of the disk over the window. Magnets hold the disk in place.
5. Press the power button.
6. Watch the startup process on the screen. The power LED turns green. The startup process
is displayed on the screen and takes about 2 minutes to complete.
7. When the main menu appears, remove the disk.
o The instrument is now ready to collect data.
o The instrument comes with two locations configured, and data collection can
commence using those locations. However, the vendor recommends configuring
the instrument and locations to match the user’s preference, then synching the
configuration using Trek Manager prior to data collection.
8. Navigate the screen using the main menu items.
Sample Analysis
Glass vial analysis. The sample was placed in a 2 mL glass vial. The instrument was
positioned facing up on a table and held in place by hand. The glass vial was held on top
of the instrument window, and a notch on the top of the instrument window served to
guide it into position. The instrument is not designed to be positioned facing up, and it
must be held upright during analysis. A control experiment was conducted by collecting
spectra of an empty glass vial.
“As is” analysis. The sample was placed on a thick round Spectralon surface provided by
the manufacturer. The instrument was carefully aligned over the sample window and held
in place as the weight of the instrument pressed down on the sample. Centering the
instrument window over the sample was a bit awkward, as the face plate is quite large
compared to the window and obstructs the view. To more easily place the instrument
window over the sample, the operator sat with eyes at sample/bench level during
analysis. In the case of the AL drug products (DPs), the heat of the window was warm
enough to melt elements of the tablet (most likely artemether, with a melting point of
87°C), leaving a residue on the window. In some cases, the small AL1 tablet stuck to the
window when removing the instrument after analysis. Any residue on the sapphire
window could easily be cleaned by wiping with a lint-free cloth. The window takes time
to reach its equilibrium temperature while in operation (perhaps 30 minutes), and this
should be taken into consideration for temperature-sensitive materials. Care must be
taken for “as is” analyses of capsule formulations, since the weight of the instrument can
permanently indent the capsules.
Packaging analysis. For tablets analyzed in the original packaging, the instrument was
placed over the packaging, similar to what was done for “as is” analysis. No Spectralon
surface was placed below the sample (packaging was by aluminum foil (nontransparent)
and always larger than sampling window). A control experiment was conducted by
collecting spectra of the packaging with the tablets removed.

4
Plastic bag analysis. This is analogous to “as is” analysis, with the sample placed in a
plastic bag (as the bag is transparent, a neutral background such as Spectralon is needed).
Analyzing samples in a plastic bag may be preferred to keep the instrument window clean
and reduce the heat transferred to the sample. A control experiment was conducted by
collecting spectra of the packaging with the tablets removed.
Tablets (powdered). Crushed and ground tablets were placed in a glass vial for glass vial
analysis.
Capsule (powdered). Emptied and ground capsules were placed in a glass vial for glass
vial analysis.
Tablets (“as is”). Blister pack tablets were removed for “as is” analysis.
Capsule (“as is”). Capsules were removed from the container for “as is” analysis.
Gels and liquids. Gels and liquids were placed in a glass vial for glass vial analysis.
These samples had high water content, and a control experiment was conducted by filling
a glass vial with water for glass vial analysis. High-quality data could not be collected
due to interference from water.
Degradation conditions. Part of the AL and RHZE tablets were exposed to 105°C for 17
hours prior to testing.
ASD QualitySpec Trek Manager Software version 1.0.0.90 was used in two Trek instruments,
and the spectra were preprocessed using ViewSpec Pro Version 6.2. The instrument data
collection range was from 350 cm to 2500 cm−1. The method was designed such that 100 scans
were acquired for each sample. Background scans were acquired automatically by the
instrument. A vendor-provided Spectralon surface was used as a white reference, and data are
presented in units of reflectance by the instrument. The ID method involved applying a match
factor ID metric following spectral preprocessing. A correlation coefficient match factor, termed
a mismatch factor (MMF), ID algorithm was applied successfully using a sensitivity and
selectivity threshold of no more than (NMT) 5 and no less than (NLT) 15, respectively. The
sensitivity and specificity thresholds are indicated by green and red lines in the MMF graphs.
The NIR data were compared using an MMF, where zero indicates a perfect match. The
accuracy or diagnostic accuracy of a screening ID method is described by its sensitivity and
selectivity. Sensitivity and selectivity are dependent on the quality of data collected/processed,
discriminating power of the ID metric, and structuring of the ID threshold.
Methodology Limitations
Certain limitations were encountered during this performance review, which were inevitable
given the nature of the technology and the objectives of the review. They are identified below:
1. Seven different DP samples were analyzed. One product (oxytocin injection) could not be
analyzed due to known interference from water. Although most of these products are on
the World Health Organization’s (WHO) Essential Medicines List [3], they represent
only a small fraction of the list. Ideally, many more samples would be analyzed.
However, these seven samples represented a variety of therapeutic indications, fixed-dose
combinations dosage forms, and dosage strengths to enable broader conclusions about the
utility of the Trek.

5
2. No actual substandard or falsified medicines were obtained for the evaluation. Instead
genuine products were subjected to an environmental chamber or oven at 105°C for 17
hours, or different dosage strengths were used to mimic substandard or falsified
medicines. There were no significant changes in spectra after exposure to the above
conditions. Future evaluations could look at the possibility of collaborating with genuine
manufacturers to obtain either placebo (no active pharmaceutical ingredient (API)) or
low-dose versions of their products and subject the samples to harsher environmental
conditions to simulate substandard medicines.
3. Chemical analyses of excipient profiles of different brands of the same product were not
performed. Future work could perform such an evaluation to determine whether minor
match score differences between brands are due to variances in excipient profiles.
6
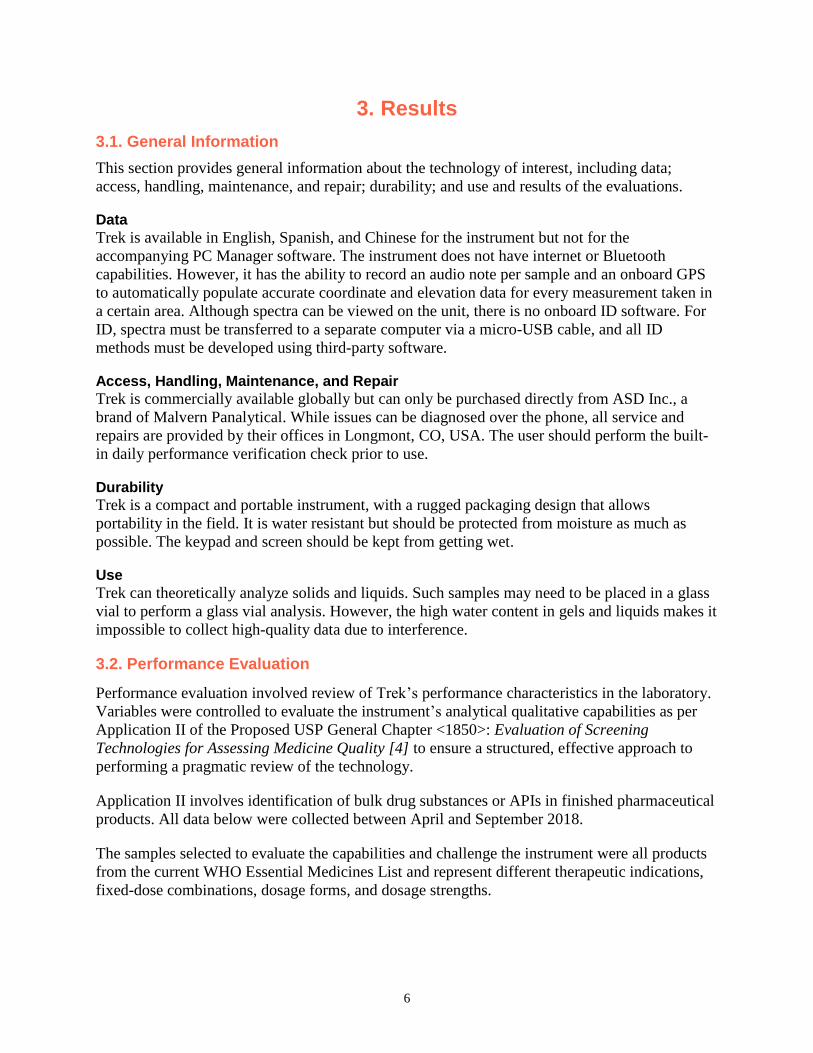
3. Results
3.1. General Information
This section provides general information about the technology of interest, including data;
access, handling, maintenance, and repair; durability; and use and results of the evaluations.
Data
Trek is available in English, Spanish, and Chinese for the instrument but not for the
accompanying PC Manager software. The instrument does not have internet or Bluetooth
capabilities. However, it has the ability to record an audio note per sample and an onboard GPS
to automatically populate accurate coordinate and elevation data for every measurement taken in
a certain area. Although spectra can be viewed on the unit, there is no onboard ID software. For
ID, spectra must be transferred to a separate computer via a micro-USB cable, and all ID
methods must be developed using third-party software.
Access, Handling, Maintenance, and Repair
Trek is commercially available globally but can only be purchased directly from ASD Inc., a
brand of Malvern Panalytical. While issues can be diagnosed over the phone, all service and
repairs are provided by their offices in Longmont, CO, USA. The user should perform the built-
in daily performance verification check prior to use.
Durability
Trek is a compact and portable instrument, with a rugged packaging design that allows
portability in the field. It is water resistant but should be protected from moisture as much as
possible. The keypad and screen should be kept from getting wet.
Use
Trek can theoretically analyze solids and liquids. Such samples may need to be placed in a glass
vial to perform a glass vial analysis. However, the high water content in gels and liquids makes it
impossible to collect high-quality data due to interference.
3.2. Performance Evaluation
Performance evaluation involved review of Trek’s performance characteristics in the laboratory.
Variables were controlled to evaluate the instrument’s analytical qualitative capabilities as per
Application II of the Proposed USP General Chapter <1850>: Evaluation of Screening
Technologies for Assessing Medicine Quality [4] to ensure a structured, effective approach to
performing a pragmatic review of the technology.
Application II involves identification of bulk drug substances or APIs in finished pharmaceutical
products. All data below were collected between April and September 2018.
The samples selected to evaluate the capabilities and challenge the instrument were all products
from the current WHO Essential Medicines List and represent different therapeutic indications,
fixed-dose combinations, dosage forms, and dosage strengths.
7
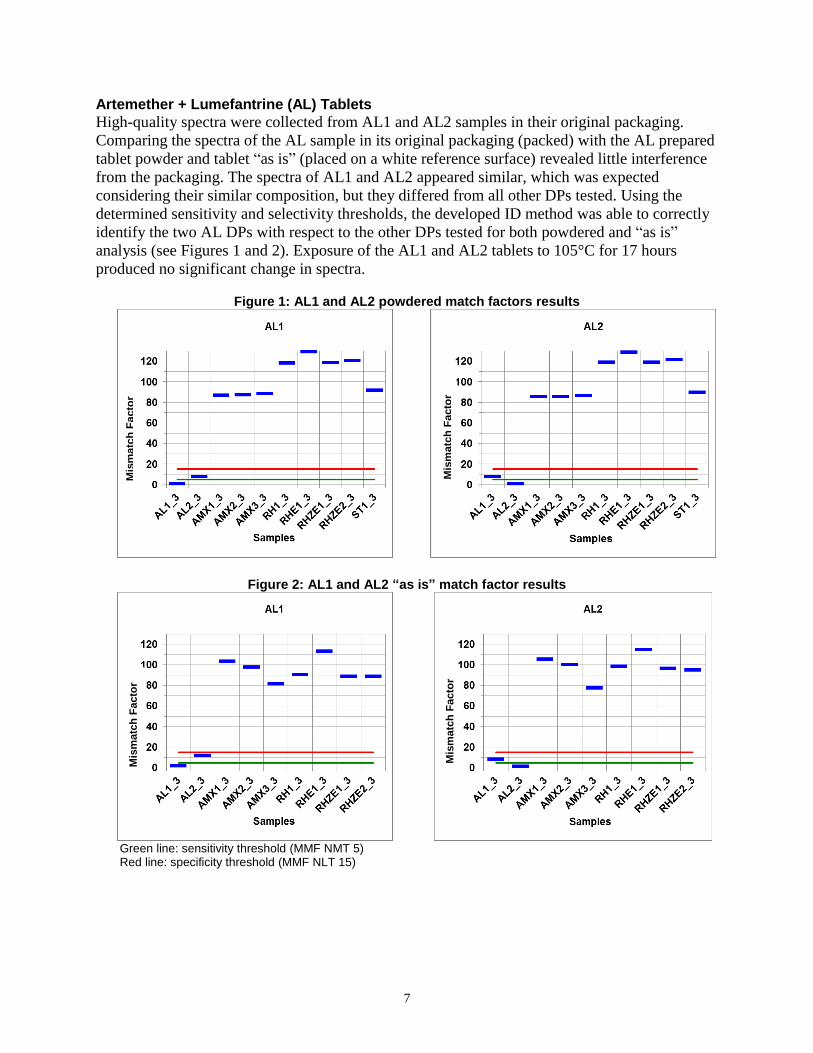
Artemether + Lumefantrine (AL) Tablets
High-quality spectra were collected from AL1 and AL2 samples in their original packaging.
Comparing the spectra of the AL sample in its original packaging (packed) with the AL prepared
tablet powder and tablet “as is” (placed on a white reference surface) revealed little interference
from the packaging. The spectra of AL1 and AL2 appeared similar, which was expected
considering their similar composition, but they differed from all other DPs tested. Using the
determined sensitivity and selectivity thresholds, the developed ID method was able to correctly
identify the two AL DPs with respect to the other DPs tested for both powdered and “as is”
analysis (see Figures 1 and 2). Exposure of the AL1 and AL2 tablets to 105°C for 17 hours
produced no significant change in spectra.
Figure 1: AL1 and AL2 powdered match factors results
Figure 2: AL1 and AL2 “as is” match factor results
Green line: sensitivity threshold (MMF NMT 5) Red line: specificity threshold (MMF NLT 15)
Mis
matc
h F
acto
r
Mis
matc
h F
acto
r
Mis
matc
h F
acto
r
Mis
matc
h F
acto
r

8
Rifampicin + Isoniazid + Pyrazinamide + Ethambutol (RHZE) Tablets
High-quality spectra were acquired from both RHZE1 and 2 tablets “as is.” In contrast to the “as
is” spectra of AL1 and 2, the spectra obtained from RHZE1 and 2 tablets “as is” were
significantly different. However, a comparison of RHZE1 and 2 powdered spectra yielded
similar results, indicating the difference between these two DPs could be due to the coatings.
Although through-package analysis was possible for RHZE1, significant interference was
observed in the case of RHZE2. Match factor analysis of the powdered and “as is” spectra for
RHZE1 and 2 are shown in Figures 3 and 4. The match factor analysis identifies the powdered
samples as similar but the “as is” sample as different, consistent with the spectral variations
observed. Exposure of the RHZE1 and 2 tablets to 105oC for 17 hours produced similar spectra,
indicating no significant spectral changes upon exposure.
Figure 3: RHEZ1 and 2 powdered match factor results
Figure 4: RHEZ1 and 2 “as is” match factor results
Mis
matc
h F
acto
r
Mis
matc
h F
acto
r
Mis
matc
h F
acto
r
Mis
matc
h F
acto
r
9
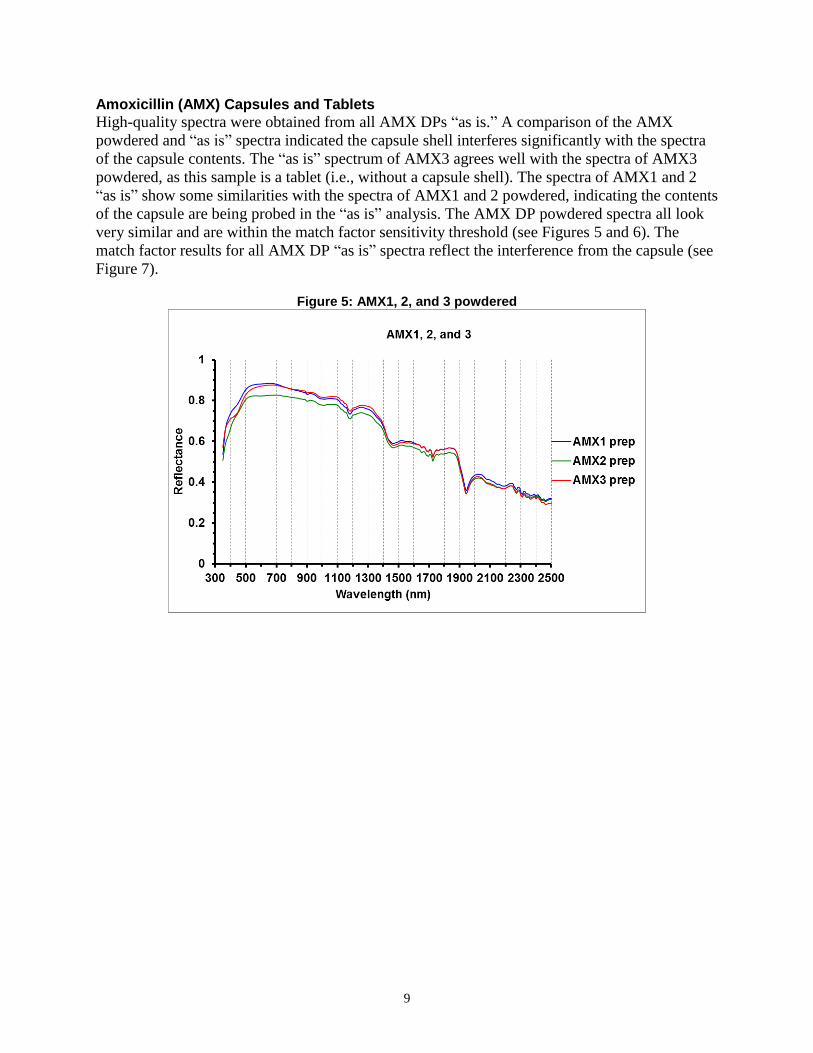
Amoxicillin (AMX) Capsules and Tablets
High-quality spectra were obtained from all AMX DPs “as is.” A comparison of the AMX
powdered and “as is” spectra indicated the capsule shell interferes significantly with the spectra
of the capsule contents. The “as is” spectrum of AMX3 agrees well with the spectra of AMX3
powdered, as this sample is a tablet (i.e., without a capsule shell). The spectra of AMX1 and 2
“as is” show some similarities with the spectra of AMX1 and 2 powdered, indicating the contents
of the capsule are being probed in the “as is” analysis. The AMX DP powdered spectra all look
very similar and are within the match factor sensitivity threshold (see Figures 5 and 6). The
match factor results for all AMX DP “as is” spectra reflect the interference from the capsule (see
Figure 7).
Figure 5: AMX1, 2, and 3 powdered

10
Figure 6: AMX1, 2, and 3 powdered match factor results
Figure 7: AMX1, 2, and 3 “as is” match factor results
Mis
matc
h F
acto
r
Mis
matc
h F
acto
r
Mis
matc
h F
acto
r
Mis
matc
h F
acto
r
Mis
matc
h F
acto
r
Mis
matc
h F
acto
r

11
Rifampin + Isoniazid (RH) Tablets
High-quality spectra were acquired for the RH1 DP packed samples, although some interference
with the packaging was observed. All RH1 spectra packed “as is” and powdered have similar
features, indicating the contents of the tablets being probed in all scenarios. The match factor
results for RH1 are shown in Figure 8 and 9, and accurate identification was achieved with
respect to all DPs.
Figure 8: RH1 powdered match factor results
Figure 9: RH1 “as is” match factor results
Rifampicin + Isoniazid + Ethambutol (RHE) Tablets
High-quality spectra were obtained from the RHE1 DP “as is.” However, significant interference
was observed with through-package analysis, indicating such analysis is not feasible. “As is”
analysis produced similar spectra to the powdered analysis, indicating “as is” analysis probes the
tablet contents sufficiently with little coating interference. The match factor results for RHE1 are
shown in Figures 10 and 11 for powdered and “as is” analysis, respectively. Accurate ID was
achieved with respect to all DPs.
Figure 10: RHE1 powdered match factor results
Figure 11: RHE1 “as is” match factor results
Mis
ma
tch
Fa
cto
r
Mis
ma
tch
Fa
cto
r
Mis
ma
tch
Fa
cto
r
Mis
ma
tch
Fa
cto
r

12
Chlorhexidine Digluconate (CD) Gel
High-quality spectra could not be obtained from the CD DPs because of strong interference from
water and not the active ingredient. A comparison of spectra acquired from samples in glass vials
and water spectra is shown in Figure 12.
Figure 12: CD1 and 2 compared with water
Sulfamethoxazole + Trimethoprim (ST) Oral Suspension
High-quality spectra were obtained from ST by glass vial analysis. Very good agreement was
achieved among duplicate data collections, as was the case for all data collected. Some deviation
was observed in the region below 450 cm−1, which is the reason to avoid the region below
450 cm−1 when developing an ID method. Match factor analysis indicates ST was accurately
identified using the developed method (see Figure 13).
Figure 13: ST match factor results
Mis
ma
tch
Fa
cto
r

13
3.3. Field Evaluation
The field evaluation was performed in Zambia and Indonesia on May 28–June 8, 2018, for two
major parameters: training requirements and field utility. Zambia and Indonesia were selected
because they represent two countries with different regulatory environments, where screening
technologies have not been used extensively in the past but have the potential to be deployed
effectively to combat substandard and falsified medicines.
Training Requirements
This first component of the field evaluation involved working with and training local medicine
regulatory body staff in Zambia and Indonesia to assess the amount of training required to enable
staff to reliably and productively utilize Trek in the field. The training involved 2 full days of
work both in Zambia and Indonesia, which included 1 day of hands-on and theoretical work
followed by 1 day in the field collecting and testing products for practical use of the instrument.
Across both countries, 24 total staff, most of them from the National Agency of Drug and Food
Control of Republic of Indonesia (BBPOM) and Zambia Medicines Regulatory Authority
(ZAMRA) were trained, including 15 laboratory staff (either microbiologists or chemists), 6
inspectors, 2 retail pharmacists, and 1 customs official. To evaluate the perceived training
timeframes for three levels of use of the instrument (basic, intermediate, and advanced), two data
sources were used to develop a training timeframe requirements matrix: (1) a survey completed
by trainees following the training and (2) the trainer observations. Two variables were used to
develop the matrix:
1. User experience (prior to training):
a. Non-technical experience: a trainee with no prior laboratory experience and no
background in one of the physical sciences (e.g., chemistry, biology).
b. Technical experience: a trainee with prior experience working in a laboratory
and/or a background in one of the physical sciences.
c. Specialized experience: a trainee with theoretical and practical experience
utilizing the technology or the technique underpinning the technology.
2. User type (following training):
a. Basic user: a user with the ability to follow a standard operating procedure or
work instruction to set up and run the instrument and collect data.
b. Intermediate user: a user with the ability to develop and modify methods and
evaluate and interpret results.
c. Advanced user: a user with the ability to train other staff and perform basic
troubleshooting.

14
Table 3 provides recommended training timeframes for trainees to reach one of three user
levels—basic, intermediate, or advanced—based on performance and field evaluations, the
survey given to trainees and local staff, and trainer observations.
Table 3: Training Timeframe Requirements
User Experience User Type
Basic Intermediate Advanced
Non-technical Between 1 and 2 days 1 week 2 weeks
Technical 1 day Between 1 day and 1 week 1 to 2 weeks
Specialized 1 to 2 hours 1 day Less than 1 week
Field Utility
The second component of the field evaluation involved running samples using Trek in field
settings and determining the utility of the instrument in these environments. It also included
identifying any challenges associated with traveling with Trek.
No problems were encountered during routine international air transportation, which included
security checks on the checked-in luggage storage on long-haul flights.
However, the lithium ion batteries must be removed from the instrument and carried into the
cabin during flights, since the instrument is carried as checked-in luggage as per current airline
regulations. Travel by vehicle to various sampling sites also did not involve any challenges, and
the instrument withstood temperatures between room temperature and high temperatures (e.g.,
40°C). The rugged travel case and a holster supplied with the instrument made it convenient to
transport and carry the instrument in the field. The instrument was taken to a rural health outlet, a
general hospital, pharmacies, and warehouses, where samples were collected and analyzed
onsite. The trainees completed this work by themselves, the collection of scans was
accomplished in minutes, and the users could see the spectra on the instrument screen. However,
the transfer of spectra between the instrument and the PC (synching) was not successful at this
point, which limited the users to visual comparisons of the spectra. Visual comparison was done
in the field by individually (alternatingly) opening a sample and known files and comparing
spectral features. Even with this limited procedure, the trainees were able to identify samples that
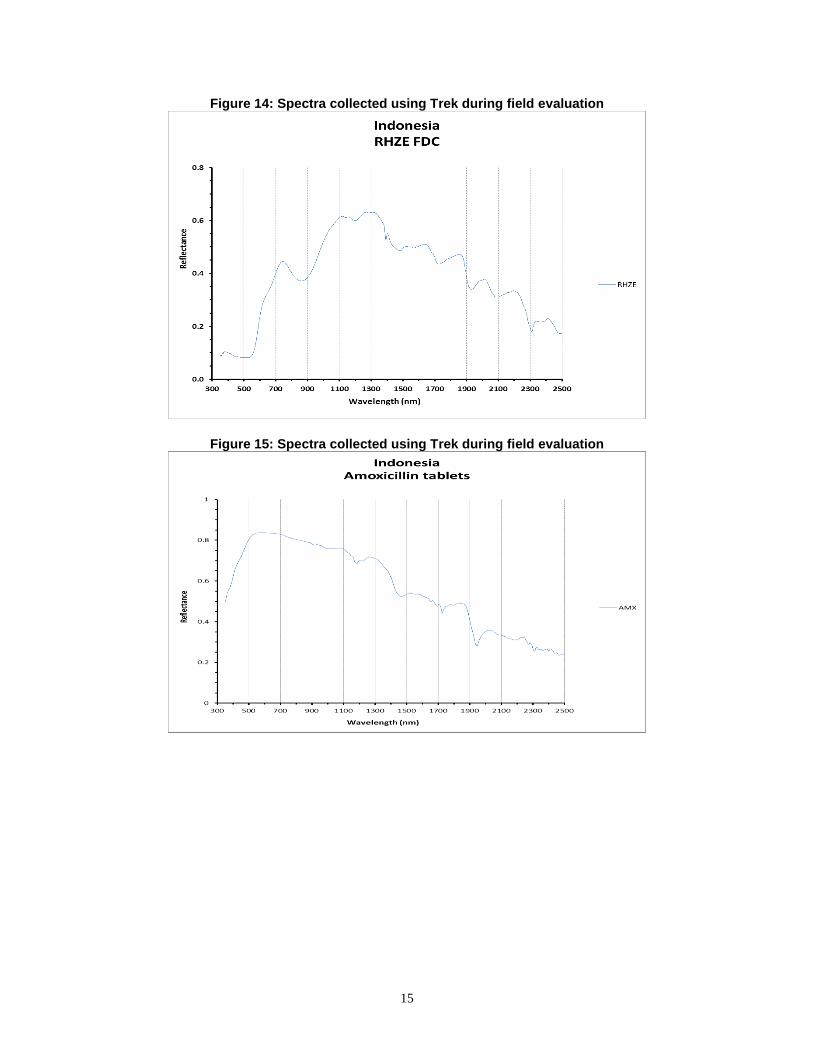
corresponded to the known spectra. Later, after additional discussion with the instrument
manufacturer, some of the spectra collected in the field were downloaded and evaluated, and
examples of these field spectra can be seen in Figures 18, 19, and 20. These files show the field
spectra were very similar to spectra collected in the laboratory.
Some other issues observed with the instrument and noted include:
An error pops up when trying to export files.
Calibration checks after few scans normally taking a couple minutes.
Field use challenges arise due to the orientation of the instrument.
The software not user friendly in data processing and analysis, as it requires
determination of a threshold and a data file format that must be changed to allow for text
numbers.
15
Figure 14: Spectra collected using Trek during field evaluation
Figure 15: Spectra collected using Trek during field evaluation

16
Figure 16: Spectra collected using Trek during field evaluation
Use of Trek during field evaluation in Zambia

17
4. Review and Conclusions
4.1. Performance Evaluation
Trek provides quality NIR data for DP ID, with distinct advantages over other vibrational
spectroscopies such as Fourier transform infrared and Raman. NIR penetration depth for solid
dosage form medicines can extend ~1–5 mm, enabling a more representative bulk evaluation of
the formulation than IR or Raman. The penetration depth and lower absorption of NIR radiation
compared to IR also enables through-package analysis. Also, unlike IR screening technologies,
the signal measured by NIR screening technologies is strongly dependent on particle size and
packing density. All of the DPs produced high-quality spectra, except for oxytocin and
chlorhexidine digluconate gel, which did not due to strong interference from water. By
comparing spectra of DPs removed from packaging (e.g., blister pack/capsule) with packaged
DPs, it was possible (although interferences were observed) to generate DP-specific information
through the packaging in many cases. Excellent agreement was found between the two NIR
instrument-collected spectra, allowing data to be compared on both instruments. It was found
that by covering the bottom of a small vial with the DP substance of interest (at least 1 mm high),
high-quality NIR data could be collected through the bottom of the vial. Tablet coating may also
impact the results due to the light penetration depth.
Exposure of AL and RHZE tablets to 105°C for 17 hours produced the same spectra, indicating
no significant spectral changes upon exposure. Further work is needed to ascertain the threshold
(amount of degradation) at which Trek would identify a substandard product. This should be
corroborated using confirmatory analysis to assay the content of API and degradation products.
High-quality spectra were acquired from both RHZE 1 and 2 tablets, but they were significantly
different, indicating the difference between the two DPs was the tablet coatings. A comparison of
RHZE1 and 2 spectra when powdered indicated the products are similar. High-quality spectra
were also obtained from all AMX DPs, but a comparison of the AMX powdered and “as is”
spectra indicate the capsule interferes significantly with the capsule contents spectra. There was
strong interference, and high-quality spectra could not be obtained for products containing water.
4.2. Field Evaluation
Based on feedback from trainees and ongoing observations of trainers, the training required to
become a basic, intermediate, or advanced user of the instrument was manageable. More
specifically, most staff with either technical or non-technical backgrounds can become
immediate or advanced users within 2 weeks of training. The Trek Manager software was easy to
download onto an external computer through a vendor-provided attachment. Transfer of data and
development of spectral libraries were not very simple during the training and at the field due to
software problems. The reference spectra library also needs to be carefully built and maintained,
since the usefulness of the results depends on the software.
The instrument is not small: field use was challenging because of its orientation, and it may need
two people to operate. The advantage is that it does not need any external consumables, making
it particularly suitable for use in field settings where electricity may not be reliable since the
instrument comes with three batteries. Additional work would need to evaluate the feasibility of
enhancing the instrument by developing a function that allows overlay of spectra on the screen.

18
5. References
[1] PQM, Annual Performance Report FY 2017, Promoting the Quality of Medicines program,
Washington, DC, 2017.
[2] IOM, Countering the Problem of Falsified and Substandard Drugs, Institute of Medicine
(now the National Academies of Sciences, Engineering, Medicine), Washington, DC, 2013.
[3] WHO, WHO Model List of Essential Medicines, 20th List (March 2017), March 2017b.
[Online]. Available at
http://www.who.int/medicines/publications/essentialmedicines/20th_EML2017.pdf?ua=1.
[Accessed 10 December 2018].
[4] USP Review of Surveillance and Screening Technology for the Quality Assurance of
Medicines Expert Panel, “Proposed USP General Chapter <1850>: Evaluation of Screening
Technologies for Assessing Medicine Quality (USP PF 43 (5)).” September 2017.
19
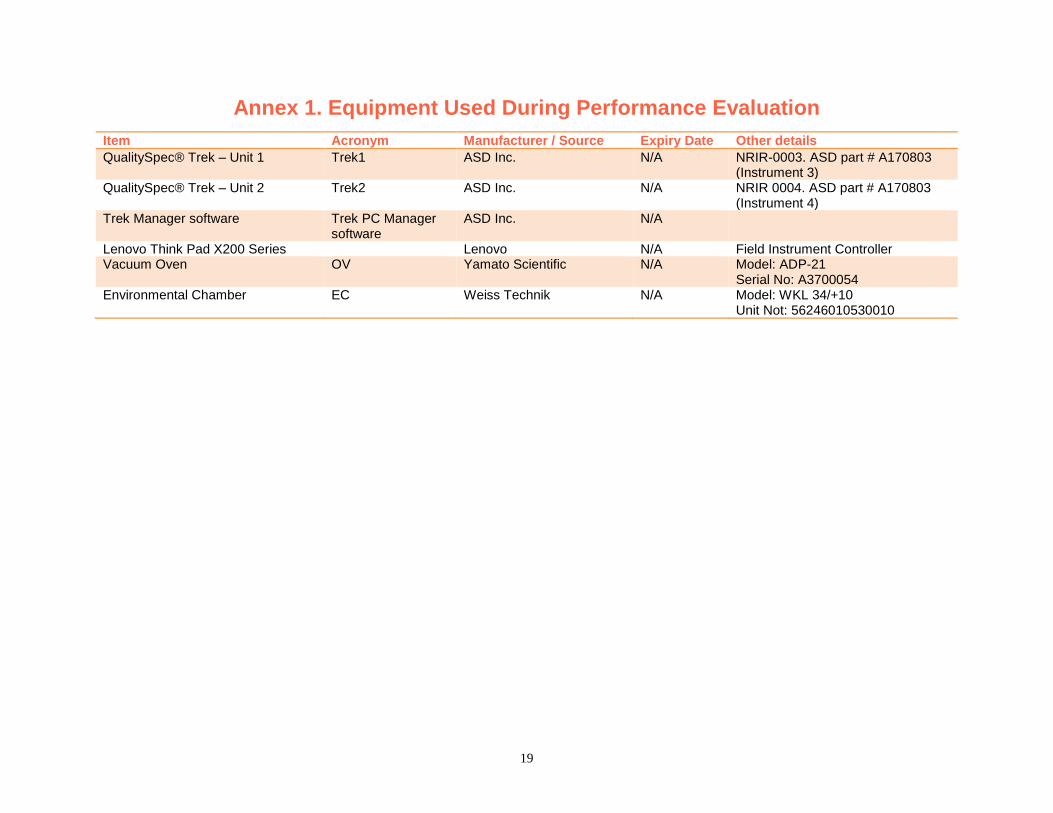
Annex 1. Equipment Used During Performance Evaluation
Item Acronym Manufacturer / Source Expiry Date Other details
QualitySpec® Trek – Unit 1 Trek1 ASD Inc. N/A NRIR-0003. ASD part # A170803 (Instrument 3)
QualitySpec® Trek – Unit 2 Trek2 ASD Inc. N/A NRIR 0004. ASD part # A170803 (Instrument 4)
Trek Manager software Trek PC Manager software
ASD Inc. N/A
Lenovo Think Pad X200 Series Lenovo N/A Field Instrument Controller Vacuum Oven OV Yamato Scientific N/A Model: ADP-21
Serial No: A3700054 Environmental Chamber EC Weiss Technik N/A Model: WKL 34/+10
Unit Not: 56246010530010

20
Annex 2. Sample Materials Used During Performance Evaluation
Item Acronym Manufacturer / Source Product # Lot No.
Amoxicillin (250 mg) capsules AMX1 Sandoz 0781-2020-01 HG9361 Amoxicillin (500 mg) capsules AMX2 Sandoz 0781-2613-01 GS0051 Amoxicillin (500 mg) tablets AMX3 Teva 0093-2263-01 35442174A Artemether (20 mg) + Lumefantrine (120 mg) tablets AL1 Ipca Laboratories 18901079017052 DY1466166 Artemether (80 mg) + Lumefantrine (480 mg) tablets AL2 Novartis 30760 U57 K0050 Chlorhexidine (4% w/w) Digluconate gel CD1 Lomus Pharma. Kawach Gel 616 Chlorhexidine (4% w/w) Digluconate gel CD2 NA Umbilica Gel 326L15 Oxytocin injection (10 units/mL) OX1 PT Ethica GKL8606703943A1 15G0497 Rifampicin (150 mg) + Isoniazid (75 mg) tablets RH1 Phapros Pro TB 2 6159001 Rifampicin (150 mg) + Isoniazid (75 mg) + Ethambutol HCl (275 mg) tablets
RHE1 Macleods Pharma. DD/376 ERD2706B
Rifampicin (150 mg) + Isoniazid (75 mg) + Pyrazinamide (400 mg) + Ethambutol HCl (275 mg) tablets
RHZE1 Lupin Ltd. 499 A603606
Rifampicin (150 mg) + Isoniazid (75 mg) + Pyrazinamide (400 mg) + Ethambutol HCl (275 mg) tablets
RHZE2 Macleods Pharma. DD/Drugs/DD/376 ERC6690C
Sulfamethoxazole (200 mg) + Trimethoprim (40 mg) for oral suspension
ST1 BDH Industries 608 D-10217
Note: OX1 sample was not analyzed due to known interference from water.