
Using Wavelet Transform to Disaggregate Electrical Power Consumption into the Major End-Uses
15
Francisco J. Ferrández-Pastor Juan M. García-Chamizo Mario Nieto-Hidalgo Vicente Romacho-Agud Francisco Flórez-Revuelta Department of Computing Technology [email protected]
-
Upload
francisco-paco-florez-revuelta -
Category
Technology
-
view
229 -
download
0
Transcript of Using Wavelet Transform to Disaggregate Electrical Power Consumption into the Major End-Uses

Francisco J. Ferrández-Pastor Juan M. García-Chamizo
Mario Nieto-Hidalgo Vicente Romacho-Agud
Francisco Flórez-Revuelta
Department of Computing Technology [email protected]

Main electric panel I t( ) = I1(t)+ I2 (t)+ I3(t)+ I4 (t)+..+ Im t( )
Im (t) = Im1(t)+...+ Imn (t)
I4 (t) = I41(t)+...+ I4n (t)
I3(t) = I31(t)+...+ I3n (t)I2 (t) = I21(t)+...+ I2n (t)
I1(t) = I11(t)+...+ I1n (t)
Department of Computing Technology [email protected]

main electric panel
current transformer
CT
data acquisition
da wavelet transform
WT
Ida t( ) =I(t)CT
I t( ) = I1(t)+ I2 (t)+ I3(t)+ I4 (t)+..+ Im t( )
Im (t) = Im1(t)+...+ Imn (t)
I4 (t) = I41(t)+...+ I4n (t)
I3(t) = I31(t)+...+ I3n (t)I2 (t) = I21(t)+...+ I2n (t)
I1(t) = I11(t)+...+ I1n (t)
Department of Computing Technology [email protected]

data acquisition
da
current transformer
CT
wavelet transform WT
Ida t( ) =I(t)CT
I t( ) = I1(t)+ I2 (t)+ I3(t)+ I4 (t)+..+ Im t( )
Department of Computing Technology [email protected]

Supervised phase The events that produce electrical connection and dis-connection of appliances (lighting, microwave, television, etc.) are classified as adapted wavelets. When profiling the appliances to build the knowledge base, we make controlled connections and disconnections that generate specific signatures for the various power consumption modes for each appliance or device. Monitoring phase The aggregate curve of electrical consumption (captured during a monitoring process) is processed applying a wavelet transform using adapted wavelet functions Ψi. Actual and recorded data are used to identify power events (connection/disconnection of appliances).
Department of Computing Technology [email protected]

Department of Computing Technology [email protected]
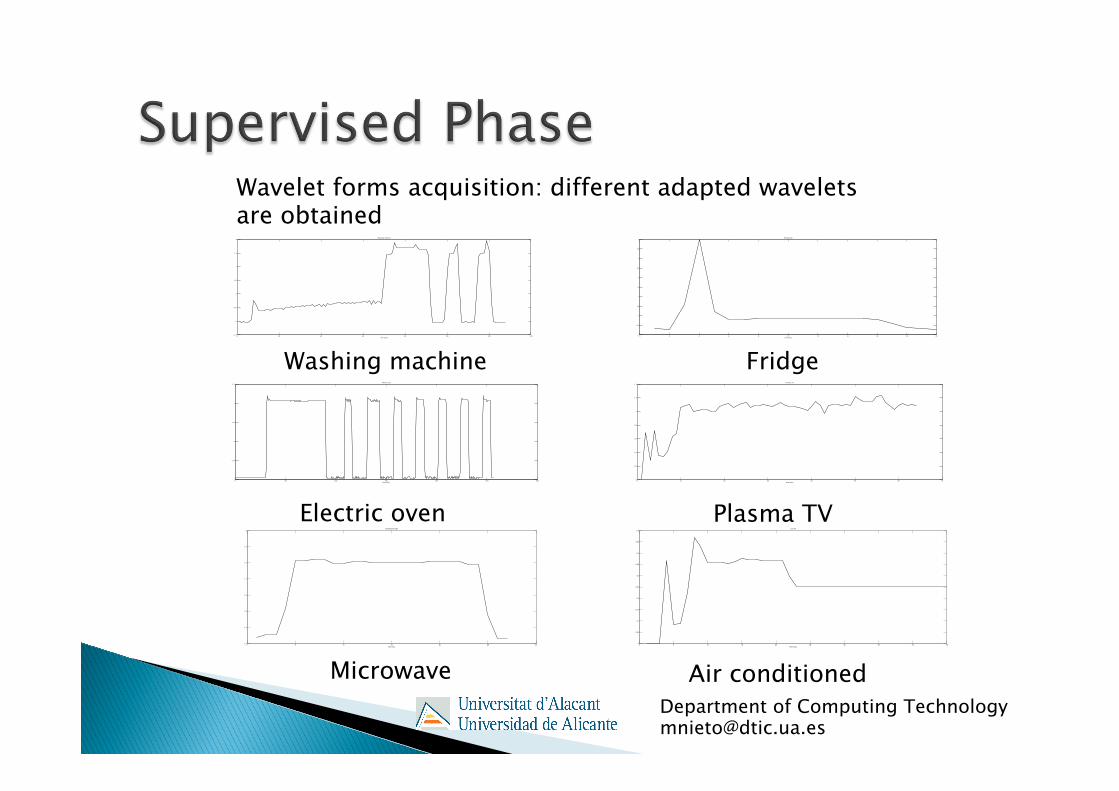
Wavelet forms acquisition: different adapted wavelets are obtained
0 20 40 60 80 100 120 140−1.5
−1
−0.5
0
0.5
1
1.5
2
time (sec)
Washing machine
0 2 4 6 8 10 12 14 16 18 20−1
−0.5
0
0.5
1
1.5
2
2.5
3
3.5
4
time (sec)
Refrigerator
0 100 200 300 400 500 600−1
−0.5
0
0.5
1
1.5
time (sec)
Electric hob
0 10 20 30 40 50 60 700
0.2
0.4
0.6
0.8
1
1.2
1.4
time (sec)
Plasma TV
0 5 10 15 20 25 301.3
1.4
1.5
1.6
1.7
1.8
1.9
2
time (sec)
Incandescent light
0 5 10 15 20 25 30 35 40 450
0.05
0.1
0.15
0.2
0.25
0.3
0.35
0.4
0.45
0.5
time (sec)
Led TV
Washing machine Fridge
Electric oven Plasma TV
Microwave Air conditioned Department of Computing Technology [email protected]

400 600 800 1000 1200 1400 1600 1800
2
4
6
8
10
12
14
16
18
Time (sec)
Elec
trica
l cur
rent
(Am
per)
Sampling time: 1 second
b2b3b1
adapted wavelet location on the signal
Example of a wavelet Ψa,b
(t) of fixed dilation at three different locations on the signal. A large positive value of coefficients is returned in location b2.
Ψa,b
(t)
We calculate coefficients of WT with each adapted wavelet
0 20 40 60 80 100 120 140−1.5
−1
−0.5
0
0.5
1
1.5
2
time (sec)
Washing machine
Department of Computing Technology [email protected]

Analyzed Signal
Percentage of energy for refrigerator adapted wavelet
Time
Scal
es a
0 0.5 1 1.5 2
x 104
1
2
3
4
0.4
0.6
0.8
1
1.2
1.4
1.6
1.8
2
2.2
2.4
Adapted wavelet
Analyzed Signal
Percentage of energy for washing machine adapted wavelet
Time
Scale
s a
0 0.5 1 1.5 2 2.5
x 104
1
2
0.1
0.15
0.2
0.25
0.3
0.35
0.4
0.45
0.5
Adapted wavelet
Example of adapted wavelet transform with pattern functions Ψi and analysis of energy Eψi (Scalograme)
Department of Computing Technology [email protected]

Department of Computing Technology [email protected]

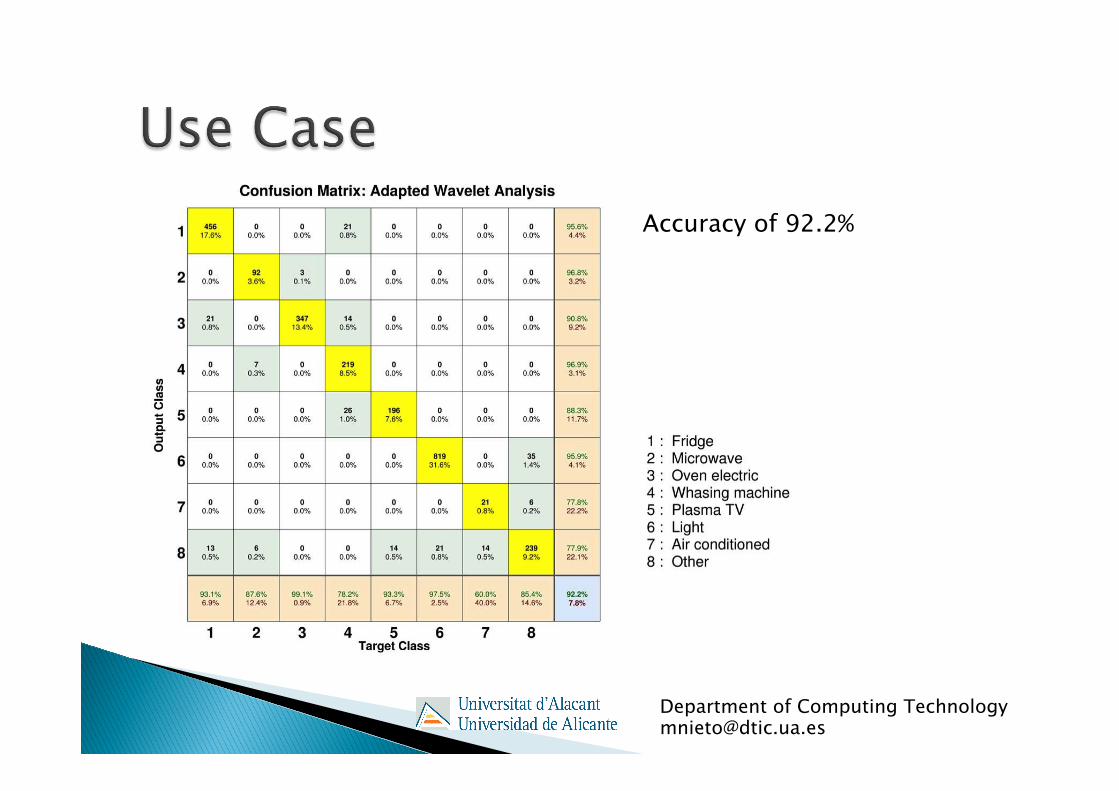
} This method has been tested in a real environment. ◦ Using an energy meter in a house ◦ During 7 days ◦ Sampling time 1Hz
} A set of seven signal forms (f1 to f7) has been taken. ◦ For each form an adapted wavelet (ψ1 to ψ7) is built.
} Wavelet Transform for each adapted wavelet ψ1 to ψ7 is calculated when an event is detected. ◦ A vector of energy coefficients: [wcf1, wcf2, wcf3, wcf4,
wcf5, wcf6, wcf7] is obtained. ◦ The argmax {wcfi } provides the detected form fi.
Department of Computing Technology [email protected]
} Wavelet transform with adapted signals is a technique with great potential for power consumption analysis
} This work shows that data captured by power meters, in a non-intrusive way, can be treated with wavelet analysis to identify activities and to disaggregate the total electricity into the major end-uses
} This method could be able to recognise behaviour of people and may be used to develop new services and in energy management
Department of Computing Technology [email protected]
Francisco J. Ferrández-Pastor Juan M. García-Chamizo
Mario Nieto-Hidalgo Vicente Romacho-Agud
Francisco Flórez-Revuelta
Department of Computing Technology [email protected]