Using the VNTR Locus D1S80 for Human Identification VNTR PCR BABEC 9/26/11 Student Guide 1 Using the...
45
D1S80 VNTR PCR BABEC 9/26/11 Student Guide 1 Using the VNTR Locus D1S80 for Human Identification Maria C. Abilock Frank H. Stephenson, Ph.D. BABEC Applied Biosystems Yosemite National Park, California July 10,1981 “She doesn’t hate me, does she?” “No, Daddy. She just thought you were gone too much. She missed you.” Air Force Captain Brian Hawthorne sat next to his daughter on the trunk of a fallen redwood. With a long stick, he slowly traced a zig-zagged line in the dirt. “And you, Marion?” he asked. “I always loved your letters. Just because someone’s not around all the time doesn’t mean they don’t care about you.” “How’d you get so smart for a fourteen-year-old?” The sun drifted behind Half Dome and twilight draped the sky. The whistle of birds mingled with the gentle whisper of leaves in the wind. “I’ll make ya a deal, Munchkin. You brush your teeth and I’ll get wood for a fire. Water’s in the canteen in the tent.” On reaching the edge of the woods, he glanced back to see her silhouette, backlit by lantern light, dance on the side of the canvas. He never cared much for camping. He guessed that aversion to be a reaction to survival training he was forced to endure as a young cadet. As an Air Force Captain, the military provided him better accommodations. Clean sheets. A hot shower in the morning. Another one before bed. These were the necessary luxuries of civilization that camping deprived him. But Marion seemed to relish it and he was determined to make every moment of his allotted visitation time as special for her as he could. With darkness threatening to overtake the evening, he quickly rummaged the forest floor for wood. As he struggled to break apart a fallen tree limb, a strange mix of shadow and light suddenly played against the branches above him. He looked up to see if he could spot the moon ascending, but the canopy of leaves concealed the sky. A silence spread around him. Bright streaks of light the color of flame shifted through the timbers until their angle fixed parallel to the ground. Strobe-like, they fanned out to either side of him, radiating from some point back towards his tent. A flush of adrenaline stung his heart. He raced back down the path and skidded to a stop at the edge of the woods. A large luminescent disk hovered above the trees on the far side of the clearing. He bolted towards the tent as the craft sped skyward in a near vertical lift. Its glow shrank in the darkness and in moments became a speck of light indistinguishable from the backdrop of stars sprayed across the night sky. “Marion!” he screamed. “MA-RI-ON!” She was gone. Air Force Installation Code Named S4, Nevada April 16, 1987 Hawthorne, escorted by his host, First Lieutenant Steven Frost, walked to the large hangar from the direction of the flight tower. They stopped in front of an armed guard stationed at the hangar doors. Yet another hoop to jump through, Hawthorne imagined, before he could learn the reason for his orders to report to this installation; a facility, much to his dismay, that he did not even know existed until the cargo plane carrying him had landed on its runway
Transcript of Using the VNTR Locus D1S80 for Human Identification VNTR PCR BABEC 9/26/11 Student Guide 1 Using the...

D1S80 VNTR PCR BABEC 9/26/11 Student Guide 1
Using the VNTR Locus D1S80 for Human Identification
Maria C. Abilock Frank H. Stephenson, Ph.D. BABEC Applied Biosystems Yosemite National Park, California July 10,1981 “She doesn’t hate me, does she?” “No, Daddy. She just thought you were gone too much. She missed you.” Air Force Captain Brian Hawthorne sat next to his daughter on the trunk of a fallen redwood. With a long stick, he slowly traced a zig-zagged line in the dirt. “And you, Marion?” he asked. “I always loved your letters. Just because someone’s not around all the time doesn’t mean they don’t care about you.” “How’d you get so smart for a fourteen-year-old?” The sun drifted behind Half Dome and twilight draped the sky. The whistle of birds mingled with the gentle whisper of leaves in the wind. “I’ll make ya a deal, Munchkin. You brush your teeth and I’ll get wood for a fire. Water’s in the canteen in the tent.” On reaching the edge of the woods, he glanced back to see her silhouette, backlit by lantern light, dance on the side of the canvas. He never cared much for camping. He guessed that aversion to be a reaction to survival training he was forced to endure as a young cadet. As an Air Force Captain, the military provided him better accommodations. Clean sheets. A hot shower in the morning. Another one before bed. These were the necessary luxuries of civilization that camping deprived him. But Marion seemed to relish it and he was determined to make every moment of his allotted visitation time as special for her as he could. With darkness threatening to overtake the evening, he quickly rummaged the forest floor for wood. As he struggled to break apart a fallen tree limb, a strange mix of shadow and light suddenly played against the branches above him. He looked up to see if he could spot the moon ascending, but the canopy of leaves concealed the sky. A silence spread around him. Bright streaks of light the color of flame shifted through the timbers until their angle fixed parallel to the ground. Strobe-like, they fanned out to either side of him, radiating from some point back towards his tent. A flush of adrenaline stung his heart. He raced back down the path and skidded to a stop at the edge of the woods. A large luminescent disk hovered above the trees on the far side of the clearing. He bolted towards the tent as the craft sped skyward in a near vertical lift. Its glow shrank in the darkness and in moments became a speck of light indistinguishable from the backdrop of stars sprayed across the night sky. “Marion!” he screamed. “MA-RI-ON!” She was gone. Air Force Installation Code Named S4, Nevada April 16, 1987 Hawthorne, escorted by his host, First Lieutenant Steven Frost, walked to the large hangar from the direction of the flight tower. They stopped in front of an armed guard stationed at the hangar doors. Yet another hoop to jump through, Hawthorne imagined, before he could learn the reason for his orders to report to this installation; a facility, much to his dismay, that he did not even know existed until the cargo plane carrying him had landed on its runway

D1S80 VNTR PCR BABEC 9/26/11 Student Guide 2
just moments earlier. He had not received any briefing as to the nature of his visit. But his orders had come from the highest circle and he was obliged to follow them. Frost was almost as cagey as everyone else he had encountered on this trip. He was confident, however, an appropriate time for questions would eventually present itself. “Lieutenant Frost, Sir,” the guard acknowledged, his boots thumping together as he brought himself to attention. “Entry granted for Captain Brian Hawthorne,” Frost recited, handing the authorization form to the guard, “by order of Colonel Scott.” The guard scanned the document, looked up briefly to stare Hawthorne squarely in the eyes, and looked down at the document again. “Yes, Sir,” the guard finally answered. He keyed a code into the lock and a series of bolts clicked free. Metal wheels scratched along their track in the pavement as the hangar doors slid open. Confusion, anger, and awe swept over him all at once as a large disc-shaped craft, positioned in the center of the enclosure, came into full view. He stood there, motionless, and stared. His mind raced. “You know about my daughter, don’t you?” Hawthorne finally asked. “No sir, we don’t.” “Then perhaps you can explain to me, First Lieutenant Frost, how it is that this is the same craft I saw seven years ago the night my daughter disappeared?” “It’s not exactly the same craft, Sir.” “Who built it... Northrop?... McDonnell Douglas? I didn’t know we had anything like this.” “It’s not U.S., Sir.” “Captured Russian?” “No, Sir.” “Then where did it come from?” “Perhaps I should let Colonel Scott explain”, Frost replied, gesturing towards a man and a woman approaching from an entryway on the east side of the hangar. The woman wore civilian clothes, covered loosely by a white lab coat. “Captain Hawthorne, I’m Colonel Scott,” the officer announced, saluting and extending his hand as he and his companion came to a stop in front of him. Hawthorne returned the salute and shook the Colonel’s hand. “Dr. Beverly Davis” Colonel Scott continued, nodding towards the woman. Hawthorne motioned a quick obligatory salute. “What’s this all about, Sir?” Hawthorne asked, his eyes directed back at the craft. “We felt it necessary to bring you here”, Scott replied. “Who’s ‘we’?” “Majestic.”
D1S80 VNTR PCR BABEC 9/26/11 Student Guide 3
“An Air Force operation?” “Not entirely. An organization of military and civilian personnel formed by President Truman, following the recovery of this craft.” “Recovered from where, Sir?” “Roswell, New Mexico on July 7, 1947. It crash landed in an electrical storm. We recovered crew. All dead. Extraterrestrial, Captain Hawthorne. Majestic was established to reverse engineer the craft and to assess the threat to U.S. national security.” “Hold on, Sir, I’ve looked into the Roswell incident. Before hitting a wall of classified documents, I read early Army reports stating they’d recovered a weather balloon.” “That was an exaggeration.” “An exaggeration? Oh, that’s what you call it. And then a couple years ago they changed their story. They claimed it was a Project Mogul atmospheric sensor.” “Another exaggeration.” “You mean you’ve known about this since 1947 and you’ve kept it secret? And you knew about me and my daughter?” Hawthorne felt his patience slipping away from him as well as the self-restraint he normally practiced when addressing a superior officer. “Yours was a very public case.” “I was vilified. Why didn’t you come forward? You obviously had vital information.” “A larger question of national security was at stake. We couldn’t come forward,” Colonel Scott replied. “We couldn’t compromise the organization’s security.” “Then why am I here? Why are you showing me this now?” “We’ve been monitoring your activity for the last several years. Your investigations into Air Force reports on UFO’s have been, in a word, disconcerting.” “I’m a pest. Is that why I’m here?” “We sympathize with your interest in the subject but your continued attempts to access secret and classified documents threatens to expose us. We can’t let that happen” “You want my silence... my cooperation.” “We believe, in the interest of national security, that your talents are best used within the Majestic organization. You’ve been reassigned. Dr. Davis here will function as your associate.” “What’s the adage,” Hawthorne responded, “keep your friends close, but keep your enemies even closer. And you, Dr. Davis... is it your function to keep an eye on me?” “You have an aptitude for investigative work,” the Colonel said. “We can use that.” “And if I refuse?” “You have a much better chance of discovering the whereabouts of your daughter if you’re with us.”

D1S80 VNTR PCR BABEC 9/26/11 Student Guide 4
Hawthorne studied the faces of the three around him and then turned to look at the craft again. “What do you know already? Where do they come from?” “Dr. Davis is an exobiologist, I’ll let her explain,” the Colonel said, gesturing for her to enter the conversation. “Beverly?” “The fact of the matter is, we don’t know that much about their origin,” she offered. “There are two types of extraterrestrial biological entities that we know of, both humanoid in appearance. Fibronectin-like cell lattice differentiation and hemimethylated DNA in the...” “Have we ever communicated with them?” Hawthorne interrupted. She allowed an exasperated sigh to escape while she redirected her train of thought. “All the specimens we have acquired, those from Roswell, were deceased upon recovery,” she said. “Their intent?” Hawthorne asked. “We believe they’re benign”, she replied. “There are no indications that they mean us any harm.” “No indications? They abducted my daughter!” “But still,” Beverly replied, “other cases of abduction have been reported, some from quite reliable sources. Even if only the smallest fraction of these reports are true... those claiming to have been abducted have been returned.” “I don’t share your confidence in their so-called benign purpose. With all due respect, I believe it’s much darker and more immediate.” “And just what do you believe, Captain Hawthorne?” Beverly challenged. “I believe that we are the objects of experimentation. I believe that they have designs on our planet. I believe, as in any military campaign, they are attempting to infiltrate our population, preparing to destroy it. This will allow eventual colonization of our planet without resistance.” “And on what do you base these beliefs?” “Perhaps we can hold these discussions over dinner tonight,” Colonel Scott broke in. “You two will have plenty of opportunity to chat about these matters later on. By the way, I should tell you, Captain Hawthorne, you and Dr. Davis will be sharing an office at the Pentagon. Welcome to Majestic.” The Pentagon Building, Sublevel 4, Majestic Headquarters, Washington D.C. July 2, 1997 Hawthorne arrived at his office early, having once again given in to the sleeplessness that still managed to plague him from time to time. He sat down at his desk and winced as his first gulp of coffee seared the cells of his cheek. He drew an exaggerated breath as he glanced at the piles of papers on his desk. They were like geological strata; he could precisely locate any file based on how long ago he’d read it and how many layers would have accumulated since then. These had become his life at Majestic. Abduction case after abduction case. They were also the subject of ridicule by the other members of the organization. Crackpots and lunatics... ‘CPL Files’ they were called. They were funneled to him to be accessed for veracity. He pulled his chair tighter to his desk and grabbed the file that had been placed on top of the heap. The report described the sworn affidavit of a caucasian male approximately 30 years of age. He claimed to have been returned to his home in Pacifica, California after having been held captive for many years by an alien race. According to his testimony, he was kept in a cubicle in a place he described as an “intergalactic zoo”. An unidentified human female, of similar age, was held in an adjacent cell. Both had been abducted as children. The alien beings had taken DNA samples from them, but apparently, with the exception of his Y chromosome, found his

D1S80 VNTR PCR BABEC 9/26/11 Student Guide 5
unsuitable. The DNA of the human female was used to engineer legions of human clones, with his Y chromosome having been used to make some of them male. These clones, according to his statement, were now living among Earth’s populations. They had been programmed by neural synaptic conditioning to exhibit strange behaviors designed to disrupt the delicate fabric of society. Following the collapse of civilization brought on by these infiltrators, the alien race would descend in a vast armada of starships to assume command of the planet and its populations. Hawthorne had followed up before on vague rumors of cloning experiments being performed by aliens. But there was never anything concrete. Nothing had ever come of any of these investigations. Despite his firm conviction that a sinister plot was being hatched by extraterrestrials attempting to gain control of Earth, Beverly, had always managed to come up with some explanation less terrifying, more mundane, to dismiss away case after case of missing persons or abduction. He gazed at the manila folder and contemplated what he’d read. When the idea came, it hit him like a sudden attack of vertigo. He dialed a number he knew by heart and let it ring. He knew she’d answer. “Davis!” he said, hearing the receiver finally lift on the other end and not waiting for a response. Beverly wasn’t a ‘morning person’. An inflection in her voice betrayed her disbelief not only that anyone was awake and functioning at that hour but that they also had the temerity to call her at such an early hour. Her words were slow. Groggy. “Colonel Hawthorne? Brian? Do you know what time it is?” “This is it, Davis.” “What’s it?” “I know how they’re doing it. They’re populating the Earth with clones. Hundreds, thousands of them.” “Who is?” “Aliens, Davis.” “Brian, what do you mean? Human clones would be like identical maternal twins. They’d all look exactly alike. If clones were among us in such vast numbers, wouldn’t we notice it? Everyone looks different from everyone else.” “Davis, how many genes in the human genome?” “Maybe as many as 31,000 or so. Why?” “How many genes actually contribute to physical appearance?” “I’m not sure that’s known with any degree of certainty. Eye color, hair color, skin color, height. Only a small percentage I imagine. We’re all pretty much alike under the skin. Think of all the genes that are responsible for making us exactly the same. There would be far more of them. We’re all humans, we all share those genes that make us human.” “Exactly,” said Hawthorne. “So all they would have to do is alter a small number of genes to disguise the fact that they’re actually clones.” “I don’t know,” Beverly replied. “Whose DNA are they using to construct these clones?” “My daughter’s.” Beverly did not respond. Sometimes Hawthorne’s behavior concerned her. This was looking to be one of those times.

D1S80 VNTR PCR BABEC 9/26/11 Student Guide 6
“Can’t we test this somehow?” Hawthorne continued. Beverly, still trying to reach a level of full consciousness, thought for a moment. “The human diploid genome is made up of 6 billion base pairs,” she finally replied. “Only about 3% of it is used to actually encode genes that make proteins. If they were only manipulating certain genes, those that code for the proteins involved in physical appearance, then they might leave the noncoding sequences alone.” “Exactly!” “VNTR’s. We could look at VNTRs.” “VNTR’s?” Hawthorne asked. “Variable Number of Tandem Repeats... sequences usually present towards the ends of chromosomes in noncoding regions. VNTRs are regions in which a small section, or unit, of DNA, 6 to 80 base pairs in length, is repeated in a tandem configuration. Each person has a different number of repeats. That number of repeats is inherited in a stable manner from your parents. Take the D1S80 VNTR on chromosome 1 as an example. For the D1S80 site (or locus), a 16 base pair unit is repeated in tandem anywhere from 14 to 41 times. Different forms of the same locus are called alleles. The sizes of different alleles, and therefore the number of repeats for any individual, can be determined on an agarose gel after PCR amplification.” Beverly could always explain technical concepts more easily with visual embellishments. She grabbed a notepad from the bedstand and jotted down a cartoon of the process. It would help her think even though Colonel Hawthorne couldn’t benefit from the drawings.
“D1S80 is a very polymorphic locus,” Beverly continued.

D1S80 VNTR PCR BABEC 9/26/11 Student Guide 7
“Don’t bury me in jargon, Davis,” Hawthorne interrupted. “You know I hate that. What’s your point?” “Each person has 23 pairs of chromosomes, 46 chromosome in all. Your Mom gave you 23, your Dad gave you 23. Let’s say that your Mom has 14 repeats at the D1S80 locus on one of her chromosome 1’s and 31 repeats on the other. You would inherit one of those. One of your chromosome 1’s, therefore, would contain either 14 or 31 repeats at the D1S80 locus. Your father might, most probably, have different alleles of D1S80... let’s say he has 17 repeats on one chromosome 1 and 27 repeats on the other. You would inherit one of those. The chromosome 1 inherited from your father will contain either 17 or 27 repeats at the D1S80 locus.” “What are you getting at?” “If clones of your daughter Marion are in the population, we can test individuals for the number of repeats at the D1S80 locus. If their genotype is the same as your daughter’s, then you might have an argument.” “How do we start?” “We need Marion’s DNA.” “Davis, how would I possibly have any of Marion’s DNA?” “Do you have any hair from her? Any tissue?” “Davis, I didn’t keep her tonsils after she had them out.” “What about teeth? Baby teeth? Didn’t you play the Tooth Fairy? Did you save the teeth?” “That’s it!” Armed Forces Institute of Pathology, DNA ID Laboratory, Washington, DC August 28, 1997 Beverly still couldn’t believe it. But she had the data. “Brian, you better get over here,” she exclaimed when she finally reached him on the phone. “What have you got?” “Just get over here.” Hawthorne took the quick cab ride from the Pentagon to the Army DNA Identification Lab across town. Beverly was waiting. “What is it?” Hawthorne asked, breathless from having run up two flights of stairs. “I did a D1S80 PCR amplification of the DNA I was able to isolate from your daughter’s baby teeth. I typed her as an 18, 24... she has 18 repeats and 24 repeats.” “And?” “Well, I also typed some 500 different DNAs I obtained from blood samples that had been stored before or at about the time of your daughter’s disappearance. It turns out that an 18, 24 type was extremely rare.” “What do you mean was extremely rare?”

D1S80 VNTR PCR BABEC 9/26/11 Student Guide 8
“Brian, given the time of Marion’s disappearance, if clones were generated from her DNA and placed on this planet, those beings would appear to be anywhere from 13 to 17 years old. I typed samples of DNA from 50 individuals in this age group. An 18, 24 isn’t so rare anymore.” “I knew it!” Hawthorne said. But he didn’t feel triumphant or vindicated. He moved to the window, stared at the far horizon, and considered the implications. “Brian,” Beverly broke the silence. “Maybe something is wrong with the data. There’s got to be a logical explanation. I mean there has to be. The Hardy-Weinberg law states that gene frequencies should be in equilibrium, they should not change, in a large population. Besides, we don’t have a sample size large enough to draw any firm conclusions. We’ve got to get more data before we dare go to anyone with this. What if we could find a way to test the D1S80 type of hundreds of high school students? Maybe as part of a training program to teach PCR to teenagers.” “Davis, I’m shocked. That’s kinda devious. It’s a side of you I’ve never seen before. I like it. But we can’t ask high school students to yank out their teeth or to stab themselves with needles to get blood. That’s painful. Parents would get suspicious.” “I’ve got a procedure that won’t hurt a bit.”

D1S80 VNTR PCR BABEC 9/26/11 Student Guide 9
The Polymerase Chain Reaction Objectives:
1. You should be able to list and explain the importance of each component of PCR. 2. You should be able to associate the temperature changes with the cycling steps of PCR.
The polymerase chain reaction (PCR) is a method used by scientists to rapidly copy, in a test tube, specific segments of DNA. By mimicking some of the DNA replication strategies employed by living cells, PCR has the capacity for churning out millions of copies of a particular DNA region. It has found use in forensic science, in the diagnosis of genetic disease, and in the cloning of rare genes. One of the reasons PCR has become such a popular technique is that it doesn’t require much starting material. It can be used to amplify DNA recovered from a plucked hair, from a small spot of blood, or from the back of a licked postage stamp. There are some essential reaction components and conditions needed to amplify DNA by PCR. First and foremost, it is necessary to have a sample of DNA containing the segment you wish to amplify. This DNA is called the template because it provides the pattern of base sequence to be duplicated during the PCR process. Along with template DNA, PCR requires two short single-stranded pieces of DNA called primers. These are usually about 20 bases in length and are complementary to opposite strands of the template at the ends of the target DNA segment being amplified. Primers attach (anneal) to their complementary sites on the template and are used as initiation sites for synthesis of new DNA strands. Deoxynucleotides containing the bases A, C, G, and T are also added to the reaction. The enzyme DNA polymerase binds to one end of each annealed primer and strings the deoxynucleotides together to form new DNA chains complementary to the template. The DNA polymerase enzyme absolutely requires the metal ion magnesium (Mg++) for its activity. It is supplied to the reaction in the form of MgCl2 salt. A buffer is used to maintain an optimal pH level. PCR is accomplished by cycling a reaction through several temperature steps. In the first step, the two strands of the template DNA molecule are separated, or denatured, by exposure to a high temperature (usually 94° to 96°C). Once in a single-stranded form, the bases of the template DNA are exposed and are free to interact with the primers. In the second step of PCR, called annealing, the reaction is brought down to a temperature usually between 37˚C to 55 ˚C. At this lower temperature, stable hydrogen bonds can form between the complementary bases of the primers and template. Although human genomic DNA is billions of base pairs in length, the primers require only seconds to locate and anneal to their complementary sites. In the third step of PCR, called extension, the reaction temperature is raised to an intermediate level (65˚C to 72˚C). During this step, the DNA polymerase starts adding nucleotides to the ends of the annealed primers. These three phases are repeated over and over again, doubling the number of DNA molecules with each cycle. After 25 to 40 cycles, millions of copies of DNA are produced. The PCR process taken through four cycles is illustrated on the following page (Figure 1). In the following laboratory exercise, you will use PCR to amplify a VNTR region designated D1S80 using your own DNA as template. You will then use polyacrylamide gel electrophoresis and linear regression to determine the alleles you carry at this locus.

D1S80 VNTR PCR BABEC 9/26/11 Student Guide 10
Illustration of the Polymerase Chain Reaction Figure 1. The first four cycles of the polymerase chain reaction.
First Cycle of PCR
Second Cycle of PCR
Third Cycle of PCR
Fourth Cycle of PCR
An excellent animated tutorial showing the steps of PCR is available at the DNA Learning Center web site. http://www.dnalc.org/ddnalc/resources/pcr.html Note: You will need Macromedia Flash plug-in to view this on-line and to download the animation files to you computer.
D1S80 VNTR PCR BABEC 9/26/11 Student Guide 11
Laboratory Exercise The protocol outlined below describes a procedure for isolating DNA from cheek cells. In the first step, you will rinse your mouth with a salt solution. This step typically dislodges hundreds of cells from the cheek epithelium. An aliquot of the mouthwash solution is centrifuged to collect the dislodged cells, which are then resuspended in a small volume of saline. The resuspended cells are then added to a solution of Chelex® to remove any metal ions (such as magnesium) which might promote degradation of your genomic DNA. Magnesium (and other metal ions) can act as cofactor for DNA-degrading nucleases present in saliva and the environment. The Chelex®/cell sample is boiled to break open the cells. Since the sample is heated at a high temperature, the DNA, following this step, will be in a single-stranded form. The sample is then centrifuged briefly to collect the Chelex® and an aliquot of the supernatant is used for PCR. Objectives:
1. You should be able to successfully isolate DNA from cheek cells. 2. You should be able to prepare a PCR amplification reaction for the D1S80 VNTR locus.
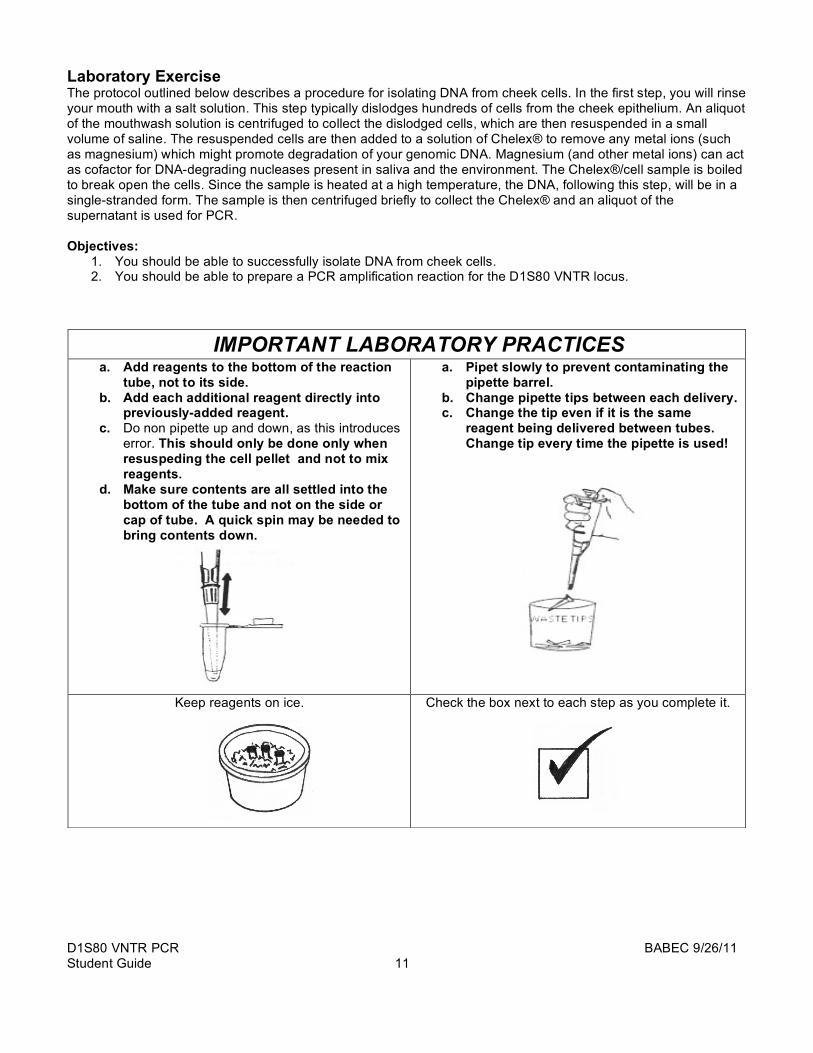
IMPORTANT LABORATORY PRACTICES a. Add reagents to the bottom of the reaction
tube, not to its side. b. Add each additional reagent directly into
previously-added reagent. c. Do non pipette up and down, as this introduces
error. This should only be done only when resuspeding the cell pellet and not to mix reagents.
d. Make sure contents are all settled into the bottom of the tube and not on the side or cap of tube. A quick spin may be needed to bring contents down.
a. Pipet slowly to prevent contaminating the pipette barrel.
b. Change pipette tips between each delivery. c. Change the tip even if it is the same
reagent being delivered between tubes. Change tip every time the pipette is used!
Keep reagents on ice.
Check the box next to each step as you complete it.

D1S80 VNTR PCR BABEC 9/26/11 Student Guide 12
* Place a check mark in the box of each step as it is completed.
DNA Preparation Using a Saline Mouthwash 1. Vigorously swirl 10 ml of saline solution in your
mouth for 30 seconds. Note: The saline solution is a 0.9% NaCl solution, the salt concentration of your blood plasma.
2. Expel saline into a cup and swirl to mix the cells.
3. Label a 1.5 ml microfuge tube with your PIN. Note: A PIN (personal identification number) can be any combination of 2-3 numbers or letters that can uniquely identify you.
4. Transfer 1000 µl to 1500 µl (1 ml to 1.5 ml)
of the saline/cell suspension into the labeled microfuge tube
5. In a microcentrifuge, spin your saline cell
suspension for 1 minute to pellet the cells. Be sure to use another student’s sample as a balance.
Note: Centrifuge speed should be set to 10,000 x g (≈10,000 rpm).
1 - 1.5 ml saline

D1S80 VNTR PCR BABEC 9/26/11 Student Guide 13
6. Observe your cell pellet at the bottom of the tube. If you do not have one, you may need to start over with another 1-1.5ml saline rinse. Pour off the supernatant into your cup, being careful NOT to lose your cell pellet. Note: There will be about 100µl of saline remaining in the tube after you pour.
7. Check to make sure you can see your cell pellet
and that there is about 100µl of saline covering it. you may need to add more saline to get up to about 100µl.
Rack or flick tube to mix, which will “resuspend”
the cells and make an evenly mixed solution. Note: You can also “rack” your sample. Be sure the top of the tube is closed, hold tube firmly at the top, and pull it across a microfuge rack 2-3 times.
8. Obtain a tube of Chelex from your instructor.
Label with your PIN.
9. Withdraw 50 µl of your cell suspension from step 7 and add it to the tube containing Chelex.
Note: Do not pipet up and down at this step or else you will clog the tip with Chelex beads.
10. Heat block version: If your Chelex (with the cell
suspension) is in a normal 1.5 ml microfuge tube, take your tube to a heat block station. Slide a cap-lock onto the tube lid and place it in the heat block for 10 minutes. Keep track of your tube in the heat block
Resuspend cells in ≈100µl saline
50 µl
50 µl cells
D1S80 VNTR PCR BABEC 9/26/11 Student Guide 14
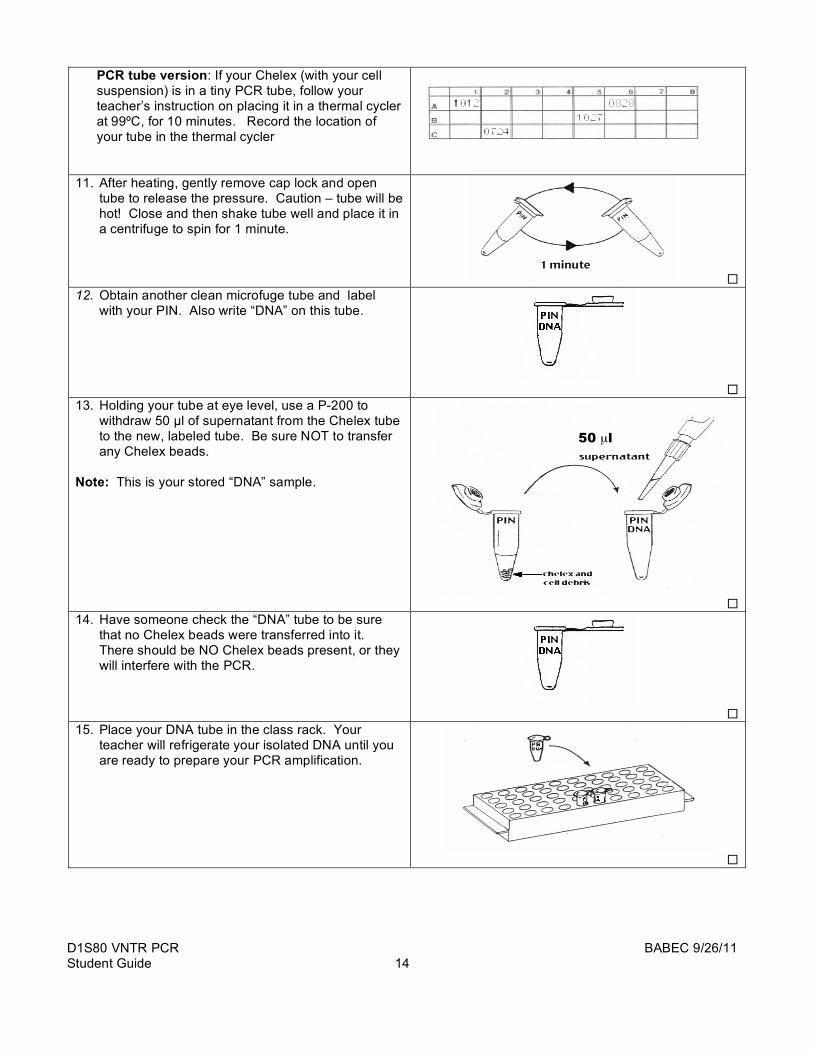
PCR tube version: If your Chelex (with your cell suspension) is in a tiny PCR tube, follow your teacher’s instruction on placing it in a thermal cycler at 99ºC, for 10 minutes. Record the location of your tube in the thermal cycler
11. After heating, gently remove cap lock and open
tube to release the pressure. Caution – tube will be hot! Close and then shake tube well and place it in a centrifuge to spin for 1 minute.
12. Obtain another clean microfuge tube and label
with your PIN. Also write “DNA” on this tube.
13. Holding your tube at eye level, use a P-200 to withdraw 50 µl of supernatant from the Chelex tube to the new, labeled tube. Be sure NOT to transfer any Chelex beads.
Note: This is your stored “DNA” sample.
14. Have someone check the “DNA” tube to be sure
that no Chelex beads were transferred into it. There should be NO Chelex beads present, or they will interfere with the PCR.
15. Place your DNA tube in the class rack. Your teacher will refrigerate your isolated DNA until you are ready to prepare your PCR amplification.
50 µl

D1S80 VNTR PCR BABEC 9/26/11 Student Guide 15
Polymerase Chain Reaction 1. Obtain a tiny PCR tube. Label it with your voucher
number, just under the lip. Note: Keep your PCR tube on ice when setting up the reaction.
2. Pipet 20 µl of Master Mix into your PCR tube. Note: It is critical that the Master Mix stays on ice before and during use.
3. Change your pipet tip and add 20 µl of Primer Mix into your PCR tube.
Note: It is critical that the Primer Mix stays on ice before and during use.
4. With a new pipet tip, add 10 µl of your extracted DNA into your PCR tube. What is the total volume in your tube? ___ µl.
Note: Make sure that all the liquids are settled into the bottom of the tube and not on the side of the tube or in the cap. If not, you can give the tube a quick spin in the centrifuge. Do not pipette up and down, it introduces error.
10 µl of DNA
5. Setting up the controls: a) Two students will be asked to set up the positive control reactions for the class. They will use the positive control DNA provided in the kit. There should be enough PCR sample for one lane on each gel. b) Another two students will set up negative control reactions for the whole class. They will use sterile water. There should be enough PCR sample for one lane on each gel.
Control Master
Mix Primer
mix DNA
+ 20 µl 20 µl 10 µl +C DNA
- 20 µl 20 µl 10 µl sterile H20
6. Check the volume of your PCR tube by comparing
it to a reference PCR tube with 50 µl in it. It should be near the thermal cycler, set by your teacher.
Note: If the volume of your tube does not match, see your instructor to troubleshoot. You may need to set up the reaction again.
20 µl of Master Mix
20 µl of Primer Mix
50
PCR Tube Reference Tube

D1S80 VNTR PCR BABEC 9/26/11 Student Guide 16
7. Place your reaction into the thermal cycler and record the location of your tube on the grid provided by your teacher.
1 2 3 4 5 6 7 A 1123 0828
B 1027
C 6777 9305
1. The cycling protocol for amplification of this VNTR site is:
95°C—10 minutes 95°C—15 seconds 65°C—30 seconds 32 cycles 72°C—40 minutes
72°C—10 minutes 4°C—hold, ∞ infinity
D1S80 VNTR PCR BABEC 9/26/11 Student Guide 17
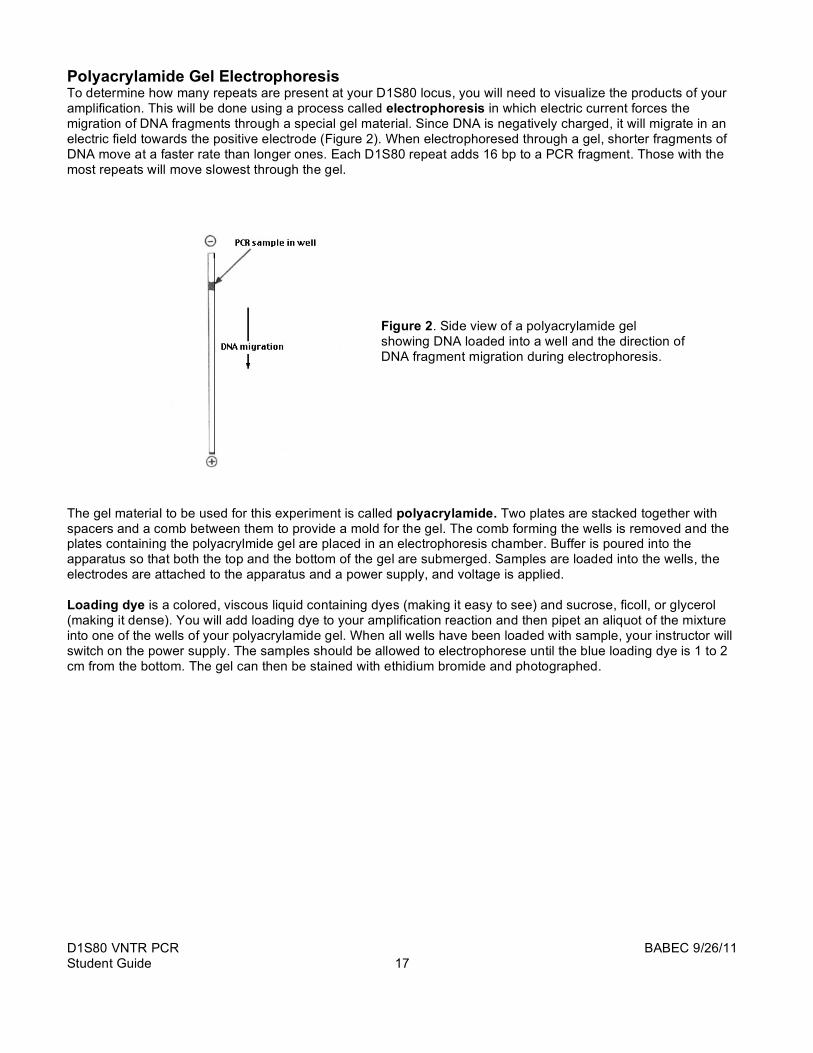
Polyacrylamide Gel Electrophoresis To determine how many repeats are present at your D1S80 locus, you will need to visualize the products of your amplification. This will be done using a process called electrophoresis in which electric current forces the migration of DNA fragments through a special gel material. Since DNA is negatively charged, it will migrate in an electric field towards the positive electrode (Figure 2). When electrophoresed through a gel, shorter fragments of DNA move at a faster rate than longer ones. Each D1S80 repeat adds 16 bp to a PCR fragment. Those with the most repeats will move slowest through the gel.
Figure 2. Side view of a polyacrylamide gel showing DNA loaded into a well and the direction of DNA fragment migration during electrophoresis.
The gel material to be used for this experiment is called polyacrylamide. Two plates are stacked together with spacers and a comb between them to provide a mold for the gel. The comb forming the wells is removed and the plates containing the polyacrylmide gel are placed in an electrophoresis chamber. Buffer is poured into the apparatus so that both the top and the bottom of the gel are submerged. Samples are loaded into the wells, the electrodes are attached to the apparatus and a power supply, and voltage is applied. Loading dye is a colored, viscous liquid containing dyes (making it easy to see) and sucrose, ficoll, or glycerol (making it dense). You will add loading dye to your amplification reaction and then pipet an aliquot of the mixture into one of the wells of your polyacrylamide gel. When all wells have been loaded with sample, your instructor will switch on the power supply. The samples should be allowed to electrophorese until the blue loading dye is 1 to 2 cm from the bottom. The gel can then be stained with ethidium bromide and photographed.

D1S80 VNTR PCR BABEC 9/26/11 Student Guide 18
Polyacrylamide Gel Electrophoresis 1. Retrieve your PCR tube and spin it briefly to bring
the liquid to the bottom of the reaction tube. Make sure the centrifuge is balanced before you begin spinning your sample and that you are using a tube adapter if needed!
2. To your D1S80 PCR sample, add 5 µL of loading dye. Be sure to slowly pipet up and down a few times to thoroughly mix the dye with the DNA.
3. Wearing gloves, remove the gel cassette from the plastic pouch. Rinse the gel cassette with water and dry with a paper towel. Peel off the tape from the bottom of the front plate to expose the small strip of polyacrylamide gel.
Note: Tracing the outline of the comb on the longer gel plate with a permanent marker can help make the wells more visible when the comb is removed.
4. Press up with both thumbs on the ridge of the gel comb to slowly and evenly remove the comb.
5. Loosen the black screw clamps on the gel rig and push the black braces towards the center. Insert the gel cassette with the taller plate facing you and the shorter plate facing the back of the gel assembly. Tighten the clamps.
Note: If you tighten the clamps too much you may break the plates. If you don't tighten the clamps enough, the buffer may leak out in the next step.

D1S80 VNTR PCR BABEC 9/26/11 Student Guide 19
6. Add 100 mL of 1X TBE buffer into the upper chamber. This amount should just cover the shorter, back plate. Check for buffer leakage before proceeding to the next step.
Note: If you see buffer leaking out of the upper chamber, disassemble the apparatus, dry the gasket and gel plates, and try steps 5 and 6 again.
7. Now fill the lower buffer chamber to the “Fill line” with about 125 mL of 1X TBE buffer. The buffer level should cover the exposed gel, from where you removed the tape
8. Using a transfer pipet, rinse out the wells of the gel to remove any pieces of polyacrylamide or bubbles that may be trapped.
9. Load 5 µL of the 50 bp ladder in the third lane from the left and 20 µL of your PCR sample in another lane. Make sure to keep a record of what is loaded in each lane on your gel.
10. Place the lid on the gel assembly, plug the leads into the power supply, and apply 250 Volts. Make sure that small bubbles are coming off of the electrodes in the buffer. Run the gel for 35 minutes, or until the xylene cyanol (turquoise dye) reaches the slot in the front plate that was exposed when you removed the tape in step 3. Watch for possible buffer leaks during the run.

D1S80 VNTR PCR BABEC 9/26/11 Student Guide 20
11. When electrophoresis is complete, turn off the power supply, remove the lid, and pour out the buffer into a container provided by your teacher.
12. Loosen the clamps and remove the gel cassette.
13. Pry open the plates of the gel cassette using a spatula, being very careful not to rip the gel in the process.
14. Your teacher will stain your gel for 15 minutes in 0.5 µg/mL ethidium bromide and then destain the gel for 5 minutes in water.
15. Place your gel on a UV transilluminator to view the DNA bands and to photograph your gel.

D1S80 VNTR PCR BABEC 9/26/11 Student Guide 21
Staining and Photographing Polyacrylamide Gels Your teacher will stain your polyacrylamide gel and take a photograph for you so that you may analyze your D1S80 amplification results. Gel staining is done as follows. 1. Place the polyacrylamide gel in a staining tray. 2. Pour enough ethidium bromide (0.5µg/ml) to cover the gel. Wait 15 minutes.
CAUTION: Ethidium bromide is a carcinogen. Always wear gloves and safety glasses when handling. 3. Pour the ethidium bromide solution back into its storage bottle. Pour enough water into the staining tray to
cover the gel. Wait 5 minutes. 4. Pour the water out of the staining tray into a hazardous waste container and place the stained gel on a UV light
box. CAUTION: Ultraviolet light can damage your eyes and skin. Always wear protective clothing and UV safety glasses when using a UV light box.
5. Place the camera over the gel and take a photograph.
Figure 3. Ethidium bromide molecules stacked between DNA base pairs.
The PCR products run on your polyacrylamide gel are invisible to the naked eye. If you look at your gel in normal room light, you will not be able to see the amplified products of your reaction. In order to “see” them, we must stain the gel with a fluorescent dye called ethidium bromide. Molecules of ethidium bromide are flat and can nestle between adjacent base pairs of double stranded DNA (Figure 3). When this interaction occurs, they take on a more ordered and regular configuration causing them to fluoresce under ultraviolet light (UV). Exposing the gel to UV light after staining, allows you to see bright, pinkish-orange bands where there is DNA (Figure 4).
Figure 4. After staining a polyacrylamide gel with ethidium bromide, DNA bands are visible upon exposure to UV light.
D1S80 VNTR PCR BABEC 9/26/11 Student Guide 22
Using Linear Regression to Calculate D1S80 Alleles Sizes In this part of the laboratory exercise, you will be introduced to the mathematical technique called linear regression. Scientists use linear regression to derive a best-fit straight line and its corresponding equation. In this case, the relationship to which linear regression will be applied is that between molecular weight marker DNA fragment length and the migration distance of those fragments through a polyacrylamide gel. Once the equation for the best-fit line is determined, you will use it to calculate the lengths of your D1S80 alleles. Important terms you will encounter during this section of the protocol include exponent, log, slope, and correlation coefficient. These terms are reviewed here. An exponent is a number written above and to the right of another number, called the base, indicating the power to which the base is to be raised.
Examples: base exponent
a) 102 = 10 X 10 = 100
b) 101 = 10 c) 103 = 10 X 10 X 10 = 1000 d) 100 = 1
The logarithm (or log) of a number in base 10 is the exponent to which 10 must be raised in order to get that number. Examples:
1. Log 100 = 2, because 100 = 10 X 10 = 102. 2. Log 1000 = 3, because 1000 = 103. 3. Log 10 = 1, because 10 = 101. 4. Log 1 = 0, because 100 = 1. 5. Log 20 = 1.3, because 101.3= 20
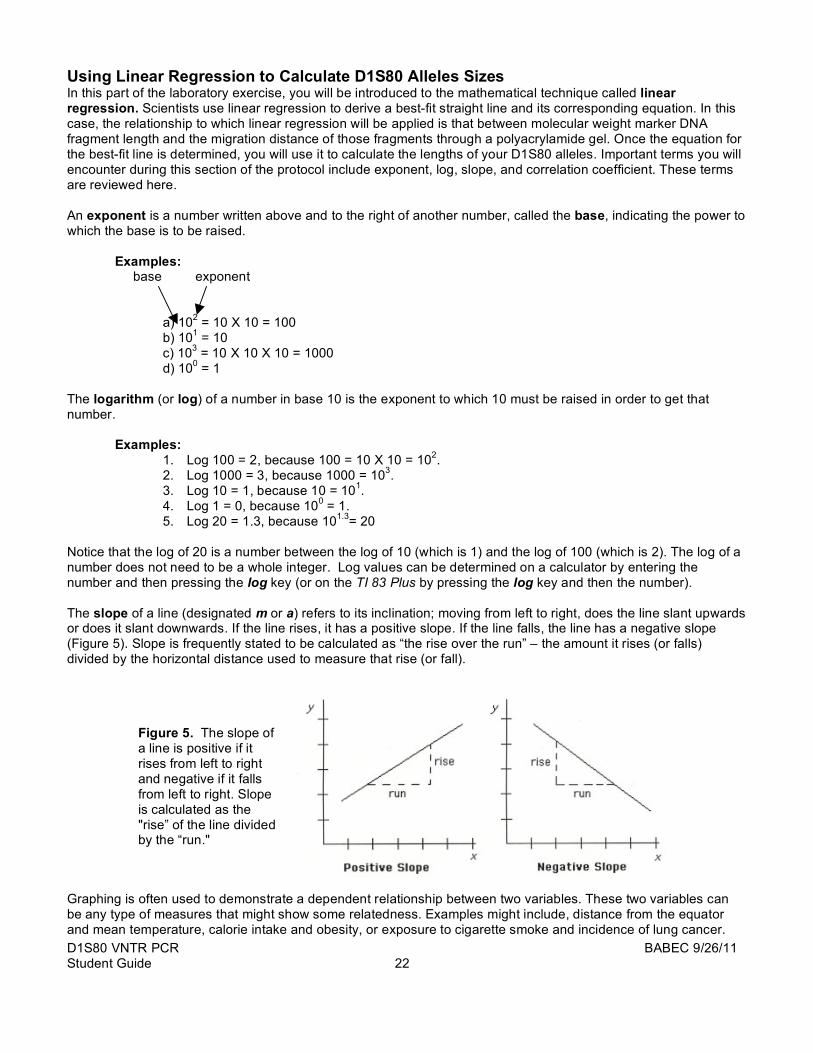
Notice that the log of 20 is a number between the log of 10 (which is 1) and the log of 100 (which is 2). The log of a number does not need to be a whole integer. Log values can be determined on a calculator by entering the number and then pressing the log key (or on the TI 83 Plus by pressing the log key and then the number). The slope of a line (designated m or a) refers to its inclination; moving from left to right, does the line slant upwards or does it slant downwards. If the line rises, it has a positive slope. If the line falls, the line has a negative slope (Figure 5). Slope is frequently stated to be calculated as “the rise over the run” – the amount it rises (or falls) divided by the horizontal distance used to measure that rise (or fall).
Figure 5. The slope of a line is positive if it rises from left to right and negative if it falls from left to right. Slope is calculated as the "rise” of the line divided by the “run."
Graphing is often used to demonstrate a dependent relationship between two variables. These two variables can be any type of measures that might show some relatedness. Examples might include, distance from the equator and mean temperature, calorie intake and obesity, or exposure to cigarette smoke and incidence of lung cancer.

D1S80 VNTR PCR BABEC 9/26/11 Student Guide 23
The scientist will then draw a straight line (a "line of best fit" or regression line) through, or close to, as many points as possible to see if a linear relationship can be demonstrated between the two variables. Although it is possible to do this “by eye,” computer programs exist that make this a much easier and more accurate task. The degree to which a regression line represents the data is given by the correlation coefficient (expressed either as r or R2); it is a measure of how closely the points on a graph align with the line of best fit. The correlation coefficient will have the same sign (positive or negative) as the slope of the regression line. The value of r will always fall between –1 and +1. If all the points lay exactly on the regression line and the line slopes upward, r will have a value of +1. If all the points fit exactly on the regression line and the line slopes downward, r will have a value of –1. The closer the r value is to 1 or -1, the better is the correlation between the points on the graph and the line of best fit. Figure 6 shows the how the correlation coefficient relates to the regression line.
Figure 6. The correlation coefficient (r) is a measure of how well points on a graph align along a regression line (line of best fit).
Gel electrophoresis is a method for separating DNA fragments by their size. For most applications in molecular biology and biotechnology, the gel material used for the separation of DNA fragments is either agarose or polyacrylamide. This experiment uses a polyacrylamide gel because it has greater resolving power than agarose; on a polyacrylamide gel, you can more easily discern the difference between two DNA fragments of very similar size. This is important for this experiment because fragments may differ in size by as little as 16 base pairs. In both types of electrophoresis, shorter DNA fragments run farther than larger fragments. The rate at which a DNA fragment migrates through the gel is related to the log of the fragment’s length in base pairs. This relationship between fragment size and migration rate means, in practical terms, smaller fragments resolve better on a gel than larger fragments (see Figure 7). Figure 7. A gel photo showing smaller DNA fragments resolving better on an agarose gel than larger DNA fragments.

D1S80 VNTR PCR BABEC 9/26/11 Student Guide 24
Gel electrophoresis is frequently used to determine the sizes of fragments generated in a PCR amplification. When you electrophorese PCR products on a gel, at least one lane will be used to run a DNA molecular weight marker. Following electrophoresis, gel staining and photography, a ruler is used with the gel photograph to measure the distance each DNA fragment of the molecular weight marker migrated from the well. If the migration distance is plotted on the x- axis and fragment size (measured in bp) is plotted on the y -axis, a curve similar to that in Figure 8 will be generated. This plot is called a standard curve.
Figure 8. A standard curve generated by plotting DNA fragment migration distance on the horizontal (x) axis against fragment size on the vertical (y) axis.
The length of a DNA fragment of unknown size can be determined using the plot of the standard curve. For this technique, you would first use your ruler to measure the distance the unknown fragment traveled from the well. On the graph of the standard curve, a vertical line is then drawn up to the curve from the corresponding migration distance position on the x- axis. A horizontal line from this intersection point is then drawn to the y -axis to reveal the fragment’s length (Figure 9).
Figure 9. The size of a DNA fragment of an unknown length can be determined using a standard curve.
Since the D1S80 repeat unit is 16 base pairs in length, the alleles of the D1S80 VNTR differ in size from each other by only 16 base pairs. For example, if a person has 17 repeats on one chromosome and 18 repeats on the other, PCR fragments 417�bp and 433�bp in length will be generated. You could get a rough estimate of PCR fragment size for D1S80 by a purely graphical approach as described above. However, enough error would be introduced during the graphing process that an accurate calling of fragment size would be difficult. You will use the strictly mathematical approach of linear regression to determine the fragment sizes for your D1S80 alleles. By plotting the log of fragment length for each band of the molecular weight marker against the distance traveled, a straight line should be produced (Figure 10). To calculate the fragment sizes of the D1S80 alleles in this exercise, you will use the equation for the regression line that would be generated by plotting the distance each band of the molecular weight marker traveled against the corresponding log of fragment length. Therefore, following gel electrophoresis, staining, and photography, you will measure the distance each band of the molecular weight marker has traveled. Using a graphing calculator or Microsoft Excel on a computer, you will determine the equation

D1S80 VNTR PCR BABEC 9/26/11 Student Guide 25
for the regression line that describes the standard curve. Next, you will plug the migration distance for each band from your amplification into the regression line equation to determine your allele size(s).
Figure 10. A straight line generated by plotting the log of the size of each fragment in the molecular weight marker against the distance each fragment traveled.
A representation of a polyacrylamide gel containing D1S80 amplification samples is shown in Figure 11. Lane 1 shows the 50 base pair ladder, which serves as a size standard. Each band in the ladder differs from the bands on either side of it by 50 bp. The ladder you will use contains bands ranging in length from 50 - 800 bp and one band at 2,652 bp in length. The bands corresponding to the 350 bp and 800 bp fragments are more concentrated than the others and stain with greater intensity. Bands smaller than 300 bp might be run off the gel to allow for adequate resolution of the D1S80 alleles (which range in size from 369 to 801 bp). Lanes 2 through 7 represent amplified samples. Lanes 2 and 4 show heterozygous individuals for the D1S80 locus. Lanes 3 and 5 show a single band representing homozygous individuals. Lane 6 contains the positive control (also heterozygous), while in lane 7 no bands should be seen since it contains the negative control in which no template DNA was added. Some samples may not amplify for any number of reasons but usually is the result of some human error.
Figure 11. Representation of a polyacrylamide gel after electrophoresis of D1S80 amplification products. Lane 1 contains the 50 bp ladder, while lanes 2-7 contain PCR reactions. Lane 6 contains the positive control while lane 7 contains the negative control.

D1S80 VNTR PCR BABEC 9/26/11 Student Guide 26
Results Objectives:
1. You should be able to examine a gel of your PCR products and determine which bands represent D1S80 alleles, which bands represent PCR artifacts, and explain how PCR artifacts can arise. 2. You should be able to determine the sizes of your PCR products using linear regression 3. You should be able to calculate your D1S80 genotype frequency.
Tape a picture of your gel in the space below. Gel Observations: Do you see adequate separation of the bands in the 50 bp marker lane (can you resolve fragments up to 800 bp in length)? ____________________ Do you see bands within the expected size range for D1S80 amplification (369 bp to 801 bp)? (Yes or No) ________ Are there 1 or 2 discrete D1S80 bands? _________ Are there bands in the Negative Control lane? __________ Did the positive control sample amplify? ________

D1S80 VNTR PCR BABEC 9/26/11 Student Guide 27
Sizing D1S80 PCR fragments Once you have identified which bands represent the PCR products of your D1S80 locus, you will need to determine their lengths in base pairs. To do this, place a ruler on your gel photograph over the 50 bp ladder lane such that the top of the ruler lines up with the bottom of the well into which the sample was loaded (Figure 12). Measure the distance of each band from the well. The smallest fragment in the lane with the 50 bp ladder should be either 300 or 350 base pairs in length, depending on how long you ran the gel. Each band above this is greater in length by 50 bp. The 350 bp and 800 bp fragments stain more heavily than the others. Record the distance from the well (in cm) for each band of the 50 bp ladder in the table below.
Figure 12. D1S80 polyacrylamide gel photograph with ruler placed over 50 bp ladder marker lane to determine fragment sizes.

D1S80 VNTR PCR BABEC 9/26/11 Student Guide 28
In the table below, enter the distance each band in the 50 bp ladder traveled from the well. If using a calculator for this exercise, determine the log of each fragment size for the 50 bp ladder. To do this on the TI-83 Plus calculator, press the “LOG” key, enter the size of the fragment in bp, and press the “ENTER” key. On other calculators, enter the bp size and then press the “log” key. Enter the log values into the table below. If you are using Microsoft Excel for this exercise, you will perform this step in a spreadsheet later in this protocol.
Fragment Size
Log of Fragment
Size
Distance from Well (in
cm) 800 750 700 650 600 550 500 450 400 350 300
The equation for the regression line describing the standard curve has the following general formula: y = ax + b where y = the log of the fragment size a = the slope of the line x = the distance from the well (in cm) b = the point where the regression line intercepts the y axis To calculate the linear regression equation on the Texas Instruments TI-83 Plus calculator, perform the following steps.

D1S80 VNTR PCR BABEC 9/26/11 Student Guide 29
Calculating Linear Regression on the TI-83 Plus Calculator 1. Turn on the calculator and press STAT to bring up
the “EDIT CALC TESTS” menu. The cursor should be on “1: Edit…”.
2. Press the ENTER key to bring up the list field.
3. Move the cursor onto the list name (“L1”), then
press 2nd [INS]. The cursor will blink on the letter “A” at the bottom of the screen. Use the keypad (letters appear in green above each key) to type “LOGBP” (for log base pair) and then press the ENTER key.
4. Move the cursor over to the next column heading
on the right.
5. Press 2nd [INS] to insert a new column to be
named. As in step 3, use the letter keys to type in “CM” (for centimeters) then press ENTER.

D1S80 VNTR PCR BABEC 9/26/11 Student Guide 30
6. Use the arrow keys to move the cursor to the “LOGPB” list.
7. Enter the log values for each fragment of the 50 bp
ladder, starting with the 800 bp fragment, pressing the ENTER key after each entry. When you have entered all the log values for the 50 bp ladder, move the cursor to the “CM” column. Enter the distance each fragment of the 50 bp ladder traveled in this column starting with the 800 bp band. When the last value has been entered, press 2nd
[QUIT]. 8. Press STAT to bring up the "Edit Calc Tests"
menu. Select "Calc" and then “4: LinReg(ax+b)”.
9. Press ENTER. This will bring up the “LinReg(ax+b)
screen.
10. Press 2nd [LIST]. This will bring up the “NAMES OPS MATH” screen. Use the down arrow key to move the cursor to the “CM” list. The “CM” list represents the x axis for the standard curve.
11. Press ENTER. This will bring the “CM” list onto the
“LinReg(ax+b)" screen. Press the comma key ( , ). 12. Press 2nd [LIST]. This will bring up the
“NAMES OPS MATH” screen. Use the down arrow key to move the cursor to the “LOGBP” list.

D1S80 VNTR PCR BABEC 9/26/11 Student Guide 31
13. Press ENTER. This will add the LOGBP list (the y axis for the standard curve) to the “LinReg(ax+b) screen.
14. Press the ENTER key. The calculator will then display the “a” and “b” values for the equation describing the standard curve’s line of best fit. Write your “a” and “b” values in the spaces to the right.
The equation for line of best fit for the standard curve in this experiment is:

D1S80 VNTR PCR BABEC 9/26/11 Student Guide 32
Using Microsoft Excel to Calculate Linear Regression Most computers, whether PC or Macintosh, are equipped with the very popular Microsoft Office software. Included in this package is Excel, a program designed primarily for financial and inventory applications that require the use of spreadsheets to track and tally business transactions. Excel has the capability of calculating linear regression. To calculate the linear regression equation for the molecular weight standard on the gel containing your PCR sample, perform the following steps.
Linear Regression Using Microsoft Excel 1. Open up a new Microsoft Excel document by
clicking on its icon.
2. In column A, row 1, enter “bp.” In the rows below,
enter the size of each fragment of the 50 bp ladder, starting with the 800 bp fragment. In column B, row 1, enter “Distance (x).” In the rows below, enter the distance, in cm, each band in the 50 bp ladder traveled from the well. In column C, row 1, enter “log bp (y).”
3. Click on the first box under the “log bp (y)” heading to highlight it. Click the function icon (‘fx’) in the tool bar at the top of the screen. A “Paste Function” box will appear. Select “Math & Trig” from under the “Function category:” list. Select “LOG 10” from the “Function name:” list. Click “OK.”
4. Click anywhere within the “LOG 10” dialogue box that appears and drag it out onto the spreadsheet so that the column entries are visible. Click on 800 in box A2. “A2” should then appear in the “Number” box. Click “OK.” This will enter the log value of 800 in the highlighted box in the “log bp (y)” column. Highlight the entire C column from position “C2” to your last entry in the column. On the keyboard, enter “Control” and “D.” This will fill down all remaining log values in column C.

D1S80 VNTR PCR BABEC 9/26/11 Student Guide 33
5. Without selecting row 1 (the column title row) or column 1 (the “bp” column), highlight the values in the “Distance (x)” and “log bp (y)” columns.
6. From the menu bar, click on the Chart Wizard button to bring up the Chart Wizard-Chart type window. Select the “XY (Scatter)” chart type and then click “Finish.” A chart will appear over the spreadsheet showing points on a graph.
7. Pull down the “Chart” list from the top menu bar and select “Add Trendline.” In the new pop up window, make sure the “Linear Trend/Regression type” is selected.

D1S80 VNTR PCR BABEC 9/26/11 Student Guide 34
8. Click on the “Options” tab in the “Add Trendline” window. In the “Options” window that appears, check the boxes next to “Display equation on chart” and “Display r-squared value on chart.” When finished, click “OK” and the line of best fit will be drawn on the graph. You will also be given the regression line equation and the r-squared value. You can use “Chart Options…” under the “Chart” pull-down menu to label the chart axes and to attach a chart title.
Based on the R2 value, does the regression line closely fit the points on the graph? (See page 21) _____ Yes ______ No, because _________________________________________________________________
D1S80 VNTR PCR BABEC 9/26/11 Student Guide 35
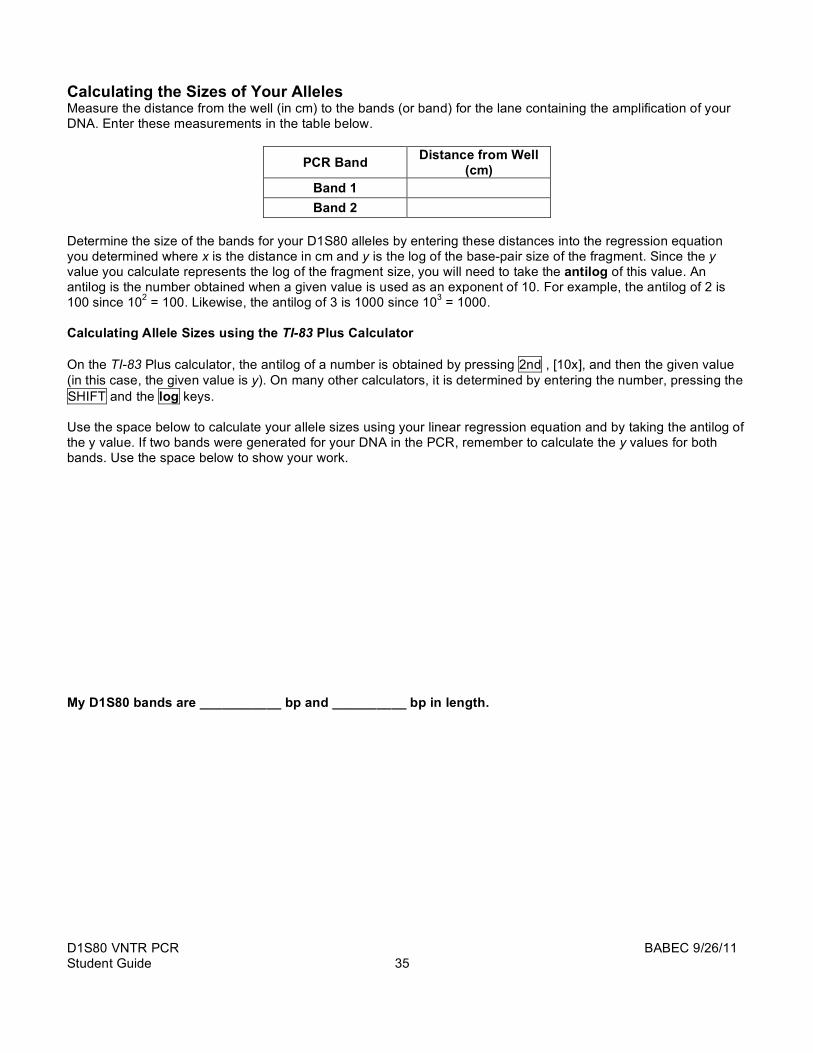
Calculating the Sizes of Your Alleles Measure the distance from the well (in cm) to the bands (or band) for the lane containing the amplification of your DNA. Enter these measurements in the table below.
PCR Band Distance from Well (cm)
Band 1 Band 2
Determine the size of the bands for your D1S80 alleles by entering these distances into the regression equation you determined where x is the distance in cm and y is the log of the base-pair size of the fragment. Since the y value you calculate represents the log of the fragment size, you will need to take the antilog of this value. An antilog is the number obtained when a given value is used as an exponent of 10. For example, the antilog of 2 is 100 since 102 = 100. Likewise, the antilog of 3 is 1000 since 103 = 1000. Calculating Allele Sizes using the TI-83 Plus Calculator On the TI-83 Plus calculator, the antilog of a number is obtained by pressing 2nd , [10x], and then the given value (in this case, the given value is y). On many other calculators, it is determined by entering the number, pressing the SHIFT and the log keys. Use the space below to calculate your allele sizes using your linear regression equation and by taking the antilog of the y value. If two bands were generated for your DNA in the PCR, remember to calculate the y values for both bands. Use the space below to show your work. My D1S80 bands are ___________ bp and __________ bp in length.

D1S80 VNTR PCR BABEC 9/26/11 Student Guide 36
Calculating Allele Sizes using Microsoft Excel The following steps can be used to calculate your allele sizes using Microsoft Excel.
1. In a new column on your worksheet, enter the gel migration distances for your PCR fragments. 2. Highlight an empty box adjacent to one of these measurement entries. 3. Click the function (“fx”) button in the tool bar. 4. In the “Paste Function” dialogue box that appears, select “Math & Trig” under “Function category:” and
“PRODUCT” under “Function name:.” Click the “OK” button. 5. In the Product Dialogue box that appears, enter your regression equation’s m value in the “Number 1” box
and the x value (distance in cm) for the band being examined in the “Number 2” box. Click the “OK” button. The product will be entered in the box you highlighted.
6. Highlight the box to the right of this new entry. 7. Click the function (“fx”) button in the tool bar. 8. In the “Paste Function” dialogue box, choose “Math & Trig” under “Function category:” and “SUM” under
“Function name:”. Click the “OK” button. 9. In the dialogue box that appears, enter the product you calculated in Step 5 above in the “Number 1” box.
Enter your regression equation’s b value in the “Number 2” box and click “OK.” The sum of the entered numbers will appear in the highlighted box.
If you have two bands in your PCR sample, repeat steps 2 through 9 for the other band. The number(s) you obtain by performing the above steps represents the y value for your regression equation. It is the log of the fragment size (log bp). To determine the size of the fragment in base pairs, you will need to take the antilog of this value. Follow the steps below. Calculating Antilog Values in Microsoft Excel
1. Highlight an empty box in a new column adjacent to the log value you calculated for one of your bands. 2. Click the function (“fx”) button in the tool bar. 3. In the “Paste Function” dialogue box that appears, choose “Math & Trig” under “Function category:” and
“POWER” under “Function name:”. Click the “OK” button. 4. In the dialogue box that appears, enter “10” in the “Number” box (since you are operating in base 10). In
the “Power” box, enter the log bp value you calculated above and click the “OK” button. 5. The size of the band will appear in the highlighted box.
My alleles are _________ bp and __________ bp in length.

D1S80 VNTR PCR BABEC 9/26/11 Student Guide 37
Determining the Number of Repeats in your Alleles The D1S80 repeat unit is 16 bp in length. The smallest allele for D1S80 has 14 repeats. Use the table below to determine how many repeat units are contained in your PCR fragments. The size that you extrapolated using linear regression should be within 8 bp of any particular allele.
Allele Size (in bp) Number of Repeats
369 14 385 15 401 16 417 17 433 18 449 19 465 20 481 21 497 22 513 23 529 24 545 25 561 26 577 27 593 28 609 29 625 30 641 31 657 32 673 33 689 34 705 35 721 36 737 37 753 38 769 39 785 40 801 41
Your type (or genotype) is then recorded as the repeat size. For example, if your alleles contain 17 and 35 repeats, your genotype is 17,35 (read “17 coma 35”). My type is…____, ____. Am I a clone of Marion Hawthorne? ______ Maybe ______ No

D1S80 VNTR PCR BABEC 9/26/11 Student Guide 38
Population Statistics Once you have determined your genetic type, it can be informative and of interest to determine how frequent that type is in the general population. This type of analysis requires the application of population statistics, which further requires an understanding of several important terms. Written below are the definitions of these terms. Below, draw a line between the definition on the left side of the page and the term on the right side of the page. A specific location or site on a chromosome allele One of several alternative forms of a gene heterozygous occupying a given site on a chromosome. locus chromosome A person who has the same form of a gene on both chromosomes. recessive genotype frequency A person who has different forms of a gene at genome a particular site on a chromosome pair. mutation genotype The proportion of the total number of forms of a gene represented by only one form. VNTR phenotype An organism’s particular combination of genes. recessive homozygous dominant The physical appearance of an organism that is dependent on its genetic makeup. allele frequency pedigree The proportion of the total represented by one genotype.

D1S80 VNTR PCR BABEC 9/26/11 Student Guide 39
Calculating Allele Frequencies Let’s say that a particular genetic site has 3 possible alleles, A, B, and C. In a random sampling of 200 individuals, each allele is present the following number of times: Allele Number of times found A 40 B 200 C 160 Total 400 With a sample size of 200 people, why are there a total of 400 alleles? The allele frequencies can then be calculated by dividing each number by 400: Allele Allele Frequency A 40/400 = _______ B 200/400 = _______ C 160/400 = _______ What is the sum of these frequencies? _______ Gregor Mendel, studying the garden pea in the 1860’s, pioneered the use of genetic crosses to study modes of inheritance. He found that some traits, such as those responsible for dictating a tall plant or for producing round seeds, are dominant; that is, they are observably expressed in the offspring. Some traits are recessive; in the presence of a dominant trait, they are not observably expressed in the offspring. Gregor Mendel demonstrated that a cross between plants heterozygous for the trait responsible for plant height yield plants that are tall and short in a ration of 3 to 1. Such a cross can be represented by a Punnett square in which the genotype for a heterozygous plant can be written at Tt, where “T” represents the dominant tall trait and “t” represents the recessive short pea plant trait:
Pollen T t
T
TT
Tt
Ovules
t
Tt
tt
From the cross of Tt x Tt, any offspring carrying the dominant T trait will be tall. The only short plants derived from this cross will be homozygous for the t trait. Hence, a 3:1 ratio is obtained. From his studies with crossing pea plants, Mendel derived the principle of segregation. Part of this principle states that new progeny are produced by the random combination of sperm and eggs (gametes) from the two parents and that there is no way in a particular mating, short of micro-manipulation and intervention by the experimenter, of determining which sperm will combine with which egg. Gregor Mendel studied crosses of individual organisms. But, many years later, it was realized by G.H. Hardy, a British mathematician, and W. Weinberg, a German physician, that the same principles that apply to individual crosses could be applied to crosses occurring within whole populations. They realized that random combination of gametes (as shown by Mendel to occur during a genetic cross) and random mating of individuals within an infinitely large population are equivalent concepts; both are matters of chance. Furthermore, this relationship can be represented by a Punnett square to calculate genotype frequencies. However, rather than a single cross between a mother and a father, Hardy and Weinberg looked at crosses between all mothers and all fathers in a population. To

D1S80 VNTR PCR BABEC 9/26/11 Student Guide 40
construct a Punnett square for an entire population, the alleles found in the population are written across the axes. A frequency (p and q) is attached to each allele and the allele frequencies are multiplied as shown in the example below. Let’s say that we have two alleles A and B. Let’s assign an allele frequency of p to A and q to B. In the Punnett square below, fill in the empty squares.
Fathers pA qB
pA
pApA
Mothers
qB
pAqB
The proportion of A homozygotes = p2. The proportion of A/B heterozygotes = __________. The proportion of B homozygotes = __________. What is the sum of all these frequencies?:
p2 + 2pq + q2 = _________.
This expression is often called the Hardy-Weinberg equation and represents the cornerstone of population statistics. It allows you to use allele frequencies to calculate genotype frequencies.
A three-allele system can be examined in a similar manner. Let’s suppose that we have alleles A, B, and C with allele frequencies p, q, and r, respectively. In the Punnet square below, fill in the blank squares.
Fathers pA qB rC
pA
pApA
Mothers qB
pAqB
qBrC
rC
The mathematical expression for a two-allele systems is: p2 + 2pq + q2 = 1.0 What is the mathematical expression for the three-allele system? This example shows that no matter how many alleles you are dealing with, the genotype frequency of the heterozygous condition is always 2 times the product of the allele frequencies (2pq) and the genotype frequency of the homozygous condition is always the square of the allele frequency (p2). An example using the Hardy-Weinberg equation to calculate genotype frequencies: Let’s say that, within a population, we find that allele A has a frequency of 0.2 and allele B has a frequency of 0.8.

D1S80 VNTR PCR BABEC 9/26/11 Student Guide 41
What is the expected frequency of the homozygous A/A genotype? What is the expected frequency of the A/B heterozygote? What is the expected frequency of the B/B homozygote? These frequencies should all add up to 1.0. Do they? Strictly speaking, the conditions for applying the Hardy-Weinberg equation requires an infinitely large population, random mating, no mutation of alleles, no loss or gain of genotypes in the population, and that all genotypes are equally viable and fertile. In actuality, none of these conditions is met. However, for practical purposes, modern populations approximate these conditions to an extent that Hardy-Weinberg law can be applied to the statistical analysis of genotype frequencies.
D1S80 VNTR PCR BABEC 9/26/11 Student Guide 42
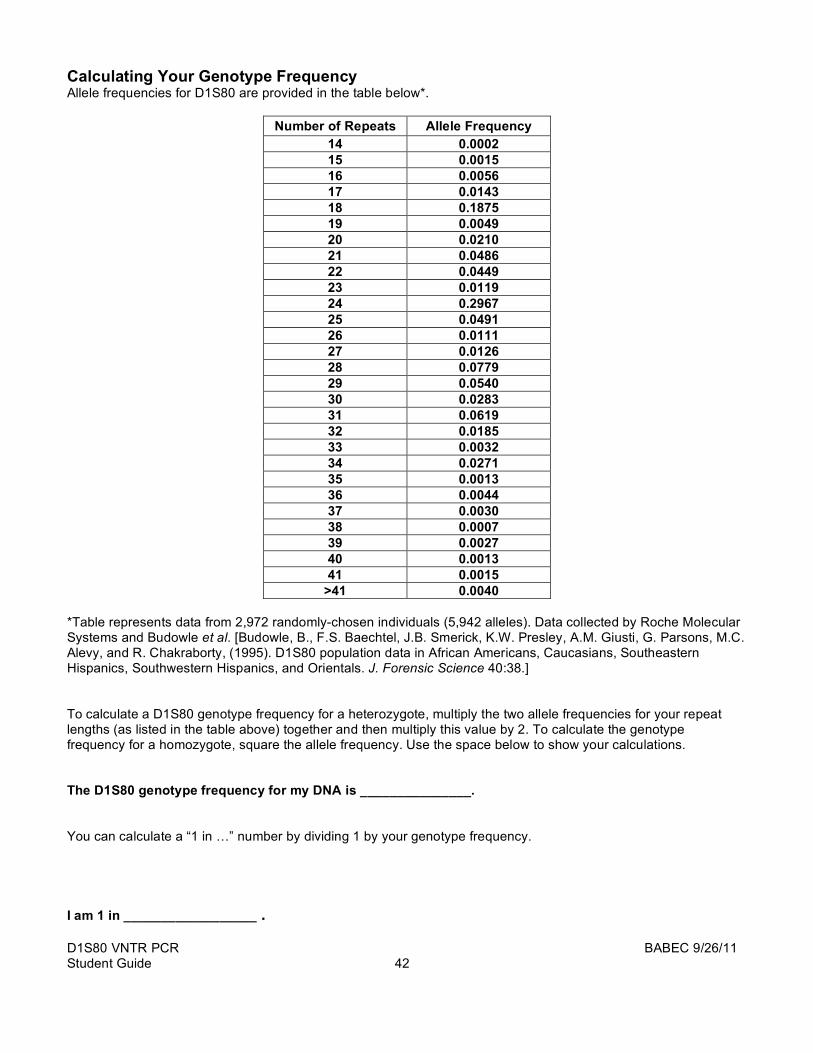
Calculating Your Genotype Frequency Allele frequencies for D1S80 are provided in the table below*.
Number of Repeats Allele Frequency 14 0.0002 15 0.0015 16 0.0056 17 0.0143 18 0.1875 19 0.0049 20 0.0210 21 0.0486 22 0.0449 23 0.0119 24 0.2967 25 0.0491 26 0.0111 27 0.0126 28 0.0779 29 0.0540 30 0.0283 31 0.0619 32 0.0185 33 0.0032 34 0.0271 35 0.0013 36 0.0044 37 0.0030 38 0.0007 39 0.0027 40 0.0013 41 0.0015
>41 0.0040
*Table represents data from 2,972 randomly-chosen individuals (5,942 alleles). Data collected by Roche Molecular Systems and Budowle et al. [Budowle, B., F.S. Baechtel, J.B. Smerick, K.W. Presley, A.M. Giusti, G. Parsons, M.C. Alevy, and R. Chakraborty, (1995). D1S80 population data in African Americans, Caucasians, Southeastern Hispanics, Southwestern Hispanics, and Orientals. J. Forensic Science 40:38.] To calculate a D1S80 genotype frequency for a heterozygote, multiply the two allele frequencies for your repeat lengths (as listed in the table above) together and then multiply this value by 2. To calculate the genotype frequency for a homozygote, square the allele frequency. Use the space below to show your calculations. The D1S80 genotype frequency for my DNA is _______________. You can calculate a “1 in …” number by dividing 1 by your genotype frequency. I am 1 in __________________ .
D1S80 VNTR PCR BABEC 9/26/11 Student Guide 43
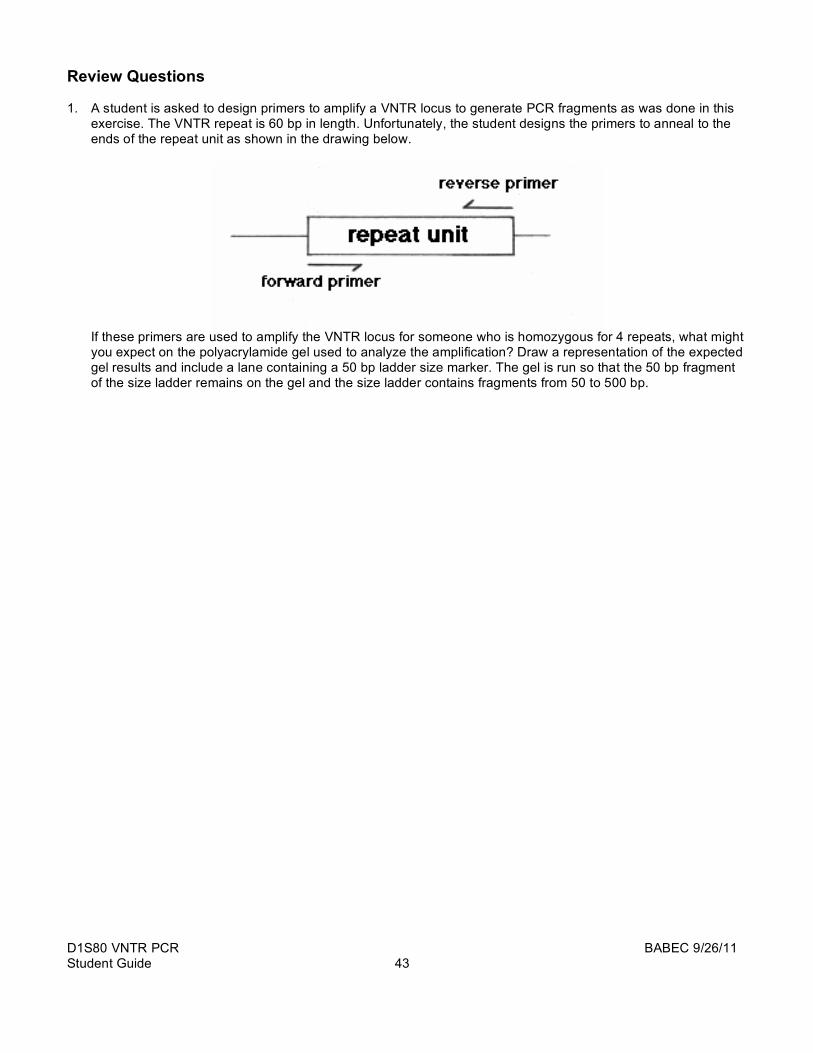
Review Questions 1. A student is asked to design primers to amplify a VNTR locus to generate PCR fragments as was done in this
exercise. The VNTR repeat is 60 bp in length. Unfortunately, the student designs the primers to anneal to the ends of the repeat unit as shown in the drawing below.
If these primers are used to amplify the VNTR locus for someone who is homozygous for 4 repeats, what might you expect on the polyacrylamide gel used to analyze the amplification? Draw a representation of the expected gel results and include a lane containing a 50 bp ladder size marker. The gel is run so that the 50 bp fragment of the size ladder remains on the gel and the size ladder contains fragments from 50 to 500 bp.

D1S80 VNTR PCR BABEC 9/26/11 Student Guide 44
2. The forward and reverse PCR primers used for the amplification of a VNTR locus on chromosome number 4
are 20 bases and 21 bases long, respectively. The 3’ base of the forward primer is 53 bases away from the first repeat. The 3’ base of the reverse primer is 28 bases away from the first repeat in that direction. Each repeat unit is 60 bases in length. A person has, on one of their number 4 chromosomes, 6 repeats. How long (in bp) should its PCR product be?
3. A person heterozygous for alleles A and B wants to know their genotype frequency. Allele A is present in the
population at a frequency of 0.3. Allele B is present in the population at a frequency of 0.7. What is her genotype frequency?

D1S80 VNTR PCR BABEC 9/26/11 Student Guide 45
Life Technologies & Applied Biosystems / BABEC Educational PCR Kits For research use only. Not for use in diagnostic procedures. Notice to Purchaser: Limited Label License A license under U.S. Patents 4,683,202, 4,683,195, and 4,965,188 or their foreign counterparts, owned by Roche Molecular Systems, Inc. and F. Hoffmann-La Roche Ltd (Roche), for use in research and development, has an up-front fee component and a running-royalty component. The purchase price of the Lambda PCR, Alu PV92 PCR, PCR Optimization, D1S80 PCR, and Mitochondrial PCR Kits includes limited, non-transferable rights under the running-royalty component to use only this amount of the product to practice the Polymerase Chain Reaction (PCR) and related processes described in said patents solely for the research and development activities of the purchaser when this product is used in conjunction with a thermal cycler whose use is covered by the up-front fee component. Rights to the up-front fee component must be obtained by the end user in order to have a complete license. These rights under the up-front fee component may be purchased from Applied Biosystems or obtained by purchasing an authorized thermal cycler. No right to perform or offer commercial services of any kind using PCR, including without limitation reporting the results of purchaser’s activities for a fee or other commercial consideration, is hereby granted by implication or estoppel. Further information on purchasing licenses to practice the PCR process may be obtained by contacting the Director of Licensing at Applied Biosystems, 850 Lincoln Centre Drive, Foster City, California 94404 or at Roche Molecular Systems, Inc., 1145 Atlantic Avenue, Alameda, California 94501. MicroAmp is a registered trademark of Applera Corporation or its subsidiaries in the U.S. and certain other countries. Applied Biosystems is a trademark of Applera Corporation or its subsidiaries in the U.S. and certain other countries. GeneAmp and AmpliTaq Gold are registered trademarks of Roche Molecular Systems, Inc. All other trademarks are the sole property of their respective owners. Applied Biosystems’ vast distribution and service network, composed of highly trained support and applications personnel, reaches into 150 countries on six continents. For international office locations, please call the division headquarters or refer to our web site at www. Appliedbiosystems.com. © Copyright 2001, Applied Biosystems. All rights reserved.