Using the Psychological Commitment O to Team (PCT)...
12
Using the Psychological Commitment to Team (PCT) Scale to Segment Sport Consumers Based on Loyalty Daniel F. Mahony, University of Louisville Robert Madrigal and Dennis Hovk'ard, University of Oregon Abstract The purpose of this study was to de- velop a psychological commitment to team (PCT) scale to be used in segmenting sport consumers based on loyalty. Previous research on the loyalty construct suggested the im- portance of using both behavioral and attitudinal measures when at- tempting to assess the loyalty of consumers (Backman & Crompton, 1991a; Day, 1969). Although mea- sures of behavioral loyalty are read- ily available in team sports (e.g., at- tendance, television viewing), no appropriate measure of attitudinal loyalty was available prior to the - current study. A number of statisti- cal procedures and four separate data collections were used to assess ' the strength of the PCT scale. The PCT scale provides sport marketers with a reliable and valid measure- ment tool for differentiating con- sumers into discrete segments based on the strength of their overall loy- Daniel F. Mahony is an assistant professor vv/f/? the Department of HPES at the University of Louisville. Robert Madrigal is an assistant professor with the Department of Marketing in the Lundquist College of Business at the University of Oregon. Dennis Howard is a professor with the Department of Marketing in the Lundquist College of Busi- ness at the University of Oregon. alty. Alternative strategies for strengthening fan allegiance for each of the different loyalty seg- ments are provided. *** "Marriages come and go. So do jobs, hometowns, friend- ships. But a guy's attachment to a sports team? There's a bond that holds the heart." The preceding statement on fans' obsession with sports teams ap- peared recently as the lead sen- tence in a feature article in USA Today, the United States' largest daily newspaper (Eisler, 1997). The quote captures the fanaticism or in- tense partisanship that Guttmann taled $8.8 billion, an increase of 126% over the $3.9 billion spent in 1990 (National Sporting Goods As- sociation, 1996). Although fans' time and monetary investments in sports seem to have grown expo- nentially in recent years, it is impor- tant to recognize that not all those who watch or attend sporting events are fans committed to the teams they view. Zillman and Paulus (1993) characterized specta- tors as individuals who watch a game but then forget about the ex- perience once it is over, whereas Sloan (1989) said a fan is one who watches as an enthusiastic devotee. The Concept of Fan Loyalty Although the notion of loyalty to team extends back to antiquity (Lee, Although fans' time and monetary investments in sports seem to have grown exponentially in recent years, it is important to recognize that not all those who watch or attend sporting events are fans committed to the teams they view. (1986) uses to define fans as "emo- tionally committed consumers of sporting events" (p. 6). The atten- tion given to sport by hard-core fans and other spectators is well docu- mented. Americans buy almost 200 million tickets to attend professional and collegiate sporting events each year (U.S. Bureau of Census, 1993), spending about $5 billion annually for admission (Bureau of Economic Analysis, 1996). In 1996, the retail sales of products bearing the trade- mark or logo of teams in the four major professional sports leagues in the United States and Canada to- 1983), very little is known about the social-psychological factors that produce strong emotional attach- ment to sports teams or organiza- tions. Previous research outside the sport-fan literature has shown that individuals who are emotionally in- volved devotees to a particular product or service are far more likely to repurchase that product or service and to evaluate the brand or experience more positively (e.g., Havitz & Howard, 1995). Smith, Patterson, Williams, and Hogg (1981) found the same relationship extended to sport fans. Although not m O m Z o Volume 9 • Number 1 • 2000 • Sport Marketing Quarterly 15
Transcript of Using the Psychological Commitment O to Team (PCT)...

Using the Psychological Commitmentto Team (PCT) Scale to Segment SportConsumers Based on LoyaltyDaniel F. Mahony, University of LouisvilleRobert Madrigal and Dennis Hovk'ard, University of Oregon
AbstractThe purpose of this study was to de-velop a psychological commitmentto team (PCT) scale to be used insegmenting sport consumers basedon loyalty. Previous research on theloyalty construct suggested the im-portance of using both behavioraland attitudinal measures when at-tempting to assess the loyalty ofconsumers (Backman & Crompton,1991a; Day, 1969). Although mea-sures of behavioral loyalty are read-ily available in team sports (e.g., at-tendance, television viewing), noappropriate measure of attitudinalloyalty was available prior to the
- current study. A number of statisti-cal procedures and four separatedata collections were used to assess
' the strength of the PCT scale. ThePCT scale provides sport marketerswith a reliable and valid measure-ment tool for differentiating con-sumers into discrete segments basedon the strength of their overall loy-
Daniel F. Mahony is an assistantprofessor vv/f/? the Department ofHPES at the University ofLouisville.
Robert Madrigal is an assistantprofessor with the Department ofMarketing in the Lundquist Collegeof Business at the University ofOregon.
Dennis Howard is a professorwith the Department of Marketingin the Lundquist College of Busi-ness at the University of Oregon.
alty. Alternative strategies forstrengthening fan allegiance foreach of the different loyalty seg-ments are provided.
* * *
"Marriages come and go. Sodo jobs, hometowns, friend-ships. But a guy's attachmentto a sports team? There's abond that holds the heart."
The preceding statement on fans'obsession with sports teams ap-peared recently as the lead sen-tence in a feature article in USAToday, the United States' largestdaily newspaper (Eisler, 1997). Thequote captures the fanaticism or in-tense partisanship that Guttmann
taled $8.8 billion, an increase of126% over the $3.9 billion spent in1990 (National Sporting Goods As-sociation, 1996). Although fans'time and monetary investments insports seem to have grown expo-nentially in recent years, it is impor-tant to recognize that not all thosewho watch or attend sportingevents are fans committed to theteams they view. Zillman andPaulus (1993) characterized specta-tors as individuals who watch agame but then forget about the ex-perience once it is over, whereasSloan (1989) said a fan is one whowatches as an enthusiastic devotee.
The Concept of Fan LoyaltyAlthough the notion of loyalty toteam extends back to antiquity (Lee,
Although fans' time and monetary investments in sports seemto have grown exponentially in recent years, it is important to
recognize that not all those who watch or attend sportingevents are fans committed to the teams they view.
(1986) uses to define fans as "emo-tionally committed consumers ofsporting events" (p. 6). The atten-tion given to sport by hard-core fansand other spectators is well docu-mented. Americans buy almost 200million tickets to attend professionaland collegiate sporting events eachyear (U.S. Bureau of Census, 1993),spending about $5 billion annuallyfor admission (Bureau of EconomicAnalysis, 1996). In 1996, the retailsales of products bearing the trade-mark or logo of teams in the fourmajor professional sports leagues inthe United States and Canada to-
1983), very little is known about thesocial-psychological factors thatproduce strong emotional attach-ment to sports teams or organiza-tions. Previous research outside thesport-fan literature has shown thatindividuals who are emotionally in-volved devotees to a particularproduct or service are far morelikely to repurchase that product orservice and to evaluate the brand orexperience more positively (e.g.,Havitz & Howard, 1995). Smith,Patterson, Williams, and Hogg(1981) found the same relationshipextended to sport fans. Although not
mOmZ
o
Volume 9 • Number 1 • 2000 • Sport Marketing Quarterly 15

addressing the concept of loyaltydirectly, their study of avid sportfans found that "deeply committedfans" displayed a much greaterpropensity to watch and attendsporting events featuring their fa-vorite teams. More recently, Wake-field and Sloan (1995) concludedthat "team loyalty," defined as en-during allegiance to a particularteam, was the most important factorin determining spectators' desire toattend live sporting events.
Although there are many behav-iors that may be an expression offan loyalty (e.g., television viewing,radio listening, team merchandisepurchases), prior research has reliedheavily on attendance data to mea-sure fan loyalty to sports teams.Total attendance (e.g., Baade &Tiehan, 1990), increases in ticketsales (e.g., Howard & Crompton,1995), and the extent of repeat at-tendance (e.g., Mullin, Hardy, &Sutton, 1993) have been used asbehavioral indicators of consumers'loyalty to a sports team or organiza-tion. Mullin and his associatesdemonstrated the potency of repeatpatronage, confirming the applica-tion of the "80-20 principle" (Evans& Berman, 1994) to sports teams. Intheir analysis of season attendanceat Pittsburgh Pirates games, Mullinet al. found that 80% of the in-crease in ticket sales from one sea-son to another was produced by20% of the existing attendees' buy-ing more tickets. Although repeatattendance may be the most evidentmanifestation of a person's attach-ment to a team, this strictly behav-ioral indicator ignores the underly-ing psychological processesexplaining why some people attendmore games over time.
In fact, research has shown atten-dance alone is a poor measure of
loyalty. Murrell and Dietz (1992)found individuals' support for a par-ticular team may be strong regard-less of actual attendance. Backmanand Crompton (1991a) identifiedseveral factors explaining whystrictly behavioral or "observable"measures like attendance are inade-quate indicators of loyalty. Theycontend that "behavioral measuresdo not discriminate between pur-chasing based on habit or lack ofconvenient opportunities" (p. 206).For example, an NFL fan inNashville, Tennessee, may attendTennessee Titans games becausethere are no other professional foot-ball options in the area, and he orshe may not necessarily be a com-mitted fan of the Titans. Therefore,"true" loyalty exists only when theconsumer regularly purchases theproduct or service and also displaysa strong, positive attitude toward aspecific brand (Day, 1969).
Loyalty as aTwo-Dimensional ConstructThe multidimensional nature of loy-alty has long been of interest tobrand loyalty researchers. In orderto provide a focus for this research,Olson and Jacoby (1971) developeda six-point definition of brand loy-alty, which is now widely cited.Their definition, later restatedslightly by Jacoby and Kyner (1973),states that brand loyalty is "(1) a bi-ased (i.e., nonrandom), (2) behav-ioral response (i.e., purchase) (3) ex-pressed over time (4) by somedecision making unit (5) with re-spect to one or more alternativebrands (6) as a function of psycho-logical (decision making, evaluate)processes" (p. 2). Although Jacobyand Kyner (1973) focused on testingall six of the elements, most of the
Although repeat attendance may be the most evident manifes-tation of a person's attachment to a team^ this strictly behav-ioral indicator ignores the underlying psychological processes
explaining why some people attend more games over time.In fact, research has shown attendance alone is a poor
measure of loyalty.
loyalty research has focused primar-ily on two main dimensions, behav-ioral and attitudinal (e.g., Backman& Crompton, 1991 a, 1991 b; Jacoby& Chestnut, 1978). Although Day(1969) was the first to propose atwo-dimensional conceptualizationof loyalty integrating both behav-ioral and attitudinal components,later research provided empiricalevidence that consumer loyalty wasin fact composed of these two sepa-rate but related elements (e.g.,Backman & Crompton, 1991a,1991b; Olson & Jacoby, 1971).
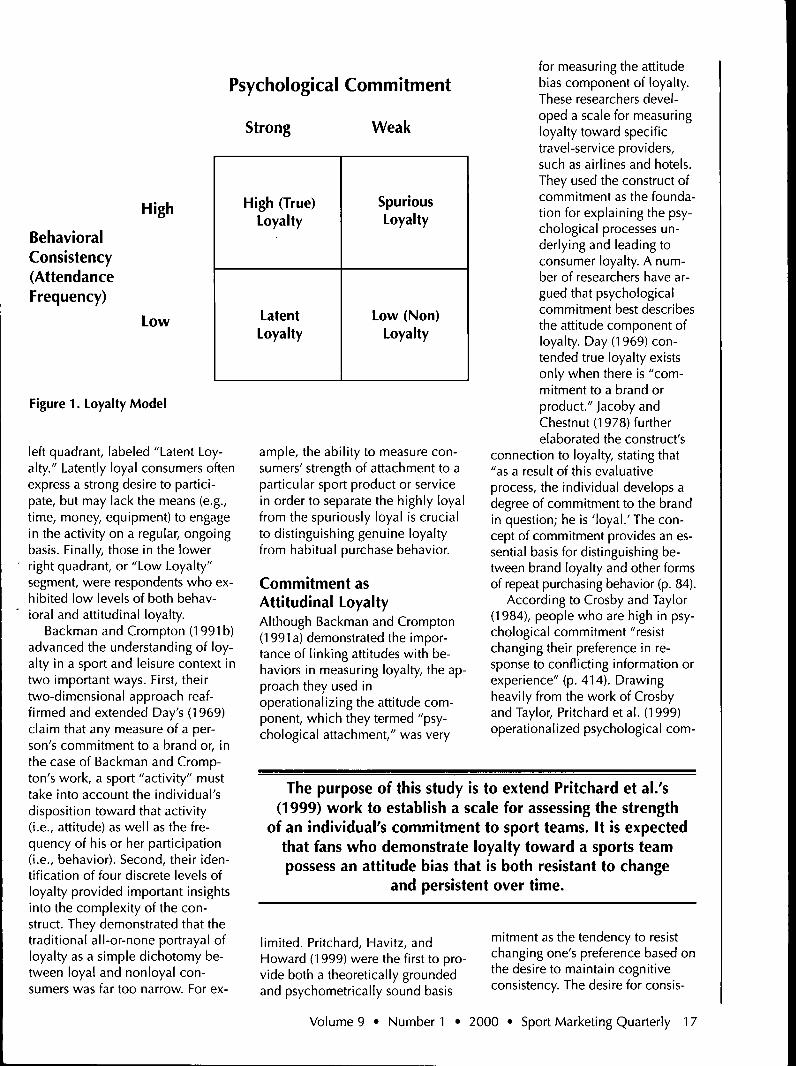
For example, Backman andCrompton (1991a) used attitudinaland behavioral scores to segmentrespondents in their study of golfand tennis participants. A 13-itemsemantic differential scale was usedto measure "participants' generalfeelings toward the activities"(p. 208). The researchers referred tothis dimension as attitudinal loyalty.The proportion of participation de-voted to golf or tennis during theprevious 12-month period was usedas the measure of behavior. Theythen used a two-dimensional matrixto distinguish four discrete levels ofloyalty (Figure 1). The resulting 'four-quadrant matrix served to clas-sify participants into specific groups ^by weak or strong attitudes andhigh or low behavioral consistency.
Following Day's (1969) earliercharacterization, those demonstrat-ing strong psychological attachment(i.e., high attitudinal loyalty) as wellas active participation (i.e., high be-havioral loyalty) were placed in theupper left quadrant, labeled "High(True) Loyalty." Consumers placedin the upper right quadrant, labeled"Spurious Loyalty," were those whoexhibited high behavioral loyalty,but low attitudinal loyalty. Becauseof the low level of attitudinal loy-alty, dropout rates among these spu-riously loyal consumers tends to behigh. In contrast, respondents whowere strongly attached to their ac-tivity (i.e., high attitudinal loyalty),but exhibited a low frequency ofparticipation (i.e., low behavioralloyalty) were placed in the lower
16 Volume 9 • Number 1 • 2000 • Sport Marketing Quarterly
Psychological Commitment
Strong Weak
High
BehavioralConsistency(AttendanceFrequency)
Low
High (True)Loyalty
LatentLoyalty
SpuriousLoyalty
Low (Non)Loyalty
Figure 1. Loyalty Model
left quadrant, labeled "Latent Loy-alty." Latently loyal consumers oftenexpress a strong desire to partici-pate, but may lack the means (e.g.,time, money, equipment) to engagein the activity on a regular, ongoingbasis. Finally, those in the lowerright quadrant, or "Low Loyalty"segment, were respondents who ex-hibited low levels of both behav-ioral and attitudinal loyalty.
Backman and Crompton (1991b)advanced the understanding of loy-alty in a sport and leisure context intwo important ways. First, theirtwo-dimensional approach reaf-firmed and extended Day's (1969)claim that any measure of a per-son's commitment to a brand or, inthe case of Backman and Cromp-ton's work, a sport "activity" musttake into account the individual'sdisposition toward that activity(i.e., attitude) as well as the fre-quency of his or her participation(i.e., behavior). Second, their iden-tification of four discrete levels ofloyalty provided important insightsinto the complexity of the con-struct. They demonstrated that thetraditional all-or-none portrayal ofloyalty as a simple dichotomy be-tween loyal and nonloyal con-sumers was far too narrow. For ex-
ample, the ability to measure con-sumers' strength of attachment to aparticular sport product or servicein order to separate the highly loyalfrom the spuriously loyal is crucialto distinguishing genuine loyaltyfrom habitual purchase behavior.
Commitment asAttitudinal LoyaltyAlthough Backman and Crompton(1991 a) demonstrated the impor-tance of linking attitudes with be-haviors in measuring loyalty, the ap-proach they used inoperationalizing the attitude com-ponent, which they termed "psy-chological attachment," was very
for measuring the attitudebias component of loyalty.These researchers devel-oped a scale for measuringloyalty toward specifictravel-service providers,such as airlines and hotels.They used the construct ofcommitment as the founda-tion for explaining the psy-chological processes un-derlying and leading toconsumer loyalty. A num-ber of researchers have ar-gued that psychologicalcommitment best describesthe attitude component ofloyalty. Day (1969) con-tended true loyalty existsonly when there is "com-mitment to a brand orproduct." Jacoby andChestnut (1978) furtherelaborated the construct's
connection to loyalty, stating that"as a result of this evaluativeprocess, the individual develops adegree of commitment to the brandin question; he is 'loyal.' The con-cept of commitment provides an es-sential basis for distinguishing be-tween brand loyalty and other formsof repeat purchasing behavior (p. 84).
According to Crosby and Taylor(1984), people who are high in psy-chological commitment "resistchanging their preference in re-sponse to conflicting information orexperience" (p. 414). Drawingheavily from the work of Crosbyand Taylor, Pritchard et al. (1999)operationalized psychological com-
The purpose of this study is to extend Pritchard et al/s(1999) work to estahlish a scale for assessing the strength
of an individual's commitment to sport teams. It is expectedthat fans who demonstrate loyalty toward a sports teampossess an attitude bias that is both resistant to change
and persistent over time.
limited. Pritchard, Havitz, andHoward (1999) were the first to pro-vide both a theoretically groundedand psychometrically sound basis
mitment as the tendency to resistchanging one's preference based onthe desire to maintain cognitiveconsistency. The desire for consis-
Volume 9 • Number 1 • 2000 • Sport Marketing Quarterly 17
tency between an individual's be-liefs and feelings toward an objectproduces a stable behavioral inten-tion toward that object (Rosenberg,1965). Support for Crosby and Tay-lor's interpretation of commitmentbased on resistance to change isfound in Kiesler's (1971) earlierwork on commitment. Kiesler andassociates established in several ex-periments that the "effect of com-mitment is to make an act lesschangeable" (Kiesler & Mathog,1971; Kiesler & Sakamura, 1966,p. 349). Moreover, recent researchsuggests "that loyal consumers—those who have a strong commit-ment to a service or brand—showstrong resistance to counter persua-sion attempts" (Schiffman & Kanuk,1997, p. 223).
Proceeding, then, on the beliefthat psychological commitment wasa strong barometer of preference sta-bility, Pritchard et al. (1999) devel-oped a scale that measured the atti-tude component of loyalty on thebasis of how committed people weretoward a specific travel service. Fol-lowing a rigorous scale constructionprocedure (Churchill, 1979; Dawis,1987), the researchers developed a13-item scale that demonstratedstrong psychometric qualities. Usingsamples across three travel-servicesubsets (destination golf resorts, air-lines, hotels), Pritchard and his asso-ciates produced an instrument dis-playing consistently high reliabilityas well as discriminant and conver-gent validity.
Creating a Commitmentto Team ScaleThe purpose of this study is to ex-tend Pritchard et al.'s (1999) workto establish a scale for assessing thestrength of an individual's commit-ment to sport teams. It is expectedthat fans who demonstrate loyaltytoward a sports team possess an at-titude bias that is both resistant tochange and persistent over time. Inaddition, it is expected that strongand weak attitudes, or levels of per-sonal commitment, toward a teamwould be effective guides to behav-
ior (Fazio, 1995; Petty, Haugtvedt, &Smith, 1995). Those individualsscoring high on the personal com-mitment scale would accurately rep-resent those fans truly devoted to aparticular team. Conversely, thosescoring low would be classified, atbest, as spuriously loyal, with a sub-stantial number having little or noemotional attachment to the team.Determining the strength of an indi-vidual's attitude or commitment,therefore, would allow for meaning-ful differentiation between "fair-weather" and "deeply committed"fans (Smith etal., 1981).
Scale DevelopmentThe Psychological Commitment toTeam (PCT) scale (see Table 1) wasdeveloped using multiple steps andfour phases of data collection. In-strument development relied heav-ily on the work of Pritchard et al.(1999) and the suggestions ofChurchill (1979) on scale develop-ment (e.g., generating items, purify-ing the measure, assessing reliabil-ity and validity). Specifically, thefollowing steps were taken in thecurrent study: (a) items were gener-ated; (b) items were pretested;(c) scale was tested with three sepa-rate samples in three different teamsport settings (i.e., professional foot-ball, college football, professionalbasketball) to establish internalconsistency and reliability; and(d) scale was tested with two sam-ples (one from the University of Ok-lahoma and one from The Ohio StateUniversity) to determine if it hadconstruct and predictive validity.
Generating ItemsBased on the findings of Crosby andTaylor (1983) and the results of re-cent attitude strength studies(Haugtvedt & Petty, 1992;Haugtvedt & Wegener, 1994), resis-tance to change was believed to bea critical factor underlying commit-ment. Therefore, items were gener-ated that emphasized the impor-tance of resistance to change. Inparticular, the authors attempted tomeasure whether fans would re-main committed to the team when
something occurred that mightchange their commitment (i.e., poorteam performance, loss of goodplayers, change in the coach).
A couple of items from the origi-nal Pritchard et al. (1999) PCI scalewere determined to be easily adapt-able to a sports context and wereincluded in the item pool. As sug-gested by Churchill (1979), addi-tional items based on a review ofthe literature on sport fans werethen generated by the authors.Churchill's suggestion that items beworded both positively and nega-tively was also followed. The Psy-chological Commitment to Team(PCT) scale used a 7-point Likertscale ranging from strongly disagreeto strongly agree. Positively wordeditems were scored from 1 forstrongly disagree to 7 for stronglyagree, whereas negatively wordeditems were scored from 7 forstrongly disagree to 1 for stronglyagree. Therefore, a higher score al-ways represented greater psycho-logical commitment to the team.The 15 total items generated werethen sent to a panel of judges to de-termine the appropriateness of eachitem with respect to clarity and facevalidity. The panel, which includedexperts in research related to sportconsumer behavior, provided unan-imous support for the inclusion ofall 15 items.
Pretesting ItemsA convenience sample (N=100) wasthen used to examine the scale forinternal consistency. Using an initialsample to purify the measure is alsoa suggestion made by Churchill(1979). All surveys collected wereusable. The respondents were in-coming freshmen at The Ohio StateUniversity who were recruited fromthe 1994 summer orientation pro-gram. Each was asked to answer thequestions with regard to his or herfavorite National Football League(NFL) team. Professional footballwas selected because of its popular-ity in the United States and becauseof the general awareness of NFLteams. A USA Today/Gallup Pollfound that professional football
18 Volume 9 • Number 1 • 2000 • Sport Marketing Quarterly
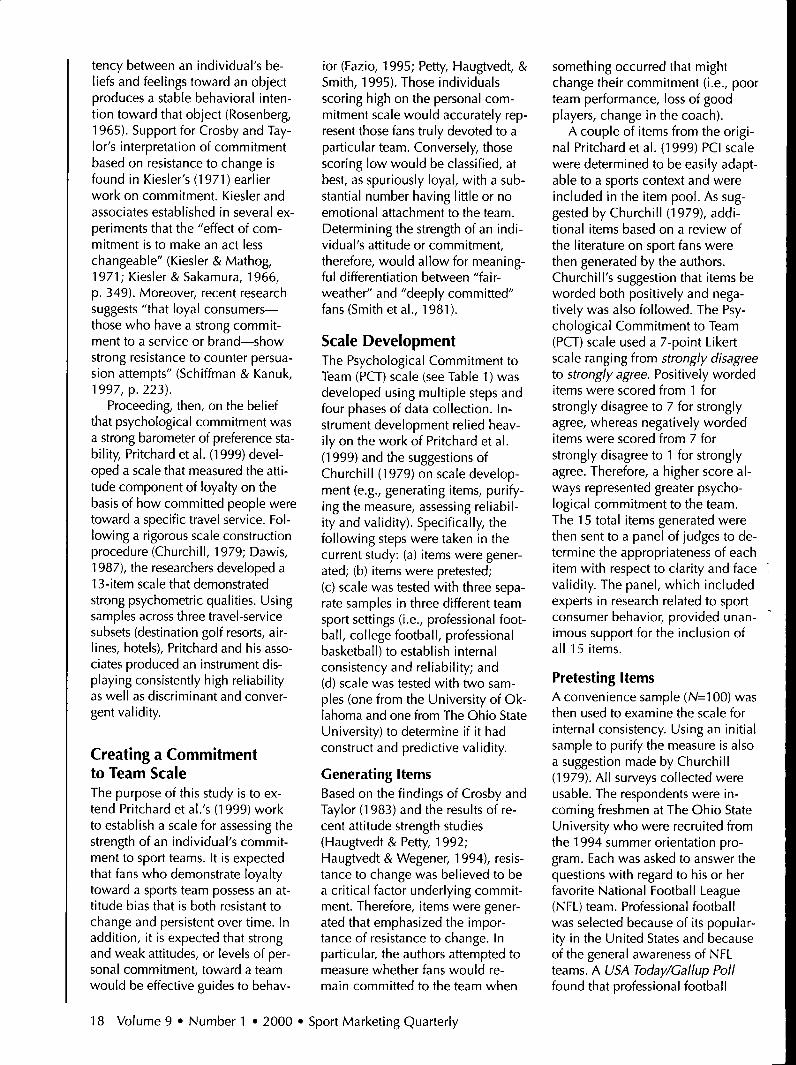
Table 1. Item-to-Total Correlations and Alpha Coefficients If That Item Were Deleted for thePCT Scale
Item-to-Total Correlations Alpha If Deleted
Item Sample 2 Sample 3
(N=157)
Sample 4
(N=76)
Sample 2 Sample 3 Sample 4
1. 1 might rethink my allegiance to my favorite team if this team consistently performs poorly.
.595 .481 .739 .87 .88 .942. I would watch a game featuring my favorite National Football League (NFL) team regardless of which team
they are playing.
.255 .353 .679 .88 .88 .943. I would rethink my allegiance to my favorite team if management traded away its best players.
.371 .473 .773 .88 .88 .94
4. Being a fan of my favorite NFL team is important to me.
.635 .550 .760 .87 .87 .94
5. Nothing could change my allegiance to my favorite NFL team.
.673 .684 .723 .87 .87 .94
6. I am a committed fan of my favorite NFL team.
.733 .713 .808 .86 .86 .94
7. It would not affect my loyalty to my favorite NFL team if management hired a head coach that 1 disliked verymuch.
.513 .497 .653 .88 .88 .948. I could easily be persuaded to change my favorite NFL team preference.
.690 .564 .791 .87 .87 .949. I have been a fan of my favorite team since I began watching professional football.
.360 .516 .569 .88 .88 .9410. 1 could never switch my loyalty from my favorite NFL team even if my close friends were fans of another team.
.690 .728 .814 .87 .86 .9411. It would be unlikely for me to change my allegiance from my current favorite NFL team to another.
.765 .754 .781 .87 .86 .94
12. It would be difficult to change my beliefs about my favorite NFL team.
.813 .760 .714 .86 .86 .94
13. You can tell a lot about a person by their willingness to stick with a team that is not performing well.
.354 .300 .465 .88 .88 .9414. My commitment to my favorite NFL team would decrease if they were performing poorly and there appeared
little chance their performance would change.
.426 .346 .739 .88 .88 .94
ranked first in popularity among thefour major professional sports in theUnited States (as cited in Mihoces,1995). Examination of the item-to-total correlations found one item ("Itis normal for a person to change theirallegiance to a local team after relo-cating") had a low negative correla-tion with the total (t^.O8). Becausethe item had such a low correlationand did not ask about the fan's per-
sonal relationship with his or her fa-vorite team, the item was eliminatedfrom the scale, resulting in the 14-item PCT scale that was further testedwith the three remaining samples.
Establishing InternalConsistency and ReliabilityA second convenience sample{N=^ 51) was recruited from under-graduate classes at the University of
Oklahoma. The original sample sizewas 153, but 2 respondents wereeliminated because they indicatedthey had no favorite team. The finalsample (N=151) included 89 men(58.9%) and 62 women (41.1%)with a mean age of 23.45 (approxi-mately 23 years 6 months old). Re-spondents were again asked to an-swer the questions with regard totheir favorite NFL team. As per
Volume 9 • Number 1 • 2000 • Sport Marketing Quarterly 19

Churchill's (1979) recommendation,Cronbach's (1951) coefficient alphawas used initially to examine themeasure's internal consistency tohelp establish reliability. Cronbach'scoefficient alpha estimate for the 14-item PCT scale was .88. This esti-mate was greater than the .70 mini-mum that has been suggested byNunnally and Bernstein (1994). Ex-amination of the item-to-total corre-lations (see Table 1) found that onlyitem number 2 had an item-to-totalcorrelation of less than .30 (r= .25).This item was not eliminated fromthe scale for several reasons:(a) eliminating this item would nothave changed the coefficient alphaestimate; (b) the item-to-total corre-lation was very close to the .30mark being used in this study; (c) theitem had an item-to-total correlationwell above .30 during the pretestingof the scale (r = .54); and (d) theitem was believed to be important inmeasuring psychological commit-ment to team (PCT) because of theresults of prior research and thestudies related to the domain of this
item-to-total correlation for item 2was .353. Therefore, the authorsbelieve the decision to keep thisitem was appropriate.
The fourth convenience sample(/V=76) was collected from studentsat The Ohio State University. Self-identified Ohio State fans wereasked to fill out the scale with re-gard to the OSU football team. Theonly item that had to be adjusted
group. One common method for de-termining the validity of a scale is todistribute the scale to a group thatshould score high on the scale(Churchill, 1979). If the group doesin fact indicate a high score, thiswould be further evidence to supportthe scale's construct validity. Whenexamining the fourth conveniencesample, fans who indicated they hada very strong interest in Ohio State
Overall, the PCT scale demonstrated strong predictivevalidity, and the analysis provided evidence of its constructvalidity. Therefore, the scale appears to be useful with both
college and professional teams.
somewhat was item number 3. Theitem, which was worded "1 wouldrethink my allegiance to my favoriteteam if management traded away itsbest players" when examining pro-fessional sport teams, was changedto "I would rethink my allegiance tothe Ohio State football team if theirbest players left the team (i.e., trans-
football {N-43; a score of 6 or 7 ona one-item measure with 1=MinimalInterest to 7=Strong Interest), the PCTscore was very high (M=88.09,S.D.=8.76). This is much higher thanthe average score on the PCT scalewith the professional football sample(A^=70.12) and the professional bas-ketball sample (A^=62.60). In addi-
The Psychological Commitment to Team (PCT) scale provides researchers with a reliable andvalid tool for measuring attitude loyalty, or the strength of fans' commitment to a particularsports team. Previous research has shown that capturing the dispositional nature of attach-
ment is crucial to establishing true loyalty.
construct (Crosby & Taylor, 1983).A third convenience sample
{M-^ 57) was recruited from a num-ber of graduate and undergraduateclasses at the University ofLouisville. The sample included113 men and 44 women with amean age of 23.01 years. This timerespondents were asked to answerthe questions with respect to theirfavorite National BasketballAssociation team. Cronbach's coef-ficient alpha was used once againto examine the scale's internal con-sistency. Cronbach's alpha estimatefor the 14-item scale was again .88,establishing the reliability of thescale items. The item-to-total corre-lations (see Table 1) were .30 orbetter for all items. In particular, the
fer, graduate, etc.)." All question-naires were completed, and theywere all usable. Cronbach's coeffi-cient alpha was used once again toexamine the scale's internal consis-tency to help further establish relia-bility. Cronbach's alpha estimate forthe 14-item scale was .94, again ex-ceeding the minimum threshold of.70 suggested by Nunnally andBernstein (1994). The item-to-totalcorrelations, shown in Table 1,were better than .45 for all items.
Establishing Constructand Predictive ValidityThe authors used a number of meth-ods to establish construct and pre-dictive validity. First, the authors ex-amined the PCT scale with a known
tion, a one-way ANOVA (with inter-est in OSU football as theindependent variable and score onthe PCT as the dependent variable)showed that fans who indicated astrong interest in OSU football (6 or7) scored significantly higher on thePCT scale than did fans who had lessinterest in OSU football (N=33; lessthan 6 on a scale of 1 to 7), F(1, 74)= 104.33, p < .001. Therefore, theexamination of the known groupprovided support for the constructvalidity of the PCT scale.
Second, another method for de-termining if an attitude scale isvalid is to examine if scores derivedfrom the scale can predict relatedbehaviors. In fact, a recent meta-analysis by Kraus (1995) found that
20 Volume 9 • Number 1 • 2000 • Sport Marketing Quarterly

attitudes have been very useful inpredicting future behavior in a vari-ety of settings. Because a strong re-lationship is expected between atti-tudinal loyalty and behavioralloyalty, a series of analyses wereused to determine if the Psycholog-ical Commitment to Team (PCT)scale was significantly related tovarious measures of behavioral loy-alty. Using the second conveniencesample, the current study examinedthe relationship between score onthe PCT scale and (a) the durationof one's commitment to a team,(b) the frequency with which, ac-cording to their own report, the re-spondents generally watched their
to Team scale again demonstratedgood predictive validity when usedto analyze Ohio State football fansin the fourth convenience sample.The relationship between score onthe PCT scale and three behavioralmeasures of fan loyalty was exam-ined. First, a regression analysis wasused to determine whether the re-spondents' scores on the PCT scalecould be used to predict the num-ber of Ohio State football games at-tended during the last season. Theresults indicated that psychologicalcommitment to the Ohio State foot-ball team did make a significantcontribution to the prediction of thenumber of games attended.
p < .001. Analysis of the frequen-cies indicated those who scoredhigher on the PCT scale were morelikely to make every effort to watchor listen to the team.
Overall, the PCT scale demon-strated strong predictive validity,and the analysis provided evidenceof its construct validity. Therefore,the scale appears to be useful withboth college and professionalteams.
Conclusion and ImplicationsThe Psychological Commitment toTeam (PCT) scale provides re-searchers with a reliable and validtool for measuring attitude loyalty.
Knowing what percentage of a team's existing fan base falls into high, spurious, latent, or lowloyalty categories provides a starting point for developing customized programs that account
for varying levels of attachment held by fans. The varying attitude-behavior combinations rep-resented in each cell in Figure 1 suggest that different approaches to changing or maintaining
current levels of loyalty are required for each segment.
favorite team on television, and(c) the percentage of games featur-ing their favorite team that the re-spondents actually watched duringthe NFL regular season.
The correlations between thePsychological Commitment to Team(PCT) scale and all three behavioralloyalty measures were examined todetermine whether the scaledemonstrated effective predictivevalidity. High correlations withthese behavioral loyalty measureswould indicate that the measure isappropriate for assessing attitudinalloyalty. First, there was a significantpositive correlation between thePCT scale and the number of yearsas a fan of the favorite team, r= .426,p < .001. Second, there was a sig-nificant positive correlation be-tween the PCT scale and how oftenthe respondents generally watchedtheir favorite team, r= .584,p < .001. Third, there was a signifi-cant positive correlation betweenthe PCT scale and the percentage ofthe favorite-team games respon-dents actually watched during theNFL season, r = .563, p < .001.
The Psychological Commitment
(/?2 = .273, p < .001). Second, achi-square analysis examinedwhether scores on the PCT scale (amedian split was used on PCTscore) could predict whether stu-dents had purchased Ohio Statefootball tickets during the prior sea-son. The results of the chi-squareanalysis indicated there was a sig-nificant relationship between psy-chological commitment to the OSUfootball team and the purchase ofseason tickets, x^ {df-^) - 8.85,p < .003. Analysis of the frequen-cies indicated that those whoscored higher on the PCT scalewere more likely to buy season tick-ets. Third, another chi-square analy-sis examined whether "score" onthe PCT scale (a median split wasagain used on PCT score) couldpredict whether the student "makesevery effort to watch or listen" toOhio State football games he or shedoes not attend. The results of thechi-square analysis indicated therewas a significant relationship be-tween psychological commitmentto the OSU football team and mak-ing an effort to watch or listen tothe team, xMc//'=1) = 14.77,
or the strength of fans' commitmentto a particular sports team. Previousresearch has shown that capturingthe dispositional nature of attach-ment is crucial to establishing trueloyalty (Day, 1969; Dick & Basu,1994). Research by Howard andThompson (1984) has shown thatcustomers' level of loyalty to a par-ticular brand or service mediatestheir responsiveness to accompany-
With spuriously loyal fans,the strategy would be to
increase the psychologicalcommitment to the team
they are already supportingbehaviorally. Again,
increased attitudinal loyaltyamong this segment is
extremely important becausethese are generally the fans
who will stop supporting theteam when something goeswrong (e.g., team perfor-
mance decreases; a popularplayer is traded).
Volume 9 • Number! • 2000 • Sport Marketing Quarterly 21

ing information and their intentionsto repurchase that good or service.The stronger the attitude typicallythe greater the likelihood of congru-ent behavior. Not surprisingly, then,the more positively disposed indi-viduals are toward a particular ob-ject, the more likely they are to at-tend to advertising messagesrelevant to that object, share posi-tive affirmations (e.g., word ofmouth) about the object, and ulti-mately, purchase the product.
The initial tests conducted in thisstudy demonstrated the score de-rived from the PCT scale by itselfcan be very useful in predicting at-tendance at sporting events andtelevision viewing behavior. Thescale's capabilities for predictingloyal behavior in the future, how-
with behavior (e.g., frequency of re-peat purchase) provides a basis fordifferentiating customers into mean-ingful loyalty segments. The easy-to-administer PCT scale providessport marketers with a tool for as-sessing the extent to which their ex-isting fan base falls into deeplycommitted or fair-weather fan cate-gories. Knowing what percentage ofa team's existing fan base falls intohigh, spurious, latent, or low loyaltycategories provides the basis for de-veloping a marketing program thatoptimizes the potential for strength-ening fans' attachment to the team.
Knowing what percentage of ateam's existing fan base falls intohigh, spurious, latent, or low loyaltycategories provides a starting pointfor developing customized pro-
Low-loyalty consumers are the most challenging segment.These infrequent or nonattending patrons hold^ at best, an
ambivalent attitude toward the sports team. Converting thissegment's behavior and predisposition is likely to he very
expensive, and even then, the probability of success is low.
ever, are more fully realized whenthe PCT score is combined with ameasure of past behavior. As Back-man and Crompton (1991 a, b) andPritchard et al. (1999) demon-strated, combining attitude loyalty
grams that account for varying lev-els of attachment held by fans. Thevarying attitude-behavior combina-tions represented in each cell inFigure 1 suggest that different ap-proaches to changing or maintain-
ing current levels of loyalty are re-quired for each segment (see Table2). The following sections discussspecific marketing strategies andtactics for optimizing the strength offans' attachment to a team for eachof the four loyalty segments.
High-Loyalty SegmentDescriptionIn the upper left quadrant of Figure1 are the truly loyal fans (i.e., highloyalty). Fans in this segment scorehigh on the PCT scale (i.e., high at-titudinal loyalty) and exhibit strongbehavioral loyalty (e.g., attendinggames, watching games on televi-sion). For these fans, the relation-ship with the team has probably be-come a significant part of theirlives, and they are unlikely tochange their behavior or level ofcommitment. However, the loyaltylevel of this group may decreaseslowly over time if this segment isignored by marketers or may de-crease more quickly if somethingvery drastic happens.
StrategyA reinforcement strategy is the bestmeans for marketing to the highlyloyal fans (Pritchard et al., 1999;Sheth, 1987). This strategy shouldfocus on reinforcing existing cogni-
Table 2. Suggestions for Marketing to the Four Loyalty Segments
Segment Suggestions
High Loyalty
Spurious Loyalty
Latent Loyalty
Low Loyalty
Marketers should use a reinforcement strategy that includes reinforcing behavioral loyaltythrough economic incentives and attitudinal loyalty through personalized encouragement. Thisstrategy is designed to increase the yield from this segment and to avoid any chances of losingthe segment.Marketers should focus on increasing the fans' psychological commitment through the use of arationalization strategy. This can be done by promoting the positive attributes of the product orservice, getting the fans to articulate why they support the team, and/or coupling attendancewith support of a relevant social cause.Marketers should focus on increasing the positive behaviors of the latently loyal fan by using amarket inducement strategy. This can be done by removing significant barriers to behavior andby offering economic incentives to engage in certain behaviors.Although some might suggest marketers use a confrontation strategy, which requires a direct at-tack on the fan's existing attitudes, others believe this may only lead to strengthening the fan'slow level of commitment. Many strategists instead recommend focusing on using either a ratio-nalization strategy to increase commitment or an inducement strategy to increase behavior as afirst step to high loyalty.
22 Volume 9 • Number 1 • 2000 • Sport Marketing Quarterly

tions, allaying the potential for disso-nance to occur (Pritchard et al.,1999; Sheth, 1987). Because theyare so valuable to the team, mar-keters want to avoid a situation inwhich highly loyal fans would de-crease their behavior or reconsidertheir allegiance to their favoriteteam. Moreover, marketers want tofocus on increasing the behavior ofthese loyal fans (e.g., number ofgames attended, amount of mer-chandise purchased) and increasingthe strength of their commitment.Therefore, the reinforcement strategyinvolves a two-pronged approach.First, behavioral loyalty can be rein-forced extrinsically through eco-nomic incentives (e.g., discounts,value-added services). Second, psy-chological reinforcement based onintrinsic rewards can be provided bypersonalized encouragement (e.g.,newsletters, VIP treatment). The ob-jective is to progressively increasethe yield from these best consumersby developing a long-term, interac-tive, value-added relationship.
For example, the San DiegoPadres have developed a successfulprogram for rewarding their mostloyal customers ("With Frequency,"1996). Recently, this Major LeagueBaseball team developed a loyaltyprogram designed to reward frequentattendance, as well as to encouragefans to attend as many games as pos-sible. The Padres reward fans by al-lowing those who attend games toregister for membership in the Com-padres Club. Based on frequency ofgame attendance, club membersearn points ("hits") toward increas-ingly attractive prizes, including ex-clusive autograph sessions and in-clusion in pregame chalk talks.Registration for club membershipalso allows the Padres to identifytheir most loyal customers, to sendcustomized newsletters, and to so-licit consumer satisfaction feedbackfrom these most desirable fans.
Spurious-Loyalty SegmentDescriptionSpuriously loyal fans, those in theupper right quadrant of Figure 1,are fans who exhibit high levels of
behavioral loyalty, but score low onthe PCT scale. These fans may ap-pear to most observers to be loyalfans of the team because they be-have in the same manner as thetruly loyal fans (e.g., frequently at-tending games, frequently watchinggames on television). However, theyare not committed fans of the fa-vorite team and could drop out atany point with little dissonance.There may be a number of reasonsfor this high level of behavior ac-companied by low commitment,such as (a) they attend ganies pri-marily because friends or familywant to attend; (b) they attendgames of the home team, but arefans of a team in another location;(c) games are a relatively cheapsource of entertainment; (d) they aregiven the tickets for free (by an em-ployer or another business); or(e) they go to the game for otherreasons (e.g., business interactions,socializing, drinking, gambling).
StrategyWith spuriously loyal fans, the strat-egy would be to increase the psy-chological commitment to the teamthey are already supporting behav-iorally. Again, increased attitudinalloyalty among this segment is ex-tremely important because these aregenerally the fans who will stopsupporting the team when some-thing goes wrong (e.g., team perfor-mance decreases; a popular playeris traded). Sheth (1987) recom-mends a market rationalizationstrategy as a way to strengthen con-sumers' commitment toward a prod-uct they are already buying. The in-tent is to create rationalized reasonsto justify their behavior.
One approach is to focus on pro-moting the attributes of the productor service (Sheth, 1987) in an at-tempt to provide the spuriously loyalfan with rational reasons why he orshe should support the team (e.g.,first-class tradition, fan-friendlyteam). Second, it would also behelpful to get the fans "to articulate,at least on a rationalized basis, whythey buy or use the product/service"(Sheth, 1987, p. 27). Prior research
suggests that as consumers try to jus-tify their purchase, they tend to be-come more committed to the prod-uct or service they purchased(Schiffman & Kanuk, 1997).
Third, coupling attendance withsupport for a relevant social causemay be an important rationalizedreason for some spuriously loyalfans. An emerging strategy, calledalignment marketing, attempts toimprove a brand or company's for-tunes by linking it to some highlyvalued celebrity or cause (lEC,1995). Alignment marketing is basedon the belief that if an organizationis able to build a link in the con-sumer's mind between the productname and a cause that is of greatimportance to that consumer (e.g.,feeding and sheltering the homeless,civic pride), then there is a strongprobability that the consumer's per-ception of that particular brand orproduct will improve. This strategymay also provide the basis for fansto rationalize and, therefore,strengthen their emotional commit-ment to a team. A team, for exam-ple, that demonstrates its commit-ment to helping battered women bypledging a portion of each ticketsold to fund or construct a new shel-ter provides the spuriously loyal fanone more important reason to careabout the organization and to attendgames. In a college sport setting, itmay be possible to focus on theteam's high graduation rate, suggest-ing this is a program that values ed-ucation first, or focus on the numberof local players on the team, playingon the belief of some that it is im-portant to support local "kids."
Latent-Loyalty SegmentDescriptionIn contrast to spuriously loyal fans,latently loyal fans (lower left quad-rant of Figure 1) are those whoscored high on the PCT scale, butexhibit low levels of behavioral loy-alty. Although these fans are un-likely to change their team alle-giance, they do not exhibit many ofthe behaviors that would benefit theteam (e.g., attending games). Theremay be a number of reasons for
Volume 9 • Number 1 • 2000 • Sport Marketing Quarterly 23
their low level of behavior includ-ing the high cost of some games,the time it takes to attend a game,and the accessibility of games.Many people in this segment mayconstitute what Muliin et al. (1993)refer to as "media consumers,"those whose commitment is highbut whose behaviors related to theirfavorite team are limited to morepassive, indirect involvementthrough watching or listening togames and reading about the teamin the newspaper. Moreover, fanswho live outside their favoriteteam's region may have difficultyobtaining even media access togames and would, therefore, exhibiteven less loyalty-related behavior.
StrategyAccording to Sheth (1987), the mar-ket inducement strategy is most use-ful in reaching latently loyal con-sumers. To induce these fans tomove toward more active, directparticipation and into the "high-loyalty" group, where their behav-ior matches their attitude, Shethrecommends two approaches. First,the facilitation of inducement in-volves eliminating any obstaclesthat prevent consumers from pur-chasing the product or service theylike. "It involves removal of time,place and possession barriers in tar-get segments" (Sheth, p. 26). Sec-ond, economic incentives are an-other way to induce people toengage in behavior toward whichthey have a positive predisposition.Incentives could include a range ofsales and promotional programs,such as coupons, ticket-price dis-counts, and the offering of lotteryprizes.
The Milwaukee Brewers initiateda ticket-package campaign intendedto reach fans who had not histori-cally purchased season ticket pack-ages (Eisengerg, 1993). Rather thanjust offering traditional full- (81games) or halfseason (40 games)ticket options, the Major LeagueBaseball club created a series ofminiticket packages (13 games) tai-lored to the specific interests andabilities of their fan base (Eisen-
gerg). In effect, fans were offeredthe opportunity to attend Brewergames on the dates (e.g., weekdays,Saturdays, and/or Sundays only)they most preferred and at the timethey most preferred (afternoon orevenings) and to watch the combi-nation of teams they most preferred,all at a substantial discount. Thenew program was enormously suc-cessful, increasing new or first-timeseason ticket sales by 41% (Eisen-gerg). Meanwhile, teams may alsowant to focus on increasing themedia coverage of their games inorder to reach fans who are notgeographically close to their fa-vorite team. For example, manycollege sport teams are focusing onincreasing the radio reach of theirgames (e.g., picking stations with awider reach, offering games overthe internet) and on increasing ac-cess to televised games (e.g., pay-per-view) in order to reach theirfans and alumni who do not live intheir geographic region.
Low-Loyalty SegmentDescriptionFinally, low-loyalty fans (lower rightquadrant of Figure 1) are those whoscored low on the PCT scale and ex-hibited low levels of behavioral loy-alty. These fans are not committedto the team and rarely support theteam by attending games or bywatching on television. It is likelythat when these fans do attendgames, it is merely for some reasonunrelated to the team itself (e.g., towatch a particular player, to watchthe opposing team, to socialize).They could drop out, and this wouldhave no psychological impact onthem and would result in almost nochange in their daily lives.
StrategyLow-loyalty consumers are themost challenging segment. Theseinfrequent or nonattending patronshold, at best, an ambivalent atti-tude toward the sports team. Con-verting this segment's behavior andpredisposition is likely to be veryexpensive, and even then, theprobability of success is low. Sheth
(1987) recommended a confronta-tion strategy for reaching this disen-franchised market. This approachrequires a direct attack on existingattitudes of the consumer. How-ever, achieving the desired changemay be very difficult. As Kiesler(1971) points out, this approachoften results in a "boomerang ef-fect" in which counterpersuasivecommunication strengthens the re-cipient's resistance to change.Moreover, the confrontationprocess is not a cost-efficient ap-proach in terms of actually turningconsumer attitudes and behavior.
A second approach would be toallow the movement of fans towardgenuine loyalty to be undertakengradually, concentrating on eitherbehavioral or attitudinal change first(i.e., movement to spuriously or la-tently loyal). Marketers could focuson increasing the behavior first. Thiscould be done by offering packagesto various groups (e.g., families,businesses) that may result in thelow-loyalty fans attending moregames, by selling the game to thelow-loyalty fans as part of an entireentertainment package, or by focus-ing on attributes other than the team(e.g., opposing team, star player). Inaddition, the rationalization strategycould be used to first focus on build-ing a level of commitment to theteam. However, both of these ap-proaches are unlikely to producehighly successful results with thissegment and may not be the bestuse of resources. Consequently,many strategists recommend focus-ing on the more attractive, less resis-tant spuriously loyal and latentlyloyal fans (Hawkins, Best, & Coney,1995; Rothschild, 1987).
SummaryIn general, the PCT scale can bevery helpful to sport marketingpractitioners who wish to use psy-chographic information to bettertarget their fans and to better assessthe current feelings about the teamamong fans and/or local residents.The scale is relatively short (it couldeven be used as part of a phone sur-vey), easy to administer, and easy to
24 Volume 9 • Number 1 • 2000 • Sport Marketing Quarterly
adjust to different team sports at dif-ferent competition levels. Use of thescale will allovk' marketers to betterassess loyalty toward their team andto be better prepared for their fu-ture. The scale can also be useful inassessing the impact of past andcurrent marketing and customer ser-vice efforts. Sport marketers whowish to move beyond the "build itand they will come" philosophy ofsport marketing should find thisscale useful in moving their market-ing efforts forward.
ReferencesBaade, R. A., & Tiehan, L. J. (1990). An
analysis of major league baseball atten-dance: 1969-1987. Journal of Sport and So-cial issues, 14, 14-32.
Backman, S. J., & Crompton, J. L. (1991a).The usefulness of selected variables for pre-dicting activity loyalty. Leisure Sciences, 13,205-220.
Backman, S. J., & Crompton, J. L. (1991 b).Using a loyalty matrix to differentiate be-tween high, spurious, latent and low loyaltyparticipants in tow leisure services. Journalof Park and Recreation Administration, 9,117.
Bureau of Economic Analysis (1996, Janu-ary/February). Survey of current business, 6.Washington, DC: U.S. Department of Com-merce.
Churchill, C. A., )r. (1979). A paradigm fordeveloping better measures of marketingconstructs. Journal of Marketing Research,16,64-73.
Cronbach, L. J. (1951). Coefficient alphaand the internal structure of tests. Psychome-trika, 76,297-334.
Crosby, L. A., & Taylor, J. R. (1983). Psy-chological commitment and its effect onpostdecision evaluation and preference sta-bility among voters. Journal of Consumer Re-search, 9, 413-431.
Dawis, R. V. (1987). Scale construction.Journal of Counseling Psychology, 34,481-489.
Day, C. S. (1969). A two dimensional con-cept of brand loyalty. Journal of AdvertisingResearch, 9, 29-35.
Dick, A. S., & Basu, K. (1994). Customerloyalty: Toward an integrated conceptualframework. Journal of the Academy of Mar-keting Science, 22, 99-113.
Eisengerg, J. (1993, October). Small-marketsuccess: How the Milwaukee Brewers sold43% more season tickets. Team MarketingReport, pp. 9-11.
Eisler, P. (1997, March 27). Guys go awryover losing. USA Today, p. 1D.
Evans, J. R., & Berman, B. (1994). Market-mg(6th ed.). New York: Macmillan.
Fazio, R. H. (1995). Attitudes as object-evaluation associations: Determinants, con-sequences, and correlates of attitude accessi-bility. In R. E. Petty & J. A. Krosnick (Eds.),Attitude strength: Antecedents and conse-quences {pp. 247-282). Mahwah, NJ:Lawrence Eribaum Associates.
Guttmann, A. (1986). Sports spectators.New York: Columbia University.
Haugtvedt, C. P., & Petty, R. E. (1992). Per-sonality and persuasion: Need for cognitionmoderates the persistence and resistance ofattitude changes. Journal of Personality andSocial Psychology, 63, 308-319.
Haugtvedt, C. P, & Wegener, D. T. (1994).Message order effects in persuasion: An atti-tude strength perspective. Journal of Con-sumer Research, 21, 205-218.
Havitz, M., & Howard, D. R. (1995). Howenduring is enduring involvement? A seasonalexamination of three sports activities. Journalof Consumer Psychology, 4, 255-276.
Hawkins, D. I., Best, R. J., & Coney, K. A.(1995). Consumer behavior: Building mar-keting strategy (7th ed.). New York: McGraw-Hill.
Howard, D. R., & Crompton, J. L. (1995).Financing sport. Morgantown, WV: FitnessInformation Technology, Inc.
Howard, D. R., & Thompson, P. (1984).The critical importance of the distributionvariable in marketing strategy. Visions inLeisure and Business, 3{2), 34-40.
International Events Group (1995). lEC'scomplete guide to sponsorship. Chicago, IL.
Jacoby, J., & Chestnut, R. W. (1978). Brandloyalty: Measurement and management.New York: Wiley.
Jacoby, J., & Kyner, D. B. (1973). Brandloyalty V. repeat purchase behavior. Journalof Marketing Research, 10, 19.
Kiesler, C. A. (1971). The psychology ofcommitment. New York: Academic Press,Inc.
Kiesler, C. A., & Mathog, J. (1971). Resis-tance to influence as a function of number ofprior consonant acts: A test. In C. A. Kiesler(Ed.), The psychology of commitment. NewYork: Academic Press, Inc.
Kiesler, C. A., & Sakamura, J. (1966). A testof a model for commitment. Journal of Per-sonality and Social Psychology, 3, 349-353.
Kraus, S. J. (1995). Attitudes and the pre-diction of behavior: A metaanalysis of theempirical literature. Personality and SocialPsychology Bulletin, 21, 58-75.
Lee, H. M. (1983). The sport fan and teamloyalty in ancient Rome. ARETE: The Journalof Sport Literature, 1, 139-145.
Mihoces, G. (1995, May 23). Fans fightpoststrike hangover. USA Today, pp. C1-C2.
Mullin, B. J., Hardy, S., & Sutton, W. A.(1993). Sport marketing. Champaign, IL:Human Kinetics Publishers.
Murrell, A. J., & Dietz, B. (1992). Fan sup-port of sports teams: The effect of a commongroup identity. Journal of Sport and Exercise
Psychology, / 4, 28-39.National Sporting Goods Association.
(1996). The sporting goods market in 1995.ML. Prospect, IL: National Sporting GoodsAssociation.
Nunnally, J. C, & Bernstein, I. H. (1994).Psychometric theory {3rd ed.). New York:McGraw-Hill.
Olson, J. C, & Jacoby, J. (1971). A con-struct validation study of brand loyalty. Pro-ceedings of the American Psychological As-sociation, 6, 657-658.
Petty, R. E., Haugtvedt, C. P., & Smith,S. M. (1995). Elaboration as a determinant ofattitude strength: Creating attitudes that arepersistent, resistant, and predictive of behav-ior. In R. E. Petty & J. A. Krosnick (Eds.), Atti-tude strength: Antecedents and conse-quences {pp. 93-130). Mahwah, NJ:Lawrence Eribaum Associates.
Pritchard, M. P, Havtiz, M. E., & Howard,D. R. (1999). Analyzing the commitment-loy-alty link in service contexts. Journal of theAcademy of Marketing Science, 27, 333-348.
Rosenberg, M. J. (1965). When dissonancefails: On eliminating evaluation apprehen-sion from attitude measurement. Journal ofPersonality and Social Psychology, 1, 28-43.
Rothschild, M. L. (1987). Marketing com-munications: From fundamentals to strategies.Lexington, MA: D. C. Heath & Company.
Schiffman, L. G., & Kanuk, L. L. (1997).Consumer behavior {6th ed.). Upper SaddleRun, NJ: Prentice-Hall.
Sheth, J. N. (1987). A normative theory ofmarketing practice. In G. Frazier & N. Sheth(Eds.), Contemporary views of marketingpractice {pp. 19-31). Lexington, MA: Lexing-ton Press.
Sloan, L. R. (1989). The motives of sportsfans. In J. H. Goldstein (Ed.), Sports, games,and play: Sociological and psychologicalviewpoints {2nd ed.; pp. 175-240). Hills-dale, NJ: Lawrence Eribaum Associates.
Smith, G. J., Patterson, B., Williams, T.,& Hogg, J. (1981, September). A profile ofthe deeply committed male sports fan. ArenaReview, 5, 26-44.
U.S. Bureau of Census. (1993). Statisticalabstract of the United States: 7 993 (113thed.). Washington, DC: U.S. Department ofCommerce.
Wakefield, K. L., & Sloan, H. J. (1995). Theeffects of team loyalty and selected stadiumfactors on spectator attendance. Journal ofSport Management, 9, 153-172.
With frequency promotion and databasemarketing. Padres expect fans to have manyhappy returns. (1996, March). Team Market-ing Report, pp. 3, 8.
Zillman, D., & Paulus, P. B. (1993). Specta-tors: Reaction to sporting events and effecton athletic performance. In R. N. Singer, M.Murphey, & L. K. Tenant (Eds.), Handbook ofresearch on sport psychology {pp. 600-619).New York: Macmillan.
Volume 9 • Number 1 • 2000 • Sport Marketing Quarterly 25