
Using the COMPUTE Block in PROC REPORT - … · Using the COMPUTE Block in PROC REPORT Jack...
68
Using the COMPUTE Block in PROC REPORT Jack Hamilton Kaiser Foundation Health Plan Oakland, California
Transcript of Using the COMPUTE Block in PROC REPORT - … · Using the COMPUTE Block in PROC REPORT Jack...

Using the COMPUTE Block in PROC REPORT
Jack HamiltonKaiser Foundation Health Plan
Oakland, California

Introduction
• This talk is intended to acquaint you with the basics of PROC REPORT. It will go fast – I don’t expect you to learn everything at one sitting. Based on feedback from an earlier presentation, I’m focusing more on PROC REPORT basics than on COMPUTE blocks.

Introduction
• You can’t do anything with PROC REPORT that you can’t do with a combination of PROC SUMMARY, PROC SORT, and data steps, but PROC REPORT may be much easier to use. It particularly excels in two areas: the display of relational (or “normalized”) data, and control of appearance through ODS (the Output Delivery System).

Introduction
• PROC REPORT is not always the answer; in particular, it is less well suited to the display of large, unsummarized data sets than is PROC PRINT.

Introduction
• Rather than giving detailed instructions about each statement and option in PROC REPORT, I will present working examples of features you might want to use.
• For the most part, this paper presents practice, not theory.

A Sample Data Set
• I will use a subset of the data set SASHELP.PRDSALE which ships with SAS. It has a reduced number of variables and a much smaller number of observations.
• The next two slides show the program used to create the sample data set and the results of a simple PROC PRINT.

A Sample Data Setproc sql;
create table smallprod asselect country,
region,prodtype,product,actual label=''format=comma10.2,predict label=''format=comma10.2,month
from sashelp.prdsalewhere mod(monotonic(), 75) = 0order by ranuni(94612);
quit;

COUNTRY REGION PRODTYPE PRODUCT ACTUAL PREDICT MONTH
CANADA EAST FURNITURE BED 983.00 851.00 Jun
GERMANY EAST OFFICE CHAIR 197.00 747.00 Mar
U.S.A. EAST OFFICE DESK 415.00 763.00 Dec
CANADA EAST OFFICE DESK 234.00 452.00 Sep
CANADA WEST OFFICE TABLE 778.00 231.00 Dec
CANADA WEST OFFICE CHAIR 838.00 98.00 Jun
U.S.A. EAST FURNITURE SOFA 662.00 566.00 Mar
GERMANY EAST FURNITURE BED 770.00 110.00 Sep
U.S.A. WEST OFFICE CHAIR 425.00 296.00 Mar
GERMANY WEST OFFICE DESK 875.00 890.00 Sep
GERMANY EAST OFFICE DESK 625.00 953.00 Dec
GERMANY WEST OFFICE TABLE 881.00 817.00 Dec
U.S.A. EAST OFFICE CHAIR 862.00 21.00 Jun
U.S.A. WEST FURNITURE BED 550.00 369.00 Jun
CANADA WEST FURNITURE SOFA 142.00 583.00 Mar
U.S.A. WEST OFFICE DESK 655.00 912.00 Sep
CANADA EAST OFFICE CHAIR 670.00 679.00 Mar
U.S.A. EAST FURNITURE BED 153.00 37.00 Sep
GERMANY WEST FURNITURE BED 468.00 576.00 Jun

A Sample Data Set• If we run PROC REPORT with virtually no
options, we’ll get output similar (but not identical) to that of PROC PRINT:
title 'Plain PROC REPORT';proc report data=smallprod
nowindows missing;run;

A Sample Data Set
Plain PROC REPORT
Product Mon
Country Region type Product ACTUAL PREDICT th
CANADA EAST FURNITURE BED 983.00 851.00 Jun
GERMANY EAST OFFICE CHAIR 197.00 747.00 Mar
U.S.A. EAST OFFICE DESK 415.00 763.00 Dec
<LINES DELETED>
GERMANY WEST FURNITURE BED 468.00 576.00 Jun

Some Basic Options
proc report data=smallprod
nowindows
missing headline headskip;
run;

Some Basic Options
Product MonCountry Region type Product ACTUAL PREDICT th---------------------------------------------------------------------------
CANADA EAST FURNITURE BED 983.00 851.00 JunGERMANY EAST OFFICE CHAIR 197.00 747.00 MarU.S.A. EAST OFFICE DESK 415.00 763.00 Dec
<LINES DELETED>GERMANY WEST FURNITURE BED 468.00 576.00 Jun

The COLUMN Statement
proc report data=smallprod
nowindows missing
headline headskip;
column country region product
month predict actual;run;

The COLUMN Statement
Mon
Country Region Product th PREDICT ACTUAL
---------------------------------------------------------------
CANADA EAST BED Jun 851.00 983.00
GERMANY EAST CHAIR Mar 747.00 197.00
U.S.A. EAST DESK Dec 763.00 415.00
<LINES DELETED>
GERMANY WEST BED Jun 576.00 468.00

The DEFINE Statement
• In some ways, the DEFINE statement is the real workhorse of PROC REPORT.
• It defines how variables are grouped, sorted, summarized, and displayed.
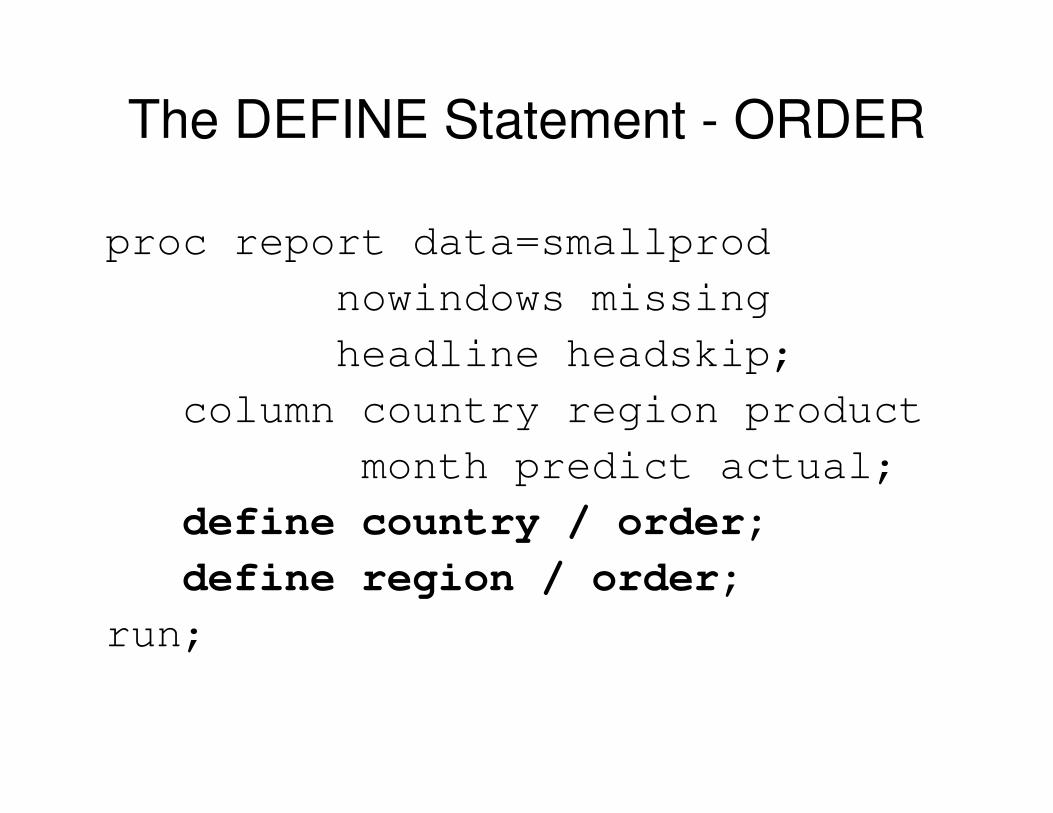
The DEFINE Statement - ORDER
proc report data=smallprod
nowindows missing
headline headskip;
column country region product
month predict actual;
define country / order;define region / order;
run;

The DEFINE Statement - ORDER
MonCountry Region Product th PREDICT ACTUAL---------------------------------------------------------------
CANADA EAST BED Jun 851.00 983.00DESK Sep 452.00 234.00CHAIR Mar 679.00 670.00
WEST TABLE Dec 231.00 778.00CHAIR Jun 98.00 838.00SOFA Mar 583.00 142.00
GERMANY EAST CHAIR Mar 747.00 197.00<LINES DELETED>

The DEFINE Statement - ORDER
Columns are ordered by their appearance in the COLUMN statement, not by the physical order of the DEFINE statements.

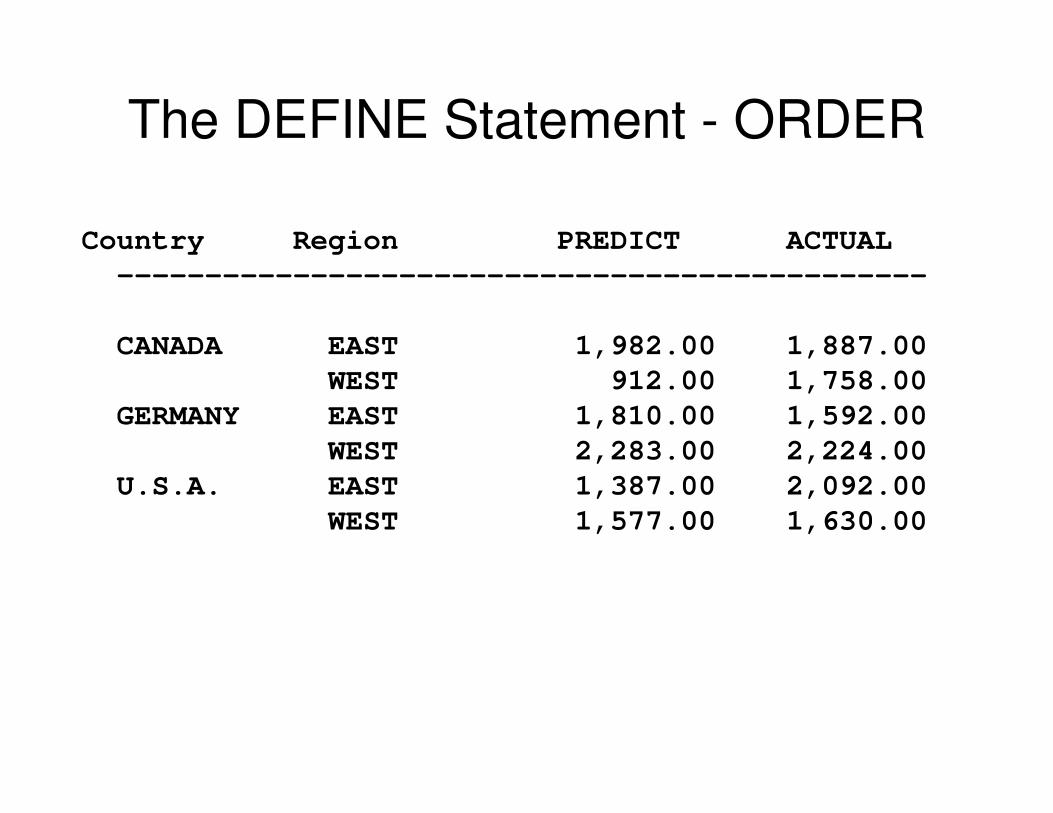
The DEFINE Statement - GROUP
The GROUP option on the DEFINE statement tells PROC REPORT that you want to create a summary report rather than a detail report, summarizing by the variables with DEFINE / GROUP.
All columns should be either GROUP variables or numeric variables to be summarized. Numeric variables are summed by default.

The DEFINE Statement - ORDERproc report data=smallprod
nowindows missing
headline headskip;
column country regionpredict actual;
define country / group;define region / group;
run;
The DEFINE Statement - ORDER
Country Region PREDICT ACTUAL----------------------------------------------
CANADA EAST 1,982.00 1,887.00WEST 912.00 1,758.00
GERMANY EAST 1,810.00 1,592.00WEST 2,283.00 2,224.00
U.S.A. EAST 1,387.00 2,092.00WEST 1,577.00 1,630.00

Formatted GroupsYou can also apply a format to a grouped variable, and the report will be sorted and grouped by the formatted value rather than the internal value:
proc format;
value $Continent
'U.S.A.', 'CANADA' = 'NA'
'GERMANY' = 'EU';
run;
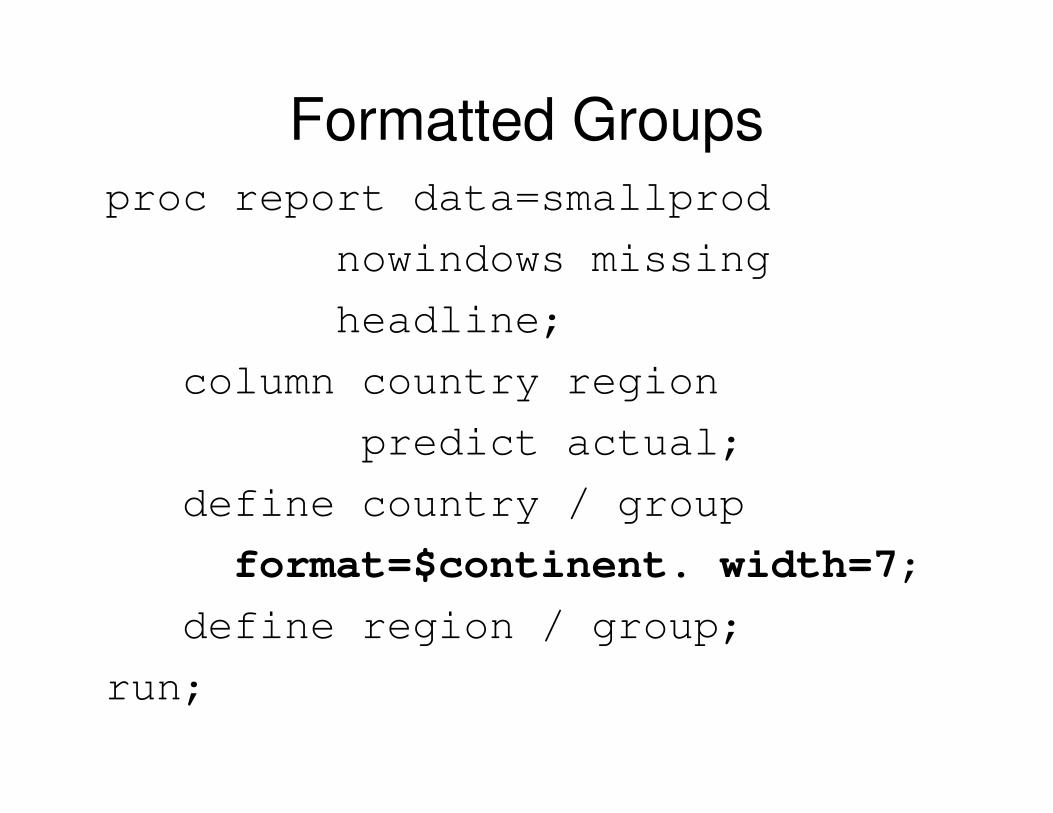
Formatted Groupsproc report data=smallprod
nowindows missing
headline;
column country region
predict actual;
define country / group
format=$continent. width=7;define region / group;
run;

Formatted Groups
Country Region PREDICT ACTUAL
-------------------------------------------EU EAST 1,810.00 1,592.00
WEST 2,283.00 2,224.00NA EAST 3,369.00 3,979.00
WEST 2,489.00 3,388.00

Other Statistics
The most common statistic is probably SUM, but other statistics (MEAN, STD, MIN, MAX, and so forth) are also available and can be specified in the DEFINE statement (only one at a time) or in the COLUMN statement.
N and PCTN can also be specified (either in the COLUMN statement, or for a particular variable).

Other Statisticsproc report data=smallprod
nowindows missing headline headskip;
column country region predict actual;
define country / group;define region / group;define predict / mean;define actual / mean;
run;

Other StatisticsCountry Region PREDICT ACTUAL----------------------------------------------
CANADA EAST 660.67 629.00WEST 304.00 586.00
GERMANY EAST 603.33 530.67WEST 761.00 741.33
U.S.A. EAST 346.75 523.00WEST 525.67 543.33

Report-Level SummarizationsYou can get overall statistics using the RBREAK statement:
proc report data=smallprodnowindows missing headline;
column country region predict actual;
define country / group;define region / group;rbreak after / summarize skip ol;
run;

Report-Level Summarizations
Country Region PREDICT ACTUAL----------------------------------------------CANADA EAST 1,982.00 1,887.00
WEST 912.00 1,758.00GERMANY EAST 1,810.00 1,592.00
WEST 2,283.00 2,224.00U.S.A. EAST 1,387.00 2,092.00
WEST 1,577.00 1,630.00---------- ----------9,951.00 11,183.00

Group SummarizationsYou can get group summarizations using BREAK statements:
proc report data=smallprodnowindows missing headline;
column country region predict actual;
define country / group;define region / group;break after country
/ summarize skip ol;run;

Group SummarizationsCountry Region PREDICT ACTUAL----------------------------------------------CANADA EAST 1,982.00 1,887.00
WEST 912.00 1,758.00---------- ---------- ----------CANADA 2,894.00 3,645.00
GERMANY EAST 1,810.00 1,592.00WEST 2,283.00 2,224.00
---------- ---------- ----------GERMANY 4,093.00 3,816.00
U.S.A. EAST 1,387.00 2,092.00WEST 1,577.00 1,630.00
---------- ---------- ----------U.S.A. 2,964.00 3,722.00

ACROSS variablesIf you define a variable using the ACROSS keyword, you will get one column in the output for each unique value of the variable.
This is helpful where data have been normalized.
This is best explained with an example.

ACROSS variablesproc report data=smallprod
nowindows missing
headline headskip;
column country region
predict actual;
define country / group;
define region / across;rbreak after / summarize skip ol;
run;

ACROSS variablesRegion
Country EAST WEST PREDICT ACTUAL
----------------------------------------------------------
CANADA 3 3 2,894.00 3,645.00
GERMANY 3 3 4,093.00 3,816.00
U.S.A. 4 3 2,964.00 3,722.00
---------- ---------- ---------- ----------
10 9 9,951.00 11,183.00

The COMMA OperatorThe default statistic for ACROSS variables is N, the number of observations with each value. This is sometimes useful, but you can also tell PROC REPORT to summarize the values of other variables in the ACROSS group using the COMMA operator (which is an actual comma, not the word “comma”).

The COMMA Operatorproc report data=smallprod
nowindows missingheadline headskip;
column countryregion , predict actual;
define country / group;define region / across;rbreak after / summarize skip ol;
run;

The COMMA OperatorRegion
EAST WESTCountry PREDICT PREDICT ACTUAL----------------------------------------------
CANADA 1,982.00 912.00 3,645.00GERMANY 1,810.00 2,283.00 3,816.00U.S.A. 1,387.00 1,577.00 3,722.00
---------- ---------- ----------5,179.00 4,772.00 11,183.00

The COMMA OperatorYou can use parentheses for grouping to get statistics for more than one variable for each across group:
column country region, (predict actual);
RegionEAST WEST
Country PREDICT ACTUAL PREDICT ACTUAL----------------------------------------------------------
CANADA 1,982.00 1,887.00 912.00 1,758.00GERMANY 1,810.00 1,592.00 2,283.00 2,224.00U.S.A. 1,387.00 2,092.00 1,577.00 1,630.00
---------- ---------- ---------- ----------5,179.00 5,571.00 4,772.00 5,612.00

The COMMA OperatorAnd you can have side-by-side groupings:
column country (region prodtype) , predict;
Region Product typeEAST WEST FURNITURE OFFICE
Country PREDICT PREDICT PREDICT PREDICT----------------------------------------------------------
CANADA 1,982.00 912.00 1,434.00 1,460.00GERMANY 1,810.00 2,283.00 686.00 3,407.00U.S.A. 1,387.00 1,577.00 972.00 1,992.00
---------- ---------- ---------- ----------5,179.00 4,772.00 3,092.00 6,859.00

The COMMA OperatorOr nested groupings:
column country (region , prodtype) ,
predict;
RegionEAST WEST
Product type Product typeFURNITURE OFFICE FURNITURE OFFICE
Country PREDICT PREDICT PREDICT PREDICT----------------------------------------------------------
CANADA 851.00 1,131.00 583.00 329.00GERMANY 110.00 1,700.00 576.00 1,707.00U.S.A. 603.00 784.00 369.00 1,208.00
---------- ---------- ---------- ----------1,564.00 3,615.00 1,528.00 3,244.00

The COMMA OperatorYou can also put a statistic keyword inside the parentheses:
column countrypredict, (Sum Mean)actual, (sum mean);
PREDICT ACTUALCountry Sum Mean sum mean------------------------------------------------------CANADA 2,894.00 482.33 3,645.00 607.50GERMANY 4,093.00 682.17 3,816.00 636.00U.S.A. 2,964.00 423.43 3,722.00 531.71
--------- --------- --------- ---------9,951.00 523.74 11,183.00 588.58

Header OptionsAt this point, the headers are getting hard to read, and it’s time to look at some options to clarify them.

Header Optionsproc report data=smallprod nowindows missing
headline split='!';column country ('= Groups =' region prodtype),
(predict);define country / group;define region / across '- Region -';define prodtype / across '- Product -!- Type -';rbreak after / summarize skip ol;
run;
=================== Groups ===================------ Product -------
------- Region ------- -------- Type --------EAST WEST FURNITURE OFFICE
Country PREDICT PREDICT PREDICT PREDICT----------------------------------------------------------CANADA 1,982.00 912.00 1,434.00 1,460.00

Column AliasesA column alias allows you to reuse an input variable, so you can get two (or more) different statistics from it.
Column aliases are created in the COLUMN statement, and in most ways they can be used like ordinary input variables.

Column Aliasesproc report data=smallprod nowindows
missing headline split='!';column country
predict predict=predictmeanactual actual=actualmean;
define country / group;define actual / sum 'Actual!Total';define actualmean
/ mean 'Actual!Mean';define predict / sum 'Predict!Total';define predictmean
/ mean 'Predict!Mean';rbreak after / summarize skip ol;
run;

Column Aliases
Predict Predict Actual ActualCountry Total Mean Total Mean----------------------------------------------------------CANADA 2,894.00 482.33 3,645.00 607.50GERMANY 4,093.00 682.17 3,816.00 636.00U.S.A. 2,964.00 423.43 3,722.00 531.71
---------- ---------- ---------- ----------9,951.00 523.74 11,183.00 588.58

StylesIf you are writing to an Output Delivery System destination that supports formatting, you can specify how your output will look.
Common ODS destinations are HTML, PDF, RTF (for Word documents), and Excel.

Stylesproc report data=smallprod
nowindows missing headline
style(header)=[font_style=roman];column country region,
(predict actual);
define country / group;
define region / across
style=[font_face=courier];rbreak after / summarize skip ol
style=[font_weight=bold];run;

Styles Region
EAST WEST
Country PREDICT ACTUAL PREDICT ACTUAL
CANADA 1,982.00 1,887.00 912.00 1,758.00
GERMANY 1,810.00 1,592.00 2,283.00 2,224.00
U.S.A. 1,387.00 2,092.00 1,577.00 1,630.00
5,179.00 5,571.00 4,772.00 5,612.00

Output Data SetYou can create an output data set using the OUT= option. The data set will contain the variables listed in the COLUMN statement plus a special variable named _BREAK_.
proc report data=smallprod
nowindows missing headline
out=reportout;

Computed ColumnsPROC REPORT allows you to compute a column based on the value of other columns. This can save you from having to write a separate data step, or a combination of data steps and PROC SUMMARYs.

Computed ColumnsWhat you can do in a compute block:
•Obtain the value of any column to the left of the computed column in the COLUMN statement.
•Assign a value to the column you’re computing using standard SAS expressions.
•Create new non-printing variables.
•Write lines of text to the output.
•Use CALL DEFINE to set certain characteristics of the data.

Computed Columnsproc report data=smallprod
nowindows missing headline headskip pspace=1;
column country region product month predict actual diff;
define country / order;define region / order;define month / order 'Mon'
order=internal;define predict / display;define actual / display;define diff / computed format=comma10.2;compute diff;
diff = actual - predict;endcomp;
run;
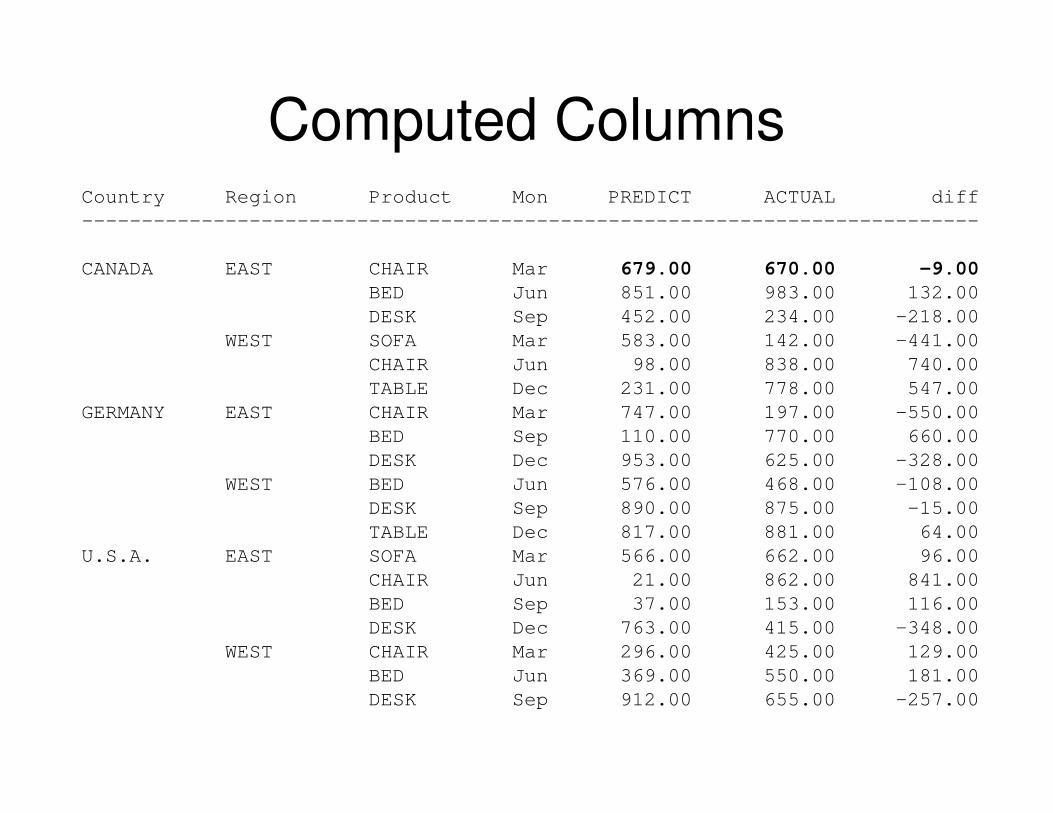
Computed ColumnsCountry Region Product Mon PREDICT ACTUAL diff---------------------------------------------------------------------------
CANADA EAST CHAIR Mar 679.00 670.00 -9.00BED Jun 851.00 983.00 132.00DESK Sep 452.00 234.00 -218.00
WEST SOFA Mar 583.00 142.00 -441.00CHAIR Jun 98.00 838.00 740.00TABLE Dec 231.00 778.00 547.00
GERMANY EAST CHAIR Mar 747.00 197.00 -550.00BED Sep 110.00 770.00 660.00DESK Dec 953.00 625.00 -328.00
WEST BED Jun 576.00 468.00 -108.00DESK Sep 890.00 875.00 -15.00TABLE Dec 817.00 881.00 64.00
U.S.A. EAST SOFA Mar 566.00 662.00 96.00CHAIR Jun 21.00 862.00 841.00BED Sep 37.00 153.00 116.00DESK Dec 763.00 415.00 -348.00
WEST CHAIR Mar 296.00 425.00 129.00BED Jun 369.00 550.00 181.00DESK Sep 912.00 655.00 -257.00

Computed Columns Based On Statistics(Important and not obvious!)
proc report data=smallprodnowindows missing headline;
column country region predict actual diff;
define country / group;define region / group;define actual / sum;define predict / sum;define diff / computed format=comma10.2;compute diff;
diff = actual.sum - predict.sum;endcomp;break after country / summarize skip ol;
run;

Computed ColumnsCountry Region PREDICT ACTUAL diff----------------------------------------------------------CANADA EAST 1,982.00 1,887.00 -95.00
WEST 912.00 1,758.00 846.00---------- ---------- ---------- ----------CANADA 2,894.00 3,645.00 751.00
GERMANY EAST 1,810.00 1,592.00 -218.00WEST 2,283.00 2,224.00 -59.00
---------- ---------- ---------- ----------GERMANY 4,093.00 3,816.00 -277.00
U.S.A. EAST 1,387.00 2,092.00 705.00WEST 1,577.00 1,630.00 53.00
---------- ---------- ---------- ----------U.S.A. 2,964.00 3,722.00 758.00

Statistics Used In Compute Blocks
• An important and very useful feature of statistics variables used in compute blocks is that they know where they’re being called from – so PREDICT.SUM in a COMPUTE block will refer to the value on its line, but PREDICT.SUM in a COMPUTE AFTER block will refer to the value for the entire report.

Statistics Used In Compute Blocks
proc report data=smallprod nowindows missingheadline ;
column country region predict s;
define country--region / group;
define s / computed format=6.2;break after country / summarize skip ol;rbreak after / summarize skip dol;compute s;
s = predict.sum;endcomp;
run;

Statistics Used In Compute BlocksCountry Region PREDICT s------------------------------------------CANADA EAST 1,982.00 1982.0
WEST 912.00 912.00---------- ---------- ------CANADA 2,894.00 2894.0
GERMANY EAST 1,810.00 1810.0WEST 2,283.00 2283.0
---------- ---------- ------GERMANY 4,093.00 4093.0
U.S.A. EAST 1,387.00 1387.0WEST 1,577.00 1577.0
---------- ---------- ------U.S.A. 2,964.00 2964.0
========== ======9,951.00 9951.0

New VariablesYou can create new variables using the assignment statement. These new variables (new in the sense that they’re not in the input data set or listed in the column statement) are automatically retained, which makes them useful for storing values for later use.

New Variables
proc report data=smallprodnowindows missing headline ;
column Obs country region product month predict;
define country / order;define region / order;define obs / computed;compute obs;
obsno + 1;obs = obsno;
endcomp;run;
Obs is a computed variable; Obsno is a new variable.

New Variables
Mon
Obs Country Region Product th PREDICT
--------------------------------------------------------------
1 CANADA EAST BED Jun 851.00
2 DESK Sep 452.00
3 CHAIR Mar 679.00
4 WEST TABLE Dec 231.00
5 CHAIR Jun 98.00
6 SOFA Mar 583.00

The LINE Statement
proc report data=smallprod nowindows missing headline ;
column country region predict actual ratio;
define country--region / group;
define ratio / computed format=6.2;
rbreak after / summarize dol;
compute ratio;
ratio = actual.sum / predict.sum;
endcomp;
compute after country;
line @10 'Country Ratio is '
@28 ratio 6.2;
endcomp;
run;
The LINE statement sends text to the output destination.
IMPORTANT! Line statements are always executed, even when placed in an IF-THEN clause which is false.

The LINE Statement
Country Region PREDICT ACTUAL ratio
------------------------------------------------------
CANADA EAST 1,982.00 1,887.00 0.95
WEST 912.00 1,758.00 1.93
Country Ratio is 1.26
GERMANY EAST 1,810.00 1,592.00 0.88
WEST 2,283.00 2,224.00 0.97
Country Ratio is 0.93
U.S.A. EAST 1,387.00 2,092.00 1.51
WEST 1,577.00 1,630.00 1.03
Country Ratio is 1.26
========== ========== ======
9,951.00 11,183.00 1.12

CALL DEFINEYou can use the special function CALL DEFINE in a compute block to dynamically control the formatting of individual rows or cells.Available only in PROC REPORTPerhaps not the best documented function in SAS.

CALL DEFINEproc report data=smallprod
nowindows missing headline;column country region predict actual ratio;define country--region / group;define ratio / computed format=6.2;break after country / summarize skip ol;rbreak after / summarize skip dol;compute ratio;
ratio = actual.sum / predict.sum;if ratio < 1 then
call define(_col_, 'style', 'style=[foreground=red]');
if ratio < 0.9 or ratio > 1.1 then call define(_col_, 'style',
'style=[font_weight=bold]'); endcomp;
run;

CALL DEFINE
Country Region PREDICT ACTUAL ratio
CANADA EAST 1,982.00 1,887.00 0.95
WEST 912.00 1,758.00 1.93
CANADA 2,894.00 3,645.00 1.26
GERMANY EAST 1,810.00 1,592.00 0.88
WEST 2,283.00 2,224.00 0.97
GERMANY 4,093.00 3,816.00 0.93
U.S.A. EAST 1,387.00 2,092.00 1.51
WEST 1,577.00 1,630.00 1.03
U.S.A. 2,964.00 3,722.00 1.26
9,951.00 11,183.00 1.12

Contact Information
Download these slides from
http://www.excursive.com/sas/
Next week, download a revised copy of the paper and code from the same location.


![Proc] Proc] Data Modell / Model Kategorie / Category ...€¦ · Proc] Proc] Data Modell / Model Kategorie / Category Energieeffizienzklasse Energieverbrauch (kWh / h / annum) Energy](https://static.fdocuments.in/doc/165x107/5ead02c5c9995c41470efc29/proc-proc-data-modell-model-kategorie-category-proc-proc-data-modell.jpg)


![Using Trees To Compute Approximate Solutions to Ordinary ...papers.rgrossman.com/proc-013.pdf · used in perturbation theory by Rand [59] and Meyer [54], in celestial mechanics by](https://static.fdocuments.in/doc/165x107/5f03991c7e708231d409d78b/using-trees-to-compute-approximate-solutions-to-ordinary-used-in-perturbation.jpg)


