Using the Cl/Br ratio as a tracer to identify the origin of salinity in ...
19
Using the Cl/Br ratio as a tracer to identify the origin of salinity in aquifers in Spain and Portugal Francisco J. Alcala ´ a, * , Emilio Custodio b a Estacio ´n Experimental de Zonas A ´ ridas, Consejo Superior de Investigaciones Cientı ´ficas (CSIC), General Segura 1, 04001 Almerı ´a, Spain b Departament d’Enginyerı ´a del Terreny, Cartogra`fica i Geofı ´sica, Universitat Polite ´cnica de Catalunya, Jordi Girona 1-3, 08034 Barcelona, Spain Received 4 January 2008; received in revised form 27 June 2008; accepted 30 June 2008 KEYWORDS Groundwater; Chloride/bromide ratio; Salinity; Recharge; Spain; Portugal Summary A study on the applicability of the Cl/Br molar ratio for identifying the origin of groundwater salinity is presented according to the experience gained in Spain and Por- tugal. Cl/Br ratios in atmospheric bulk deposition have helped to distinguish groundwater in which Cl derives only from atmospheric sources, from groundwater in which Cl is con- tributed by endogenous, lithological or anthropogenic sources. Considering the seawater Cl/Br ratio of 655 ± 4, Cl/Br ratios may be increased up to 1500 in groundwater by the addition of wastewater loaded with NaCl or leaching of solid waste, and decreased to 300 by the use of Br-based pesticides or leaching farm-animal or septic waste. Leaching and dissolution of natural and industrial NaCl, and of gypsum-rich formations containing some NaCl may yield Cl/Br ratios between one thousand and several thousand, although leaching of potassium halides near salt mines produces Cl/Br ratios below the seawater ratio. When Cl content in groundwater is not affected by extreme evaporation (up to halite saturation at 6.2 mol L 1 of NaCl) and if there are no other Cl sources, recharge by rainfall can be estimated by relating Cl in atmospheric bulk deposition to derived groundwater. The Cl/Br ratio appears to be a good tracer for discriminating non-atmo- spheric Cl contributions to groundwater, provided chemical analyses are accurate, since its variability is not wide. Data have been collected from different areas of Spain and Por- tugal and are explained and illustrated by two cases described in detail, the Don ˜ana aqui- fer in southwest Spain and the Canary Islands, both showing the mixing paths. ª 2008 Elsevier B.V. All rights reserved. 0022-1694/$ - see front matter ª 2008 Elsevier B.V. All rights reserved. doi:10.1016/j.jhydrol.2008.06.028 * Corresponding author. Tel.: +34 950 281 045; fax: +34 950 277 100. E-mail address: [email protected] (F.J. Alcala ´). Journal of Hydrology (2008) 359, 189– 207 available at www.sciencedirect.com journal homepage: www.elsevier.com/locate/jhydrol
Transcript of Using the Cl/Br ratio as a tracer to identify the origin of salinity in ...

Journal of Hydrology (2008) 359, 189–207
ava i lab le a t www.sc iencedi rec t . com
journal homepage: www.elsevier .com/ locate / jhydrol
Using the Cl/Br ratio as a tracer to identify the originof salinity in aquifers in Spain and Portugal
Francisco J. Alcala a,*, Emilio Custodio b
a Estacion Experimental de Zonas Aridas, Consejo Superior de Investigaciones Cientıficas (CSIC), General Segura 1,04001 Almerıa, Spainb Departament d’Enginyerıa del Terreny, Cartografica i Geofısica, Universitat Politecnica de Catalunya, Jordi Girona 1-3,08034 Barcelona, Spain
Received 4 January 2008; received in revised form 27 June 2008; accepted 30 June 2008
00do
*
KEYWORDSGroundwater;Chloride/bromide ratio;Salinity;Recharge;Spain;Portugal
22-1694/$ - see front mattei:10.1016/j.jhydrol.2008.06
Corresponding author. TelE-mail address: fjalcala@e
r ª 200.028
.: +34 95eza.csic
Summary A study on the applicability of the Cl/Br molar ratio for identifying the originof groundwater salinity is presented according to the experience gained in Spain and Por-tugal. Cl/Br ratios in atmospheric bulk deposition have helped to distinguish groundwaterin which Cl derives only from atmospheric sources, from groundwater in which Cl is con-tributed by endogenous, lithological or anthropogenic sources. Considering the seawaterCl/Br ratio of 655 ± 4, Cl/Br ratios may be increased up to 1500 in groundwater by theaddition of wastewater loaded with NaCl or leaching of solid waste, and decreased to300 by the use of Br-based pesticides or leaching farm-animal or septic waste. Leachingand dissolution of natural and industrial NaCl, and of gypsum-rich formations containingsome NaCl may yield Cl/Br ratios between one thousand and several thousand, althoughleaching of potassium halides near salt mines produces Cl/Br ratios below the seawaterratio. When Cl content in groundwater is not affected by extreme evaporation (up tohalite saturation at �6.2 mol L�1 of NaCl) and if there are no other Cl sources, rechargeby rainfall can be estimated by relating Cl in atmospheric bulk deposition to derivedgroundwater. The Cl/Br ratio appears to be a good tracer for discriminating non-atmo-spheric Cl contributions to groundwater, provided chemical analyses are accurate, sinceits variability is not wide. Data have been collected from different areas of Spain and Por-tugal and are explained and illustrated by two cases described in detail, the Donana aqui-fer in southwest Spain and the Canary Islands, both showing the mixing paths.ª 2008 Elsevier B.V. All rights reserved.
8 Elsevier B.V. All rights reserved.
0 281 045; fax: +34 950 277 100..es (F.J. Alcala).

190 F.J. Alcala, E. Custodio
Introduction
Chloride (Cl) and bromide (Br) ions are ubiquitous solutes inall natural water. The first is a major component, the lattera minor one. The major reservoir of water (the ocean) hasrelatively uniform Cl and Br concentrations and their Cl/Brmolar ratio is around 655 ± 4 (Fontes et al., 1986; Whitte-more, 1988; Davis et al., 1998; Custodio and Herrera,2000), although other authors report slightly higher or lowerratios, which may be explained by analytical accuracy andlocal effects.
Cl and Br ions dissolved in natural water are tracers closeto the ideal conservative behaviour due to their hydrophiliccharacter and small ionic size (Custodio and Llamas, 1983;Davis et al., 1998, 2004). Neither of them take part in signif-icant ion exchange reactions at low temperatures, nor arethey adsorbed onto mineral surfaces, and as they are sohighly soluble, they only form minerals during extremeevaporation conditions when halite starts to precipitate(Fontes and Matray, 1993; Custodio and Herrera, 2000; Her-czeg et al., 2001; Cartwright et al., 2006). This means thatthe physical processes taking place in soil (dilution, evapo-ration, transpiration, mixtures, etc.) can change the abso-lute concentrations, but do not significantly modify theCl/Br ratio of not-too-saline groundwater.
The Cl/Br ratio has been used as a tracer to determinethe origin and evolution of groundwater, surface waterand brines in oil and gas exploration (Rittenhouse, 1967;Carpenter, 1978; Freeman, 2007), and has become an effec-tive aid in hydrogeological studies of surface and groundwa-ter with low-to-moderate salinity (Whittemore, 1988;Fabryka-Martin et al., 1991; Davis et al., 1998; Vengoshand Hendry, 2001; Cartwright et al., 2006) and the contribu-tion of salinity to lakes and rivers, such as Lake Kinnerethand the Jordan River (Dror et al., 1999; Eastoe et al.,1999; Kolodny et al., 1999; Panno et al., 2006).
The Cl/Br ratio enables the origin of chloride in atmo-spheric bulk deposition and unpolluted recharge water tobe discerned (Fabryka-Martin et al., 1991; Davis et al.,1998; Edmunds, 2001). This makes it possible for the atmo-spheric chloride contribution to be distinguished from otherorigins in groundwater and then used to estimate aquifer re-charge from precipitation through the chloride mass bal-ance method (Rosenthal, 1987; Wood and Sanford, 1995;Custodio, 1997; Cartwright et al., 2006; Minor et al.,2007; Alcala and Custodio, 2007, 2008). The Cl/Br ratiocan also be helpful in identifying the groundwater flow sys-tem when salinity increases due to rock-water interaction(Fontes et al., 1986; Lehmann et al., 1993; Park et al.,2002) or to identify sources of groundwater pollution fromsurface-derived diffuse anthropogenic compounds (Vengoshand Pankratov, 1998; Hudak, 2003).
However, additional experience in real situations, takingatmospheric input into account, is also needed, either be-cause behaviour has not been well studied or because addi-tional data is required for practical Cl/Br ratio applications.The difficulty in measuring usually low Br concentrations innatural water has limited its application.
In the Iberian Peninsula (Fig. 1), widely diversified geo-logical, orographic and climate conditions (MIMAM, 2000),as well as anthropogenic activity, control the many pro-
cesses modifying the original atmospheric sources of salin-ity; multiple small aquifers are defined in Spain andPortugal whose sources of salinity are known in many casesand Cl/Br ratios change in a predictable manner. Forgroundwater recharge estimation, whether at aquifer scaleor for the whole Spanish territory, using environmentalchemical methods based on the balance of an atmospheri-cally contributed conservative solute, as the chloride ion,requires all the chloride content in shallow groundwaterto be strictly atmospheric. Therefore, atmospheric bulkdeposition was surveyed at different points throughout theterritory (Fig. 1) to find out the regional input of Cl/Br ratioscontrolling expectable baseline Cl/Br ratios in rechargewater with short residence times. For additional informa-tion contributed by the Cl/Br ratio, samples were takenfrom aquifers in Spain and Portugal (Fig. 1) with selectedwell-known recharge and groundwater flow conditions toobserve the potential applicability of the Cl/Br ratio as aneffective hydrogeological tracer to discriminate the originof groundwater salinity.
Basis for interpretation
Global generation and distribution of atmospheric Cl and Brions and other marine substances from the seawater bound-ary to the lower stratosphere via rapid deep convection de-pend on the frequency and intensity of wind and cyclonicactivity in terrestrial mid-latitudes (Eriksson, 1960; Duceet al., 1965; Cicerone, 1981). Most cloudy masses enteringover Spain and Portugal form in the tropics, and acquireCl and Br from the ocean for short and long-distance trans-port, including the generation of longer-lived brominatedand chlorinated gases (e.g., Br3CH3, Cl3CH3, etc.) andshort-lived halocarbons (e.g., Br3CH3, Br2CH2, Cl3CH,etc.), which are sources of Cl and Br that can be transportedattached to marine aerosols (Yvon-Lewis and Butler, 2002;Solomon et al., 2005; Butler et al., 2007).
Once bulk Cl and Br masses are suspended in the atmo-sphere they can be carried inland by winds. Atmospheric Cland Br availability decreases along the wind path withincreasing distance from the ocean, resulting in higher Cland Br deposition rates near the coast than inland (Eriks-son, 1960; Davis et al., 1998; Edmunds, 2001; Alcala andCustodio, 2008). Therefore, coastal rainfall Cl/Br ratiosare close to that of seawater. However, there are devia-tions caused by small differences in Cl and Br chemicalbehaviour. Both Cl and Br form small amounts of volatilecompounds, mostly CH3Cl and CH3Br with average Cl/Br ra-tios of 10–50 (Redeker et al., 2000; Goni et al., 2001), dueto organic activity near the sea surface and on the conti-nent (e.g., effect of soil biological activity, burning of veg-etation cover) that are incorporated into atmosphericgases and transported by the wind as suspended dust par-ticles. In these processes Br is favoured. This means asmall reduction from the Cl/Br ratios on the sea surface,near the coast and a much more intense effect landwardsto around 300 or less due to the increasing relative contri-bution of Br (Fabryka-Martin et al., 1991; Wilkinson et al.,1997; Davis et al., 1998, 2004; Edmunds, 2001; Solomon etal., 2005; Butler et al., 2007), even in ‘‘salares’’ (Risacheret al., 2006).

Figure 1 Location of the 24 aquifers sampled in Spain and Portugal and the 39 temporary rainfall sampling stations, includingaverage Cl/Br ratios detailed in Table 1. The main mountain ranges, hydrographic basins and relevant places mentioned in the textare marked. Shadings show altitude ranges from lighter (sea level) to darker (over 2000 m a.s.l.).
Using the Cl/Br ratio as a tracer to identify the origin of salinity in aquifers in Spain and Portugal 191
This situation may change in windy arid coastal areas,where relatively high Cl/Br ratios up to 1000 have beenfound in the atmospheric contribution (both dry and wetdeposition, and consequently in bulk deposition) in the Can-ary Islands, and southeast continental Spain (Herrera andCustodio, 2003; Alcala and Custodio, 2005). A definitiveexplanation is not available, but this is probably due tochemical fractionation during evaporation of sea dropletsgenerated by the wind on waves rims, thus producing smallhalite crystals that are transported towards the coast andsoon washed down by bulk deposition. Since halite is poorin Br (which remains mostly in the non-evaporated fraction)and goes back to the ocean, the Cl/Br ratio in coastal bulkdeposition may increase.
Other factors, such as vegetation cover, proximity to cit-ies and industrial centres, mining facilities, evaporitic rockoutcroppings, etc., can contribute locally both natural(e.g., smoke) and anthropogenic (e.g., industrial activity,fuel combustion, etc.) atmospheric dust and organic mole-cules, in both coastal and inland areas (Yvon-Lewis and But-
ler, 2002). These modify the Cl/Br ratios of local bulkdeposition, and even more so during periods of lower incom-ing marine aerosols linked to rainfall from oceans (Martenset al., 1973; Alcala and Custodio, 2004, 2005; Alcala, 2006).
Salinity in atmospheric bulk deposition controls theexpectable Cl/Br ratios in groundwater anywhere rechargewater has a short residence time in the unsaturated zone,and the contributions of non-atmospherically derivedsources of Cl and Br to groundwater are negligible. Normalsaline evapoconcentration during recharge does not changeCl/Br ratios in groundwater (Fontes and Matray, 1993; Daviset al., 1998; Edmunds, 2001).
The main natural and anthropogenic processes modifyingthe original groundwater chemical composition derivedfrom atmospheric input are known and have been relativelywell studied. Since the Cl and Br ions dissolved in groundwa-ter maintain a reasonable record of the bulk rainfall contri-bution and its Cl/Br ratio, it is possible to use the Cl/Br ratioto find out the local origin of salinity with a regional spatialdistribution of Cl/Br ratios in meteoric water. The composi-

192 F.J. Alcala, E. Custodio
tion of seawater is used as a reference to compare differ-ences in water and infer behaviour, mixing patterns and sol-ute contribution, as described below.
Evaporation of seawater does not change the Cl/Br ratioup the point when halite starts to precipitate at about6.2 mol L�1 NaCl concentration. Precipitated halite is verypoor in Br, especially in the early phases, since Br is not eas-ily included in the crystalline network. The halite Cl/Br mo-lar ratio may be up to 40,000 (Herrmann, 1972). Gypsumprecipitated in this early evaporation may contain haliteof this type (Ayora et al., 1995), but also residual brinetrapped in the rock with a ratio close to or higher than sea-water. As Cl precipitates, Br is hold in the solution, and itsCl/Br ratio decreases conspicuously, from molar ratios ofabout 655 down to about 70 in the residual brine (McCaffreyet al., 1987; Fontes and Matray, 1993; Vengosh et al., 1998;Custodio and Herrera, 2000; Taberner et al., 2000; Cart-wright et al., 2004). During the last stages of halide crystal-lization from brine, at the time K replaces Na, a fraction ofBr replaces Cl in precipitated minerals and the Cl/Br molarratio starts falling to 800, and even lower in precipitatedpotash halides such as sylvite (KCl) and carnalite(KMgCl3 Æ 6H2O), while in the residual brine, it drops to lessthan 40 (Taberner et al., 2000). In oil-field seawater-derivedbrines, Cl/Br ratios are typically in the range of 100–300,although they can vary widely (Rittenhouse, 1967; Carpen-ter, 1978; Vengosh et al., 1998).
Common solar salt production techniques employinglarge open evaporation ponds from saline lake-water or sea-water, industrial procedures, and natural and mining brinesresult in halite Cl/Br ratios between 5000 and 40,000.
Halite dissolution produces a rapid increase in Cl/Br ra-tios in water with increasing Cl concentrations (Kloppmannet al., 2001). Use of NaCl in food preparation for humansand cattle contributes Cl to urban wastewater, raising theCl/Br ratios up to >1500 (Vengosh and Pankratov, 1998). Ingeneral, wastewater tends to have a high Cl/Br ratio dueto the use of halite in the home and many commercial andindustrial processes, but not always, because of many otherinfluences, as shown in Vengosh et al. (2005).
The dissolution of Br-rich evaporitic salts from the finalstages of seawater evaporation (e.g., sylvite, carnalite)may produce low Cl/Br molar ratios, less than 100. How-ever, this only occurs in mining areas or where theseminerals are especially abundant, such as in the mid-Llob-regat basin, Barcelona (Ayora et al., 1995; Taberner etal., 2000) or when potash salts are used as an agrochem-ical fertiliser. The dissolution of Cl-bearing contaminantssuch as chlorinated solvents (or their degradation prod-ucts), or salt used for road de-icing may also increasethe Cl/Br ratios, while contamination by volatile hydro-carbons from combustion of automotive fuels or Br-basedhalocarbons, mainly ethyl dibromide, and methyl bromideused as soil disinfectants and pesticides to control nema-todes and weeds in agriculture, may reduce the Cl/Br ra-tio to below 300, and sometimes under 50 (Davis et al.,1998). The use of some of these compounds is currentlyforbidden in many countries – including Spain – due totheir toxicity, but the effect of past applications in soiland groundwater may be long-lasting, even though inmany areas they have been replaced by other agrochem-icals (Bello et al., 2001; De Cal et al., 2005).
Volcanism is a source of halide emissions to the atmo-sphere and directly into groundwater. Magma containsmoderate quantities of Cl and Br that are released as itcools and solidifies, both as gases (HCl, HBr, Br-oxides)or dissolved in exolved water (vapour or liquid). Cl/Br ra-tios of halides in magma and resulting rocks vary frommuch lower (2 after Bureau and Metrich, 2003) to higherthan the seawater ratio, and are variable in exolvedgases, about 1500 in gases from the recent eruption ofMt. St. Helens (Fruchter et al., 1980), and about 40 inair from active Mt. Etna. In highly saline lakes receivingvolcanic gases and ‘‘solfaratas‘‘ in Indonesia, the Cl/Brratio is 255 (Delmelle and Bernard, 1994), and 70–1600in Indonesian/Java volcanoes and about 225 in recent vol-canic eruptions on Montserrat Island (Bobrowski et al.,2003). In general Cl is released more easily than Br (Aiup-pa et al., 2005; Schaefer and Fegley, 2005). Br concentra-tions are negatively correlated with pressure in H2O-saturated silicic melts (as volcanic glasses) and directlycorrelated with SO2 released (Bureau and Metrich,2003). The tendency for mineral hydration during degas-sing increases Cl/Br ratios up to 1000 in water.
Both Cl and Br ions, atmospherically-contributed or pre-meditatedly added, can be adsorbed in soil organic matterto some extent (Gerritse and George, 1988; Oberg and Sand-en, 2005), thus changing the Cl/Br ratio in water, but thisbarely affects recharge water as a steady state is easilyachieved. However, changes in land use may induce strongrelease of Br when forest is cleared and organic matter insoil and terrain is oxidized (e.g., by ploughing), thus reduc-ing the Cl/Br ratio. Intensive organic retention of Cl was re-ported by Hudak (2003) from farm-animal waste leachates,yielding Cl/Br ratios around 200–350.
Cl/Br ratios allow identifying groundwater whose salinityderives from atmospheric sources, but this groundwatercomposition may be changed by mixing with another typeof water or by adding a solid solute with a given Cl/Br ratioto it. A basic formulation for quantifying these common pro-cesses is presented in Appendix A. Some scenarios of watermixtures and solid solute additions to water evolving differ-ently have been considered (Fig. 2). The result is commonlyshown by plotting the Cl/Br ratio vs. Cl.
Analytical methods
The Cl/Br ratio, also indicated as R, (given this way to yieldvalues greater than 1) is expressed here as the molar ratio,which is 2.253 times the weight ratio.
Accurate measurement of the chloride ion concentrationdoes not involve any special difficulty, except at <1 mg L�1
concentrations, which is not common in groundwater, butdoes occur in continental rainwater. In freshwater, the bro-mide ion appears most often at <1 mg L�1 concentrations,and frequently at <10 lg L�1, which means that improvedanalytical methods are required.
Common spectrometric analytical methods for Br deter-mination do not provide the required accuracy, while theion-selective electrode method has variable interferenceat the expected Cl/Br ratios. The colorimetric method, inwhich the evolution of a controlled reaction is halted at aprecise time, and high performance liquid (anionic) chroma-tography (HPLC) are accurate enough for Br determination

Figure 2 (a) Mixing scenarios for real freshwater incorporating a fraction of more or less saline water with RI < RA, RI = RA andRI > RA, where R is the Cl/Br molar ratio, and I and A are initial and added water denoted as subindices. (b) Freshwater with a given Rdissolving an amount of solid solute S per unit water volume, where r = cl/br (molar concentration of Cl and Br in the solid), andRI < r, RI = r and RI > r. Mixing of end-members are plotted in an R vs. Cl follow a curve with an unchanging slope and in a 1/R vs. 1/Cllinear plot. Axes remain linear.
Using the Cl/Br ratio as a tracer to identify the origin of salinity in aquifers in Spain and Portugal 193
in natural water and rainfall, as they allow efficient separa-tion of Cl and Br peaks and accurate measurement of Br at<5 lg L�1 concentrations (Davis et al., 2004), with a re-ported detection limit of 1 lg L�1. In no case is there inter-ference between the Br peak and the nearby NO3 peak. Brmeasurement uncertainty is also low with the neutron acti-vation method (Koglin, 1984), but this method was not em-ployed here.
Cl and Br concentrations were analysed by the GeologicalSurvey of Spain (IGME) Laboratory following the EPA 300 1Amethod (Hautman and Munch, 1997) on filtered unacidifiedsamples. A DIONEX 600� high-performance liquid (anionic)chromatograph was used. Due to large differences in majorand minor component concentrations in a sample, they haveto be analyzed in two different chromatographic runs usingeither different sensitivity settings on the detector or dif-ferent sample dilutions. A complete chromatographic runlasts 17 min. An IonPac AS9-HC� analytical column was usedin combination with the AG9-HC� guard column. The eluentis Na2CO3 9 mM at a flow rate of 1.25 mL. The detection sys-tem is suppressed electrical conductivity. The injectionloop capacity is typically 25–250 lL. For low concentrationsof analytes, larger injection loops can be used to increasesensitivity, up to 2500 lL. The dilution is calculated forthe best concentration for efficient measurement.
The analytical sensitivity to separate Cl and Br peaks wasdeveloped from 2001 to 2006 and was progressively cor-rected using certified Aquacheck Programme calibrationstandards plus a blank. The calibration standards wereanalysed during the run to monitor drift. For a Br betweenabout 20 and 90 lg L�1 and a Cl between about 5 and100 mg L�1 for weakly mineralized natural water, includingrainwater, the IGME and Aquacheck certified intercalibra-tion means differ by �0.04 ± 4.46% for Br and �0.92 ±5.19% for Cl.
Overall analytical accuracy, given as relative errorthrough the coefficient of variation (CV = standard deviation(1r)/mean), was based on replicate analyses of internalstandards and samples within and between runs (Custodioand Alcala, 2004; Vazquez and de la Fuente, 2007). Aliquotsof groundwater and rainwater samples with Cl/Br ratiosclose to that of seawater (655) were analysed independentlyto ensure the accuracy of both anion assessments. The errorfor Cl concentrations over 0.5 mg L�1 was around ±3%; for Brconcentrations over 1 lg L�1 it was around ±8% improving to±3% for Br concentrations over 5 lg L�1, resulting in an errorof around ±6% for water in which the Cl/Br ratio is close toseawater. The error is less than ±8% for water with low Brconcentration and Cl/Br ratios over 1500 (e.g., waterincluding natural or industrial halite) and ±4% for water with

194 F.J. Alcala, E. Custodio
high Br concentrations and Cl/Br ratios below 300 (e.g.,water including anthropogenic Br-based compounds). Theseresults are similar to those reported by Stevens (1990) andDror et al. (1999), and slightly better than reported by Veng-osh and Hendry (2001) and Cartwright et al. (2006), whoboth used ion chromatography in moderately salinesamples.
Results
A study on the applicability of the Cl/Br ratio to know theorigin of groundwater and rainwater salinity in Spain andPortugal was carried out from 1998 to 2005. First criteriawere needed for selecting groundwater samples with salin-ity derived from atmospheric sources in order to estimateaverage recharge by rainfall to Spanish aquifers throughthe chloride mass balance method (Alcala and Custodio,2007, 2008).
An atmospheric deposition sampling network was set upto determine the saline input to land at 39 sites in Spainand Portugal (Alcala and Custodio, 2008; Fig. 1 and Table 1),by collecting atmospheric bulk deposition (in open collec-tors), wet deposition (saline content in rainwater measuredby means of samplers that only open when there is rain),and dry deposition (the saline content directly depositedon the land surface in the form of airborne dust or atmo-spheric aerosols). The sampling network was designed to ac-quire data on the Cl/Br ratios in bulk deposition underdifferent atmospheric conditions, covering locations at dif-ferent altitudes and distances from the coast. Cl/Br ratiosaround or higher than seawater were found at unpollutedcoastal fringes of the Atlantic Ocean and the MediterraneanSea, decreasing to less than 200 in the centre of the IberianPeninsula (e.g., stations d01, d02, d18; Fig. 1 and Table 1).Cl/Br ratios up to 1000 and occasionally up to 2000 werefound at semiarid to arid coastal fringes in the southeastIberian Peninsula and southern Canary Islands (e.g., stationsd28, d32–d39; Fig. 1 and Table 1), where there is a strongdry deposition component of up to 50% of total deposition(Alcala and Custodio, 2008).
A large number of natural and anthropogenic sources ofsalinity in Spain and Portugal modify the groundwater Cl/Br ratios in rainfall. Some stations located in the majorSpanish River basins (Ebre, Duero, Tajo) and other minor ba-sins such as Guadix (Granada), where there are outcrops ofsedimentary Neogene lithology, including gypsum forma-tions. Lithology contributes a natural source of salinity toatmospheric bulk deposition through wind-blown halite rais-ing the Cl/Br ratios up to 800 and occasionally up to 1000(e.g., stations d03, d12, d15, d17, d27; Fig. 1 and Table 1).
Other stations were installed in polluted urban and indus-trial coastal and inland areas. Bulk deposition in the pol-luted urban and industrial coastal areas around Barcelona(stations d05–d07; Fig. 1), Aveiro (stations d09–d11; Fig.1), in Donana (downwind Huelva) (stations d22–d23; Fig.1), and in intensive agricultural exploitation under green-houses in Campo de Dalıas (Almerıa), shows Cl/Br ratios be-low the seawater ratio (station d30; Fig. 1). Combustion ofautomotive and industrial fuels, burning plastic and gar-bage, etc., contribute additional sources of salinity to mar-ine aerosols with more Br than Cl (Martens et al., 1973;
Alcala and Custodio, 2004). The cause may be the releaseof Br-rich volatile compounds used as soil disinfectantsand pesticides in intensive agriculture, or contributed byhydrocarbon processing plants and combustion facilities(Querol et al., 2002; De Cal et al., 2005).
From previous experience in Spain and studies dealingwith hydrogeology, geochemistry and isotopic data (Custo-dio and Herrera, 2000; Alcala and Custodio, 2005; and refer-ences included in Table 2), 22 aquifers in continental Spainand the Balearic Islands, the Cretacic coastal aquifer in Ave-iro (Portugal), and scattered areas in the Canary Islands,were selected for surface and groundwater sampling (Fig.1). Salinity described in these surveys may be divided intothe following six main processes contributing to salinity (Ta-ble 2): (i) current and relic seawater contributions to fresh-water (including seawater-derived brines), (ii) rechargewater produced under different climatic, orographic andenvironmental conditions, (iii) leaching of natural evapor-ites contributing NaCl, (iv) endogenous degassing in volcanicareas, (v) urban, industrial and anthropogenic NaCl and Br-based compounds, and (vi) leaching of potassium halidesnear potash mines. Moreover, other significant subprocesseswere defined to further specify these main sources ofsalinity.
The search for information was thorough but not exhaus-tive. Further information may be found in Gimenez and Mor-ell (1997) on marine intrusion in the Oropesa-Torreblancaaquifer (Castello de la Plana) (Fig. 1), where backgroundCl/Br ratios are about 500 and even lower, and Sanchez-Martos et al. (2002), who provide information on the semi-arid Andarax alluvial aquifer (Almerıa) (Fig. 1).
The Cl/Br ratio was studied in data pooled from 600 sam-ples taken for this survey and from previous studies. The ori-ginal relative amount of freshwater mixing with other wateror dissolving a solid solute controls the magnitude of eachsaline process observed in each aquifer and their range ofvariation. Although the magnitude is similar in all the aqui-fers, there are extreme cases representing saline end-mem-bers. Table 2 summarizes the mean Cl/Br ratio and theestimated standard deviation (1r) for each aquifer salinityprocess.
Due to the large amount of data generated, only two se-lected aquifer areas are described below by way of exampleto show the methodology and data treatment: the Almonte-Marismas aquifer (Donana), and selected samples fromwells, springs and galleries in Gran Canaria, Tenerife, LaPalma and Fuerteventura (Canary Islands). Alcala (2006)provides a more detailed discussion of Cl concentrationsand Cl/Br ratios in each sample, along with a short descrip-tion of the main hydrogeological properties (type and rateof recharge, groundwater flow system, hydrogeochemistry,etc.) of each aquifer at the website [http://www.tesis-enxarxa.net/TDX-0607106-104930/].
Almonte-Marismas aquifer (Donana)
The Almonte-Marismas aquifer system, also known as Don-ana aquifer (aquifer 20; Fig. 1), is a Plio-Quaternary detriticformation with an impermeable base consisting of Plioceneto Miocene sandy clays and marls. Towards the north andwest, this coastal plain consists of Quaternary fluvio-marine

Table 1 Location, sampling period, average Cl/Br molar ratio, yearly atmospheric bulk Cl deposition rate (A) and average Cl content from temporary rainfall sampling stationsinstalled in Spain and Portugal
Station Code Coordinates Elevation(m a.s.l.)
Sampling period n Cl/Br molar A(g m�2 year�1)
Cl(mg L�1)
Type ofdepositionFrom To
Santiago d01 42�52 0N 8�31 0W 285 19 March 2001 10 September 2002 540 658 3.9 3.0 BulkQuintana d02 43�22 0N 5�31 0W 377 30 March 2001 02 August 2002 490 725 2.8 3.0 BulkHuerta del Rey d03 41�50 0N 3�20 0W 1007 29 March 2001 19 August 2002 508 890 0.4 0.8 BulkSierra de Vicort d04 41�22 0N 1�29 0W 1383 04 April 2001 02 August 2002 485 620 0.3 0.7 BulkBarcelona d05 41�23 0N 2�06 0E 125 01 March 1999 04 Apilr 2003 1495 575 4.0 6.1 BulkEl Prat de Llobregat d06 41�15 0N 2�05 0E 20 15 September 1903 09 September 2005 725 669 7.5 15.1 BulkEl Prat de Llobregat d07 41�15 0N 2�05 0E 20 10 September 2003 31 July 2004 325 865 1.7 20.6 DryBruguers d08 41�19 0N 1�57 0E 277 17 February 2005 05 February 2006 353 604 2.7 3.3 BulkAveiro d09 40�38 0N 8�39 0W 3 01 October 1985 01 October 1989 1461 496 4.8 5.3 BulkAlbergaria a Velha d10 40�41 0N 8�28 0W 131 01 October 1985 01 October 1989 1461 349 4.6 3.6 BulkOliveira do Bairro d11 40�31 0N 8�29 0W 60 01 October 1985 01 October 1989 1461 329 3.6 3.4 BulkLa Bastida d12 40�34 0N 6�03 0W 1114 29 March 2001 06 September 2002 526 812 0.4 0.7 BulkEl Casar d13 40�42 0N 3�25 0W 831 22 May 2001 07 December 2002 564 407 0.4 0.9 BulkCuenca d14 40�03 0N 2�07 0W 998 03 April 2001 01 August 2002 485 519 0.2 0.5 BulkSotos d15 40�12 0N 2�09 0W 991 01 March 2001 06 March 2001 5 818 0.3 5.5 WetSiete Aguas d16 39�29 0N 0�54 0W 799 30 March 2001 04 September 2002 523 749 1.0 1.5 BulkRoquetes d17 40�49 0N 0�30 0W 50 16 October 2002 04 November 2003 384 821 1.1 1.6 BulkSta. M. del Camı d18 39�38 0N 2�45 0E 230 05 April 2001 02 August 2002 484 678 0.8 5.2 BulkSan Pablo d19 39�33 0N 4�21 0W 917 10 October 2002 10 November 2003 396 375 0.6 0.5 BulkTaibilla d20 38�08 0N 2�18 0W 940 08 December 2004 02 January 2005 25 193 0.4 0.8 BulkCartagena d21 37�36 0N 0�58 0W 55 15 October 2004 02 November 2004 18 828 5.8 9.2 BulkChemical Huelva d22 37�17 0N 6�59 0W 10 14 October 1999 07 September 2000 329 169 0.7 5.9 DryPhosphate Huelva d23 37�13 0N 6�56 0W 10 20 July 1999 23 December 2000 522 1344 1.8 74.5 DryHuelva coast d24 37�13 0N 7�01 0W 5 23 October 1999 29 December 2000 433 1430 2.2 62.8 DryDonana d25 36�59 0N 6�26 0W 5 30 November 2000 27 December 2001 392 525 1.2 4.1 BulkPenarroya d26 38�18 0N 5�16 0W 577 30 March 2001 30 September 2002 549 670 0.5 0.8 BulkDehesas de Guadix d27 37�35 0N 3�06 0W 674 30 January 2001 29 August 2002 576 1044 1.4 3.1 BulkAdra d28 36�45 0N 3�00 0W 25 15 December 2002 15 March 2004 456 1085 5.1 15.8 BulkLas Yeguas d29 37�05 0N 3�01 0W 1971 15 March 2002 01 April 2002 17 225 0.3 1.0 BulkGuainos d30 36�45 0N 3�04 0W 85 08 June 2004 21 July 2004 43 473 2.1 5.7 BulkOhanes d31 37�03 0N 2�45 0W 1020 03 March 2001 01 May 2001 59 517 0.8 2.1 BulkUniversity of Almerıa d32 36�50 0N 2�23 0W 20 04 March 2001 30 August 2002 544 1241 5.3 9.8 BulkMorro Besudo d33 27�46 0N 15�31 0W 50 05 December 2001 14 February 2002 71 1085 1.1 19.3 BulkDepuradora d34 28�00 0N 15�48 0W 14 31 October 2000 03 May 2002 549 1788 25.1 348.8 BulkTabladas d35 27�59 0N 15�46 0W 188 31 October 2000 30 April 2001 181 836 6.2 51.0 BulkArtejevez d36 27�58 0N 15�47 0W 338 31 October 2000 03 May 2002 549 2428 2.9 30.6 BulkPozo Negro d37 28�19 0N 13�56 0W 90 02 December 1999 06 December 1999 4 2523 3.8 11.7 BulkPajara d38 28�20 0N 14�06 0W 190 02 December 1999 06 December 1999 4 1147 10.6 18.8 BulkMorro Velosa d39 28�26 0N 14�02 0W 680 02 December 1999 06 December 1999 4 1575 7.4 31.5 Bulk
n is the number of days with a continuous precipitation record analysed.
Usin
gtheCl/B
rratio
asatrace
rto
identify
theorigin
ofsalin
ityin
aquife
rsin
Spain
andPortu
gal195

secnerefer dna srefiuqA
fo sessecorp niaM noitisiuqca ytinilas
sessecorp-buS
01. D
etri
tic
aqui
fer
of B
adal
ona
(Mon
tes
and
Váz
quez
-Suñ
é,
2005
)
02. L
lobr
egat
pot
ash
min
ing
area
(S
oler
et a
l., 2
002)
03. L
lobr
egat
low
er v
alle
y an
d Sa
nt
And
reu
basi
n (C
usto
dio,
199
4)
04. L
lobr
egat
del
ta (
Irib
ar e
t al.,
19
97)
05. T
ord
era
delta
(Fa
lgàs
et a
l.,
2004
)
06. S
egar
ra-U
rgel
l aqu
ifer
s (P
ascu
al a
nd B
ayó,
199
1)
07. E
bre
delt
a (B
ayó
et a
l., 1
997)
08. L
os M
oneg
ros
basi
n (C
asta
ñeda
and
Gar
cía-
Ver
a,
2008
)
09. S
erra
de
Tra
mun
tana
-Cal
vià
(Lóp
ez a
nd M
ateo
s, 2
003)
10. D
etri
tic
aqui
fer
of M
adri
d (F
erná
ndez
-Urí
a et
al.,
198
5)
11. L
os A
rena
les
aqui
fer
(Ceb
allo
s-B
arba
ncho
et a
l., 2
008)
12. C
reta
cic
aqui
fer
of A
vei
ro
(Con
dess
o de
Mel
o et
al.,
200
1)
13. L
as V
icto
rias
aqu
ifer
(IT
GE
-D
GO
HC
A, 1
999)
14. T
ertia
ry a
quif
er o
f To
rrev
ieja
(I
TG
E, 1
994)
15. C
ampo
de
Dal
ías-
Sier
ra d
e G
ádor
aqu
ifer
s (C
ontr
eras
et
al.,
2008
)
16. S
ierr
a N
evad
a ra
nge
(Gis
bert
et
al.,
1998
)
17. D
ehes
as d
e G
uadi
x de
triti
c aq
uife
r (M
oren
o et
al.,
200
0)
18. F
uent
e de
Pie
dra
lago
on b
asin
(K
ohfa
hl e
t al.,
200
8)
19. N
iebl
a-P
osad
as a
quif
er
(Man
zano
et a
l., 2
001b
)
20. A
lmon
te-M
aris
mas
aqu
ifer
(C
usto
dio
et a
l., 2
001)
21. A
mur
ga m
assi
f (C
usto
dio,
19
92)
22. B
etan
curi
a m
assi
f (H
erre
ra a
nd
Cus
todi
o, 2
003)
23. L
a A
ldea
aqu
ifer
(C
abre
ra e
t al
., 20
00)
24. T
ener
ife,
Gra
n C
anar
ia, L
a Pa
lma
wel
ls, s
prin
gs a
nd
galle
ries
(V
egee
r, 1
991)
nigiro retawaeS .1
retawaeS .a.1 1=n 1=n
646 685
noisurtni retawaeS .b.1 2=n 21=n 21=n 8=n 3=n 4=n 7=n 22=n 66=n 2±686 66±467 02±146 95±656 82±746 02±256 42±936 47±747 08±326
senirb retawaeS .c.12=n 1=n 5=n 2=n
23±146 066 87±916 9±147
sretaw egrahceR .2
saera latsaoC .a.2 2=n 2=n 3=n 42=n 2=n 01=n 01=n
61±656 7±466 91±326 34±346 73±595 05±146 05±957
saera dnalnI .b.2 5=n 2=n 64=n 7=n 1=n 01=n
86±206 77±465 46±753 63±145 044 841±565
/ edutitla hgiH .c.2 latnenitnoc
1=n 2=n 1=n 7=n 02=n693 11±905 522 38±933 39±484
etamilc dira latsaoC .d.2 7=n 4=n 02=n 1=n 6=n
693±4711 41±007 631±138 4601 961±189
saera detullop latsaoC .e.24=n 71=n 11=n
43±944 401±174 84±784
setiropave larutaN .3 etilah fo gnihcaeL .a.3
31=n 5=n 1=n 1=n 1251±1815 149±4374 1164 6555
muspyg fo gnihcaeL .b.3 etilah gniniatnoc
1=n 01=n 11=n 1=n 11=n 2=n 61=n 1=n 9=n7447 759±5331 933±7441 649 131±095 64±027 26±687 4372 592±8271
nigiro cinacloV .43=n 6=n
51±828 524±6401
lairtsudni ,nabrU .5 cinegopohtna dna
nigiro
desab-rB fo esU .a.5 erutlucirga ni sedicitsep
8=n 4=n 6=n 2=n 7=n 821±204 86±613 47±817 641±572 53±692
lairtsudni fo gnihcaeL .b.5 etilah
1=n 1=n 5776 3474
egabrag fo gnihcaeL .c.5 etsaw dilos dna
8=n 4=n 2=n 31=n03±548 19±308 28±276 26±657
nabru fo gnihcaeL .d.5 retawetsaw
7=n 7=n 5=n 3=n 4=n 41=n 1=n 7=n 1=n 2=n 1=n 971±3301 98±259 663±0831 54±7021 296±8561 013±388 4811 712±3601 0051 6±839 2101
citpes fo gnihcaeL .e.5etsaw
2=n87±364
fo gnihcaeL .6 sedilah muissatop senim tlas dnuora
etilanrac fo gnihcaeL .a.62=n
14±805
etivlys fo gnihcaeL .b.63=n
23±553
noitatolf rof tneulffE .c.6spmud
7=n 41=n 28±775 83±577
Table 2 Average Cl/Br molar ratio and standard deviation (1r) found for the main salinity processes and subprocesses in 24 aquifers in Spain and Portugal
Columns show the aquifers selected and a reference guide describing their main hydrogeological properties (aquifer location and code are shown in Fig. 1). n is the number ofsamples taken from each aquifer for each process and subprocess.
196F.J.
Alcala
,E.Custo
dio

Using the Cl/Br ratio as a tracer to identify the origin of salinity in aquifers in Spain and Portugal 197
and aeolian sand formations which make up the main uncon-fined regional rainfall recharge area. Towards the south-east, detritic marine and fluvio-deltaic facies develop(Salvany and Custodio, 1995). The fluvio-deltaic facies areconfined under estuarine clayey silts and are topped by tidaland fluvial marsh deposits in which there is now a large tem-poral marsh, which can include saline and hypersaline relicseawater in more distal deltaic-marine deposits (Custodio etal., 2001; Manzano et al., 2001a). The coastal fringe is occu-pied by active Holocene dune belt systems, containing phre-atic lagoons occupying depressions at the inner boundary ofthe dune belts in a gently rolling landscape.
Precipitation comes from the Atlantic Ocean and aver-ages 550 mm year�1 at the Palacio de Donana (5 m a.s.l.).Rainwater is the only source of diffuse recharge. A small riv-er base flow, springs, oozings at the coast and in the marsh,and pumping for urban and irrigation supply along its outerboundary are the main discharges (ITGE, 1992; Suso and Lla-mas, 1993; Custodio and Palancar, 1995). Donana has impor-tant groundwater-dependent wetlands (Custodio, 2000;Manzano et al., 2001a).
Hydrogeological, hydrochemical and isotopic knowledgegained during recent decades (Custodio et al., 2001; Manz-ano et al., 2001a) has shown the main sources of naturalsalinity in the area. These studies also provide informationabout anthropogenic processes modifying current or naturalrelic sources of salinity. Forty samples were taken of wateraffected by natural and anthropogenic sources of salinity,some of them from the same sampling point on differentdates (Table 2). Every sample was classified according tothe origin of its salinity into six groups (Fig. 3): (i) rainwater,(ii) unpolluted old phreatic water, (iii) recent phreaticwater, (iv) polluted phreatic water, (v) saline and hypersa-line relic seawater, and (vi) water affected by wastewater.
The Cl/Br ratios in rainwater may be divided into twogroups (end-members) with intermediate situations (Fig.3). Cl/Br ratios are similar to seawater during prolongedwinter and spring rainfall events coming from the AtlanticOcean; this dataset includes typically marine ionic ratios.Prolonged dry periods during summer and autumn followedby short, intense rainfall events produce Cl/Br ratios belowthat of seawater. This dataset sometimes has SO4 and NO3
content as high as 15 and 10 mg L�1, respectively. Atmo-spheric bulk deposition in the Donana area may include a lo-cal contribution from past use of volatile Br-basedpesticides in intensive agriculture (e.g., disinfection of san-dy soils with methyl-bromide) and pollutants from Huelva’schemical factories to the west (Querol et al., 2002), wherepreliminary studies on atmospheric dry deposition show Cl/Br ratios between 200 and 500 (stations d22–d23; Fig. 1 andTable 1). Dry deposition at the coastline shows Cl/Br ratiosup to 1000 (station d24; Fig. 1 and Table 1).
There are several types of salinity and Cl/Br ratio rangesin groundwater. End-member samples explain and quantifywater mixtures, unaffected freshwater, or the addition ofsolid solutes. Four of these processes have been studiedand plotted (Fig. 3).
Curve I in Fig. 3 is a horizontal evaporation line affectingunpolluted rainwater and producing unpolluted old phreaticwater, i.e., groundwater with a relatively long residencetime (tens of years for deep groundwater), having Cl/Br ra-tios between 600 and 700 (Table 2) for Cl between 15 and
30 mg L�1. The range of Cl/Br ratios is similar to that of sea-water and may be explained by decades of airborne marineaerosols from the nearby coast.
Curve II is a horizontal mixing line of unpolluted old phre-atic water with salinity derived from unpolluted marineaerosols, with saline and hypersaline relic seawater caughtin sediments (Fig. 3). Brackish and salty groundwater fromthe inflow of estuarine seawater trapped in marshes hasCl/Br ratios around that of seawater (Table 2). The gradualcontribution of unpolluted freshwater to the saline andhypersaline relic seawater is concentrated around ahorizontal mixing line with varying Cl/Br ratios similar toseawater. Only one hypersaline sample representing evapo-concentrated relic seawater from the marsh has a Cl/Br ra-tio below 500 which may be explained by organic activitycommonly affecting such saline water.
Curve IIIa is a horizontal evaporation line starting frompresent polluted rainwater, with average Cl/Br ratiosaround 500, producing phreatic water with similar Cl/Br ra-tios (Fig. 3). The use of this recent phreatic water for irriga-tion only produces evapoconcentration, which does notaffect the original Cl/Br ratio of regional bulk deposition.It was sampled at the high/middle part of Rocina Creek, arepresentative groundwater drainage area with a short res-idence time, partly occupied by intensive agriculture. CurveIIIb is an upward convex mixing line of this evapoconcentrat-ed phreatic water bearing agrochemicals derived from Br-based pesticides, as methyl-bromide, formerly used insandy areas for soil fumigation in greenhouse strawberryproduction. Cl/Br ratios vary from 500, similar to averagerainwater, to 350. A Br contribution is inferred up to0.41 mg L�1 (Fig. 3). While baseline NO3 concentration innatural areas is around 20 mg L�1 or less, NO3 concentra-tions may be locally up to 200 mg L�1 due to the use of fer-tilizers (Manzano et al., 2001a).
Curve IV is an upward concave line of wastewater thatincludes dissolved NaCl in unpolluted old phreatic water(Fig. 3). The contribution of wastewater from domestic foodpreparation and cattle feeding increases the Cl/Br ratios upto 1000. This phreatic water, sampled in an open well at anisolated farm, shows Cl increases of up to 10.9 mg L�1.
A local seawater sample taken from Torre de La HigueraBeach, in Matalascanas, shows slightly reduced salinity anda Cl/Br ratio of around 590. Although pollution by direct orindirect disposal of effluents or recent local groundwaterdischarge may cause some dilution, it should not signifi-cantly affect the marine Cl/Br ratio. This may thereforebe due to either inaccurate analyses or to soil organic mat-ter adsorption.
Wells, springs and galleries in the Canary Islands
The Canary Islands basically consists of deep submarine vol-canic edifices piling up and followed by subaerial volcanics(mainly basaltic and acidic vulcanite differentiates), emit-ted in stages from 20 Ma to less than 1 Ma (million years),even historical eruptions. From the high central areas tothe coast, the relief shows steep slopes that become gentlenear the coast when not eroded, and it is generally abruptwith deep gullies. The climate varies from arid to semiaridwith less than 100 mm year�1 rainfall at low altitudes near
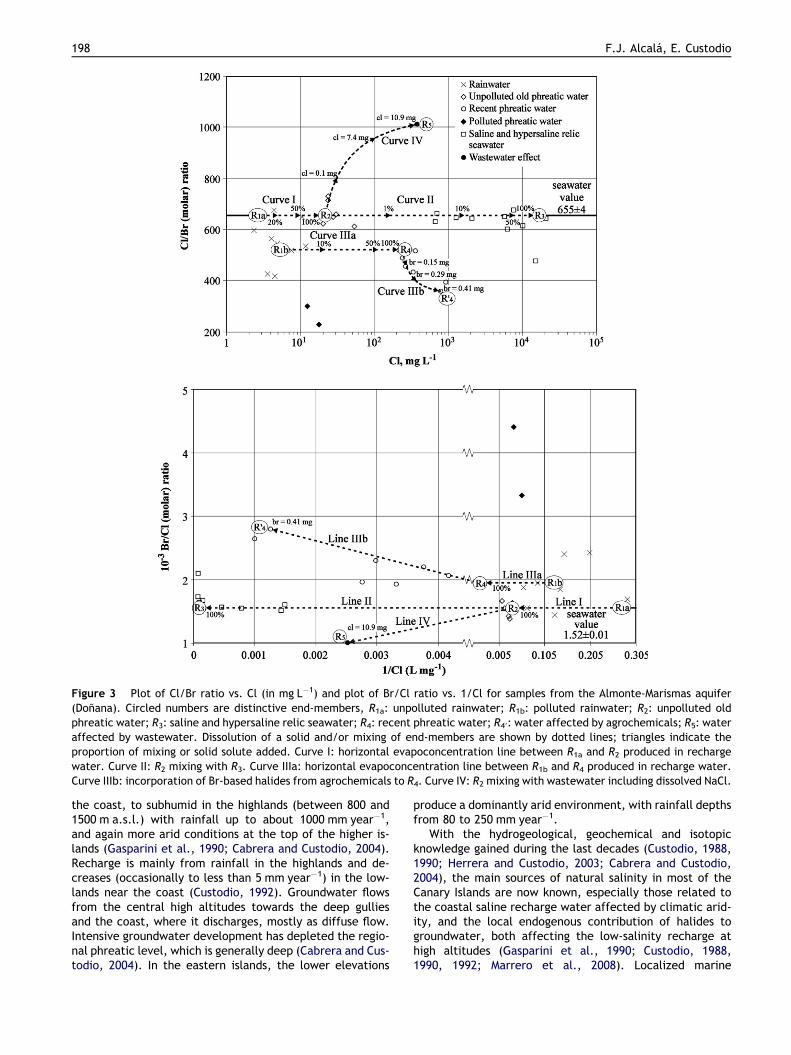
Figure 3 Plot of Cl/Br ratio vs. Cl (in mg L�1) and plot of Br/Cl ratio vs. 1/Cl for samples from the Almonte-Marismas aquifer(Donana). Circled numbers are distinctive end-members, R1a: unpolluted rainwater; R1b: polluted rainwater; R2: unpolluted oldphreatic water; R3: saline and hypersaline relic seawater; R4: recent phreatic water; R40: water affected by agrochemicals; R5: wateraffected by wastewater. Dissolution of a solid and/or mixing of end-members are shown by dotted lines; triangles indicate theproportion of mixing or solid solute added. Curve I: horizontal evapoconcentration line between R1a and R2 produced in rechargewater. Curve II: R2 mixing with R3. Curve IIIa: horizontal evapoconcentration line between R1b and R4 produced in recharge water.Curve IIIb: incorporation of Br-based halides from agrochemicals to R4. Curve IV: R2 mixing with wastewater including dissolved NaCl.
198 F.J. Alcala, E. Custodio
the coast, to subhumid in the highlands (between 800 and1500 m a.s.l.) with rainfall up to about 1000 mm year�1,and again more arid conditions at the top of the higher is-lands (Gasparini et al., 1990; Cabrera and Custodio, 2004).Recharge is mainly from rainfall in the highlands and de-creases (occasionally to less than 5 mm year�1) in the low-lands near the coast (Custodio, 1992). Groundwater flowsfrom the central high altitudes towards the deep gulliesand the coast, where it discharges, mostly as diffuse flow.Intensive groundwater development has depleted the regio-nal phreatic level, which is generally deep (Cabrera and Cus-todio, 2004). In the eastern islands, the lower elevations
produce a dominantly arid environment, with rainfall depthsfrom 80 to 250 mm year�1.
With the hydrogeological, geochemical and isotopicknowledge gained during the last decades (Custodio, 1988,1990; Herrera and Custodio, 2003; Cabrera and Custodio,2004), the main sources of natural salinity in most of theCanary Islands are now known, especially those related tothe coastal saline recharge water affected by climatic arid-ity, and the local endogenous contribution of halides togroundwater, both affecting the low-salinity recharge athigh altitudes (Gasparini et al., 1990; Custodio, 1988,1990, 1992; Marrero et al., 2008). Localized marine

Using the Cl/Br ratio as a tracer to identify the origin of salinity in aquifers in Spain and Portugal 199
intrusion in some intensively developed coastal areas andseveral diffuse anthropogenic activities may contribute Clto phreatic water, although background salinity is highdue to the coastal arid climate (Custodio, 1988). These sur-veys have also provided information about some anthropo-genic processes modifying natural salinity, especiallyintensive agriculture, which produces saline irrigation re-turn flows. One hundred and five samples were taken ofboth natural and anthropogenic processes at selected points(wells, springs and galleries) in Tenerife, Gran Canaria, LaPalma and Fuerteventura Islands (aquifer 24; Fig. 1),according to their well-known origin of salinity (unpublisheddata from S.N. Davis, A. Long and E. Custodio; Vegeer, 1991;Herrera and Custodio, 2003) (Table 2). All samples wereplotted together and grouped by similar origin of salinityand sampling altitude into five groups (Fig. 4): (i) phreaticwater in high and mid-slope areas, (ii) phreatic water inmid-slope areas affected by climatic evapoconcentration,(iii) phreatic water affected by coastal climatic aridity,(iv) endogenous contribution of halides and (v) agriculturalpollution.
Accurate groundwater sampling provides Cl/Br ratioranges for the main end-members mixed with unaffectedphreatic water or added solutes. Three of these processeshave been described in detail and plotted in Fig. 4.
Curve I in Fig. 4 is an upward concave mixing line ofslightly saline phreatic water from the highlands with moresaline phreatic water affected by the coastal arid climate atlow altitude. Recharge water in the highlands has a Cl con-tent between 4 and 20 mg L�1 and Cl/Br ratios of around 500or less. At lower altitudes, recharge water gradually be-comes more saline, increasing the Cl content up to>1000 mg L�1. Custodio and Herrera (2000) and Herreraand Custodio (2003) reported Cl/Br ratios up to 1000 andoccasionally up to 2000 in bulk deposition (e.g., stationsd33–d39; Fig. 1 and Table 1) and recent recharge water ta-ken from low altitude springs and oozings in the southernwindy coastal fringes of Fuerteventura Island, where cli-mate condition is semiarid to arid (aquifer 22; Fig. 1 and Ta-ble 2) with persistent winds and rough seas and intenseevapoconcentration. This results in a lower rainfall rechargerate and an atmospheric bulk Cl deposition rate of up to10 g m�2 year�1 (stations d34 and d38; Table 1), which afterevapoconcentration, makes phreatic water highly saline(Gasparini et al., 1990; Custodio, 1992). A relevant atmo-spheric dry deposition component contributing wind-blownhalite from marine aerosols is an important fraction (up to50%) of atmospheric bulk deposition. Different Curves I(Fig. 4) can be drawn depending on local hydrogeologicaland orographic features affecting Cl and Br in rechargewater.
Curve II is an upward concave line of halides from localendogenous volcanic degassing into high and mid-slopephreatic water. The exsolved gasses migrate towards thesurface through fissures and high-permeability paths in therock. When an aquifer is located between the magmaticenvironment and the surface, a fraction of the gasses emit-ted are dissolved into the aquifer water. Springs affectedsystematically show Cl/Br ratios up to 1000, and higher Clcontent than unaffected springs under the same hydrogeo-logical conditions (Vegeer, 1991; Custodio and Herrera,2000; Marrero et al., 2008). Depending on the relevance
of endogenous halides in groundwater, different Curves IIcan be drawn (Fig. 4).
Curve III is a smooth upward convex line resulting from afirst horizontal evaporation line of water defined in Curve I(high-altitude phreatic water mixed with phreatic water af-fected by a coastal arid climate) plus an upward convex lineof added solid solutes from Br-based agrochemicals used forsoil fumigation in intensive agriculture. Water used to irri-gate profitable large low-altitude agricultural plantationsis partly supplied from natural springs, drainage galleriesand deep-shaft wells, mainly in the highlands and at mid-slope, whether or not affected by climatic aridity. Catch-ment altitude controls the original salinity of phreatic water(several points on Curve I), while the agricultural use ofwater produces first evapoconcentration and then pollution;different Curves III can be drawn (Fig. 4). Cl/Br ratios oscil-late from less than 250 to 350 depending on the relativecontribution of Br-based agrochemicals to the phreaticwater defining Curve I, which may be estimated at up to0.07 mg L�1 (Fig. 4). Up to 140 mg L�1 in NO3 and Cl/Br ra-tios between 220 and 380 are observed in phreatic water af-fected by agriculture, while the NO3 content in unaffectedphreatic water is less than 10 mg L�1 for similar hydrogeo-logical conditions (Herrera and Custodio, 2003; Cabreraand Custodio, 2004).
Discussion
The study of Cl/Br ratios in atmospheric bulk deposition hasled to an understanding of the expectable chemical baselineof present groundwater in different places in Spain and Por-tugal. This source of knowledge allows natural and anthro-pogenic sources of pollution to be evaluated, and modernrecharge by rainfall to be estimated using environmentalchemical balances of atmospherically derived conservativesubstances (e.g., chloride ion), as well as estimatingchanges in groundwater along flow paths.
Orographic features and distance to the sea control thelandward transport of Cl and Br ions from the ocean follow-ing the rain pathways, and gradually reduce the Cl/Br ratio.Rainfall coming from the northwest and southwest of theIberian Peninsula produces Cl/Br ratios in bulk depositionsimilar to seawater or less in some cases, and Cl/Br ratiosbetween 500 and 700 in unaffected coastal recharge water(Fig. 5 and Table 2). A similar pattern was reported in con-tinental United States by Davis et al. (2004), though there itis more noticeable due to the much longer continentaltransport paths.
Superimposed on marine aerosols, other complementarynatural and anthropogenic sources of Cl and Br are possible,mainly during prolonged summer and autumn dry periods,when relatively major airborne dust includes salinity fromnatural (mainly lithological) and anthropogenic sources(mainly urban and industrial). Dry deposition contributesCl and Br fractions variable in space and time, dependingon local lithology, anthropogenic activities and climate.The natural contribution of wind-blown halite from evapo-ritic rock outcrops including NaCl produces Cl/Br ratios ofover 5000 during dry periods, while periods of continuousrainfall modulate average Cl/Br ratios down to 800 (e.g.,stations d03, d12, d15, d17, d27; Fig. 1 and Table 1). The

Figure 4 Plot of Cl/Br ratio vs. Cl (in mg L�1) and plot of Br/Cl ratio vs. 1/Cl for wells, springs and galleries in Gran Canaria,Tenerife and La Palma (Canary Islands). Circled numbers are distinctive end-members, R1: high and mid-slope phreatic water; R2:phreatic water affected by coastal arid climate; R3: water affected by endogenous contribution of halides; R4: water affected by Br-based agrochemicals. Dissolution of a solid and/or mixing of end-members are shown by dotted lines; triangles indicate theproportion of mixing or solid solute added. Curve I: R1 mixing with R2 showing the gradual variation in the Cl/Br ratio in phreaticwater from coastal arid zones with higher Cl/Br ratios towards the highlands where Cl/Br ratios are lower. Curve II: R1 mixing with R3showing the gradual endogenous contribution of halides to phreatic water. Curve III: horizontal evapoconcentration line towardsphreatic water defined in Curve II plus the gradual incorporation of Br-based halides from agrochemicals.
200 F.J. Alcala, E. Custodio
Cl/SO4 ratio is clearly lower than seawater. This is the situ-ation in major Spanish River basins and other minor basins,including Neogene gypsum formations.
The abundant anthropogenic contribution of particulatematter and halogens to the atmosphere from hydrocarbonand fuel combustion in urban and polluted industrial areas,

Figure 5 Plot of Cl/Br ratio vs. Cl (in mg L�1) for six main salinity acquisition processes (including some subprocesses) described in24 selected aquifers of Spain and Portugal, showing the Cl/Br ratio and Cl concentration ranges sampled; subprocess salinity codesare given in Table 2. Main types of salinity include: (i) seawater origin; (ii) different types of recharge water; (iii) water includingleaching or dissolution of natural evaporites (halite and gypsum containing halite); (iv) water including volcanic halides; (v) wateraffected by anthropogenic salinity, including leaching of industrial and domestic halite; (vi) water and brine including leachedpotassium halides from salt mining areas.
Using the Cl/Br ratio as a tracer to identify the origin of salinity in aquifers in Spain and Portugal 201
and the use of Br-based agrochemicals in intensively irri-gated areas produce Cl/Br ratios below that of seawater.Current recharge water in aquifers 04, 10, 12 and 20 (Fig.1) shows this effect clearly, with Cl/Br ratios lower thanthe seawater ratio (Table 2). Following the western prefer-ential rain and wind paths, the Cl/Br ratios are around 400or less towards the east of Madrid (Fig. 1). Cl/Br ratios inbulk deposition vary between 400 and 550 in the polluted ur-ban coastal areas of Barcelona and Aveiro (stations d05–d08and d09–d11 Table 1), coinciding with the Cl/Br ratiosfound in recharge waters (Table 2). Prolonged dry periodswithout significant wind followed by short intense rainfallevents produce Cl/Br ratios as low as 300 in Barcelona (sta-tion d05; Fig. 1), while dry deposition from marine aerosolsshows a Cl/Br ratio up to 800 due to Cl removal in thesecoastal areas (Alcala and Custodio, 2004). Martens et al.(1973) describe Cl/Br ratios between 480 and 600 in bulkdeposition for similarly polluted urban coastal areas ofPuerto Rico and San Francisco Bay, while Davis et al.(1998) describe Cl/Br ratios as low as 200 in other similarlypolluted areas in the USA.
The southern coastal areas of some of the Canary Islandsand the coastal fringe of the southeast Iberian Peninsula aresemiarid to arid zones with rough seas, persistent winds andpronounced evaporation. High dry deposition yields averageCl/Br ratios greater than seawater and occasionally up to2000 (e.g., stations d28, d32–d39; Fig. 1 and Table 1). Cl/SO4 ratios and other ionic ratios in the bulk deposition aresimilar to seawater, thus discarding other lithological oranthropogenic salinity contributions. Nevertheless, follow-
ing the rain-cloud path, located at a higher altitude in thesearid zones, Cl/Br ratios far from the coast are around theseawater ratio or lower. Cl/Br ratios in unaffected rechargewater in these areas is in the same range, but differs locallywhere there is infiltration of surface runoff from higher alti-tudes (e.g., aquifers 13, 15, 21, 22, 23 and 24; Fig. 1).
Often, especially far from the coast, the Cl content andother substances incorporated by rainwater in rechargewater cannot be explained by the marine aerosol chemicalcomposition alone. In such cases, the atmospheric mineraldeposition must be measured to model local hydrochemicalbehaviour based on mixtures of water from different hydro-chemical origins.
Other non-atmospherically derived sources of salinityacting directly on the original groundwater salinity, suchas dissolution of solids and water contributions from anthro-pogenic or natural sources (Custodio and Herrera, 2000;Alcala and Custodio, 2005), limit the use of the groundwaterchemical database available in Spain and Portugal forestimating recharge by rainfall through the chloride massbalance method. Since Cl and Br ions dissolved in groundwa-ter maintain a reasonable record of the soluble matter com-position (salts) generating its salinity, as well as the Cl/Brratio, it is therefore possible to use the Cl/Br ratio to knowthe origin of local salinity from the regional spatial distribu-tion of Cl/Br ratio in meteoric water.
Shallow groundwater sampled in coastal areas may beaffected by seawater intrusion, added brine or evaporationof surface water, limiting its use for recharge estimation. Inboth cases, the original Cl/Br ratio is a poor tool for

Figure 6 Plot of Cl/Br ratio vs. Cl (in mg L�1) and plot of Br/Cl ratio vs. 1/Cl for the Llobregat and Cardener Rivers, aboveand below salt outcrops and potash mining areas. Values aremedians for 1996–1999, after a brine collector was put intooperation (data from ATLL, 2001).
202 F.J. Alcala, E. Custodio
clarifying the sources of salinity, except in arid coastalzones where the Cl/Br ratios are usually higher than seawa-ter, allowing seawater intrusion and atmospheric saline con-tributions to be distinguished (Gasparini et al., 1990;Custodio, 1992). When salinity comes mostly from the mar-ine aerosol, recharge water has Cl/Br ratios close to theseawater ratio of 655 ± 4 (Fig. 5), with a range of variationdue mostly to variable dilution by freshwater, analyticaluncertainty and some organic matter adsorption. Brackishgroundwater from seawater sampled in Mediterranean andAtlantic coastal aquifers have similar Cl/Br ratios, whichare somewhat lower than that of seawater ratio.
The original salinity of the water supply and added halitecontrol the final Cl/Br ratio in natural water mixed withwastewater (Fig. 5). Average Cl added from halite may beup to 15 mg L�1. Cl/Br ratios between 900 and 1400 werefound for initial water supply with Cl/Br ratios between300 and 800 (e.g., aquifers 1, 3, 4, 5, 6, 10, 11, 12, 16, 18and 20; Fig. 1). Similar ranges and differences were re-ported by Vengosh and Pankratov (1998) and Davis et al.(1998, 2004) in urban wastewater from Israel and the USA.Sources of salinity leached from garbage and solid urbanwaste increase the Cl/Br ratios to between 750 and 1000(Fig. 5). Industrial use of halite produces Cl/Br ratios be-tween 4700 and 6700 (Fig. 5), similar in magnitude to natu-ral halite leachates (Cl/Br ratios between 3500 and 6600,Fig. 5, and up to 40,000 if halite is the only source of sol-utes), which enables salinity from industrial waste andwastewater to be differentiated from halite leached fromnatural evaporitic formations. On the other hand, Cl/Br ra-tios of around 450 were reported in leachates derived fromseptic waste in Dehesas de Guadix (Moreno et al., 2000,aquifer 17; Fig. 1 and Table 2). Certain organic retentionof Cl may be the cause, as proposed by Hudak (2003), forleachates from some farm-animal waste in Texas (USA).The Cl/Br ratio may be an additional tool for differentiatingwater effluents from domestic, farm and septic waste usesin joint urban wastewater management.
Br-based soil disinfectants were used for years as a pre-treatment for sandy soils to control nematodes in intensivegreenhouse production of strawberries, tomatoes and othervegetables. Volatilised Br, which is carried by rainfall, mayreduce Cl/Br ratios in phreatic water to between 200 and500 (Fig. 5). Added Br from pesticides may be up to0.5 mg L�1. Cl/Br ratios below 300, and sometimes below50 have been reported by Davis et al. (1998) in the USA.Low Cl/Br ratios are usually accompanied by high NO3 con-tent, which allows other sources of salinity to bedifferentiated.
The dissolution of sulphate-rich evaporites containinghalite (NaCl) increases the Cl/Br ratios to between 1200and 7500 in groundwater sampled in Spain (Fig. 5 and Table2), though Cl/Br ratios up to 10,000 have been documentedby McCaffrey et al. (1987) and Cartwright et al. (2004).When these geologic formations outcrop, the Cl/Br ratiomay be up to 5000 in atmospheric bulk deposition during se-vere dry periods. Dry fallow fields may produce wind-blownhalite-containing dust at basin scale and this may be a sig-nificant source of salinity in major inner river basins in Spain(Fig. 1), with similar Cl/Br ratios in recharge water. This isthe case of aquifers 06, 07, 08, 10, 11, 17 and 18 (Fig. 1),and other similar large areas, limiting the use of groundwa-
ter samples for estimating recharge through the chloridemass balance method. A rise in Cl/Br ratios from rechargeto discharge areas in detritic and/or carbonated aquifers06, 08, 10, 11, 12 and 20 (Fig. 1), which include gypsum-richlayers containing halite, may be due to a gradual increase inwater–rock interaction.
In the Llobregat River Basin potash mining area (aquifer02; Fig. 1), several sodium and potassium halide and gypsumformations are now being worked (Ayora et al., 1995; ATLL,2001; Soler et al., 2002). The original atmosphericallydependent Cl/Br ratios of surface water in rivers andstreams and groundwater has been progressively modifiedby the saline contribution from these mining operations.Effluent brines from potassium halide dissolution decreasethe Cl/Br ratios to around 500 when carnalite is leachedand around 300 for sylvite. Potash tailings in flotationdumps, consisting of several types of halides (carnalite, syl-vite, halite, etc.), and other sulphate-rich evaporites (gyp-sum and anhydrite), produce Cl/Br ratios of around 500

Using the Cl/Br ratio as a tracer to identify the origin of salinity in aquifers in Spain and Portugal 203
(Fig. 5). Cl/Br ratios in oil-field brine (relics of evaporatedseawater including precipitation of potassium halides) typi-cally varied within the 100–300 range (Rittenhouse, 1967;Carpenter, 1978; Vengosh et al., 1998). An order of magni-tude in Cl/Br ratios allows freshwater diluting pure halite,gypsum containing halite, carnalite, sylvite or other inter-mediate minerals to be distinguished. Median Cl/Br and Clfor the Llobregat River and its tributary, the Cardener(Fig. 1), with sampling stations up and downstream of thesalt outcrops and potash mining are plotted in Fig. 6 (Mar-tın-Alonso, 1994; ATLL, 2001). As Cl increases from salinecontamination (mainly halite), the Cl/Br molar ratio tendsto increase. Average Cl/Br ratios in the range of 600–750means that the dominant source of pollution is not halitedissolution but mining effluents and tailing leachates, bothrelated to K-rich minerals, also rich in Br. This direct infor-mation is very valuable for finding the end-members ofmixed water in other similar Spanish Tertiary evaporitic ba-sins, such as those in Navarra (Fig. 1).
In active volcanic areas, such as the Canary Islands, whenan aquifer is located between the magmatic environmentand the surface, a fraction of the gasses emitted are dis-solved in the aquifer. The springs affected by endogenousdegassing show Cl/Br ratios of up to 1000 (Vegeer, 1991;Custodio and Herrera, 2000). The exsolved CO2 gas was usedas a good tracer to identify high Cl/Br ratios due to theendogenous contribution of halides by wind-blown halitein coastal arid zones of the Canary Islands. Average Cl addedfrom the endogenous contribution of halides may be up to20 mg L�1.
Conclusions
Orographic features and distance to the sea control themovement of Cl and Br ions inland from the ocean along rainpathways producing a progressive reduction in the Cl/Br ra-tio from around 655 to less than 300. Additional sources ofCl and Br are gradually added to the marine aerosol. Naturalsources of Cl are mainly from halite, raising the Cl/Br ratiosup to 1200 while anthropogenic sources mainly contributeBr-rich substances, lowering the Cl/Br ratios to 300. Cl/Brratios in atmospheric bulk deposition control the ratiosexpectable in phreatic water affected only by saline evapo-concentration. Study of the Cl/Br ratio in bulk deposition al-lows groundwater with Cl derived from atmospheric sourcesto be distinguished from groundwater with Cl contributed byendogenous, lithological or anthropogenic sources. Severalmixing processes and the addition of solid solutes affectthe groundwater chemistry in many unconfined Spanishaquifers. Since they have different lithologies, groundwaterflow systems, edaphic conditions and generally high watertable, the mixtures may only be well-explained by studyingthe atmospheric bulk deposition.
Cl/Br ratios may increase up to 1500 in groundwater fromthe addition of halite in wastewater or leaching of solidwaste and decrease to 300 from Br-based pesticides orfarm-animal and septic waste. The endogenous contributionof halides in active volcanic areas of the Canary Islands,leaching and dissolution of natural and industrial halite,and the dissolution of sulphate-rich formations containing
halite may yield Cl/Br ratios between one thousand and sev-eral thousand.
When Cl content in groundwater is not affected by ex-treme evaporation, recharge by rainfall can be estimatedby comparing Cl in atmospheric bulk deposition and unaf-fected shallow groundwater. In addition, complementaryinformation on the groundwater flow paths may be suppliedwhen Cl/Br ratios increase from continuous contribution ofCl from lithology.
Experience gained in Spain and Portugal is a source ofknowledge to use the Cl/Br ratio as an effective tracer inother mid-latitudes Mediterranean countries (southern Eur-ope and northern Africa) with similar orographic, geologicaland climatic conditions.
Acknowledgements
This research was funded by Spanish CICYT Research ProjectHID1999-0205, European Research Project EVK1-2002-00527and Andalusian Research Project P06-RNM-01732, and par-tially by Geological Survey of Spain (IGME) Research Projects62669, 63368 and 258. The authors would like to thank theIGME Laboratory and Dr. LleonardMatıa of the AGBAR Labora-tory for assessing the first results. Thanks also to the person-nel from the IGME, the Groundwater International CentreFoundation (FCIHS) and other institutions that collaboratedin sampling and in the further characterization of the results,many of them mentioned in the text. The first author is alsograteful to the IGME for a Doctoral Research Grant from June2001 to December 2004 and to the Spanish Ministry of Educa-tion and Science for a ‘‘Juan de la Cierva’’ Programme Con-tract (JCI-2007-334). The authors also wish to express theirgratitude to an anonymous reviewer, to Dr. Ian Cartwright(Monash University, Australia) and to Dr. Carlos Ayora (Insti-tut de Ciencies de la Terra Jaume Almera-CSIC, Spain) fortheir valuable advice and constructive comments.
Appendix A. Mixing and addition of solidsolutes modifying the original Cl/Br ratio
A given water composition may be changed by mixing withother water or by dissolving a solid, which modifies the ori-ginal Cl and Br concentration, and consequently the Cl/Brmolar ratio. If: (i) I, F and A are the initial, final (mixed)and added water, respectively; (ii) S is the dissolved solidper unit water volume; (iii) Cl, Br and R represent chlo-ride, bromide and the Cl/Br molar ratio in I, F and A (sub-index); (iv) Cl and Br are the Cl and Br fractions in thesolid, where r = Cl/Br; (v) X = fraction of I and 1 � X = frac-tion of A in the final (mixed) solution, all of them in thesame units (here molar quantities); the mass conservationbalance yields:
(a) Admixture of a fraction X of water A to water I(Fig. 2a):
RF ¼ClFBrF¼ ClF
BrIð1� XÞ þ BrA � Xð1Þ
Since ClF = ClI(1 � X) + ClA Æ X; where X ¼ ClF�ClIClA�ClI
.

204 F.J. Alcala, E. Custodio
Then, after substituting X and rearranging the result, andtaking into account that ClI/BrI = RI and ClA/BrA = RA:
RF ¼ ClFClA � ClI
ClIRI� ClA
RA
� �ðClA � ClFÞ
ð2Þ
In a plot of R vs. Cl (the actual RF and ClF) the admixture of afraction X of water A follows a curve with an unchangingslope sign (Fig. 2a). By taking decimal logarithms Eq. (2)becomes:
logRF ¼ log ClF � logðClA � ClFÞ þ logClA � ClIClIRI� ClA
RA
ð3Þ
Only when log(ClA � ClF) is small, the logR vs. logCl plot is a45� diagonal displaced by the third term. This is frequentlydone in the literature to cover the wide range of Cl, butthere is deviation from the straight line.
In a plot of 1/R vs. 1/Cl the admixture follows a straightline with slope M and intercept N, connecting points I and A(Fig. 2a):
1
RF¼
ClARA� ClI
RI
ClA � ClIþClA
ClIRI� ClA
RA
� �ClA � ClI
1
ClF¼ N þM
1
ClFð4Þ
where N �ClARA�ClI
RI
ClA�ClIand M �
ClAClIRI�ClA
RA
� �ClA�ClI
(b) Dissolution of a solid (Fig. 2b):
RF ¼ClFBrF¼ ClF
BrI þ S � br ð5Þ
assuming there is no significant change in volume (for lowsalinity).
Since ClF = ClI + S Æ cl; where S ¼ ClF�ClIcl
.Substituting S and rearranging the result:
RF ¼ClFRIr
ClIðr � RIÞ þ RIClFð6Þ
In a plot of R vs. Cl the gradual addition of the solute followsa curve with an unchanging slope sign (Fig. 2b). By takingdecimal logarithms, Eq. (6) becomes:
logRF ¼ log ClF � log ClIðr � RIÞ þ RIClF½ � þ logRIr ð7Þ
Only when log[ClI(r � RI) + RIClF] is small the plot of logR vs.logCl is a 45� diagonal displaced by the third term.
In a plot of 1/R vs. 1/Cl this addition may be interpretedby means of a linear relationship (Fig. 2b):
1
RF¼ 1
rþ ClI
1
RI� 1
r
� �1
ClFð8Þ
with a slope ClI 1RI� 1
r
� �and intercept 1/r.
References
Aiuppa, A., Federico, C., Franco, A., Giudice, G., Gurrieri, S.,Inguaggiato, S., Liuzzo, M., McGonigle, A.J.S., Valenza, M.,2005. Emission of bromine and iodine from Mount Etna volcano.Geochemistry, Geophysics and Geosystems 6, Q08008. doi:10.1029/2005GC000965.
Alcala, F.J., 2006. Recarga a los acuıferos espanoles mediantebalance hidrogeoquımico. Ph.D. Thesis, Universitat Politecnica
de Catalunya, Barcelona, 719 pp. (in Spanish with abstract inEnglish).
Alcala, F.J., Custodio, E., 2004. Deposicion total atmosferica deelementos mayoritarios en la ciudad de Barcelona (NE deEspana). Datos preliminares sobre la aportacion mineral por laprecipitacion atmosferica. In: IAH-Spanish Group (Eds.), Simpo-sio Sobre el Agua y la Ciudad Sostenible: Hidrogeologıa Urbana.IGME, Barcelona, pp. 277–287.
Alcala, F.J., Custodio, E., 2005. Use of the Cl/Br ratio as a tracer toidentify the origin of salinity in some coastal aquifers of Spain.In: Araguas, L., Custodio, E., Manzano, M. (Eds.), Proceedings ofthe 18th Salt Water Intrusion Meeting. IGME, Cartagena, pp.481–497.
Alcala, F.J., Custodio, E., 2007. Recharge by rainfall to Spanishaquifers through chloride mass balance in the soil. In: Ribeiro,L., Chambel, A., Condesso de Melo, M.T. (Eds.), Proceedings ofthe XXXV IAH Congress: Groundwater and Ecosystems, Lisboa, 10pp. (abstract book: paper 236).
Alcala, F.J., Custodio, E., 2008. Atmospheric chloride deposition incontinental Spain. Hydrological Processes 22. doi:10.1002/hyp.6965.
ATLL, 2001. Variacions espacials i temporals en la qualitat del’aigua de la conca del riu Llobregat: parametres inorganics,1996–1999. Recull 5 (Feb. 2001), Quaderns ATLL (Aigues Ter-Llobregat), Barcelona, 122 pp.
Ayora, C., Taberner, C., Pierre, C., Pueyo, J.J., 1995. Modeling thesulfur and oxygen isotopic composition of sulfates through ahalite-potash sequence: implications for the hydrological evo-lution of the Upper Eocene South Pyrenean basin. Geochimica etCosmochimica Acta 59 (9), 1799–1808.
Bayo, A., Custodio, E., Loaso, C., 1997. Las aguas subterraneas enel delta del Ebro. Revista de Obras Publicas 144 (3368), 47–65.
Bello, A., Lopez-Perez, J.A., Dıaz-Viruliche, L., Tello, J., 2001.Alternatives to methyl bromide for soil fumigation in Spain. In:Labrada, R., Fornasari, L. (Eds.), Global Report on ValidatedAlternatives to the Use of Methyl Bromide for Soil Fumigation,336. FAO, Roma, pp. 33–46.
Bobrowski, N., Honninger, G., Galle, B., Platt, U., 2003. Detectionof bromine monoxide in a volcanic plume. Nature 423, 273–276.
Bureau, H.E., Metrich, N., 2003. An experimental study of brominebehaviour in water-saturated silicic melts. Geochimica etCosmochimica Acta 67 (9), 1689–1697.
Butler, J.H., King, D.B., Lobert, J.M., Montzka, S.A., Yvon-Lewis,S.A., Hall, B.D., Warwick, N.J., Mondeel, D.J., Aydin, M., Elkins,J.W., 2007. Oceanic distributions and emissions of short-livedhalocarbons. Global Biogeochemistry Cycles 21, GB1023. doi:10.1029/2006GB002732.
Cabrera, M.C., Custodio, E., 2004. Groundwater flow in a volcanic-sedimentary coastal aquifer: Telde area, Gran Canaria, CanaryIslands, Spain. Hydrogeology Journal 12 (3), 305–320.
Cabrera, M.C., Delgado, F., Munoz, J., Perez Torrado, F.J., LaMoneda, E., 2000. Caracterizacion de las familias hidrogeoquım-icas en el acuıfero de La Aldea (Gran Canaria). Geotemas 1 (2),47–50.
Carpenter, A.B., 1978. Origin and chemical evolution of brines insedimentary basins. Circular 79, Oklahoma Geological Survey,pp. 60–77.
Cartwright, I., Weaver, T.R., Fulton, S., Nichol, C., Reid, M.,Cheng, X., 2004. Hydrogeochemical and isotopic constraints onthe origins of dryland salinity, Murray Basin, Victoria, Australia.Applied Geochemistry 19, 1233–1254.
Cartwright, I., Weaver, T.R., Fifield, L.K., 2006. Cl/Br ratios andenvironmental isotopes as indicators of recharge variability andgroundwater flow: an example from the southeast Murray Basin,Australia. Chemical Geology 231, 38–56.
Castaneda, C., Garcıa-Vera, M.A., 2008. Water balance in the playa-lakes of an arid environment, Monegros, NE Spain. HydrogeologyJournal 16 (1), 87–102.

Using the Cl/Br ratio as a tracer to identify the origin of salinity in aquifers in Spain and Portugal 205
Ceballos-Barbancho, A., Moran-Tejeda, E., Luengo-Ugidos, M.A.,Llorente-Pinto, J.M., 2008. Water resources and environmentalchange in a Mediterranean environment: the south-west sectorof the Duero river basin (Spain). Journal of Hydrology 351 (1–2),126–138.
Cicerone, R.J., 1981. Halogens in the atmosphere. Review ofGeophysics and Space Physics 19 (1), 123–139.
Condesso de Melo, M.T., Carreira Paquete, P.M.M., Marques daSilva, M.A., 2001. Evolution of the Aveiro Cretaceous aquifer(NW Portugal) during the Late Pleistocene and present day:evidence chemical and isotopic data. In: Edmunds, W.M., Milne,C. (Eds.), Paleowaters in Coastal Europe: Evolution of Ground-water since the Late Pleistocene. Special Publications 189.Geological Society, London, pp. 139–154.
Contreras, S., Boer, M., Alcala, F.J., Domingo, F., Garcıa, M.,Pulido-Bosch, A., Puigdefabregas, J., 2008. An ecohydrologicalmodelling approach for assessing long-term recharge rates insemiarid karstic landscapes. Journal of Hydrology 351 (1–2),42–57.
Custodio, E., 1988. Nota sobre la intrusion marina en las IslasCanarias. In: Fernandez-Rubio, R., Lopez Geta, J.A., Ramos, G.(Eds.), Tecnologıa de la Intrusion Marina en Acuıferos Costeros,vol. 1. IGME, Madrid, pp. 593–603.
Custodio, E., 1990. Saline groundwater in the Canary Islands (Spain)resulting from aridity. Greenhouse Effect, Sea Level andDroughtNATO ASI Series C: Mathematical and Physical Sciences,vol. 325. Kluwer, Dordrecht, pp. 593–618.
Custodio, E., 1992. Coastal aquifer salinization as a consequence ofaridity: the case of Amurga phonolitic massif, Gran CanariaIsland. In: Custodio, E., Galofre, A. (Eds.), Proceedings of the12th Study and Modelling of Saltwater Intrusion. CIMNE-UPC,Barcelona, pp. 81–98.
Custodio, E., 1994. Endurecimiento del agua del Valle Bajo delLlobregat por cambios en los procesos de recarga. In: IAH-Spanish Group (Ed.), Analisis y Evolucion de la Contaminacion delas Aguas Subterraneas, vol. 2. IAH, Alcala de Henares, pp. 123–140.
Custodio, E., 1997. Evaluacion de la recarga por la lluvia mediantemetodos ambientales quımicos, isotopicos y termicos. In:Custodio, E., Llamas, M.R., Samper, J. (Eds.), La Evaluacionde la Recarga a los Acuıferos en la Planificacion Hidrologica.IGME and IAH-Spanish Group, Las Palmas de Gran Canaria,Madrid, pp. 83–110.
Custodio, E., 2000. Groundwater-dependent wetlands. Acta Geo-logica Hungarica 43 (2), 173–202.
Custodio, E., Llamas, M.R., 1983. Hidrologıa Subterranea. Omega,Barcelona, 2350 pp.
Custodio, E., Palancar, M., 1995. Las aguas subterraneas en Donana.Revista de Obras Publicas 142 (3340), 31–53.
Custodio, E., Herrera, C., 2000. Utilizacion de la relacion Cl/Brcomo trazador hidrogeoquımico en hidrologıa subterranea.Boletın Geologico y Minero 111 (4), 49–67.
Custodio, E., Alcala, F.J., 2004. Modificacion del cociente Cl/Br yotras relaciones ionicas en el proceso de tratamiento de aguassubterraneas por osmosis inversa. Hidrogeologıa y RecursosHidraulicos 26, 325–335.
Custodio, E., Edmunds, W.M., Travi, Y., 2001. Management ofcoastal palaeowaters. In: Edmunds, W.M., Milne, C. (Eds.),Paleowaters in Coastal Europe: Evolution of Groundwater sincethe Late Pleistocene. Special Publications 189. GeologicalSociety, London, pp. 313–327.
Delmelle, P., Bernard, A., 1994. Geochemistry, mineralogy, andchemical modelling of the acid water lake of Kawah Ijenvolcano, Indonesia. Geochimica et Cosmochimica Acta 58 (11),2445–2460.
Davis, S.N., Whittemore, D.O., Fabryka-Martin, J., 1998. Uses ofchloride/bromide ratios in studies of potable water. GroundWater 36 (2), 338–350.
Davis, S.N., Fabryka-Martin, J., Wolfsberg, L.E., 2004. Variations ofbromide in potable ground water in the United States. GroundWater 42 (6), 902–909.
De Cal, A., Martinez-Treceno, A., Salto, T., Lopez-Aranda, J.M.,Melgarejo, P., 2005. Effect of chemical fumigation on soil fungalcommunities in Spanish strawberry nurseries. Applied SoilEcology 28 (1), 47–56.
Dror, G., Ronen, D., Stiller, M., Nishri, A., 1999. Cl/Br ratios of LakeKinneret, pore water and associated springs. Journal of Hydrol-ogy 225 (3), 130–139.
Duce, R., Winchester, J.W., Van Nahl, T.W., 1965. Iodine, bromideand chloride in the Hawaiian marine atmosphere. Journal ofGeophysical Research 70, 1775–1779.
Eastoe, Ch.J., Long, A., Knauth, L.P., 1999. Stable chlorine isotopesin the Palo Duro Basin, Texas: evidence for preservation ofPersian evaporate brines – I. Theory. Geochimica et Cosmo-chimica Acta 63 (9), 1375–1382.
Edmunds, W.M., 2001. Palaeowaters in European coastal aquifers –the goals and main conclusions of the PALAEAUX project. In:Edmunds, W.M., Milne, C. (Eds.), Paleowaters in Coastal Europe:Evolution of Groundwater since the Late Pleistocene. SpecialPublications 189. Geological Society, London, pp. 1–16.
Eriksson, E., 1960. The yearly circulation of chloride and sulphur innature; meteorological, geochemical and pedological implica-tions. Part II. Tellus 12, 63–109.
Fabryka-Martin, J., Whittemore, D.O., Davis, S.N., Kubik, P.W.,Sharma, P., 1991. Geochemistry of halogens in the Milk Riveraquifer, Alberta, Canada. Applied Geochemistry 6, 447–464.
Falgas, E., Ledo, J., Teixido, T., Gabas, A., Ribera, F., Arango, C.,Queralt, P., Plata, J.L., Rubio, F.M., Pena, J.A., Martı, A.,Marcuello, A., 2005. Geophysical characterization of a mediter-ranean coastal aquifer: the baixa Tordera fluvio-deltaic aquiferunit (Barcelona, NE Spain). In: Araguas, L., Custodio, E.,Manzano, M. (Eds.), Proceedings of the 18th Salt Water IntrusionMeeting. IGME, Cartagena, pp. 395–404.
Fernandez-Urıa, A., Fontes, J.Ch., Herraez, J., Llamas, M.R., Luisa-Rubio, P.L., 1985. Tridimensional groundwater chemical andisotopic variations as related to the Madrid aquifer flow system.Estudios Geologicos 41, 229–236.
Fontes, J.Ch., Matray, J.M., 1993. Geochemistry and origin offormation brines from the Paris Basin, France: 2. Saline solutionsassociated with oil fields. Chemical Geology 109, 177–200.
Fontes, J.Ch., Yousefi, M., Allison, G.B., 1986. Estimation of thelong-term groundwater discharge in the Northern Sahara usingstable isotope profiles in soil water. Journal of Hydrology 86,315–327.
Freeman, J.T., 2007. The use of bromide and chloride mass rationsto differentiate salt-dissolution and formation brines in shallowgroundwater of the Western Canadian Sedimentary Basin.Hydrogeology Journal 15 (7), 1377–1385.
Fruchter, J.S., Robertson, D.E., Evans, J.C., Olsen, K.B., Lepel,E.A., Laul, J.C., Abel, K.H., Sanders, R.W., Jackson, P.O.,Wogman, N.S., Perkins, R.W., Van Tuyl, H.H., Beauchamp, R.H.,Shade, J.W., Daniel, J.L., Erikson, R.L., Sehmel, G.A., Lee,R.N., Robinson, A.V., Moss, O.R., Briant, J.K., Cannon, W.C.,1980. Mount St. Helens ash from the 18 May 1980 eruption:chemical, physical, mineralogical and biological properties.Science 209 (4461), 1116–1125.
Gasparini, A., Custodio, E., Fontes, J.Ch., Jimenez, J., Nunez, J.A.,1990. Exemple d’etude geochimique et isotipique de circulationsaquiferes en terrain volcanique sous climat semi-aride (Amurga,Gran Canaria, Illes Canaries). Journal of Hydrology 114, 61–91.
Gerritse, R.G., George, R.J., 1988. The role of soil organic matterin the geochemical cycling of chloride and bromide. Journal ofHydrology 101 (1–4), 83–95.
Gimenez, E., Morell, I., 1997. Hydrogeochemical analysis ofsalinization processes in the coastal aquifer of Oropesa (Castel-lon, Spain). Environmental Geology 29 (1–2), 118–131.

206 F.J. Alcala, E. Custodio
Gisbert, J., Pulido-Bosch, A., Al Alwani, G., 1998. On the charac-terization of hydrologic behavior of a high mountain schistouscatchment. Munchner Geologische Hefte B8, 29–34.
Goni, I.B., Fellman, E., Edmunds, W.M., 2001. Rainfall geochem-istry in the Sachel region of northern Nigeria. AtmosphericEnvironment 35 (25), 4331–4339.
Hautman, D.P., Munch, D.J., 1997. EPA 300 1. Determination ofInorganic Anions in Drinking Water by Ion Chromatography.Revision 1.0. USEPA, Office of Water. EPA, Cincinnati, OH, 40pp.
Herczeg, A.L., Dogramaci, S.S., Leaney, F.W., 2001. Origin ofdissolved salts in a large, semi-arid groundwater system: MurrayBasin, Australia. Marine and Freshwater Resources 52, 41–52.
Herrera, C., Custodio, E., 2003. Hipotesis sobre el origen de lasalinidad de las aguas subterraneas en la islas de Fuerteventura,Archipielago de Canarias, Espana. Boletın Geologico y Minero114 (4), 433–452.
Herrmann, A.G., 1972. Bromine distribution coefficients for haliteprecipitated from modern sea water under natural conditions.Contributions to Mineralogy and Petrology 37 (3), 249–252.
Hudak, P.F., 2003. Chloride/bromide ratios in leachate derivedfrom farm-animal waste. Environmental Pollution 121, 23–25.
Iribar, V., Carrera, J., Custodio, E., Medina, A., 1997. Inversemodelling of seawater intrusion in the Llobregat delta deepaquifer. Journal of Hydrology 198 (1–4), 226–247.
ITGE, 1992. Hidrogeologıa del Parque Nacional de Donana y suentorno. Coleccion Informes Aguas Subterraneas y Geotecnia.Geological Survey of Spain, Internal Report, Madrid, 64 pp. (inSpanish).
ITGE, 1994. Las aguas subterraneas del Campo de Cartagena(Murcia). Geological Survey of Spain, Internal Report, Madrid(in Spanish).
ITGE-DGOHCA, 1999. Programa de actualizacion del inventariohidrogeologico (PAIH). Analisis del conocimiento actual. Evalu-acion y programacion de estudios en las cuencas intercomuni-tarias. Geological Survey of Spain, Internal Report, Madrid (inSpanish).
Kloppmann, W., Negrel, Ph., Casanova, J., Klinge, H., Schelkes, K.,Guerrot, C., 2001. Halite dissolution derived brines in thevicinity of a Permian salt dome (N German Basin). Evidence fromboron, strontium, oxygen, and hydrogen isotopes. Geochimicaet Cosmochimica Acta 65 (22), 4087–4101.
Koglin, E.N., 1984. Bromide as an environmental tracer ingroundwater of Tucson Basin, Arizona. M.S. Thesis, Departmentof Hydrology and Water Resources, University of Arizona,Tucson.
Kohfahl, C., Rodrıguez, M., Fenk, C., Menz, C., Benavente, J.,Hubberten, H., Meyer, H., Paul, L., Knappe, A., Lopez-Geta,J.A., Pekdeger, A., 2008. Characterising flow regime andinterrelation between surface-water and ground-water in theFuente de Piedra salt lake basin by means of stable isotopes,hydrogeochemical and hydraulic data. Journal of Hydrology 351(1–2), 170–187.
Kolodny, Y., Katz, A., Starinsky, A., Moise, T., Simon, E., 1999.Chemical tracing of salinity sources in Lake Kinneret (Sea ofGalilee), Israel. Limnology and Oceanography 44 (4), 1035–1044.
Lehmann, B.E., Davis, S.N., Fabryka-Martin, J.T., 1993. Atmo-spheric and subsurface sources of stable and radioactivenuclides used for groundwater dating. Water Resources Research29, 2027–2040.
Lopez, J.M., Mateos, R.M., 2003. La intrusion marina en losacuıferos de la isla de Mallorca. In: Lopez-Geta, J.A., de laOrden, J.A., Gomez, J.D., Ramos, G., Mejıas, M., Rodrıguez, L.(Eds.), Tecnologıa de la Intrusion de Agua de Mar en AcuıferosCosteros: Paıses Mediterraneos, vol. 1. IGME, Madrid, pp. 383–392.
Manzano, M., Custodio, E., Loosli, H.H., Cabrera, M.C., Riera, X.,Custodio, J., 2001a. Palaeowater in coastal aquifers of Spain. In:Edmunds, W.M., Milne, C. (Eds.), Paleowaters in Coastal Europe:Evolution of Groundwater since the Late Pleistocene. SpecialPublications 189. Geological Society, London, pp. 107–138.
Manzano, M., Soler, A., Carrera, J., Custodio, J., 2001b. Compos-icion isotopica (18O, 2H, 34S) de las aguas del area afectada por elvertido minero de Aznalcollar (SO Espana). In: Medina, A.,carrera, J., Vives, L. (Eds.), Las Caras del Agua Subterranea.Serie Hidrogeologıa y Aguas Subterraneas, vol. 1. IGME, Madrid,pp. 477–487.
Marrero, R., Lopez, D.L., Hernandez, P.A., Perez, N.M., 2008.Carbon dioxide discharged through the Las Canadas Aquifer,Tenerife, Canary Islands. Pure and Applied Geophysics. doi:10.1007/s00024-007-0287-3.
Martens, C.S., Wesolonsky, J.J., Harns, R.C., Kaifer, R., 1973.Chloride loss from Puerto Rico and San Francisco Bay areamarine aerosols. Journal of Geophysical Review 82, 8778–8791.
Martın-Alonso, J., 1994. Barcelona’s water supply improvement:the brine collector of the Llobregat river. Water Science andTechnology 30 (10), 221–227.
McCaffrey, M.A., Lazar, B., Holland, H.D., 1987. The evaporationpath of seawater and the coprecipitation of Br� and K+ withhalite. Journal of Sedimentary Petrology 57, 928–937.
MIMAM, 2000. The white book of the water in Spain. Ministry of theEnvironment, Secretary of Waters and Coast, General Directionof Hydraulic Works and Water Quality, Madrid, 637 pp. (inSpanish).
Minor, T.B., Russell, C.E., Mizell, S.A., 2007. Development of a GIS-based model for extrapolating mesoscale groundwater rechargeestimates using integrated geospatial data sets. HydrogeologyJournal 15, 183–195.
Montes, J., Vazquez-Sune, E., 2005. Hidrogeologıa de Badalona.Ajuntament de Badalona, 83 pp. (in Spanish).
Moreno, L., Liquinano, M.C., Rubio, J.C., Murillo, J.M., 2000.Eliminacion de aguas residuales urbanas mediante filtraciondirecta sobre el terreno. Impacto sobre el sistema solucion delsuelo-agua subterranea. Boletın Geologico y Minero 111 (5), 47–62.
Oberg, G., Sanden, P., 2005. Retention of chloride in soil.Hydrological Processes 19, 2123–2136.
Panno, S.V., Hackley, K.C., Hwang, H.H., Greenberg, S.E., Krapac,I.G., Landsberger, S., O’Kelly, D.J., 2006. Characterization andidentification of Na-Cl sources in groundwater. Ground Water 44(2), 176–187.
Park, J., Bethke, C.M., Torgersen, T., Johnson, T.M., 2002.Transport modeling applied to the interpretation of groundwater36Cl age. Water Resources Research 38 (5), 1–15.
Pascual, M., Bayo, A., 1991. La sobreexplotacion del acuıfero deVicfred-Guisona (Lerida). Posibilidades de recuperacion conaguas superficiales del Canal de Urgell. In: AIH-Spanish Group(Eds.), Sobreexplotacion de Acuıferos. Puerto de la Cruz(Tenerife), pp. 235–239.
Querol, X., Alastuey, A., De la Rosa, J., Plana, F., Ruiz, C.R., 2002.Source apportionment analysis of atmospheric particulates in anindustrialised urban site (Huelva City) in South-western Spain.Atmospheric Environment 36 (19), 3113–3125.
Redeker, K.R., Wang, N.Y., Low, J.C., McMillan, A., Tyler, S.C.,Cicerone, R.J., 2000. Emissions of methyl halides and methanefrom rice paddies. Science 290 (5493), 966–969.
Risacher, F., Fritz, B., Alonso, H., 2006. Non-conservative behav-iour of bromine in surface waters and brines of Central Andes: arelease into the atmosphere? Geochimica et Cosmochimica Acta70 (9-1), 2143–2152.
Rittenhouse, G., 1967. Bromide in oil field waters and its use indetermining possibilities of origin of these waters. AmericanAssociation Petroleum Geology Bulletin 51 (12), 2430–2440.

Using the Cl/Br ratio as a tracer to identify the origin of salinity in aquifers in Spain and Portugal 207
Rosenthal, E., 1987. Chemical composition of rainfall and ground-water in recharge areas of the Bet Shean-Harod multiple aquifersystem, Israel. Journal of Hydrology 89 (3–4), 329–352.
Salvany, J.M., Custodio, E., 1995. Caracterısticas litoestratigraficasde los depositos plio-cuaternarios del Bajo Guadalquivir en elarea de Donana: implicaciones hidrogeologicas. Revista de laSociedad Geologica de Espana 8 (1–2), 21–31.
Sanchez-Martos, F., Pulido-Bosch, A., Molina, L., Vallejos, A., 2002.Identification of the origin of salinization in groundwater usingminor ions (Lower Andarax, Southeast Spain). The Science of theTotal Environment 297 (1), 43–58.
Schaefer, L., Fegley, B., 2005. Alkali and halogen chemistry involcanic gases on Io. Icarus 173 (2), 454–468.
Soler, A., Canals, A., Goldstein, S.L., Otero, N., Antich, N.,Spangerberg, J., 2002. Sulfur and strontium isotope compositionof Llobregat River (NE Spain): tracers of natural and anthropo-genic chemicals in stream waters. Water, Air, and Soil Pollution136, 207–224.
Solomon, S., Thompson, D.W.J., Portmann, R.W., Oltmans, S.J.,Thompson, A.M., 2005. On the distribution and variability ofozone in the tropical upper troposphere: implications fortropical deep convection and chemical–dynamical coupling.Geophysical Research Letters 32, L23813. doi:10.1029/2005GL024323.
Stevens, C.R., 1990. Variations of Cl/Br ratios in ground water ofTucson Basin and Avra Valley, Arizona. M.S. Report, Departmentof Geosciences, University of Arizona, Tucson.
Suso, J., Llamas, M.R., 1993. Influence of groundwater develop-ment of the Donana National Park ecosystems (Spain). Journal ofHydrology 141 (1–4), 239–270.
Taberner, C., Cendon, D.I., Pueyo, J.J., Ayora, C., 2000. The use ofenvironmental markers to distinguish marine vs. continentaldeposition and to quantify the significance of recycling inevaporite basins. Sedimentary Geology 127 (3–4), 213–240.
Vazquez, I., de la Fuente, P., 2007. Exactitud y precision de lacromatografıa ionica de alta resolucion (HPIC) en el estudiohidrogeologico de aniones y relaciones ionicas. In: Pulido-Bosch,A., IIIIII, Lopez-Geta, J.A., Ramos, G. (Eds.), Simposio Internac-
ional sobre Tecnologıa de la Intrusion de Agua de Mar enAcuıferos Costeros, 1. IGME, Madrid, pp. 831–838.
Vegeer, A.I., 1991. Goechemical methods for evaluating the originand evolution of groundwater in volcanic rocks. Ph.D. Thesis,Department of Hydrology and Water Resources, University ofArizona, Tucson, 251 pp.
Vengosh, A., Pankratov, I., 1998. Chloride/bromide and chloride/fluoride ratios of domestic sewage effluents and associatedcontaminated groundwater. Ground Water 36 (5), 815–824.
Vengosh, A., Hendry, H.J., 2001. Chloride-bromide-d11B systemat-ics of a thick clay-rich aquitard system. Water ResourcesResearch 37 (5), 1437–1444.
Vengosh, A., De Lange, G.J., Starinsky, A., 1998. Boron isotope andgeochemical evidence for the origin of Urania and Bannockbrines at the eastern Mediterranean: effect of water–rockinteractions. Geochimica et Cosmochimica Acta 62 (19–20),3221–3228.
Vengosh, A., Kloppmann, W., Marei, A., Livshitz, Y., Gutierrez, A.,Banna, M., Gueppot, C., Pankov, I., Raanan, H., 2005. Sources ofsalinity and boron in the Gaza strip: natural contaminant flow inthe Southern Mediterranean coastal aquifer. Water ResourcesResearch 41, W01013. doi:10.1029/2004WR003344.
Whittemore, D.O., 1988. Bromide as a tracer in ground-waterstudies: geochemistry and analytical determination. In: Pro-ceeding of the Ground Water Geochemical Conference. DenverNational Water Well Association, Dublin, OH, pp. 339–360.
Wilkinson, J., Reynolds, B., Neal, C., Hill, S., Neal, M., Harrow, M.,1997. Major, minor and trace element composition of cloud-water and rainwater at Plynlimon. Hydrology and Earth SystemSciences 1 (3), 557–569.
Wood, W.W., Sanford, W.E., 1995. Chemical and isotopic methodsfor quantifying ground-water recharge in a regional, semi-aridenvironment. Ground Water 33 (3), 458–468.
Yvon-Lewis, S.A., Butler, J.H., 2002. Effect of oceanic uptake onatmospheric lifetimes of selected trace gases. Journal ofGeophysical Research 107 (D20), 4414. doi:10.1029/2001JD001267.