Using the chemical equilibrium partitioning space to ... · molecular size of the compounds and the...
18
Atmos. Chem. Phys., 15, 3395–3412, 2015 www.atmos-chem-phys.net/15/3395/2015/ doi:10.5194/acp-15-3395-2015 © Author(s) 2015. CC Attribution 3.0 License. Using the chemical equilibrium partitioning space to explore factors influencing the phase distribution of compounds involved in secondary organic aerosol formation F. Wania 1,2 , Y. D. Lei 1,2,3 , C. Wang 1,2 , J. P. D. Abbatt 2 , and K.-U. Goss 4,5 1 Department of Physical and Environmental Sciences, University of Toronto Scarborough, 1265 Military Trail, Toronto, Ontario, M1C 1A4, Canada 2 Department of Chemistry, University of Toronto, Toronto, Ontario, M1C 1A4, Canada 3 Department of Chemical Engineering and Applied Chemistry, University of Toronto, Toronto, Ontario, M1C 1A4, Canada 4 Department of Analytical Environmental Chemistry, Centre for Environmental Research UFZ Leipzig-Halle, Permoserstraße 15, 04318 Leipzig, Germany 5 Institute of Chemistry, University of Halle-Wittenberg, Kurt-Mothes-Straße 2, 06120 Halle, Germany Correspondence to: F. Wania ([email protected]) Received: 22 September 2014 – Published in Atmos. Chem. Phys. Discuss.: 23 October 2014 Revised: 16 January 2015 – Accepted: 2 March 2015 – Published: 27 March 2015 Abstract. Many atmospheric and chemical variables influ- ence the partitioning equilibrium between gas phase and con- densed phases of compounds implicated in the formation of secondary organic aerosol (SOA). The large number of factors and their interaction makes it often difficult to as- sess their relative importance and concerted impact. Here we introduce a two-dimensional space which maps regions of dominant atmospheric phase distribution within a coordi- nate system defined by equilibrium partition coefficients be- tween the gas phase, an aqueous phase and a water-insoluble organic matter (WIOM) phase. Placing compounds formed from the oxidation of n-alkanes, terpenes and mono-aromatic hydrocarbons on the maps based on their predicted parti- tioning properties allows for a simple graphical assessment of their equilibrium phase distribution behaviour. Specifi- cally, it allows for the simultaneous visualisation and quan- titative comparison of the impact on phase distribution of changes in atmospheric parameters (such as temperature, salinity, WIOM-phase polarity, organic aerosol load, and liq- uid water content) and chemical properties (such as oxida- tion state, molecular size, functionalisation, and dimerisa- tion). The graphical analysis reveals that the addition of hy- droxyl, carbonyl and carboxyl groups increases the affinity of aliphatic, alicyclic and aromatic hydrocarbons for the aque- ous phase more rapidly than their affinity for WIOM, sug- gesting that the aqueous phase may often be relevant even for substances that are considerably larger than the C2 and C3 compounds that are typically believed to be associated with aqueous SOA. In particular, the maps identify some compounds that contribute to SOA formation if partitioning to both WIOM and aqueous phase is considered but would remain in the gas phase if either condensed phase were ne- glected. For example, many semi-volatile α-pinene oxida- tion products will contribute to aqueous SOA under the con- ditions of high liquid water content encountered in clouds but would remain vapours in wet aerosol. It is conceivable to develop parameterisations of “partitioning basis sets” that group compounds with comparable partitioning properties, which – when combined with data on the abundance of those groups of compounds – could serve in the simulation of SOA formation. 1 Introduction The phase distribution of oxidised organic compounds be- tween the gas phase and the condensed phases present in the atmosphere, and how that distribution is affected by at- mospheric and chemical variables, is central to the under- standing and quantification of the formation of secondary or- Published by Copernicus Publications on behalf of the European Geosciences Union.
Transcript of Using the chemical equilibrium partitioning space to ... · molecular size of the compounds and the...

Atmos. Chem. Phys., 15, 3395–3412, 2015
www.atmos-chem-phys.net/15/3395/2015/
doi:10.5194/acp-15-3395-2015
© Author(s) 2015. CC Attribution 3.0 License.
Using the chemical equilibrium partitioning space to explore factors
influencing the phase distribution of compounds involved in
secondary organic aerosol formation
F. Wania1,2, Y. D. Lei1,2,3, C. Wang1,2, J. P. D. Abbatt2, and K.-U. Goss4,5
1Department of Physical and Environmental Sciences, University of Toronto Scarborough, 1265 Military Trail, Toronto,
Ontario, M1C 1A4, Canada2Department of Chemistry, University of Toronto, Toronto, Ontario, M1C 1A4, Canada3Department of Chemical Engineering and Applied Chemistry, University of Toronto, Toronto, Ontario, M1C 1A4, Canada4Department of Analytical Environmental Chemistry, Centre for Environmental Research UFZ Leipzig-Halle,
Permoserstraße 15, 04318 Leipzig, Germany5Institute of Chemistry, University of Halle-Wittenberg, Kurt-Mothes-Straße 2, 06120 Halle, Germany
Correspondence to: F. Wania ([email protected])
Received: 22 September 2014 – Published in Atmos. Chem. Phys. Discuss.: 23 October 2014
Revised: 16 January 2015 – Accepted: 2 March 2015 – Published: 27 March 2015
Abstract. Many atmospheric and chemical variables influ-
ence the partitioning equilibrium between gas phase and con-
densed phases of compounds implicated in the formation
of secondary organic aerosol (SOA). The large number of
factors and their interaction makes it often difficult to as-
sess their relative importance and concerted impact. Here
we introduce a two-dimensional space which maps regions
of dominant atmospheric phase distribution within a coordi-
nate system defined by equilibrium partition coefficients be-
tween the gas phase, an aqueous phase and a water-insoluble
organic matter (WIOM) phase. Placing compounds formed
from the oxidation of n-alkanes, terpenes and mono-aromatic
hydrocarbons on the maps based on their predicted parti-
tioning properties allows for a simple graphical assessment
of their equilibrium phase distribution behaviour. Specifi-
cally, it allows for the simultaneous visualisation and quan-
titative comparison of the impact on phase distribution of
changes in atmospheric parameters (such as temperature,
salinity, WIOM-phase polarity, organic aerosol load, and liq-
uid water content) and chemical properties (such as oxida-
tion state, molecular size, functionalisation, and dimerisa-
tion). The graphical analysis reveals that the addition of hy-
droxyl, carbonyl and carboxyl groups increases the affinity of
aliphatic, alicyclic and aromatic hydrocarbons for the aque-
ous phase more rapidly than their affinity for WIOM, sug-
gesting that the aqueous phase may often be relevant even
for substances that are considerably larger than the C2 and
C3 compounds that are typically believed to be associated
with aqueous SOA. In particular, the maps identify some
compounds that contribute to SOA formation if partitioning
to both WIOM and aqueous phase is considered but would
remain in the gas phase if either condensed phase were ne-
glected. For example, many semi-volatile α-pinene oxida-
tion products will contribute to aqueous SOA under the con-
ditions of high liquid water content encountered in clouds
but would remain vapours in wet aerosol. It is conceivable
to develop parameterisations of “partitioning basis sets” that
group compounds with comparable partitioning properties,
which – when combined with data on the abundance of those
groups of compounds – could serve in the simulation of SOA
formation.
1 Introduction
The phase distribution of oxidised organic compounds be-
tween the gas phase and the condensed phases present in
the atmosphere, and how that distribution is affected by at-
mospheric and chemical variables, is central to the under-
standing and quantification of the formation of secondary or-
Published by Copernicus Publications on behalf of the European Geosciences Union.

3396 F. Wania et al.: SOA compounds in the equilibrium partitioning space
ganic aerosol (SOA) (Hallquist et al., 2009). For example, the
molecular size of the compounds and the functional groups
they contain have a strong influence on their preference for
either the gas phase or the condensed phase(s) making up an
aerosol particle. Atmospheric temperature strongly impacts
that phase equilibrium. The concentration and the polarity of
the organic particulate matter present in the atmosphere play
a role, as do relative humidity and the resultant liquid water
content of the atmosphere. The presence of electrolytes such
as ammonium sulfate and sodium chloride further modifies
the gas phase–aqueous phase equilibrium. How all these vari-
ables impact gas–particle partitioning is reasonably well un-
derstood and in most cases can even be quantified with some
confidence (e.g. Zuend and Seinfeld, 2012; Shiraiwa et al.,
2013). Nevertheless, due to the large number of the variables
and their interaction, it is often difficult to assess the relative
importance of each of these variables and to fully compre-
hend the concerted impact of all of them acting together. In
fact, different variables will be important for different chem-
icals and under different atmospheric circumstances.
Graphical methods illustrating the effect of multiple vari-
ables within a common framework can be a powerful tool
for understanding their relative importance and concerted im-
pact (e.g. Wong and Wania, 2011). They can also aid in the
identification and prioritisation of data gaps by indicating for
which compounds and which circumstances a more precise
quantification of the effect of a variable on phase partitioning
is required and when approximate knowledge can be toler-
ated.
Ten years ago, we introduced the chemical partitioning
space as a graphical method for furthering the understand-
ing of the concerted impact of multiple variables on the
phase distribution of semi-volatile organic trace contami-
nants, such as polycyclic aromatic hydrocarbons and poly-
chlorinated biphenyls, in the atmosphere (Lei and Wania,
2004). The basic idea of the chemical partitioning space is
to calculate and display regions of dominant phase distribu-
tion within a coordinate system defined by equilibrium phase
partition coefficients, and then to place substances on the re-
sulting maps based on their partitioning properties under cer-
tain prevailing conditions (e.g. of temperature). This allows
for a simple graphical assessment of the substances’ equilib-
rium phase distribution behaviour and, in turn, their deposi-
tional and reactive fate (Lei and Wania, 2004; Westgate and
Wania, 2013). We believe, and seek to demonstrate here, that
the chemical partitioning space could also be used to gain
a deeper appreciation of the impact of various chemical and
atmospheric variables on the phase distribution behaviour of
SOA compounds. Because SOA formation strongly depends
on the phase distribution behaviour of those substances, this
also amounts to an exploration of the impact of those vari-
ables on the likelihood and the extent of SOA formation, as
well as on the nature of the SOA formed.
The atmospheric chemistry community has a long tra-
dition of using graphical tools to illustrate and advance
understanding of atmospheric processes (e.g. Pankow and
Barsanti, 2009; Heald et al., 2010; Kroll et al., 2011; Isaac-
man et al., 2011; Donahue et al., 2011, 2012; Cappa and Wil-
son, 2012), and there are precedents of displaying the phase
distribution behaviour of SOA compounds as a function of
chemical equilibrium partitioning parameters. The volatility
basis set (VBS) approach by Donahue et al. (2006, 2011,
2012), in both its one-dimensional and two-dimensional
manifestations, is sometimes used to indicate the distribu-
tion between gas and particle phase as a function of or-
ganic aerosol load and a compound’s saturation concentra-
tion, which is defined as the reciprocal of a gas–particle
partition coefficient and typically derived from saturation
vapour pressure (Donahue et al., 2006). Similarly, Volka-
mer et al. (2009) displayed the distribution of glyoxal be-
tween gas and aqueous phase as a function of an effective
Henry’s law constant and the atmospheric liquid water con-
tent. However, to the best of our knowledge, no attempt has
been made so far to similarly display graphically the distri-
bution behaviour of SOA compounds between the gas phase,
the atmospheric liquid water phase and the organic aerosol
phase at the same time. Notably, the two-dimensional repre-
sentations of organic compounds used in the SOA commu-
nity employ a chemical equilibrium partitioning parameter
for at most one of the two dimensions and thus do not have
a sole focus on phase distribution. Even if they do consider
phase distribution behaviour (e.g. the 2-D VBS; Donahue et
al., 2011, 2012), the existence of a liquid water phase in the
atmosphere is ignored. Recently, Hodzic et al. (2014) placed
SOA compounds in a two-dimensional space defined by sat-
uration concentration and effective Henry’s law constant in
order to observe and derive relationships between these two
parameters for different groups of SOA compounds.
After first introducing the chemical partitioning space for
the atmosphere, we explain how to place SOA compounds
within the space and how to account for the influence of var-
ious variables on that placement. Using the partitioning space
we then illustrate the impact of prediction uncertainty, tem-
perature, salting-out effect, phase polarity, liquid water con-
tent, organic aerosol load and chemical ageing (i.e. function-
alisation and oligomerisation) on the phase distribution of se-
lected oxidation products of n-alkanes, biogenic terpenes and
aromatic hydrocarbons.
2 Methods
2.1 Defining the chemical partitioning space
The equilibrium partition coefficient of a chemical between
two phases X and Y is defined as
KX/Y =CX
CY
, (1)
where CX and CY are the concentrations in phase X and Y
in units of mol m−3 of phase. KX/Y thus has units of m3 of
Atmos. Chem. Phys., 15, 3395–3412, 2015 www.atmos-chem-phys.net/15/3395/2015/

F. Wania et al.: SOA compounds in the equilibrium partitioning space 3397
phase Y per m3 of phase X. In a system consisting of the
gas (G) phase, an aqueous (W) phase and a water-insoluble
organic matter (WIOM) phase, there are three partition coef-
ficients, which are related to each other according to
KW/G =KW/WIOM
KG/WIOM
. (2)
Two of the three coefficients are therefore sufficient to de-
scribe a chemical’s relative preferences for the three phases.
Two coefficients in logarithmic form can be used to de-
fine a two-dimensional coordinate system, which we call the
chemical partitioning space. In Fig. 1a, log KW/G and log
KWIOM/G are used to define such a space.
The equilibrium partition coefficient between WIOM and
the gas phase (KWIOM/G) on the x axis is related to the gas–
particle partition coefficientK’ in units of m3 µg−1 (Pankow,
2003) through
KWIOM/G =K′δWIOM
106 µg
g, (3)
where δWIOM is the density of WIOM in units of g m−3. The
equilibrium partition coefficient between water and gas phase
KW/G on the y axis is related to the Henry’s law constants
H in units of mol Pa−1 m−3, or to H ′ in the non-SI units of
M atm−1 favoured by the atmospheric chemistry community,
through
KW/G =HRT =H′RT ×
1atmL
101.325Pam3. (4)
where R is the ideal gas constant (8.314 Pa m3 K−1 mol−1)
and T is absolute temperature in K. A chemical can be placed
in such a coordinate system based on its equilibrium partition
coefficients.
We should mention that the use of the term WIOM does
not imply that the compounds making up this phase necessar-
ily have low water solubility. Even relatively water-soluble
compounds can have a higher preference for solvation in an
organic phase than in a mostly aqueous phase.
2.2 Displaying chemical phase distribution in the
partitioning space
If a three-phase system consisting of gas, water and WIOM is
at chemical equilibrium, the fraction 8X of the total amount
of a chemical that is in one of the three phases can be calcu-
lated using (Lei and Wania, 2004)
φG = 1/
(1+KW/G
VW
VG
+KWIOM/G
VWIOM
VG
), (5)
φW = 1/
(1+KG/W
VG
VW
+KWIOM/W
VWIOM
VW
), (6)
φWIOM = 1/
(1+KG/WIOM
VG
VWIOM
+KW/WIOM
VW
VWIOM
). (7)
This means that the chemical’s phase distribution depends
only on its equilibrium partition coefficients and the phase
volumes VX in m3. In the atmosphere, VW and VWIOM are
negligibly small compared to VG and the volume ratios
VW/VG, and VWIOM/VG can be calculated from the liquid
water content (LWC) and the organic aerosol load (OAL) in
units of µg m−3 using
VW
VG
= LWC in µgm−3× 10⁻⁶ g
µg× 10−6 m3
g, (8)
VWIOM
VG
= OAL in µgm−3× 10⁻⁶ g
µg× 10−6 m3
g. (9)
We thereby assume that water and WIOM have a density of
106 g m−3.
If we now assume LWC and OAL to be fixed, the phase
distribution as calculated in Eqs. (5)–(7) only depends on the
partition coefficients and we can display the values of 8G,
8W, and8WIOM within the partitioning space. In Fig. 1a this
has been done assuming a LWC of 10 µg m−3 and an OAL of
10 µg m−3. In the red-coloured upper left of the partitioning
space are chemicals with low KW/G and low KWIOM/G, i.e.
chemicals favouring the gas phase over the aqueous phase
and WIOM. Accordingly they are predominantly in the gas
phase (different shades of red are used to indicate areas of
the space where 8G exceeds 50, 90 and 99 %). In the blue-
coloured lower left of the space are chemicals with high
KW/G and lowKWIOM/G, i.e. highly water-soluble chemicals
that favour the gas phase over the WIOM phase and thus par-
tition predominantly into the aqueous phase (different shades
of blue indicate areas of the space where 8W exceeds 50, 90
and 99 %). Finally, in the green-coloured upper right of the
space are chemicals with low KW/G and high KWIOM/G, i.e.
sparingly water-soluble substances of low volatility that par-
tition predominantly into the WIOM phase (different shades
of green indicate areas of the space where 8WIOM exceeds
50, 90 and 99 %).
The lines between the fields coloured in red, blue and
green (8G =8W =8WIOM = 50 %) indicate the KW/G and
KWIOM/G thresholds, where the transition of chemicals from
mostly in the gas phase to mostly in the aqueous or WIOM
phase occurs (Fig. 1a). The vertical threshold between pre-
dominant partitioning into gas and WIOM phase occurs at
log KWIOM/G = log (VG/VWIOM) and the horizontal thresh-
old between predominant partitioning into gas and aqueous
phase at logKW/G = log (VG/VW). At the assumed LWC and
OAL of 10 µg m−3, this corresponds to log KW/G and log
KWIOM/G values of 11.
Because of the thermodynamic relationship of Eq. (2),
KWIOM/W equals KWIOM/G divided by KW/G, and diago-
nal lines from the upper left to the lower right in the parti-
tioning space designate lines of equal KWIOM/W. The diago-
nal lines in the lower right of Fig. 1a therefore show where
the transition from dominant partitioning into WIOM and
aqueous phase takes place. If liquid water and WIOM are
equally abundant (LWC and OAL is 10 µg m−3) the thresh-
old falls at log KWIOM/G = log (VG/VWIOM)= log 1= 0.
www.atmos-chem-phys.net/15/3395/2015/ Atmos. Chem. Phys., 15, 3395–3412, 2015
3398 F. Wania et al.: SOA compounds in the equilibrium partitioning space
!5#
!3#
!1#
1#
3#
5#
7#
9#
11#
13#
15#
17#
19#2# 4# 6# 8# 10# 12# 14# 16# 18#
log$K W
/G$
log$KWIOM/G$
!5#
!3#
!1#
1#
3#
5#
7#
9#
11#
13#
15#
17#
19#2# 4# 6# 8# 10# 12# 14# 16# 18#
log$K W
/G$
log$KWIOM/G$
50 % gas, 50 % aqueous
90 % gas, 10 % aqueous
10 % gas, 90 % aqueous
99 % gas, 1 % aqueous
aqueous phase
1 % gas, 99 % aqueous
gas phase
WIOM phase
50 %
gas
, 50
% W
IOM
90 %
gas
, 10
% W
IOM
10 %
gas
, 90
% W
IOM
99 %
gas
, 1 %
WIO
M
1 %
gas
, 99
% W
IOM
50 % WIOM, 50 % aqueous
90 % WIOM, 10 % aqueous
10 % WIOM, 90 % aqueous
99 % WIOM, 1 % aqueous
1 % WIOM, 99 % aqueous
10 µg/m3 WIOM, 10 µg/m3 H2O
WIOM phase
aqueous phase
gas phase
10 µg WIO
M/m
3 1 µg W
IOM
/m3
100 µg WIO
M/m
3
10 µg H2O/m3 0.1 µg W
IOM
/m3
100 µg H2O/m3
1 µg H2O/m3
Ambient Aerosol
0.3 g H2O/m3
!5#
!3#
!1#
1#
3#
5#
7#
9#
11#
13#
15#
17#
19#2# 4# 6# 8# 10# 12# 14# 16# 18#
log$K W
/G$
log$KWIOM/G$
Within Cloud WIOM phase
aqueous phase
gas phase
10 µg WIO
M/m
3
1 µg WIO
M/m
3
100 µg WIO
M/m
3
10 µg WIO
M/m
3
1 µg WIO
M/m
3
100 µg WIO
M/m
3
1000 µg WIO
M/m
3
!5#
!3#
!1#
1#
3#
5#
7#
9#
11#
13#
15#
17#
19#2# 4# 6# 8# 10# 12# 14# 16# 18#
log$K W
/G$
log$KWIOM/G$
Dry Chamber Experiment WIOM phase
gas phase
a b
c d
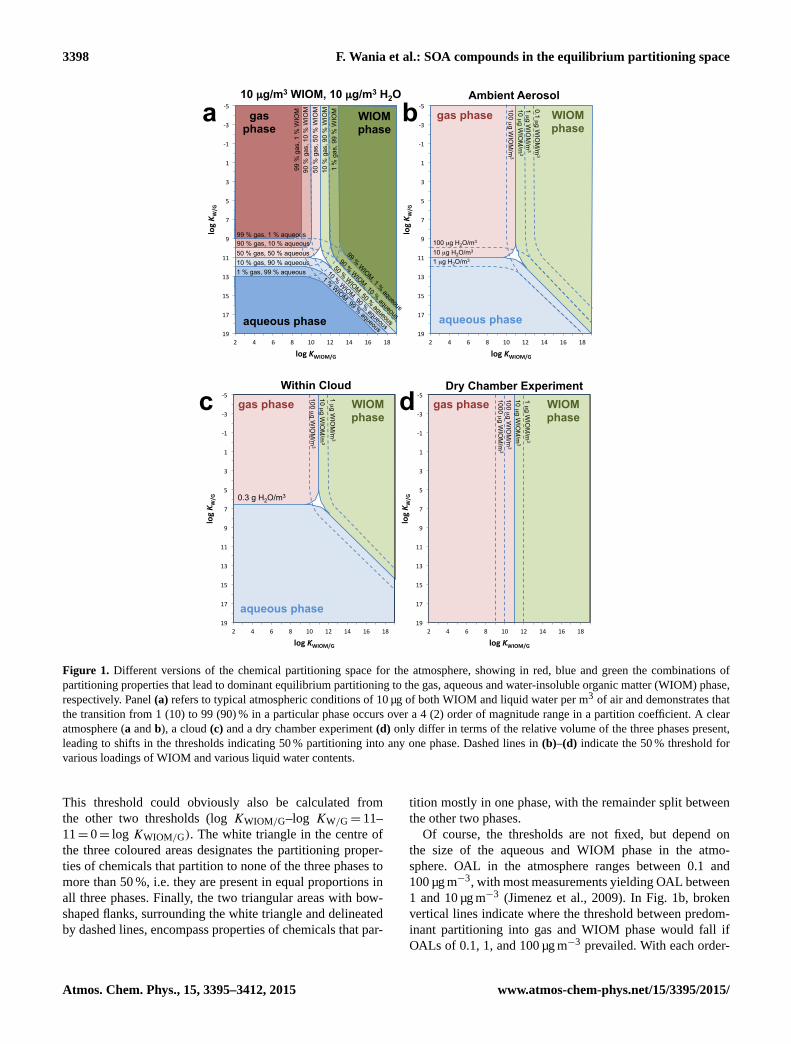
Figure 1. Different versions of the chemical partitioning space for the atmosphere, showing in red, blue and green the combinations of
partitioning properties that lead to dominant equilibrium partitioning to the gas, aqueous and water-insoluble organic matter (WIOM) phase,
respectively. Panel (a) refers to typical atmospheric conditions of 10 µg of both WIOM and liquid water per m3 of air and demonstrates that
the transition from 1 (10) to 99 (90) % in a particular phase occurs over a 4 (2) order of magnitude range in a partition coefficient. A clear
atmosphere (a and b), a cloud (c) and a dry chamber experiment (d) only differ in terms of the relative volume of the three phases present,
leading to shifts in the thresholds indicating 50 % partitioning into any one phase. Dashed lines in (b)–(d) indicate the 50 % threshold for
various loadings of WIOM and various liquid water contents.
This threshold could obviously also be calculated from
the other two thresholds (log KWIOM/G–log KW/G= 11–
11= 0= log KWIOM/G). The white triangle in the centre of
the three coloured areas designates the partitioning proper-
ties of chemicals that partition to none of the three phases to
more than 50 %, i.e. they are present in equal proportions in
all three phases. Finally, the two triangular areas with bow-
shaped flanks, surrounding the white triangle and delineated
by dashed lines, encompass properties of chemicals that par-
tition mostly in one phase, with the remainder split between
the other two phases.
Of course, the thresholds are not fixed, but depend on
the size of the aqueous and WIOM phase in the atmo-
sphere. OAL in the atmosphere ranges between 0.1 and
100 µg m−3, with most measurements yielding OAL between
1 and 10 µg m−3 (Jimenez et al., 2009). In Fig. 1b, broken
vertical lines indicate where the threshold between predom-
inant partitioning into gas and WIOM phase would fall if
OALs of 0.1, 1, and 100 µg m−3 prevailed. With each order-
Atmos. Chem. Phys., 15, 3395–3412, 2015 www.atmos-chem-phys.net/15/3395/2015/
F. Wania et al.: SOA compounds in the equilibrium partitioning space 3399
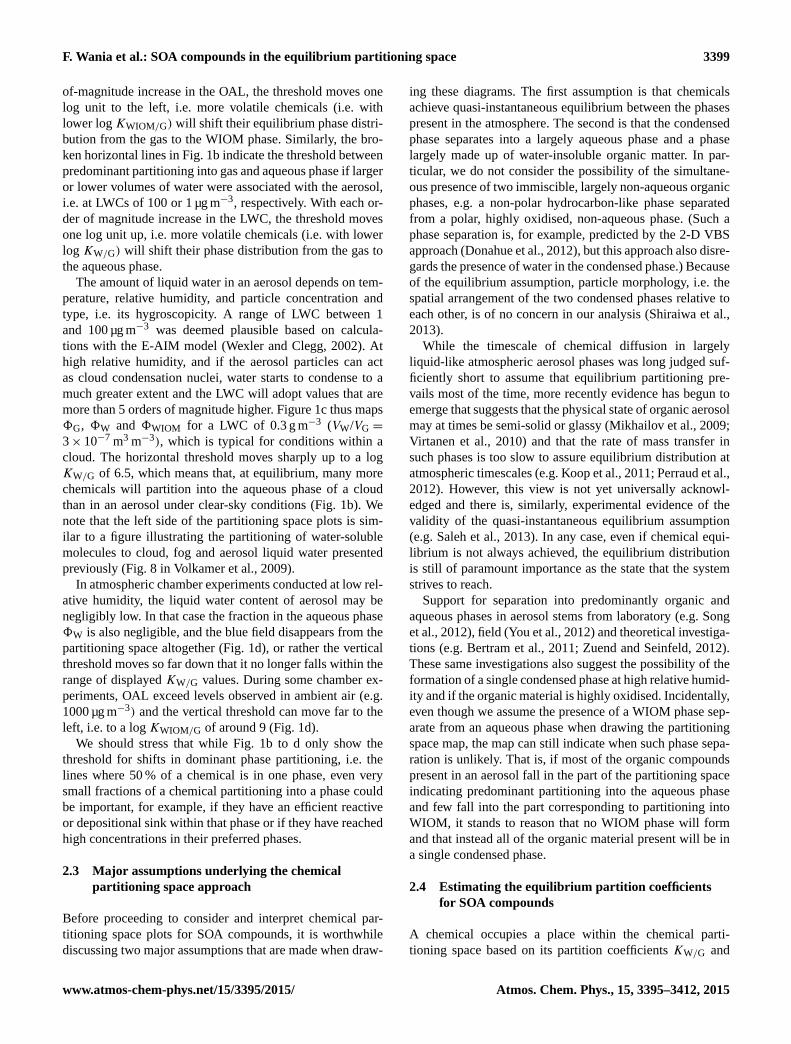
of-magnitude increase in the OAL, the threshold moves one
log unit to the left, i.e. more volatile chemicals (i.e. with
lower logKWIOM/G) will shift their equilibrium phase distri-
bution from the gas to the WIOM phase. Similarly, the bro-
ken horizontal lines in Fig. 1b indicate the threshold between
predominant partitioning into gas and aqueous phase if larger
or lower volumes of water were associated with the aerosol,
i.e. at LWCs of 100 or 1 µg m−3, respectively. With each or-
der of magnitude increase in the LWC, the threshold moves
one log unit up, i.e. more volatile chemicals (i.e. with lower
log KW/G) will shift their phase distribution from the gas to
the aqueous phase.
The amount of liquid water in an aerosol depends on tem-
perature, relative humidity, and particle concentration and
type, i.e. its hygroscopicity. A range of LWC between 1
and 100 µg m−3 was deemed plausible based on calcula-
tions with the E-AIM model (Wexler and Clegg, 2002). At
high relative humidity, and if the aerosol particles can act
as cloud condensation nuclei, water starts to condense to a
much greater extent and the LWC will adopt values that are
more than 5 orders of magnitude higher. Figure 1c thus maps
8G, 8W and 8WIOM for a LWC of 0.3 g m−3 (VW/VG =
3× 10⁻⁷ m3 m−3), which is typical for conditions within a
cloud. The horizontal threshold moves sharply up to a log
KW/G of 6.5, which means that, at equilibrium, many more
chemicals will partition into the aqueous phase of a cloud
than in an aerosol under clear-sky conditions (Fig. 1b). We
note that the left side of the partitioning space plots is sim-
ilar to a figure illustrating the partitioning of water-soluble
molecules to cloud, fog and aerosol liquid water presented
previously (Fig. 8 in Volkamer et al., 2009).
In atmospheric chamber experiments conducted at low rel-
ative humidity, the liquid water content of aerosol may be
negligibly low. In that case the fraction in the aqueous phase
8W is also negligible, and the blue field disappears from the
partitioning space altogether (Fig. 1d), or rather the vertical
threshold moves so far down that it no longer falls within the
range of displayed KW/G values. During some chamber ex-
periments, OAL exceed levels observed in ambient air (e.g.
1000 µg m−3) and the vertical threshold can move far to the
left, i.e. to a log KWIOM/G of around 9 (Fig. 1d).
We should stress that while Fig. 1b to d only show the
threshold for shifts in dominant phase partitioning, i.e. the
lines where 50 % of a chemical is in one phase, even very
small fractions of a chemical partitioning into a phase could
be important, for example, if they have an efficient reactive
or depositional sink within that phase or if they have reached
high concentrations in their preferred phases.
2.3 Major assumptions underlying the chemical
partitioning space approach
Before proceeding to consider and interpret chemical par-
titioning space plots for SOA compounds, it is worthwhile
discussing two major assumptions that are made when draw-
ing these diagrams. The first assumption is that chemicals
achieve quasi-instantaneous equilibrium between the phases
present in the atmosphere. The second is that the condensed
phase separates into a largely aqueous phase and a phase
largely made up of water-insoluble organic matter. In par-
ticular, we do not consider the possibility of the simultane-
ous presence of two immiscible, largely non-aqueous organic
phases, e.g. a non-polar hydrocarbon-like phase separated
from a polar, highly oxidised, non-aqueous phase. (Such a
phase separation is, for example, predicted by the 2-D VBS
approach (Donahue et al., 2012), but this approach also disre-
gards the presence of water in the condensed phase.) Because
of the equilibrium assumption, particle morphology, i.e. the
spatial arrangement of the two condensed phases relative to
each other, is of no concern in our analysis (Shiraiwa et al.,
2013).
While the timescale of chemical diffusion in largely
liquid-like atmospheric aerosol phases was long judged suf-
ficiently short to assume that equilibrium partitioning pre-
vails most of the time, more recently evidence has begun to
emerge that suggests that the physical state of organic aerosol
may at times be semi-solid or glassy (Mikhailov et al., 2009;
Virtanen et al., 2010) and that the rate of mass transfer in
such phases is too slow to assure equilibrium distribution at
atmospheric timescales (e.g. Koop et al., 2011; Perraud et al.,
2012). However, this view is not yet universally acknowl-
edged and there is, similarly, experimental evidence of the
validity of the quasi-instantaneous equilibrium assumption
(e.g. Saleh et al., 2013). In any case, even if chemical equi-
librium is not always achieved, the equilibrium distribution
is still of paramount importance as the state that the system
strives to reach.
Support for separation into predominantly organic and
aqueous phases in aerosol stems from laboratory (e.g. Song
et al., 2012), field (You et al., 2012) and theoretical investiga-
tions (e.g. Bertram et al., 2011; Zuend and Seinfeld, 2012).
These same investigations also suggest the possibility of the
formation of a single condensed phase at high relative humid-
ity and if the organic material is highly oxidised. Incidentally,
even though we assume the presence of a WIOM phase sep-
arate from an aqueous phase when drawing the partitioning
space map, the map can still indicate when such phase sepa-
ration is unlikely. That is, if most of the organic compounds
present in an aerosol fall in the part of the partitioning space
indicating predominant partitioning into the aqueous phase
and few fall into the part corresponding to partitioning into
WIOM, it stands to reason that no WIOM phase will form
and that instead all of the organic material present will be in
a single condensed phase.
2.4 Estimating the equilibrium partition coefficients
for SOA compounds
A chemical occupies a place within the chemical parti-
tioning space based on its partition coefficients KW/G and
www.atmos-chem-phys.net/15/3395/2015/ Atmos. Chem. Phys., 15, 3395–3412, 2015
3400 F. Wania et al.: SOA compounds in the equilibrium partitioning space
KWIOM/G. Ideally, one would use measured partition co-
efficients to locate a substance in the partitioning space
(Lei and Wania, 2004). However, because such data are
not available for many, if not most, of the substances in-
volved in SOA formation, we need to rely on predic-
tion methods when trying to locate SOA compounds in
the chemical partitioning space. We recently applied three
such methods to the prediction of KWIOM/G for substances
involved in SOA formation (Wania et al., 2014). These
methods, which were first applied to the issue of gas–
particle partitioning by Arp et al. (2008) and Arp and
Goss (2009), are poly-parameter linear free-energy relation-
ships (ppLFERs) calibrated with empirical aerosol sorption
data, the solvation models implemented in SPARC Performs
Automated Reasoning in Chemistry (SPARC) (Hilal et al.,
2004), and the quantum-chemical software COSMOtherm
(version C30_1401 with BP_TZVP_C30_1401 parameteri-
sation, COSMOlogic GmbH & Co. KG, Leverkusen, Ger-
many, 2014), which predict solvation equilibria from molec-
ular structure alone. The same three methods can also be used
to predict KW/G.
We compiled the chemical identity of compounds be-
lieved to form during the oxidation of normal alka-
nes with 8 to 17 carbons (Jordan et al., 2008), ter-
penes (Chen and Griffin, 2005) and aromatic hydrocar-
bons (Forstner et al., 1997). Additional oxidation prod-
ucts of α-pinene were taken from Camredon et al. (2010),
Shilling et al. (2009) and Valorso et al. (2011). Molecu-
lar structures of a total of more than 350 molecules were
drawn with ChemSketch (ACD/Labs, Advanced Chemistry
Development Inc. Toronto, Canada), which yields each
molecule’s SMILES (simplified molecular-input line-entry
system) string.
For the ppLFER approach, the molecules’ solute de-
scriptors were predicted with ABSOLV, which relies on a
group contribution quantitative structure property relation-
ship (ACD/Labs, Toronto, Canada). KW/G at different tem-
peratures were calculated directly using the ppLFER equa-
tions given by Goss (2006). KWIOM/G at 15 ◦C for four dif-
ferent aerosol particles (sampled from urban, suburban, rural
and coastal sites during different seasons) were calculated
using ppLFER equations by Arp et al. (2008), and adjusted
for temperature using an enthalpy of phase partitioning esti-
mated using the approach described in Wania et al. (2014).
The temperature-adjusted log KWIOM/G for the four aerosol
samples was averaged.
SPARC directly predicts KW/G and KWIOM/G as a func-
tion of temperature when provided with a SMILES code.
For the KWIOM/G prediction, SPARC requires a solvent to
be specified, which should have solvation properties that re-
semble those of WIOM in SOA (Wania et al., 2014). As
a default choice we used a relatively non-polar, hypotheti-
cal structure termed B, proposed to be an oligomerisation
product of the oxidation of volatile aromatics (Kalberer et
al., 2004; Arp and Goss, 2009; Wania et al., 2014). For
the estimation of KWIOM/G of the oxidation products of α-
pinene, we additionally used two molecules as surrogate sol-
vents that are themselves oxidation products of α-pinene: a
dimer formed by esterification of pinic acid and 10-hydroxy-
pinonic acid, referred to as ESTER_dimer by Zuend and
Seinfeld (2012), and 5-hydroperoxy-4-(hydroxymethyl)-5-
methyl-2-oxohexanoic acid, designated as C813OOH in the
Master Chemical Mechanism model. The latter chemical is
highly oxygenated and polar.
Wania et al. (2014) describe the prediction of KWIOM/G
for the n-alkane oxidation products using COSMOtherm and
the surrogate solvent B mentioned above. COSMOtherm was
similarly used to calculate KW/G for the n-alkane oxidation
products. COSMOtherm was also applied to estimate KW/G
and KWIOM/G at selected temperatures for 22 α-pinene oxi-
dation products, using either structure B, ESTER_dimer and
C813OOH as surrogate solvents to represent WIOM.
The salting-out effect on aqueous phase-gas phase equi-
librium was quantified by estimating a compound-specific
Setschenow coefficient KS in ammonium sulfate solution
using a ppLFER by Wang et al. (2014) and then calculat-
ing a salt solution–gas phase equilibrium partition coefficient
KS/G using
logKS/G = logKW/G− [salt]KS, (10)
where [salt] is the molar concentration of ammonium sulfate
in aqueous salt solution, which was varied between 0 and
6.6 M, the latter corresponding to a supersaturated solution as
may be encountered in aqueous aerosol (Zuend and Seinfeld,
2012).
All estimated partitioning data are given in an Excel© file
in the Supplement.
3 Results
3.1 Placing the SOA compounds in the chemical
partitioning space
Figure 2 shows the location of the SOA compounds in the
partitioning space. The chemicals are located based on their
KW/G and KWIOM/G at 15 ◦C estimated with SPARC us-
ing structure B as a surrogate for WIOM and assuming
no salting-out effect. Differently coloured markers designate
compounds derived from different precursors.
Comparing a chemical’s location relative to the thresholds
for dominant phase distribution, which were introduced in
Fig. 1 and are integrated into Fig. 2, allows us to graphically
deduce its phase distribution behaviour. It is apparent that the
oxidation products of n-alkanes (blue dots in Fig. 2) gener-
ally have higher log KWIOM/G and lower KW/G than the ox-
idation products of terpenes and aromatic hydrocarbons and
therefore tend to have a higher affinity for the WIOM phase
than the aqueous phase when they become insufficiently
volatile to remain in the gas phase. Lower KW/G values of
Atmos. Chem. Phys., 15, 3395–3412, 2015 www.atmos-chem-phys.net/15/3395/2015/

F. Wania et al.: SOA compounds in the equilibrium partitioning space 3401
aqueous phase
gas phase
10 µg WIO
M/m
3 1 µg W
IOM
/m3
100 µg WIO
M/m
3
10 µg H2O/m3
-‐5
-‐3
-‐1
1
3
5
7
9
11
13
15
17
19 2 4 6 8 10 12 14 16 18
log K W
/G
log KWIOM/G
WIOM phase
0.3 g H2O/m3
n-alkanes α & β-pinene d-limonene mono-aromatics
C17
C8 precursors
Figure 2. Placement of the selected oxidation products of n-
alkanes, biogenic terpenes and mono-aromatic hydrocarbons in the
partitioning space. KWIOM/G and KW/G at 15 ◦C and 0 M salt of
the compounds were estimated using SPARC assuming the solva-
tion properties of WIOM can be approximated by those of structure
B.
the products formed from α- and β-pinene and d-limonene
(green and red dots in Fig. 2, respectively) means that they
cluster around the line separating predominant partitioning
to WIOM and aqueous phase. The graphical analysis also
suggests that most of the oxidation products of the mono-
aromatic hydrocarbons identified by Forstner et al. (1997)
(yellow dots in Fig. 2) are too volatile to notably contribute
to organic aerosol formation under most atmospheric condi-
tions. SOA formed during the oxidation of mono-aromatics
(Ng et al., 2007; Wyche et al., 2009) is therefore unlikely
to be made up of the substances identified in Forstner et
al. (1997) and displayed in Fig. 2. An exception is a cloud,
where many oxidation products from all types of precursors
could be expected to partition substantially into cloud water.
Figure 2 does not show the position of small water-soluble
compounds, such as the C2 and C3 compounds typically as-
sociated with aqueous SOA (e.g. glyoxal, methylglyoxal, ox-
alic acid) (Lim et al., 2010). The distribution of these com-
pounds between gas and particle phase is often strongly influ-
enced by hydration and possibly other reactions in the aque-
ous phase (Ip et al., 2009; Volkamer et al., 2009; Kampf et
al., 2013) leading to “effective” partition coefficients that are
orders of magnitude higher than estimated ones (e.g. Rossig-
nol et al., 2012). Furthermore, many smaller acids are ex-
pected to ionise substantially under the pH condition prevail-
ing in aerosol water and the KW/G predicted for the neutral
form may often underestimate the preference for the aqueous
phase. Following Volkamer et al. (2009), it would be possible
to locate these compounds in the partitioning space based on
their “effective” partition coefficients, as long as these can be
reliably derived.
Figure 3 is identical to Fig. 2, except that now the mark-
ers designating the SOA compound are coloured based on
their average carbon oxidation state (OSC) and number of
carbons (nC). Figure S1 in the Supplement displays a similar
plot based on the compounds’ oxygen : carbon ratio (O : C).
These plots allow us to relate a chemical’s location in the par-
titioning space to its molecular size and oxidation state. An
increase in nC corresponds to a shift to the right in the chem-
ical partitioning space, i.e. larger chemicals have a higher
affinity for the WIOM phase relative to the gas phase. In-
creasing nC in the form of methylene groups, on the other
hand, hardly affects a chemical’s relative affinity for water
and the gas phase, i.e. an additional –CH2– decreases vapour
pressure and water solubility almost to the same extent. n-
alkane oxidation products that only deviate in their chain
length are arranged along lines that are parallel to the x axis
(Fig. 3a). If a series of compound varies in nC because of
additional aromatic carbons, such as the polycyclic aromatic
hydrocarbons, the increase in KWIOM/G is accompanied by
a smaller increase in KW/G (Lei and Wania, 2004). An in-
crease in a compound’s OSC is reflected by a shift down and
slightly to the right in the partitioning space, i.e. more oxi-
dised species have a higher relative affinity for the aqueous
than the WIOM and gas phase. SOA compounds’ OSC in-
creases largely because of the addition of oxygen contain-
ing functional group, which leads to an increase in KW/G.
The O : C ratio shows similar but less clear trends to the OSC
(Fig. S1).
3.2 Categorising compounds based on their
atmospheric phase distribution behaviour
We can now classify organic compounds based on their at-
mospheric phase distribution behaviour. Figure 4 assigns la-
bels to different zones of the chemical partitioning space.
Based on their tendency to partition to condensed phases,
compounds are classified as volatile (V), semi-volatile (SV),
low volatile (LV) and extremely low volatile (ELV). Based on
their preferred condensed phase, compounds are further cat-
egorised as hydrocarbon-like (HOC, preference for WIOM),
oxygenated (OOC, no obvious preferred condensed phase)
and water-soluble (WSOC, preference for aqueous phase).
At equilibrium, less than 1 % of a volatile organic com-
pound (VOC) (log KWIOM/G and log KW/G < 8) is predicted
to be in the condensed phase even under high-OAL condi-
tions (100 µg m−3). A chemical is presumed to be a low-
volatility organic compound (LVOC) (log KWIOM/G and log
KW/G > 14) if less than 1 % is predicted to be in the gas
phase even under low-OAL conditions (1 µg m−3). Semi-
volatile organic compounds (SVOCs) (8 < log KWIOM/G or
www.atmos-chem-phys.net/15/3395/2015/ Atmos. Chem. Phys., 15, 3395–3412, 2015

3402 F. Wania et al.: SOA compounds in the equilibrium partitioning space
Figure 3. Same as Fig. 2, except that markers are coloured based on a chemical’s number of carbon atoms (nC) (left) or its average carbon
oxidation state (OSC) (right).
logKW/G < 14) are in between VOCs and LVOCs. Similarly,
at equilibrium, less than 1 % of an HOC (log KWIOM/W > 3)
partitions into the aqueous phase, even under low-OAL con-
ditions, and less than 1 % of a WSOC (log KWIOM/W <−3)
partitions into the WIOM phase, even if OAL is high. OOCs
fall in between HOCs and WSOCs (−3 < log KWIOM/W < 3).
Because of the widely different LWC, SV-WSOCs occupy a
different part of the partitioning space under clear conditions
and in a cloud. Whereas chemicals with a log KW/G < 8 are
VOCs at low RH, that threshold shifts to a log KW/G of 3.5
within a cloud.
The nomenclature in Fig. 4 builds upon previous classi-
fications of SOA compounds (Kroll et al., 2011; Donahue
et al., 2012). In particular, the aerosol mass spectrometry
community uses HOA and OOA to refer to hydrocarbon-
like and oxygenated organic aerosol. However, the use of the
terms here may not always be entirely congruous with previ-
ous efforts. For example, our definition of SVOCs comprises
some of the compounds that would be called intermediate-
volatility organic compounds (IVOCs) and LVOCs by Don-
ahue et al. (2012).
Figure 4 reveals that higher-generation oxidation prod-
ucts of monoterpenes and mono-aromatic hydrocarbons fall
mostly into the SV-OOC category in the centre of the parti-
tioning space, indicating that they may partition to a signifi-
cant extent into gas, aqueous and WIOM phase depending on
the prevailing atmospheric conditions. This also means that
their exact placement in the space is important, because it
will affect the predicted phase distribution. So far, we have
used a single point to designate a chemical’s location in the
partitioning space, although this location is variable for two
primary reasons: prediction uncertainty and environmental
variability. In the next two sections, we will explore these
sources of variability in more detail.
3.3 Influence of prediction uncertainty on placement of
n-alkane oxidation products in the partitioning
space
In order to evaluate the uncertainty of the placement of chem-
icals in the partitioning space, we sought to quantify the con-
fidence of the KWIOM/G and KW/G predictions by compar-
ing the results of different prediction methods. The values
obtained for the partition coefficients of three n-alkanes (C9,
C13, C17) and their oxidation products at 25 ◦C by ppLFER
(average for four aerosols), SPARC (using structure B for
WIOM) and COSMOtherm (using structure B for WIOM)
are displayed in Fig. 5. The uncertainty ofKWIOM/G had pre-
viously been explored in Wania et al. (2014) and had been
found to be a composite of the uncertainty of the prediction
method and the uncertainty of the conceptual approach (how
well do a surrogate’s solvation properties match those of the
organic aerosol phase, and how representative are the solva-
tion properties of the four real aerosol types characterised by
Arp et al. (2008) of those of aerosol in general?). The un-
certainty of the KW/G is solely due to the uncertainty of the
prediction method.
We use arrows to illustrate the displacement of a chemical
in the partitioning space when we apply different prediction
Atmos. Chem. Phys., 15, 3395–3412, 2015 www.atmos-chem-phys.net/15/3395/2015/
F. Wania et al.: SOA compounds in the equilibrium partitioning space 3403
-‐5
-‐3
-‐1
1
3
5
7
9
11
13
15
17
19 2 4 6 8 10 12 14 16 18
log K W
/G
log KWIOM/G
SV-H
OC
s
LV-H
OC
s
ELV-
HO
Cs
SV-WSOCs (clear)
LV-WSOCs
ELV-WSOCs
SV-OOCs
LV-O
OCs
ELV-O
OCs
VOCs
SV-WSOCs (cloud)
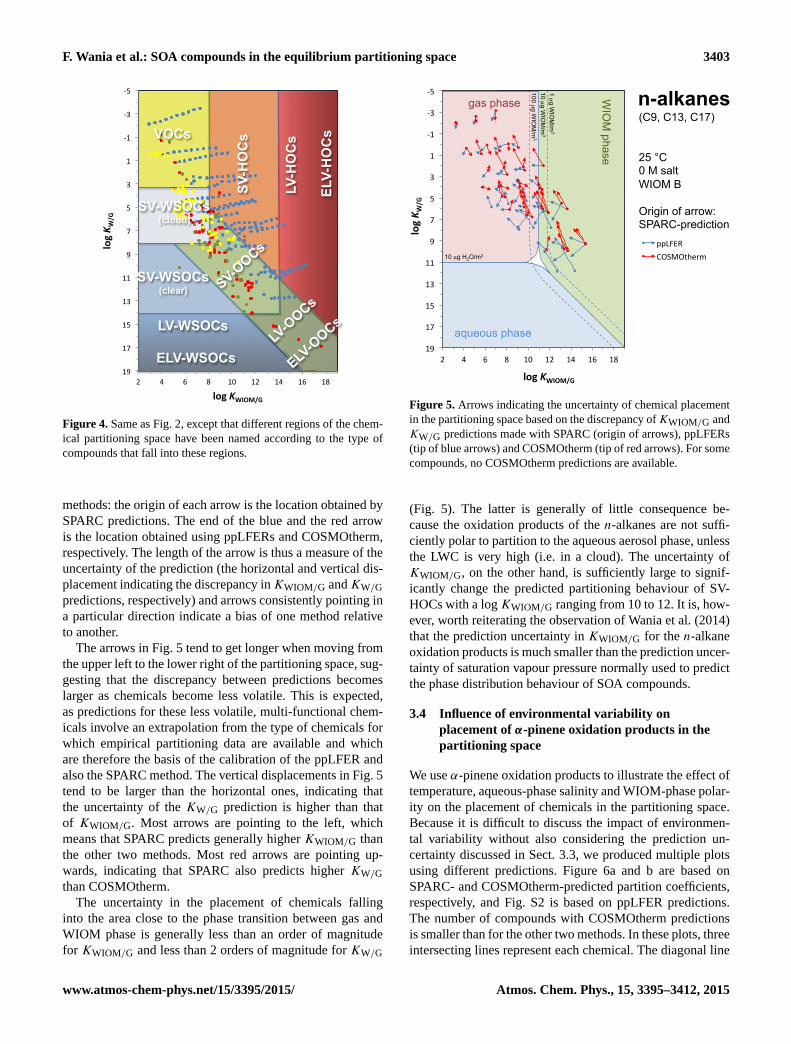
Figure 4. Same as Fig. 2, except that different regions of the chem-
ical partitioning space have been named according to the type of
compounds that fall into these regions.
methods: the origin of each arrow is the location obtained by
SPARC predictions. The end of the blue and the red arrow
is the location obtained using ppLFERs and COSMOtherm,
respectively. The length of the arrow is thus a measure of the
uncertainty of the prediction (the horizontal and vertical dis-
placement indicating the discrepancy inKWIOM/G andKW/G
predictions, respectively) and arrows consistently pointing in
a particular direction indicate a bias of one method relative
to another.
The arrows in Fig. 5 tend to get longer when moving from
the upper left to the lower right of the partitioning space, sug-
gesting that the discrepancy between predictions becomes
larger as chemicals become less volatile. This is expected,
as predictions for these less volatile, multi-functional chem-
icals involve an extrapolation from the type of chemicals for
which empirical partitioning data are available and which
are therefore the basis of the calibration of the ppLFER and
also the SPARC method. The vertical displacements in Fig. 5
tend to be larger than the horizontal ones, indicating that
the uncertainty of the KW/G prediction is higher than that
of KWIOM/G. Most arrows are pointing to the left, which
means that SPARC predicts generally higher KWIOM/G than
the other two methods. Most red arrows are pointing up-
wards, indicating that SPARC also predicts higher KW/G
than COSMOtherm.
The uncertainty in the placement of chemicals falling
into the area close to the phase transition between gas and
WIOM phase is generally less than an order of magnitude
for KWIOM/G and less than 2 orders of magnitude for KW/G
25 °C 0 M salt WIOM B Origin of arrow: SPARC-prediction
WIO
M phase
aqueous phase
gas phase
10 µg WIO
M/m
3 1 µg W
IOM
/m3
100 µg WIO
M/m
3 10 µg H2O/m3
n-alkanes (C9, C13, C17)
-‐5
-‐3
-‐1
1
3
5
7
9
11
13
15
17
19 2 4 6 8 10 12 14 16 18
log K W
/G
log KWIOM/G
ppLFER COSMOtherm
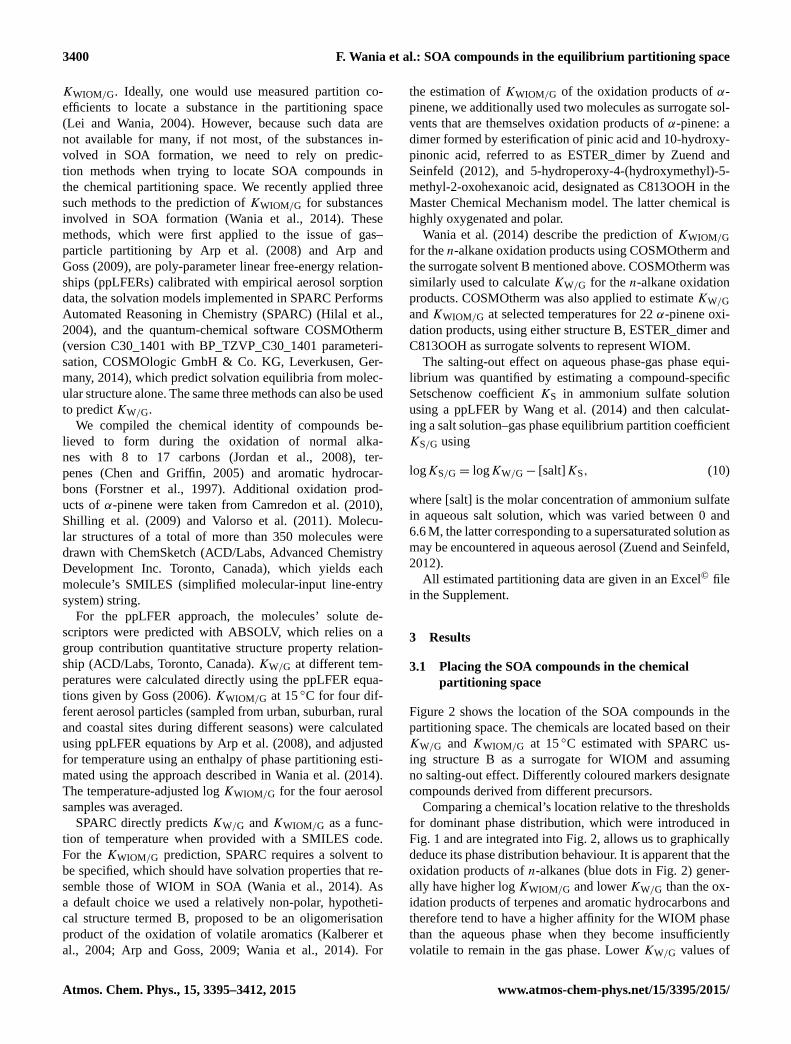
Figure 5. Arrows indicating the uncertainty of chemical placement
in the partitioning space based on the discrepancy ofKWIOM/G and
KW/G predictions made with SPARC (origin of arrows), ppLFERs
(tip of blue arrows) and COSMOtherm (tip of red arrows). For some
compounds, no COSMOtherm predictions are available.
(Fig. 5). The latter is generally of little consequence be-
cause the oxidation products of the n-alkanes are not suffi-
ciently polar to partition to the aqueous aerosol phase, unless
the LWC is very high (i.e. in a cloud). The uncertainty of
KWIOM/G, on the other hand, is sufficiently large to signif-
icantly change the predicted partitioning behaviour of SV-
HOCs with a logKWIOM/G ranging from 10 to 12. It is, how-
ever, worth reiterating the observation of Wania et al. (2014)
that the prediction uncertainty in KWIOM/G for the n-alkane
oxidation products is much smaller than the prediction uncer-
tainty of saturation vapour pressure normally used to predict
the phase distribution behaviour of SOA compounds.
3.4 Influence of environmental variability on
placement of α-pinene oxidation products in the
partitioning space
We use α-pinene oxidation products to illustrate the effect of
temperature, aqueous-phase salinity and WIOM-phase polar-
ity on the placement of chemicals in the partitioning space.
Because it is difficult to discuss the impact of environmen-
tal variability without also considering the prediction un-
certainty discussed in Sect. 3.3, we produced multiple plots
using different predictions. Figure 6a and b are based on
SPARC- and COSMOtherm-predicted partition coefficients,
respectively, and Fig. S2 is based on ppLFER predictions.
The number of compounds with COSMOtherm predictions
is smaller than for the other two methods. In these plots, three
intersecting lines represent each chemical. The diagonal line
www.atmos-chem-phys.net/15/3395/2015/ Atmos. Chem. Phys., 15, 3395–3412, 2015

3404 F. Wania et al.: SOA compounds in the equilibrium partitioning space
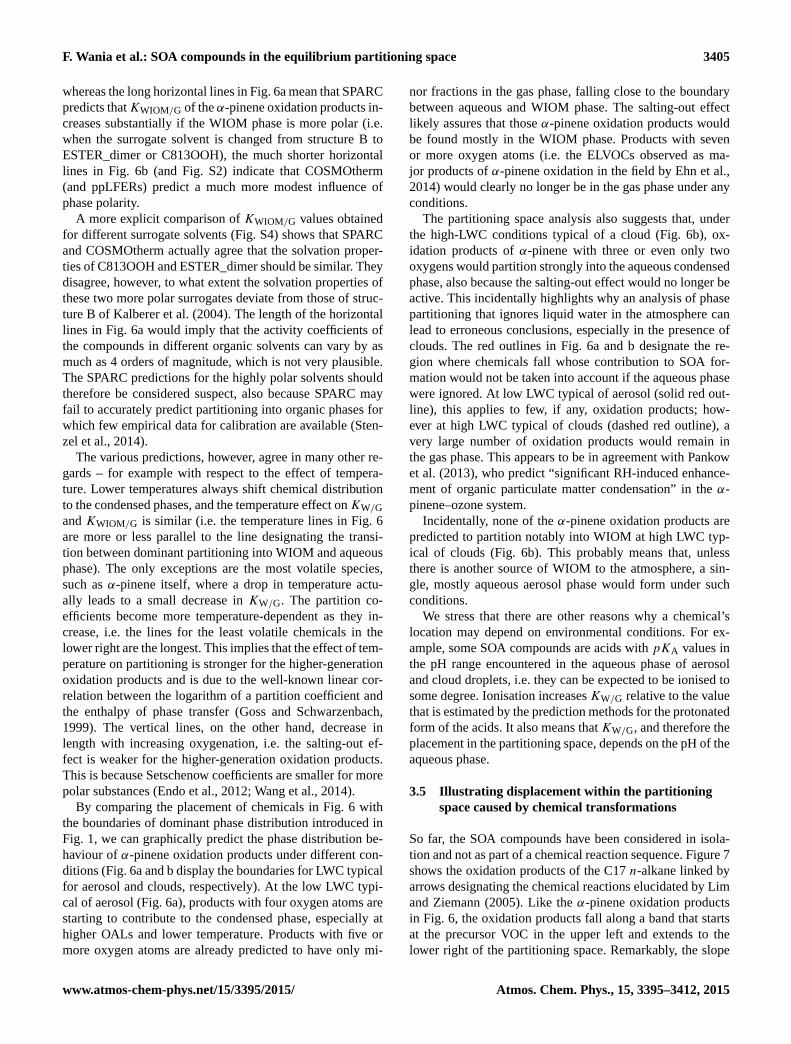
Figure 6. Placement of α-pinene and some of its oxidation products in the chemical partitioning space based on predictions with SPARC (a)
and COSMOtherm (b). Each chemical is represented by three lines, which account for the influence of temperature variations between 0 and
30 ◦C (diagonal line), the salting-out effect by 6.6 M (NH4)2SO4 (vertical line) and the polarity of the surrogate representing the solvation
properties of WIOM (horizontal line). The chemicals are superimposed on the dominant phase distribution maps for wet aerosol (a) and a
cloud (b). The red lines encircle regions where chemicals fall whose contribution to SOA formation would not be considered if the aqueous
phase in an aerosol (solid line) or cloud (dashed line) were ignored.
indicates the variability in the partition coefficients caused by
temperature (upper left of the line is for 30 ◦C; lower right is
for 0 ◦C). The vertical line designates the salting-out effect,
which yields a decrease in KW/G. The uppermost value on
that line indicates the KW/G in a 6.6 M supersaturated solu-
tion of (NH4)2SO4. The horizontal line indicates the range
ofKWIOM/G obtained by using different surrogate molecules
to represent the WIOM phase (Fig. 6). In the case of the
ppLFER-based plot (Fig. S2), the horizontal line indicates
the range of values obtained by applying ppLFER equations
for four different aerosols. Where the three lines intersect are
the partition coefficients at 15 ◦C and at 0 M (NH4)2SO4 us-
ing structure B as a surrogate for WIOM (Fig. 6) or the av-
erage of the four ppLFER-predicted KWIOM/G (Fig. S2). An
arrow plot (Fig. S3) further displays the discrepancy between
the three sets of predictions at 15 ◦C and 0 M.
The lines are coloured based on the number of oxygens in
the molecules, ranging from 0 (α-pinene itself) to 7 (a highly
oxygenated product listed by Valorso et al., 2011). Dashed
lines designate nitrated molecules. The α-pinene oxidation
products fall along a band from the upper left (α-pinene it-
self) to the lower right (highly oxygenated products as well
as dimers) of the partitioning space. Oxidation products with
the same number of oxygens tend to cluster together within
the partitioning space.
Differences between the prediction methods overall seem
quite random and not biased (the arrows in Fig. S3 point
in all sorts of directions). However, for the oxidation prod-
ucts with five or more oxygens, the blue arrows point
mostly to the upper right, i.e. the ppLFER predictions of
KWIOM/G appear to be generally biased low relative to
SPARC predictions and theKW/G values appear to be biased
high, i.e. ppLFER predictions favour the aqueous over the
WIOM phase. For three compounds (C108OOH, C813OOH,
C721CHO), the ppLFER-predicted KW/G is much lower
than the COSMOtherm-predicted one (by 4.5 to 5.5 or-
ders of magnitude), further suggesting that ppLFERs are
unduly favouring the aqueous phase. It is possible that the
highly functionalised α-pinene products fall outside the do-
main of applicability of the ppLFER equations (especially for
KW/G) and we therefore disregard the predictions displayed
in Fig. S2 in the further discussion.
It is readily apparent from Fig. 6 that environmental vari-
ability in temperature, aqueous-phase salinity and WIOM-
phase polarity can have a strong impact on the partitioning
properties of the SOA compounds and therefore the place-
ment within the partitioning space. Comparison of the length
of the lines in Fig. S3 with those in Fig. 6 suggests that,
in most cases, the effect of environmental parameter vari-
ability on chemical placement is larger than that caused by
prediction uncertainty. The length of the diagonal lines indi-
cates that temperature differences of 30 ◦C can change both
KW/G and KWIOM/G by orders of magnitude, and the length
of the vertical line demonstrates that salting-out can have a
similarly large effect on KW/G. COSMOtherm and SPARC
disagree to what extent phase polarity affects KWIOM/G:
Atmos. Chem. Phys., 15, 3395–3412, 2015 www.atmos-chem-phys.net/15/3395/2015/
F. Wania et al.: SOA compounds in the equilibrium partitioning space 3405
whereas the long horizontal lines in Fig. 6a mean that SPARC
predicts thatKWIOM/G of the α-pinene oxidation products in-
creases substantially if the WIOM phase is more polar (i.e.
when the surrogate solvent is changed from structure B to
ESTER_dimer or C813OOH), the much shorter horizontal
lines in Fig. 6b (and Fig. S2) indicate that COSMOtherm
(and ppLFERs) predict a much more modest influence of
phase polarity.
A more explicit comparison of KWIOM/G values obtained
for different surrogate solvents (Fig. S4) shows that SPARC
and COSMOtherm actually agree that the solvation proper-
ties of C813OOH and ESTER_dimer should be similar. They
disagree, however, to what extent the solvation properties of
these two more polar surrogates deviate from those of struc-
ture B of Kalberer et al. (2004). The length of the horizontal
lines in Fig. 6a would imply that the activity coefficients of
the compounds in different organic solvents can vary by as
much as 4 orders of magnitude, which is not very plausible.
The SPARC predictions for the highly polar solvents should
therefore be considered suspect, also because SPARC may
fail to accurately predict partitioning into organic phases for
which few empirical data for calibration are available (Sten-
zel et al., 2014).
The various predictions, however, agree in many other re-
gards – for example with respect to the effect of tempera-
ture. Lower temperatures always shift chemical distribution
to the condensed phases, and the temperature effect onKW/G
and KWIOM/G is similar (i.e. the temperature lines in Fig. 6
are more or less parallel to the line designating the transi-
tion between dominant partitioning into WIOM and aqueous
phase). The only exceptions are the most volatile species,
such as α-pinene itself, where a drop in temperature actu-
ally leads to a small decrease in KW/G. The partition co-
efficients become more temperature-dependent as they in-
crease, i.e. the lines for the least volatile chemicals in the
lower right are the longest. This implies that the effect of tem-
perature on partitioning is stronger for the higher-generation
oxidation products and is due to the well-known linear cor-
relation between the logarithm of a partition coefficient and
the enthalpy of phase transfer (Goss and Schwarzenbach,
1999). The vertical lines, on the other hand, decrease in
length with increasing oxygenation, i.e. the salting-out ef-
fect is weaker for the higher-generation oxidation products.
This is because Setschenow coefficients are smaller for more
polar substances (Endo et al., 2012; Wang et al., 2014).
By comparing the placement of chemicals in Fig. 6 with
the boundaries of dominant phase distribution introduced in
Fig. 1, we can graphically predict the phase distribution be-
haviour of α-pinene oxidation products under different con-
ditions (Fig. 6a and b display the boundaries for LWC typical
for aerosol and clouds, respectively). At the low LWC typi-
cal of aerosol (Fig. 6a), products with four oxygen atoms are
starting to contribute to the condensed phase, especially at
higher OALs and lower temperature. Products with five or
more oxygen atoms are already predicted to have only mi-
nor fractions in the gas phase, falling close to the boundary
between aqueous and WIOM phase. The salting-out effect
likely assures that those α-pinene oxidation products would
be found mostly in the WIOM phase. Products with seven
or more oxygen atoms (i.e. the ELVOCs observed as ma-
jor products of α-pinene oxidation in the field by Ehn et al.,
2014) would clearly no longer be in the gas phase under any
conditions.
The partitioning space analysis also suggests that, under
the high-LWC conditions typical of a cloud (Fig. 6b), ox-
idation products of α-pinene with three or even only two
oxygens would partition strongly into the aqueous condensed
phase, also because the salting-out effect would no longer be
active. This incidentally highlights why an analysis of phase
partitioning that ignores liquid water in the atmosphere can
lead to erroneous conclusions, especially in the presence of
clouds. The red outlines in Fig. 6a and b designate the re-
gion where chemicals fall whose contribution to SOA for-
mation would not be taken into account if the aqueous phase
were ignored. At low LWC typical of aerosol (solid red out-
line), this applies to few, if any, oxidation products; how-
ever at high LWC typical of clouds (dashed red outline), a
very large number of oxidation products would remain in
the gas phase. This appears to be in agreement with Pankow
et al. (2013), who predict “significant RH-induced enhance-
ment of organic particulate matter condensation” in the α-
pinene–ozone system.
Incidentally, none of the α-pinene oxidation products are
predicted to partition notably into WIOM at high LWC typ-
ical of clouds (Fig. 6b). This probably means that, unless
there is another source of WIOM to the atmosphere, a sin-
gle, mostly aqueous aerosol phase would form under such
conditions.
We stress that there are other reasons why a chemical’s
location may depend on environmental conditions. For ex-
ample, some SOA compounds are acids with pKA values in
the pH range encountered in the aqueous phase of aerosol
and cloud droplets, i.e. they can be expected to be ionised to
some degree. Ionisation increases KW/G relative to the value
that is estimated by the prediction methods for the protonated
form of the acids. It also means that KW/G, and therefore the
placement in the partitioning space, depends on the pH of the
aqueous phase.
3.5 Illustrating displacement within the partitioning
space caused by chemical transformations
So far, the SOA compounds have been considered in isola-
tion and not as part of a chemical reaction sequence. Figure 7
shows the oxidation products of the C17 n-alkane linked by
arrows designating the chemical reactions elucidated by Lim
and Ziemann (2005). Like the α-pinene oxidation products
in Fig. 6, the oxidation products fall along a band that starts
at the precursor VOC in the upper left and extends to the
lower right of the partitioning space. Remarkably, the slope
www.atmos-chem-phys.net/15/3395/2015/ Atmos. Chem. Phys., 15, 3395–3412, 2015
3406 F. Wania et al.: SOA compounds in the equilibrium partitioning space
WIOM phase
aqueous phase
gas phase
10 µg WIO
M/m
3 1 µg W
IOM
/m3
100 µg WIO
M/m
3
10 µg H2O/m3
0.1 µg WIO
M/m
3
100 µg H2O/m3
1 µg H2O/m3
ALKH
AP11
UR37
UR38 RP20
RP21
UR36 AP13 AP12
AP16
AP17 UR39
UR40
UR43 UR42
AP14
AP15
UR41
!5#
!3#
!1#
1#
3#
5#
7#
9#
11#
13#
15#
17#
19#2# 4# 6# 8# 10# 12# 14# 16# 18#
log$K W
/G$
log$KWIOM/G$
RP20#route#
AP11#route#
AP12#route#
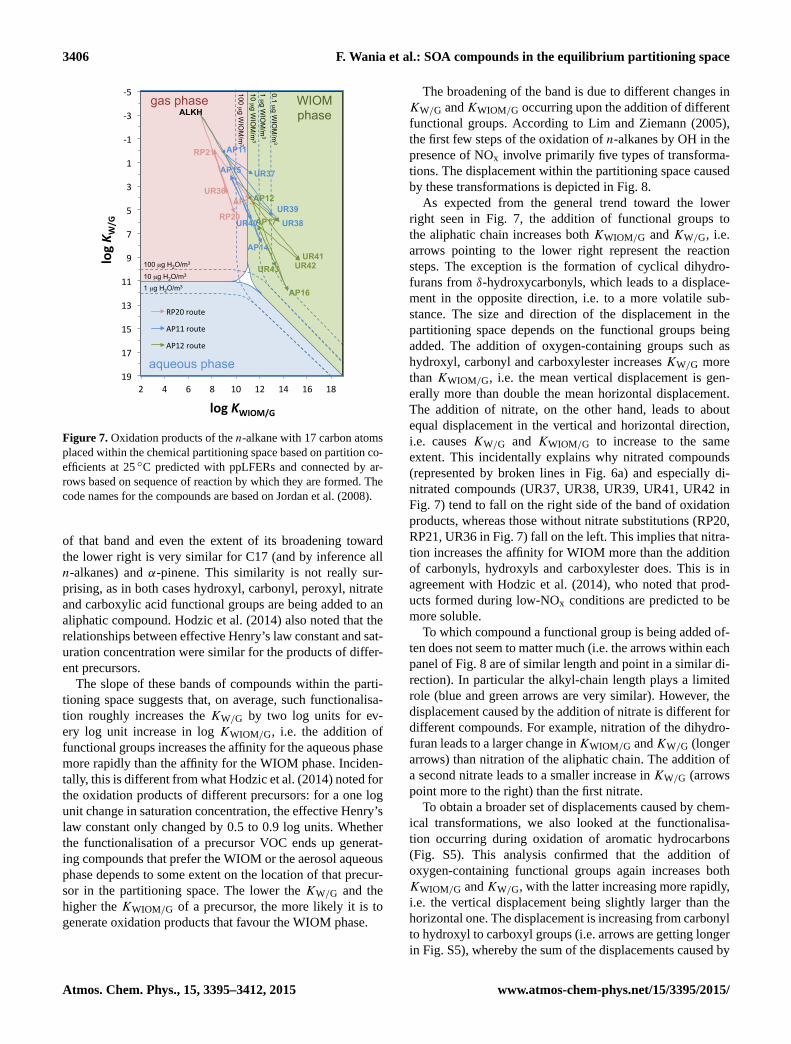
Figure 7. Oxidation products of the n-alkane with 17 carbon atoms
placed within the chemical partitioning space based on partition co-
efficients at 25 ◦C predicted with ppLFERs and connected by ar-
rows based on sequence of reaction by which they are formed. The
code names for the compounds are based on Jordan et al. (2008).
of that band and even the extent of its broadening toward
the lower right is very similar for C17 (and by inference all
n-alkanes) and α-pinene. This similarity is not really sur-
prising, as in both cases hydroxyl, carbonyl, peroxyl, nitrate
and carboxylic acid functional groups are being added to an
aliphatic compound. Hodzic et al. (2014) also noted that the
relationships between effective Henry’s law constant and sat-
uration concentration were similar for the products of differ-
ent precursors.
The slope of these bands of compounds within the parti-
tioning space suggests that, on average, such functionalisa-
tion roughly increases the KW/G by two log units for ev-
ery log unit increase in log KWIOM/G, i.e. the addition of
functional groups increases the affinity for the aqueous phase
more rapidly than the affinity for the WIOM phase. Inciden-
tally, this is different from what Hodzic et al. (2014) noted for
the oxidation products of different precursors: for a one log
unit change in saturation concentration, the effective Henry’s
law constant only changed by 0.5 to 0.9 log units. Whether
the functionalisation of a precursor VOC ends up generat-
ing compounds that prefer the WIOM or the aerosol aqueous
phase depends to some extent on the location of that precur-
sor in the partitioning space. The lower the KW/G and the
higher the KWIOM/G of a precursor, the more likely it is to
generate oxidation products that favour the WIOM phase.
The broadening of the band is due to different changes in
KW/G andKWIOM/G occurring upon the addition of different
functional groups. According to Lim and Ziemann (2005),
the first few steps of the oxidation of n-alkanes by OH in the
presence of NOx involve primarily five types of transforma-
tions. The displacement within the partitioning space caused
by these transformations is depicted in Fig. 8.
As expected from the general trend toward the lower
right seen in Fig. 7, the addition of functional groups to
the aliphatic chain increases both KWIOM/G and KW/G, i.e.
arrows pointing to the lower right represent the reaction
steps. The exception is the formation of cyclical dihydro-
furans from δ-hydroxycarbonyls, which leads to a displace-
ment in the opposite direction, i.e. to a more volatile sub-
stance. The size and direction of the displacement in the
partitioning space depends on the functional groups being
added. The addition of oxygen-containing groups such as
hydroxyl, carbonyl and carboxylester increases KW/G more
than KWIOM/G, i.e. the mean vertical displacement is gen-
erally more than double the mean horizontal displacement.
The addition of nitrate, on the other hand, leads to about
equal displacement in the vertical and horizontal direction,
i.e. causes KW/G and KWIOM/G to increase to the same
extent. This incidentally explains why nitrated compounds
(represented by broken lines in Fig. 6a) and especially di-
nitrated compounds (UR37, UR38, UR39, UR41, UR42 in
Fig. 7) tend to fall on the right side of the band of oxidation
products, whereas those without nitrate substitutions (RP20,
RP21, UR36 in Fig. 7) fall on the left. This implies that nitra-
tion increases the affinity for WIOM more than the addition
of carbonyls, hydroxyls and carboxylester does. This is in
agreement with Hodzic et al. (2014), who noted that prod-
ucts formed during low-NOx conditions are predicted to be
more soluble.
To which compound a functional group is being added of-
ten does not seem to matter much (i.e. the arrows within each
panel of Fig. 8 are of similar length and point in a similar di-
rection). In particular the alkyl-chain length plays a limited
role (blue and green arrows are very similar). However, the
displacement caused by the addition of nitrate is different for
different compounds. For example, nitration of the dihydro-
furan leads to a larger change inKWIOM/G andKW/G (longer
arrows) than nitration of the aliphatic chain. The addition of
a second nitrate leads to a smaller increase in KW/G (arrows
point more to the right) than the first nitrate.
To obtain a broader set of displacements caused by chem-
ical transformations, we also looked at the functionalisa-
tion occurring during oxidation of aromatic hydrocarbons
(Fig. S5). This analysis confirmed that the addition of
oxygen-containing functional groups again increases both
KWIOM/G andKW/G, with the latter increasing more rapidly,
i.e. the vertical displacement being slightly larger than the
horizontal one. The displacement is increasing from carbonyl
to hydroxyl to carboxyl groups (i.e. arrows are getting longer
in Fig. S5), whereby the sum of the displacements caused by
Atmos. Chem. Phys., 15, 3395–3412, 2015 www.atmos-chem-phys.net/15/3395/2015/

F. Wania et al.: SOA compounds in the equilibrium partitioning space 3407
a carbonyl and a hydroxyl group is larger than the displace-
ment caused by the addition of a carboxyl group. Similar to
the addition of a nitrate group to the n-alkane oxidation prod-
ucts (Fig. 8), the addition of a nitro group to a mono-aromatic
hydrocarbon increases KWIOM/G and KW/G to the same ex-
tent, i.e. horizontal and vertical displacements are very sim-
ilar (Fig. S5). Increasing the size of a mono-aromatic com-
pound through the addition of methyl and methylene groups
has only a very minor effect on the placement in the parti-
tioning space, increasing KWIOM/G only slightly and KW/G
hardly at all (Fig. S5).
In the case of –OH and –NO2 addition to a mono-aromatic
hydrocarbon, the displacement in the partitioning space can
be strongly dependent on the type of functional groups al-
ready present in the molecule. The difference in the change
in KWIOM/G and KW/G occurring upon the addition of –OH
directly to the aromatic ring or to an existing carbonyl group
(i.e. conversion of benzaldehyde to benzoic acid) is relatively
small (Fig. 9a). On the other hand, the effect on partitioning
upon the addition of –OH is much diminished if the hydroxyl
can form intramolecular hydrogen bonds with an existing
carbonyl or nitro group (Fig. 9a). The widely different shift in
the partitioning space occurring upon the addition of a nitro
group (Fig. 9b) further confirms that it is not merely the pres-
ence of existing polar functional groups in the molecules that
matters but whether those functional groups are in a position
to form intramolecular hydrogen bonds with the –NO2. For
example, SPARC predicts that the addition of –NO2 at the
ortho-position to an existing –OH hardly changes the parti-
tioning properties at all, whereas addition at the para-position
increases bothKWIOM/G andKW/G by more than 3 orders of
magnitude (Fig. 9b).
So far, we have only considered transformations that lead
to functionalisation of an aliphatic or aromatic carbon struc-
ture. Dimerisation reactions in the condensed phase are also
believed to play a role in SOA formation. Figure 10 shows
the displacements caused by various dimerisation reactions
proposed for the ozonolysis reaction products of α-pinene
by Camredon et al. (2010). The partition coefficients of
both monomers and dimers at 15 ◦C in this plot were esti-
mates with SPARC, although it is possible that the very large
dimer molecules fall outside of the domain of applicability
of SPARC.
Dimer formation increases both KWIOM/G and KW/G and
thus leads to a displacement to the lower right (Fig. 10).
The overall effect of dimerisation is the conversion of
semivolatile organic compounds into low and extremely
low volatility compounds. The extent and the direction of
displacement appear to depend on the type of reaction,
with hemiacetal and peroxyhemiacetal formation causing the
largest overall displacement (longest arrows in Fig. 10) and
the largest increase in KW/G relative to KWIOM/G (steepest
incline of the arrows in Fig. 10). Most dimerisations, how-
ever, are predicted to increase KWIOM/G and KW/G to the
same extent.
4 Conclusions and discussion
One main application of the chemical partitioning space
maps introduced here is the possibility to visualise and there-
fore easily compare the impact of a wide variety of factors
on SOA formation. For example, it allows for a direct com-
parison of the uncertainty of the prediction of partition coef-
ficients with the impact of atmospheric variability on these
coefficients. It facilitates a comparison of the direction and
size of the effects of temperature, salinity and organic-phase
polarity on the partitioning behaviour of different SOA com-
pounds. The change in partitioning behaviour occurring upon
dimerisation can be compared with that of adding a hydroxyl
or a nitrate functional group. Because everything is displayed
within the same two-dimensional framework, even very dif-
ferent factors can be assessed comparatively: prediction un-
certainty can be compared with the effect of a change in OAL
or LWC on partitioning, the effect of a chemical reaction, or
the effect of a change in temperature and ammonium sulfate
concentration.
This suitability for comparative visualisation can serve to
aid in the understanding of dynamic processes, where sev-
eral of the factors affecting phase distribution are chang-
ing at the same time. For example, during a photochemi-
cal smog episode, or during a chamber experiment, the pre-
cursor VOCs become oxidised, and with increasing func-
tionalisation – and eventually also dimerisation – the oxida-
tion products partition increasingly into the condensed phase
(i.e. they move to the lower right of the partitioning space)
(Fig. 11). As a result, the OAL is increasing, causing the
vertical threshold that separates dominant phase distribution
into gas and WIOM phase to move to the left (Fig. 11).
This implies that, with ongoing SOA formation, more and
more volatile chemicals become available for partitioning to
the WIOM. Overall, the changes in partitioning behaviour
caused by the chemical processes are considerably larger
than the shift in the threshold caused by the increase in OAL
(Fig. 11).
Similarly, during cloud droplet formation a large upward
shift in the horizontal threshold between dominant phase dis-
tribution into water and gas phase coincides with a downward
shift in the position of SOA compounds in the partitioning
space, as salts become diluted and the salting-out effect be-
comes negligible. Another example is the dilution of tail pipe
emissions, which is accompanied by a rapid decrease in both
OAL and temperature, having opposing effects on the parti-
tioning between gas and WIOM phase (May et al., 2013).
Another application of the partitioning space is the identi-
fication and prioritisation of data gaps. The maps graphically
highlight the factors and effects that matter and for which
compounds they matter. They provide guidance to distin-
guish processes and parameters that need to be known more
accurately and more precisely from those with tolerable un-
certainty. For example, there is little to be gained from im-
proved quantitative knowledge of the partitioning properties
www.atmos-chem-phys.net/15/3395/2015/ Atmos. Chem. Phys., 15, 3395–3412, 2015

3408 F. Wania et al.: SOA compounds in the equilibrium partitioning space
formation of δ-hydroxycarbonyls
formation of dihydrofurans from δ-hydroxycarbonyls
formation of carbonyl esters from dihydrofurans
addition of hydroxyl and nitrate
addition of nitrate
ALKH
RP20
AP11
AP14
AP12
AP16
RP20
RP21
AP15
AP14
AP17
AP16
RP21
AP15
AP17 UR36
UR40
UR43
ALKH
AP12
UR41
UR38
AP11
ALKH
AP11
UR37 AP12
UR38
RP21
AP15
AP17
AP13
UR39
UR42 to dihydrofuran
to aliphatic C
C17 C10
MVD: mean vertical displacement MHD: mean horizontal displacement
MHD: +3.05 MVD: +7.31
MHD: -2.41 MVD: -5.26
MHD: +1.54 MVD: +3.44
MHD: +3.47 MVD: +3.73
MHD: +2.24 MVD: +2.23
MHD: +4.26 MVD: +5.86
log KWIOM/G
log K
W/G
-‐4
-‐2
0
2
4
6
8
10
12
14 3 5 7 9 11 13 15 17
-‐4
-‐2
0
2
4
6
8
10
12
14 3 5 7 9 11 13 15 17
-‐4
-‐2
0
2
4
6
8
10
12
14 3 5 7 9 11 13 15 17
-‐4
-‐2
0
2
4
6
8
10
12
14 3 5 7 9 11 13 15 17
-‐4
-‐2
0
2
4
6
8
10
12
14 3 5 7 9 11 13 15 17
log KWIOM/G
log KWIOM/G
log K
W/G
Figure 8. Displacement of chemicals in the partitioning space caused by transformations involved in the oxidation of n-alkanes with 10
(blue) and 17 (green) carbons using predictions of KWIOM/G and KW/G at 25 ◦C obtained by ppLFER. Also given are the mean vertical
displacement (MVD) and mean horizontal displacement (MHD).
Figure 9. Displacement in the chemical partitioning space occurring upon the addition of a hydroxyl (a) or nitro (b) group to a mono-aromatic
hydrocarbon, as predicted by SPARC for 15 ◦C and using structure B for WIOM (VD: vertical displacement; HD: horizontal displacement).
Atmos. Chem. Phys., 15, 3395–3412, 2015 www.atmos-chem-phys.net/15/3395/2015/
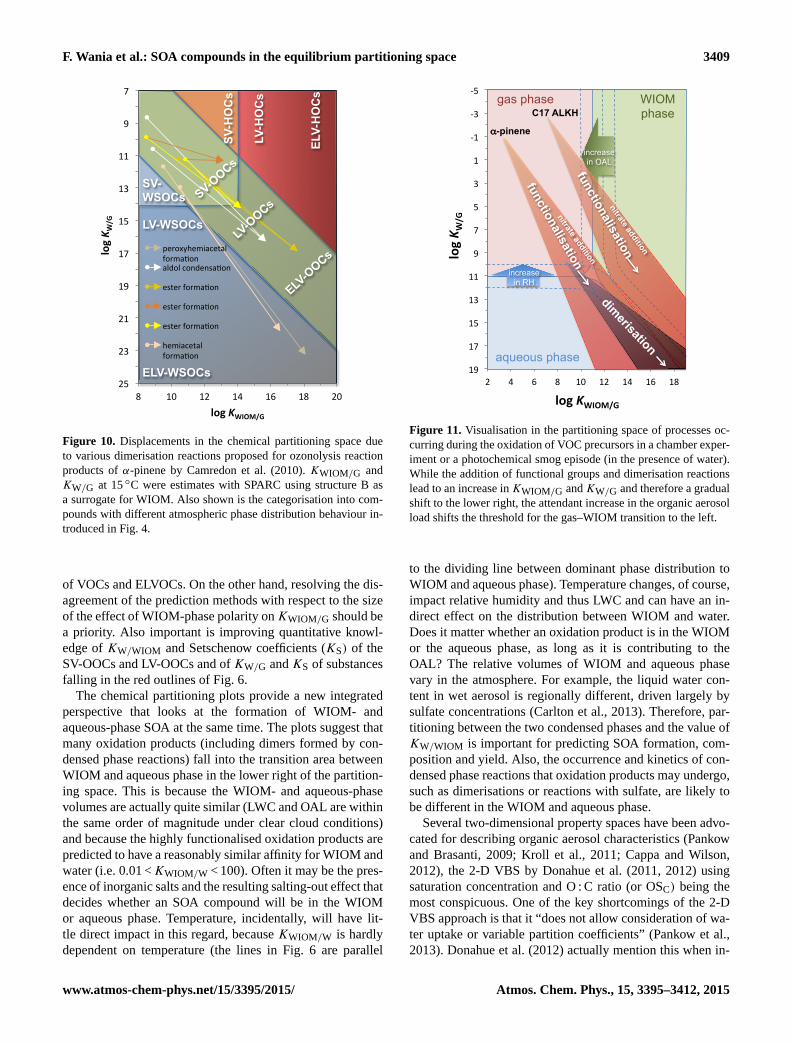
F. Wania et al.: SOA compounds in the equilibrium partitioning space 3409
7
9
11
13
15
17
19
21
23
25 8 10 12 14 16 18 20
log K W
/G
log KWIOM/G
peroxyhemiacetal forma:on aldol condensa:on
ester forma:on
ester forma:on
ester forma:on
hemiacetal forma:on
SV-H
OC
s
LV-H
OC
s
ELV-
HO
Cs
SV- WSOCs
LV-WSOCs
ELV-WSOCs
SV-OOCs
LV-O
OCs
ELV-O
OCs
Figure 10. Displacements in the chemical partitioning space due
to various dimerisation reactions proposed for ozonolysis reaction
products of α-pinene by Camredon et al. (2010). KWIOM/G and
KW/G at 15 ◦C were estimates with SPARC using structure B as
a surrogate for WIOM. Also shown is the categorisation into com-
pounds with different atmospheric phase distribution behaviour in-
troduced in Fig. 4.
of VOCs and ELVOCs. On the other hand, resolving the dis-
agreement of the prediction methods with respect to the size
of the effect of WIOM-phase polarity onKWIOM/G should be
a priority. Also important is improving quantitative knowl-
edge of KW/WIOM and Setschenow coefficients (KS) of the
SV-OOCs and LV-OOCs and of KW/G and KS of substances
falling in the red outlines of Fig. 6.
The chemical partitioning plots provide a new integrated
perspective that looks at the formation of WIOM- and
aqueous-phase SOA at the same time. The plots suggest that
many oxidation products (including dimers formed by con-
densed phase reactions) fall into the transition area between
WIOM and aqueous phase in the lower right of the partition-
ing space. This is because the WIOM- and aqueous-phase
volumes are actually quite similar (LWC and OAL are within
the same order of magnitude under clear cloud conditions)
and because the highly functionalised oxidation products are
predicted to have a reasonably similar affinity for WIOM and
water (i.e. 0.01 <KWIOM/W < 100). Often it may be the pres-
ence of inorganic salts and the resulting salting-out effect that
decides whether an SOA compound will be in the WIOM
or aqueous phase. Temperature, incidentally, will have lit-
tle direct impact in this regard, because KWIOM/W is hardly
dependent on temperature (the lines in Fig. 6 are parallel
!5#
!3#
!1#
1#
3#
5#
7#
9#
11#
13#
15#
17#
19#2# 4# 6# 8# 10# 12# 14# 16# 18#
log$K W
/G$
log$KWIOM/G$
RP20#route#
AP11#route#
AP12#route#
WIOM phase
aqueous phase
gas phase
functionalisation
α-pinene
C17 ALKH
increase in OAL
increase in RH
nitrate addition
functionalisation
dimerisation
nitrate addition
Figure 11. Visualisation in the partitioning space of processes oc-
curring during the oxidation of VOC precursors in a chamber exper-
iment or a photochemical smog episode (in the presence of water).
While the addition of functional groups and dimerisation reactions
lead to an increase inKWIOM/G andKW/G and therefore a gradual
shift to the lower right, the attendant increase in the organic aerosol
load shifts the threshold for the gas–WIOM transition to the left.
to the dividing line between dominant phase distribution to
WIOM and aqueous phase). Temperature changes, of course,
impact relative humidity and thus LWC and can have an in-
direct effect on the distribution between WIOM and water.
Does it matter whether an oxidation product is in the WIOM
or the aqueous phase, as long as it is contributing to the
OAL? The relative volumes of WIOM and aqueous phase
vary in the atmosphere. For example, the liquid water con-
tent in wet aerosol is regionally different, driven largely by
sulfate concentrations (Carlton et al., 2013). Therefore, par-
titioning between the two condensed phases and the value of
KW/WIOM is important for predicting SOA formation, com-
position and yield. Also, the occurrence and kinetics of con-
densed phase reactions that oxidation products may undergo,
such as dimerisations or reactions with sulfate, are likely to
be different in the WIOM and aqueous phase.
Several two-dimensional property spaces have been advo-
cated for describing organic aerosol characteristics (Pankow
and Brasanti, 2009; Kroll et al., 2011; Cappa and Wilson,
2012), the 2-D VBS by Donahue et al. (2011, 2012) using
saturation concentration and O : C ratio (or OSC) being the
most conspicuous. One of the key shortcomings of the 2-D
VBS approach is that it “does not allow consideration of wa-
ter uptake or variable partition coefficients” (Pankow et al.,
2013). Donahue et al. (2012) actually mention this when in-
www.atmos-chem-phys.net/15/3395/2015/ Atmos. Chem. Phys., 15, 3395–3412, 2015

3410 F. Wania et al.: SOA compounds in the equilibrium partitioning space
troducing the 2-D VBS: “The formulation so far does not
address the role of water. . . . However, because water can be
a dominant component, and therefore its unique properties
are more likely to challenge the mean-field assumption, it is
likely that explicit treatment of humidity effects will be re-
quired.” Here we have presented what essentially amounts
to an alternative two-dimensional approach to SOA charac-
terisation based on partition coefficients from gas phase into
WIOM and water. This approach includes partitioning into
an aqueous phase and directly addresses one of the key is-
sues that atmospheric modellers of SOA formation aim to
address: which fraction of the products formed from the oxi-
dation of VOCs will end up in the SOA after equilibration un-
der different atmospheric conditions. We could imagine that
it is possible to develop parameterisations of the chemical
partitioning space introduced here which – combined with
gas-phase concentrations of sets of compounds with compa-
rable partitioning properties – are suitable for implementa-
tion in atmospheric models seeking to explicitly describe the
formation of SOA.
The Supplement related to this article is available online
at doi:10.5194/acp-15-3395-2015-supplement.
Acknowledgements. The authors acknowledge financial support
from the Natural Sciences and Engineering Research Council of
Canada (NSERC).
Edited by: A. Carlton
References
Arp, H. P. H. and Goss, K. U.: Ambient gas/particle partitioning.
3. Estimating partition coefficients of apolar, polar, and ionizable
organic compounds by their molecular structure, Environ. Sci.
Technol., 43, 1923–1929, 2009.
Arp, H. P. H., Schwarzenbach, R. P., and Goss, K. U.: Ambient
gas/particle partitioning. 2: The influence of particle source and
temperature on sorption to dry terrestrial aerosols, Environ. Sci.
Technol., 42, 5951–5957, 2008.
Bertram, A. K., Martin, S. T., Hanna, S. J., Smith, M. L.,
Bodsworth, A., Chen, Q., Kuwata, M., Liu, A., You, Y., and
Zorn, S. R.: Predicting the relative humidities of liquid-liquid
phase separation, efflorescence, and deliquescence of mixed par-
ticles of ammonium sulfate, organic material, and water using the
organic-to-sulfate mass ratio of the particle and the oxygen-to-
carbon elemental ratio of the organic component, Atmos. Chem.
Phys., 11, 10995–11006, doi:10.5194/acp-11-10995-2011, 2011.
Camredon, M., Hamilton, J. F., Alam, M. S., Wyche, K. P., Carr, T.,
White, I. R., Monks, P. S., Rickard, A. R., and Bloss, W. J.: Dis-
tribution of gaseous and particulate organic composition during
dark α-pinene ozonolysis, Atmos. Chem. Phys., 10, 2893–2917,
doi:10.5194/acp-10-2893-2010, 2010.
Cappa, C. D. and Wilson, K. R.: Multi-generation gas-phase oxida-
tion, equilibrium partitioning, and the formation and evolution of
secondary organic aerosol, Atmos. Chem. Phys., 12, 9505–9528,
doi:10.5194/acp-12-9505-2012, 2012.
Carlton, A. G. and Turpin, B. J.: Particle partitioning potential of
organic compounds is highest in the Eastern US and driven by
anthropogenic water, Atmos. Chem. Phys., 13, 10203–10214,
doi:10.5194/acp-13-10203-2013, 2013.
Chen, J. J. and Griffin, R. J.: Modeling secondary organic aerosol
formation from oxidation of alpha-pinene, beta-pinene, and d-
limonene, Atmos. Environ., 39, 7731–7744, 2005.
Ehn, M., Thornton, J. A., Kleist, E., Sipilä, M., Junninen, H., Pulli-
nen, I., Springer, M., Rubach, F., Tillmann, R., Lee, B., Lopez-
Hilfiker, F., Andres, S., Acir, I.-H., Rissanen, M., Jokinen, T.,
Schobesberger, S., Kangasluoma, J., Kontkanen, J., Nieminen,
T., Kurtén, T., Nielsen, L. B., Jørgensen, S., Kjaergaard, H. G.,
Canagaratna, M., Dal Maso, M., Berndt, T., Petäjä, T., Wahner,
A., Kerminen, V.-M., Kulmala, M., Worsnop, D. R., Wildt, J.,
and Mentel, T. F.: A large source of low-volatility secondary
aerosol, Nature, 506, 476–479, 2014.
Endo, S., Pfennigsdorff, A., and Goss, K.-U.: Salting-out effect in
aqueous NaCl solutions: Trends with size and polarity of solute
molecules, Environ. Sci. Technol., 46, 1496–1503, 2012.
Donahue, N. M., Robinson, A. L., Stanier, C. O., and Pandis,
S. N.: Coupled partitioning, dilution, and chemical aging of
semivolatile organics, Environ. Sci. Technol., 40, 2635–2643,
2006.
Donahue, N. M., Epstein, S. A., Pandis, S. N., and Robinson, A.
L.: A two-dimensional volatility basis set: 1. organic-aerosol
mixing thermodynamics, Atmos. Chem. Phys., 11, 3303–3318,
doi:10.5194/acp-11-3303-2011, 2011.
Donahue, N. M., Kroll, J. H., Pandis, S. N., and Robinson, A. L.:
A two-dimensional volatility basis set – Part 2: Diagnostics of
organic-aerosol evolution, Atmos. Chem. Phys., 12, 615–634,
doi:10.5194/acp-12-615-2012, 2012.
Forstner, H. J. L., Flagan, R. C., and Seinfeld, J. H.: Secondary or-
ganic aerosol from the photooxidation of aromatic hydrocarbons:
molecular composition, Environ. Sci. Technol., 31, 1345–1358,
1997.
Goss, K.-U. and Schwarzenbach, R. P.: Empirical prediction of
heats of vaporization and heats of adsorption of organic com-
pounds, Environ. Sci. Technol., 33, 3390–3393, 1999.
Goss, K.-U.: Prediction of the temperature dependency of Henry’s
law constant using poly-parameter linear free energy relation-
ships, Chemosphere, 64, 1369–1374, 2006.
Hallquist, M., Wenger, J. C., Baltensperger, U., Rudich, Y., Simp-
son, D., Claeys, M., Dommen, J., Donahue, N. M., George,
C., Goldstein, A. H., Hamilton, J. F., Herrmann, H., Hoff-
mann, T., Iinuma, Y., Jang, M., Jenkin, M. E., Jimenez, J. L.,
Kiendler-Scharr, A., Maenhaut, W., McFiggans, G., Mentel, Th.
F., Monod, A., Prévôt, A. S. H., Seinfeld, J. H., Surratt, J. D.,
Szmigielski, R., and Wildt, J.: The formation, properties and im-
pact of secondary organic aerosol: current and emerging issues,
Atmos. Chem. Phys., 9, 5155–5236, doi:10.5194/acp-9-5155-
2009, 2009.
Heald, C. L., Kroll, J. H., Jimenez, J. L., Docherty, K. S., DeCarlo,
P. F., Aiken, A. C., Chen, Q., Martin, S. T., Farmer, D. K., and
Artaxo, P.: A simplified description of the evolution of organic
Atmos. Chem. Phys., 15, 3395–3412, 2015 www.atmos-chem-phys.net/15/3395/2015/

F. Wania et al.: SOA compounds in the equilibrium partitioning space 3411
aerosol composition in the atmosphere, Geophys. Res. Lett., 37,
L08803, doi:10.1029/2010GL042737, 2010.
Hilal, S. H., Carreira, L. A., and Karickhoff, S. W.: Prediction of the
solubility, activity coefficient, gas/liquid and liquid/liquid distri-
bution coefficients of organic compounds, QSAR & Combinato-
rial Science, 23, 709–720, 2004.
Hodzic, A., Aumont, B., Knote, C., Madronich, S., and Tyndall,
G.: Volatility dependence of Henry’s law constants of condens-
able organics: Application to estimate depositional loss of sec-
ondary organic aerosols, Geophys. Res. Lett., 41, 4795–4804,
doi:10.1002/2014GL060649, 2014.
Ip, H. S. S., Huang, X. H. H., and Yu, J. Z.: Effective Henry’s law
constants of glyoxal, glyoxylic acid, and glycolic acid, Geophys.
Res. Lett., 36, L01802, doi:10.1029/2008GL036212, 2009.
Isaacman, G., Worton, D. R., Kreisberg, N. M., Hennigan, C. J.,
Teng, A. P., Hering, S. V., Robinson, A. L., Donahue, N. M., and
Goldstein, A. H.: Understanding evolution of product composi-
tion and volatility distribution through in-situ GC×GC analysis:
a case study of longifolene ozonolysis, Atmos. Chem. Phys., 11,
5335–5346, doi:10.5194/acp-11-5335-2011, 2011.
Jimenez, J. L., Canagaratna, M. R., Donahue, N. M., Prevot, A. S.,
Zhang, Q., Kroll, J. H., DeCarlo, P. F., Allan, J. D., Coe, H., Ng,
N. L., Aiken, A. C., Docherty, K. S., Ulbrich, I. M., Grieshop,
A. P., Robinson, A. L., Duplissy, J., Smith, J. D., Wilson, K.
R., Lanz, V. A., Hueglin, C., Sun, Y. L., Tian, J., Laaksonen,
A., Raatikainen, T., Rautiainen, J., Vaattovaara, P., Ehn, M., Kul-
mala, M., Tomlinson, J. M., Collins, D. R., Cubison, M. J., Dun-
lea, E. J., Huffman, J. A., Onasch, T. B., Alfarra, M. R., Williams,
P. I., Bower, K., Kondo, Y., Schneider, J., Drewnick, F., Bor-
rmann, S., Weimer, S., Demerjian, K., Salcedo, D., Cottrell, L.,
Griffin, R., Takami, A., Miyoshi, T., Hatakeyama, S., Shimono,
A., Sun, J. Y., Zhang, Y. M., Dzepina, K., Kimmel, J. R., Sueper,
D., Jayne, J. T., Herndon, S. C., Trimborn, A. M., Williams, L.
R., Wood, E. C., Middlebrook, A. M., Kolb, C. E., Baltensperger,
U., and Worsnop, D. R.: Evolution of organic aerosols in the at-
mosphere, Science, 326, 1525–1529, 2009.
Jordan, C. E., Ziemann, P. J., Griffin, R. J., Lim, Y. B., Atkinson, R.,
and Arey, J.: Modeling SOA formation from OH reactions with
C-8-C-17 n-alkanes, Atmos. Environ., 42, 8015–8026, 2008.
Kalberer, M., Paulsen, D., Sax, M., Steinbacher, M., Dommen, J.,
Prevot, A. S. H., Fisseha, R., Weingartner, E., Frankevich, V.,
Zenobi, R., and Baltensperger, U.: Identification of polymers
as major components of atmospheric organic aerosols, Science,
303, 1659–1662, 2004.
Kampf, C. J., Waxman, E. M., Slowik, J. G., Dommen, J., Pfaf-
fenberger, L., Praplan, A. P., Prevot, A. S. H., Baltensperger, U.,
Hoffmann, T., and Volkamer, R.: Effective Henry’s law partition-
ing and the salting constant of glyoxal in aerosols containing sul-
fate, Environ. Sci. Technol., 47, 4236–4244, 2013.
Koop, T., Bookhold, J., Shiraiwa, M., and Pöschl, U.: Glass tran-
sition and phase state of organic compounds: dependency on
molecular properties and implications for secondary organic
aerosols in the atmosphere, Phys. Chem. Chem. Phys., 13,
19238–19255, 2011.
Kroll, J. H., Donahue, N. M., Jimenez, J. L., Kessler, S. H., Cana-
garatna, M. R., Wilson, K. R., Altieri, K. E., Mazzoleni, L. R.,
Wozniak, A. S., Bluhm, H., Mysak, E. R., Smith, J. D., Kolb, C.
E., and Worsnop, D. R.: Carbon oxidation state as a metric for
describing the chemistry of atmospheric organic aerosol, Nature
Chemistry, 3, 133–139, 2011.
Lei, Y. D. and Wania, F.: Is rain or snow a more efficient scavenger
of organic chemicals?, Atmos. Environ., 38, 3557–3571, 2004.
Lim, Y. B. and Ziemann, P. J.: Products and mechanism of sec-
ondary organic aerosol formation from reactions of n-alkanes
with OH radicals in the presence of NOx, Environ. Sci. Technol.,
39, 9229–9236, 2005.
Lim, Y. B., Tan, Y., Perri, M. J., Seitzinger, S. P., and Turpin,
B. J.: Aqueous chemistry and its role in secondary organic
aerosol (SOA) formation, Atmos. Chem. Phys., 10, 10521–
10539, doi:10.5194/acp-10-10521-2010, 2010.
May, A. A., Presto, A. A., Hennigan, C. J., Nguyen, N. T., Gordon,
T. D., and Robinson, A. L.: Gas-particle partitioning of primary
organic aerosol emissions: 1. Gasoline vehicle exhaust, Atmos.
Environ., 77, 128–139, 2013.
Mikhailov, E., Vlasenko, S., Martin, S. T., Koop, T., and Pöschl,
U.: Amorphous and crystalline aerosol particles interacting with
water vapor: conceptual framework and experimental evidence
for restructuring, phase transitions and kinetic limitations, At-
mos. Chem. Phys., 9, 9491–9522, doi:10.5194/acp-9-9491-2009,
2009.
Ng, N. L., Kroll, J. H., Chan, A. W. H., Chhabra, P. S., Flagan,
R. C., and Seinfeld, J. H.: Secondary organic aerosol formation
from m-xylene, toluene, and benzene, Atmos. Chem. Phys., 7,
3909–3922, doi:10.5194/acp-7-3909-2007, 2007.
Pankow, J. F.: Gas/particle partitioning of neutral and ionizing com-
pounds to single and multi-phase aerosol particles. 1. Unified
modeling framework, Atmos. Environ., 37, 3323–3333, 2003.
Pankow, J. F. and Barsanti, K. C.: The carbon number-polarity grid:
a means to manage the complexity of the mix of organic com-
pounds when modeling atmospheric organic particulate matter,
Atmos. Environ., 43, 2829–2835, 2009.
Pankow, J. F., Niakan, N., and Asher, W. E.: Combinatorial variation
of structure in considerations of compound lumping in one- and
two-dimensional property representations of condensable atmo-
spheric organic compounds. 1. Lumping by 1-D volatility with
nC fixed, Atmos. Environ., 80, 172–183, 2013.
Perraud, V., Bruns, E. A., Ezell, M. J., Johnson, S. N., Yu, Y.,
Alexander, M. L., Zelenyuk, A., Imre, D., Chang, W. L., Dab-
dub, D., Pankow, J. F., and Finlayson-Pitts, B. J.: Nonequilibrium
atmospheric secondary organic aerosol formation and growth, P.
Natl. Acad. Sci. USA, 109, 2836–2841, 2012.
Rossignol, S., Chiappini, L., Perraudin, E., Rio, C., Fable, S., Val-
orso, R., and Doussin, J. F.: Development of a parallel sampling
and analysis method for the elucidation of gas/particle partition-
ing of oxygenated semi-volatile organics: a limonene ozonolysis
study, Atmos. Meas. Tech., 5, 1459–1489, doi:10.5194/amt-5-
1459-2012, 2012.
Saleh, R., Donahue, N. M., and Robinson, A. L.: Time scales
for gas-particle partitioning equilibration of secondary organic
aerosol formed from alpha-pinene ozonolysis, Environ. Sci.
Technol., 47, 5588–5594, 2013.
Shilling, J. E., Chen, Q., King, S. M., Rosenoern, T., Kroll, J.
H., Worsnop, D. R., DeCarlo, P. F., Aiken, A. C., Sueper, D.,
Jimenez, J. L., and Martin, S. T.: Loading-dependent elemental
composition of α-pinene SOA particles, Atmos. Chem. Phys., 9,
771–782, doi:10.5194/acp-9-771-2009, 2009.
www.atmos-chem-phys.net/15/3395/2015/ Atmos. Chem. Phys., 15, 3395–3412, 2015
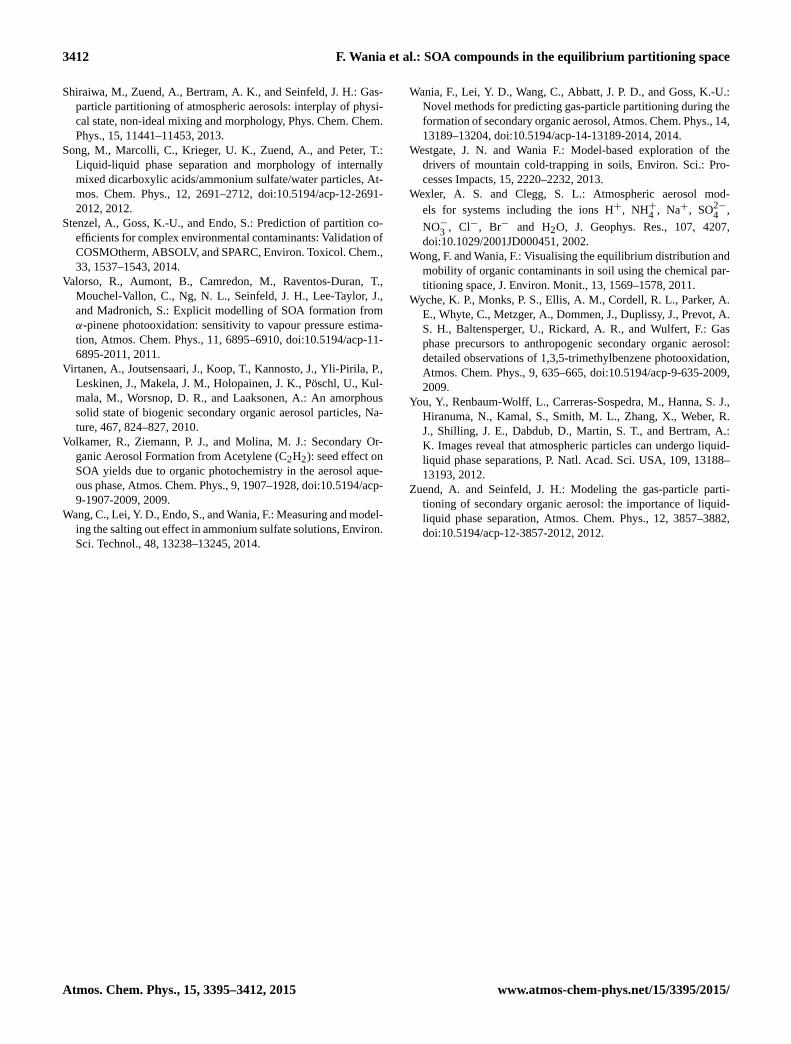
3412 F. Wania et al.: SOA compounds in the equilibrium partitioning space
Shiraiwa, M., Zuend, A., Bertram, A. K., and Seinfeld, J. H.: Gas-
particle partitioning of atmospheric aerosols: interplay of physi-
cal state, non-ideal mixing and morphology, Phys. Chem. Chem.
Phys., 15, 11441–11453, 2013.
Song, M., Marcolli, C., Krieger, U. K., Zuend, A., and Peter, T.:
Liquid-liquid phase separation and morphology of internally
mixed dicarboxylic acids/ammonium sulfate/water particles, At-
mos. Chem. Phys., 12, 2691–2712, doi:10.5194/acp-12-2691-
2012, 2012.
Stenzel, A., Goss, K.-U., and Endo, S.: Prediction of partition co-
efficients for complex environmental contaminants: Validation of
COSMOtherm, ABSOLV, and SPARC, Environ. Toxicol. Chem.,
33, 1537–1543, 2014.
Valorso, R., Aumont, B., Camredon, M., Raventos-Duran, T.,
Mouchel-Vallon, C., Ng, N. L., Seinfeld, J. H., Lee-Taylor, J.,
and Madronich, S.: Explicit modelling of SOA formation from
α-pinene photooxidation: sensitivity to vapour pressure estima-
tion, Atmos. Chem. Phys., 11, 6895–6910, doi:10.5194/acp-11-
6895-2011, 2011.
Virtanen, A., Joutsensaari, J., Koop, T., Kannosto, J., Yli-Pirila, P.,
Leskinen, J., Makela, J. M., Holopainen, J. K., Pöschl, U., Kul-
mala, M., Worsnop, D. R., and Laaksonen, A.: An amorphous
solid state of biogenic secondary organic aerosol particles, Na-
ture, 467, 824–827, 2010.
Volkamer, R., Ziemann, P. J., and Molina, M. J.: Secondary Or-
ganic Aerosol Formation from Acetylene (C2H2): seed effect on
SOA yields due to organic photochemistry in the aerosol aque-
ous phase, Atmos. Chem. Phys., 9, 1907–1928, doi:10.5194/acp-
9-1907-2009, 2009.
Wang, C., Lei, Y. D., Endo, S., and Wania, F.: Measuring and model-
ing the salting out effect in ammonium sulfate solutions, Environ.
Sci. Technol., 48, 13238–13245, 2014.
Wania, F., Lei, Y. D., Wang, C., Abbatt, J. P. D., and Goss, K.-U.:
Novel methods for predicting gas-particle partitioning during the
formation of secondary organic aerosol, Atmos. Chem. Phys., 14,
13189–13204, doi:10.5194/acp-14-13189-2014, 2014.
Westgate, J. N. and Wania F.: Model-based exploration of the
drivers of mountain cold-trapping in soils, Environ. Sci.: Pro-
cesses Impacts, 15, 2220–2232, 2013.
Wexler, A. S. and Clegg, S. L.: Atmospheric aerosol mod-
els for systems including the ions H+, NH+4
, Na+, SO2−4
,
NO−3
, Cl−, Br− and H2O, J. Geophys. Res., 107, 4207,
doi:10.1029/2001JD000451, 2002.
Wong, F. and Wania, F.: Visualising the equilibrium distribution and
mobility of organic contaminants in soil using the chemical par-
titioning space, J. Environ. Monit., 13, 1569–1578, 2011.
Wyche, K. P., Monks, P. S., Ellis, A. M., Cordell, R. L., Parker, A.
E., Whyte, C., Metzger, A., Dommen, J., Duplissy, J., Prevot, A.
S. H., Baltensperger, U., Rickard, A. R., and Wulfert, F.: Gas
phase precursors to anthropogenic secondary organic aerosol:
detailed observations of 1,3,5-trimethylbenzene photooxidation,
Atmos. Chem. Phys., 9, 635–665, doi:10.5194/acp-9-635-2009,
2009.
You, Y., Renbaum-Wolff, L., Carreras-Sospedra, M., Hanna, S. J.,
Hiranuma, N., Kamal, S., Smith, M. L., Zhang, X., Weber, R.
J., Shilling, J. E., Dabdub, D., Martin, S. T., and Bertram, A.:
K. Images reveal that atmospheric particles can undergo liquid-
liquid phase separations, P. Natl. Acad. Sci. USA, 109, 13188–
13193, 2012.
Zuend, A. and Seinfeld, J. H.: Modeling the gas-particle parti-
tioning of secondary organic aerosol: the importance of liquid-
liquid phase separation, Atmos. Chem. Phys., 12, 3857–3882,
doi:10.5194/acp-12-3857-2012, 2012.
Atmos. Chem. Phys., 15, 3395–3412, 2015 www.atmos-chem-phys.net/15/3395/2015/