Using Some of Quality Techniques in Supply Chain ...
16
Int. J Sup. Chain. Mgt Vol. 8, No. 4, August 2019 772 Using Some of Quality Techniques in Supply Chain Management to Improve the Production Processes Nagham yousif abidalreda *1 , Sura adnan jawad #2 1,2 Department of Industrial Management, College of Administration and Economics, University of Baghdad, Iraq Abstract- The research tackled the problem of lowing the level of Supply chain quality in the productive line for the manufacture of cylindrical and conical filters at Al-Zawraa General Company and the line of auto assembly, Saiba (Tiba) type in the General Company for automotive industry. as well as non-adoption of modern and developing techniques in the field of quality which led to the increase in the number of defective products in addition to the diversity of defects types. The target of research is to reveal the impact of using (Six Sigma) Technique and (Taguchi) function in the improving of production processes in the abovementioned companies; as well as to reveal the differences in the level of improving of production process, and determining the reasons that leading for deviations in production processes which participate in reducing the level of quality and develop appropriate solutions; after determining the current level of quality for both companies and the mechanisms used in measurement and quality control for both companies. The research reached a number of results, the most important of which is the possibility of applying Six Sigma in the two lines of the subject of research and giving good results for improvement. The fourth level of Sigma was reached after the third level and the number of defects was reduced; as well as research reached to determine the possibility of applying the Taguchi function - design experiments in the assembly line, Because of the lack of study able levels. Therefore, the loss function of Taguchi was applied instead. The most important conclusion was that the use of Six Sigma in the manufacturing and assembly lines is more efficient than Taguchi, and the lack of documentation of data for inspection by the quality control department of the two research groups, To identify the causes and problems that are repeated, analyzed and work on the treatment, and the methods of work that are applied both in the manufacturing line or in the assembly line is traditional not keeping pace with developments in the production and manufacturing processes, and the weak of performance of some employees due to lack of training courses and lack of experience and skill. The research produced a set of recommendations, the most important of which are: The use of modern technologies for quality and application for improvements, especially Six Sigma, which it is possible to apply in both types of production lines. Establish training courses for the employees to improve the work method and develop it and raise their achievement rates to improve the efficiency of the completion of the work. Keywords: Supply chain management (SCM), Quality Techniques, production processes 1. Introduction The methods of (Six Sigma) and (Taguchi) are considering the best modern methods for the amazing improvement for the SCM quality of products and processes. "Motorola" Company considers the first to use this technique to express its quality program, and many international companies such as "General Electric" have proven to save millions of dollars due to the correct application of both technologies. Therefore, the continued use of traditional techniques to measure the quality of production processes cause many problems in processes and therefore defects in products, so that the researcher sought to study the types of modern technology in quality and tried to employ them to serve the processes in the line. 1.1. Research Problem 1. Does the company have an approved technique to measure the quality of its products? ______________________________________________________________ International Journal of Supply Chain Management IJSCM, ISSN: 2050-7399 (Online), 2051-3771 (Print) Copyright © ExcelingTech Pub, UK (http://excelingtech.co.uk/)
Transcript of Using Some of Quality Techniques in Supply Chain ...

Int. J Sup. Chain. Mgt Vol. 8, No. 4, August 2019
772
Using Some of Quality Techniques in Supply
Chain Management to Improve the Production
Processes
Nagham yousif abidalreda*1, Sura adnan jawad#2
1,2Department of Industrial Management, College of Administration and Economics, University of Baghdad, Iraq
Abstract- The research tackled the problem of lowing
the level of Supply chain quality in the productive line
for the manufacture of cylindrical and conical filters at
Al-Zawraa General Company and the line of auto
assembly, Saiba (Tiba) type in the General Company
for automotive industry. as well as non-adoption of
modern and developing techniques in the field of quality
which led to the increase in the number of defective
products in addition to the diversity of defects types.
The target of research is to reveal the impact of using
(Six Sigma) Technique and (Taguchi) function in the
improving of production processes in the
abovementioned companies; as well as to reveal the
differences in the level of improving of production
process, and determining the reasons that leading for
deviations in production processes which participate in
reducing the level of quality and develop appropriate
solutions; after determining the current level of quality
for both companies and the mechanisms used in
measurement and quality control for both companies.
The research reached a number of results, the most
important of which is the possibility of applying Six
Sigma in the two lines of the subject of research and
giving good results for improvement. The fourth level of
Sigma was reached after the third level and the number
of defects was reduced; as well as research reached to
determine the possibility of applying the Taguchi
function - design experiments in the assembly line,
Because of the lack of study able levels. Therefore, the
loss function of Taguchi was applied instead. The most
important conclusion was that the use of Six Sigma in
the manufacturing and assembly lines is more efficient
than Taguchi, and the lack of documentation of data for
inspection by the quality control department of the two
research groups, To identify the causes and problems
that are repeated, analyzed and work on the treatment,
and the methods of work that are applied both in the
manufacturing line or in the assembly line is traditional
not keeping pace with developments in the production
and manufacturing processes, and the weak of
performance of some employees due to lack of training
courses and lack of experience and skill. The research
produced a set of recommendations, the most important
of which are: The use of modern technologies for
quality and application for improvements, especially Six
Sigma, which it is possible to apply in both types of
production lines. Establish training courses for the
employees to improve the work method and develop it
and raise their achievement rates to improve the
efficiency of the completion of the work.
Keywords: Supply chain management (SCM), Quality
Techniques, production processes
1. Introduction
The methods of (Six Sigma) and (Taguchi) are
considering the best modern methods for the amazing
improvement for the SCM quality of products and
processes. "Motorola" Company considers the first to
use this technique to express its quality program, and
many international companies such as "General
Electric" have proven to save millions of dollars due
to the correct application of both technologies.
Therefore, the continued use of traditional techniques
to measure the quality of production processes cause
many problems in processes and therefore defects in
products, so that the researcher sought to study the
types of modern technology in quality and tried to
employ them to serve the processes in the line.
1.1. Research Problem
1. Does the company have an approved technique to
measure the quality of its products?
______________________________________________________________ International Journal of Supply Chain Management IJSCM, ISSN: 2050-7399 (Online), 2051-3771 (Print)
Copyright © ExcelingTech Pub, UK (http://excelingtech.co.uk/)

Int. J Sup. Chain. Mgt Vol. 8, No. 4, August 2019
773
2. How to choose the appropriate measurement
technology to improve the quality level in the
production line?
3. Are there differences in the level of improvement
of the production process when using different
quality techniques (Six Sigma), (Taguchi) in the
production line?
4. Are there differences in the level of improvement
of the production process when using the same
technology (Six Sigma),(Taguchi) in different types
of production lines?
5. Do (Six Sigma), (Taguchi) quality techniques
contribute to raising the quality of the two companies
in question?
1.2. Research Goals
1. Choosing the quality technology that appropriate
for the nature of production process in the production
line.
2. Determining the production problem and its type
and analysis the underlying root causes after the
appearance of the last.
3. Finding the appropriate solutions for the
production problems that affect on the level of quality
and take the necessary actions to tackle them.
4. Reducing the quantity of damaged products and the
total defects for the product and raising the level of
quality for both companies.
1.3. Research Importance
1. Helping the two companies in raising the level of
Products' quality.
2. Improving the production processes for the two
companies.
3. Choosing the appropriate technology for the
quality which enables the two companies in question
to raise the level of the quality of its production
processes and its products.
4. Clarifying the importance of choosing the
appropriate technology for the type of production line
in reducing the defects at each of products and
processes.
2. Methodology
2.1 Tools of Research Measuring
Table1. Tools of research measuring in SCM
Source Details Equations Variant P
[1] The ratios are used sequentially to measure
DPMO
1 - Percentage of defects = number of units
containing one or more defects / total number
of units produced… 1
2 - Ratio of operations accuracy = 1 -
percentage of defects … 2
3 - Defect per unit (DPU) = Number of total
defects / number of total produced units …3
4 - Defect per opportunity (DPO) = Number
of total defects / number of total produced
units x Number of defects types…4
5 – Defects per million opportunity (DPMO)=
DPO x 1000000… 5
DP
MO
1
[2] (NTS)(Nominal The Best) this ratio used
when the target value is specified but not
zero, such as dimensions and weights, the
following formula is used (6)
𝑺/𝑵 = 𝟏𝟎 𝒍𝒐𝒈 [(𝑿𝒊̅̅ ̅
𝑺𝒊)
𝟐
−𝟏
𝒏] ….. (6)
TA
GU
CH
I
2
(STB)(Smaller The Better) it is used when
reducing the functional characteristics as in
the surface defects, and it contains only the
maximum specifications, above this value;
the product does not achieve to the customer
𝑺/𝑵 = −𝟏𝟎 𝒍𝒐𝒈(𝟏
𝒏∑ 𝒚𝒊
𝟐) ….. (7)
Int. J Sup. Chain. Mgt Vol. 8, No. 4, August 2019
774
the functions wanted to be performed and
therefore the typical target value is equal to
zero, and is given as follow:
(LTB)(Larger The Better) It is used when
aggrandize features and functional
characteristics, such as the strength of the
cutting of the iron blades, the strength of the
weld and the resistance of an object, and is
given as follow:
𝑺/𝑵 = −𝟏𝟎 𝒍𝒐𝒈(𝟏
𝒏∑
𝟏
𝒚𝒊𝟐) ….. (8)
Where: σ: standard deviation, yi: samples yn,… y3,y2,y1
SIX SIGMA: Ref. [3] pointed out that the basis of the
Six Sigma lies in understanding the negative effects
of the variations and changes that occur in the
manufacturing processes, and the company however
do its efforts to success this entrance; but the
improvement processes will not be achieved and
succeed unless they specialize enough resources for
their financial, material and human administration.
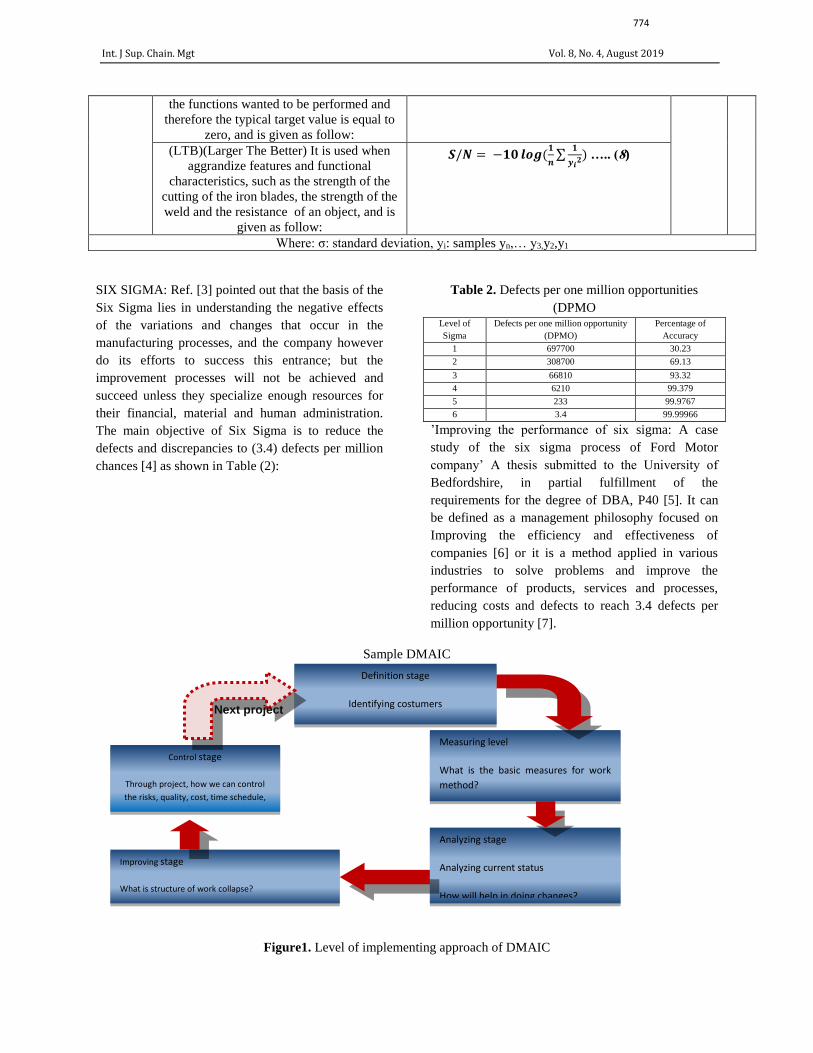
The main objective of Six Sigma is to reduce the
defects and discrepancies to (3.4) defects per million
chances [4] as shown in Table (2):
Table 2. Defects per one million opportunities
(DPMO Percentage of
Accuracy
Defects per one million opportunity
(DPMO)
Level of
Sigma
30.23 697700 1
69.13 308700 2
93.32 66810 3
99.379 6210 4
99.9767 233 5
99.99966 3.4 6
’Improving the performance of six sigma: A case
study of the six sigma process of Ford Motor
company’ A thesis submitted to the University of
Bedfordshire, in partial fulfillment of the
requirements for the degree of DBA, P40 [5]. It can
be defined as a management philosophy focused on
Improving the efficiency and effectiveness of
companies [6] or it is a method applied in various
industries to solve problems and improve the
performance of products, services and processes,
reducing costs and defects to reach 3.4 defects per
million opportunity [7].
Sample DMAIC
Figure1. Level of implementing approach of DMAIC
Measuring level
What is the basic measures for work
method?
How we can measure the proceeding?
How we can measure the success of
project?
Definition stage
Identifying costumers
Map of current region, map of future
region
What is the scoop of project?
Date of due and delivery
Analyzing stage
Analyzing current status
How will help in doing changes?
What is can be the reason behind the
change failure?
What is the main obstructs that we
face to complete the project?
Improving stage
What is structure of work collapse?
What are the detective activities necessary to achieve the goals of project? How can we re-integrate subprojects?
Control stage
Through project, how we can control
the risks, quality, cost, time schedule,
scoop and changes in plan?
How we emphasize the goals of project
has done?
Next project

Int. J Sup. Chain. Mgt Vol. 8, No. 4, August 2019
775
[1]: The Six Sigma Handbook - Revised and
Expanded (A Complete Guide for Green Belts, Black
Belts, and Managers at All Stages), the United States
of America, The McGraw-HIll Companies, Inc.,
P239
Taguchi does not agree with traditional ideas of
quality, which usually allow for discrepancies as long
as they are within the permissible limits. He
emphasized that any deviation from the target value
is a loss even if the latter is within the limits of the
established specifications of control and permitted [2]
and that one of the most important contributions is
signal / noise ratios, which have many types are: [7],
[8].The design of experiments is a series of
techniques that include the identification and control
of factors or variables that have a potential impact on
the performance and reliability of the products or
processes of production and therefore on the outputs,
the selection of two or more values (specific stages)
of the variables and operation of the process at these
stages. It can be said that the matrix of stability
contains two basic elements, Factors and Stages. The
number of tests is determined by the number of each,
if there are three factors and two stages; the matrix
can be L4, L8, L12, L16, and L32, so L4 is chosen so
that the main goal is to conduct as few tests as
possible, therefore format of the matrix will be as
follow:
Table 3. Matrix of Tests for Three Factors and Two
Stages
FACTORS
C B A TRIAL
1 1 1 1
2 2 1 2
2 1 2 3
1 2 2 4
Prepared by researcher depending on Minitab
program
3. Application Side
The application of Six Sigma (DMAIC model) in the
manufacturing line / factory of air filters - Al Zawra'
General Company [1], [3]. The filter consists of two
separate parts, the first cylindrical and the other
conical. The process of producing the filter product
consists of several manufacturing stages: Cutting belt
clips, cut the covers, cast the Gasket, cracking paper,
and filter waxing. The process of belt clips cutting
will be taken as a sample and applying the level of
definition on it, as shown below:
1. First Stage:
Definition: The project definition stage includes
identification and definition of the problem and
identification of the tools used for improvement.
Where 187 work groups were entered starting from
19/01/2016 till 01-08-2017 (obtained from the factory
records). The Pareto chart was used as a tool to
identify the types of defects and their repetitions and
identify the few affecting problems (few affecting as
named by scientist Pareto). The type and number of
line, working group, date of examination, name of the
product, number of filters produced (size of sample),
type of defect and number of defects.
The data shown in Fig. 2 were used to draw the
Pareto diagram, which shows the columns in blue
indicating the refers to relativity repetitions of the
defects types and the red line refers to cumulative
relative frequency of the defects. The x-axis
represents the sequence of defects and the y-axis
represents the relative frequency of defects. Through
the diagram shown in Figure 3, we observe the
increase the frequency of the first defect form the
frequency of the second one, which gives the
impression of the process-based operator that the first
defect should be treated before starting in the
treatment of the second defect.

Int. J Sup. Chain. Mgt Vol. 8, No. 4, August 2019
776
Figure2. Pareto of belt clips – before improvement
Table (3) shows the number and type of defects in the
belt clips. Two types of defects can be observed:
1. Welding inaccuracy, which had a total frequency
equal to 498 times, relative frequency and relative
cumulative of 64.01%
2. The perimeter of the clamp isn't equal, with
frequencies equal to 280 times and a relative
frequency equal to 35.99%.
3. Results
Data were analyzed by using statistical methods such
as average and range plates, samples (products) out of
the limits of control and carrying out the final
process of exclusion in SCM. At this stage, the
medium-range plate and the medium-standard
deviation plate are used to determine the samples that
out of the control limits of these plates and then
calculate the ratio of Cp and Cpk and the SIGMA
level of the company, after the stability of the process
for all dimensions of filter which are the high of
filter, Gasket thickness, Small diameter, large
diameter and weight, the measurement phase will be
applied on the first as a sample. At this stage, the data
shown in Fig. 4 were used to determine the sample
number, first view, second view, third view, fourth
view, fifth view and test date.
Figure3. SIGMA SIX - data interface (views) height of filter - SIX SIGMA before improvement
a. Drawing of average plate and the range of filter
height: 660 mm, 2 ± mm: two parts
In Figure (4), the average and long plate of range is
drawn by extracting the range and the average range
to calculate the upper and lower limits of the range
plate. The first plate represents the actual data
according to the reality of the company and as
recorded in their records, which shows it isn't
controlled.

Int. J Sup. Chain. Mgt Vol. 8, No. 4, August 2019
777
Figure4. Filter height range panel - before improvement
The reason of uncontrolled was the exit of four
samples (17, 64, 77, and 110) as shown in Figure (5),
therefore the out of limits samples were excluded and
the painting was drawn again. The second plate was
disciplined because the samples were inside the limits
of control, so it was transferred to draw the average
panel.
Figure5. Samples out of limits of control in the filter height range panel - before improvement
After completing the drawing of the plate, the
average plate (average-range) is calculated by
extracting the average and range for each sample and
then calculating the average range and average mean
for the extraction of the upper and lower limits of the
average plate. The first panel Figure 6, shows the
actual reality of the average views taken from the
actual reality of the company, which was
uncontrolled because the samples were out of control
limits (4-75-77-87-128-139-147-154).

Int. J Sup. Chain. Mgt Vol. 8, No. 4, August 2019
778
Figure 6. Average panel (average-range) Filter height - before improvement
So the samples that out of control limits were
excluded and the paint was draw again, and the
second painting is also not controlled due to the
samples were out of limits (2-3-17-20-25-60-71-73-
74-76-108-127-144-172-173-176 as shown in Fig. 7).
The third plate (the last plate of Fig. 7) was drawn
after excluding the out of limits samples from the last
plate showing that they were disciplined.
Figure7. Samples excluded in average plate (average- range) Filter height - before improvement
In the final stage, the process rate was calculated at
approximately 1.1, and as long as the last 1˂, the
range of areas is greater than the actual output of the
process. The production process produces products
within the characteristics of the specifications, which
shows the level of third SIGMA was the current level
of SIGMA for the company. Close to the upper limit
of the characteristics of the process, it was found that
the level of the third SIGMA was the level of the
company, as shown in Figure (8):
Figure8. Ratio, capability indicator and current level
of SIGMA of the company, filter height - before
improvement
Int. J Sup. Chain. Mgt Vol. 8, No. 4, August 2019
779
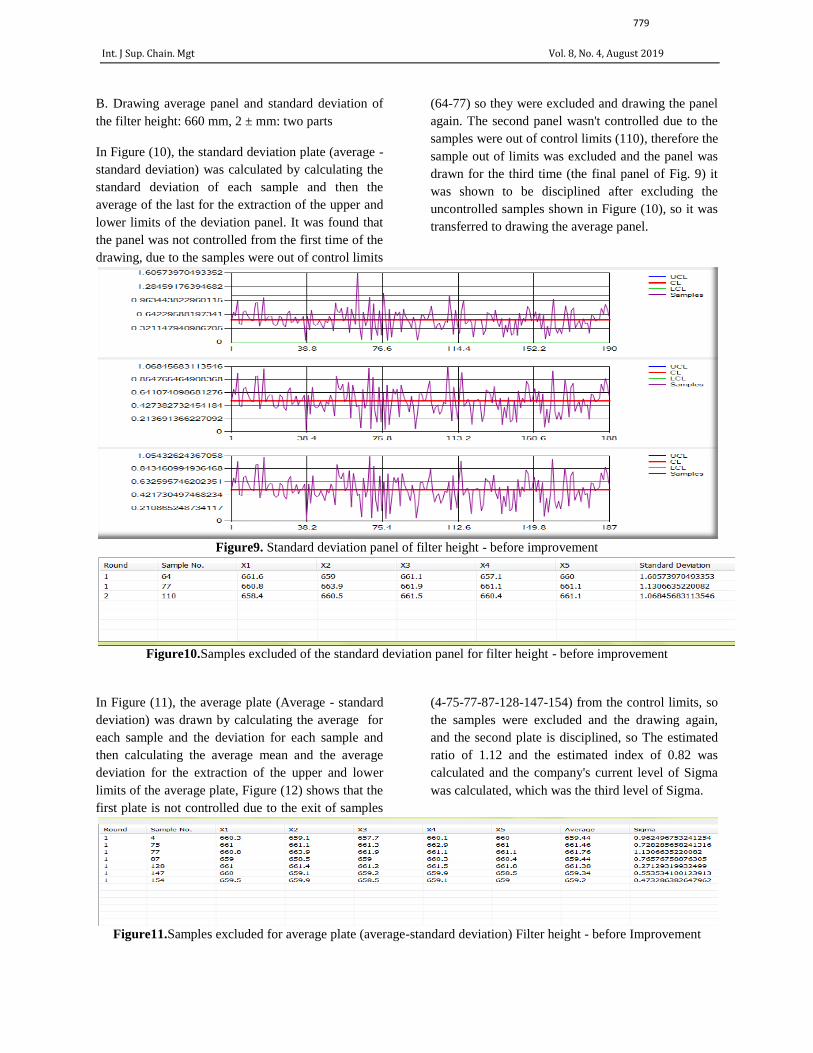
B. Drawing average panel and standard deviation of
the filter height: 660 mm, 2 ± mm: two parts
In Figure (10), the standard deviation plate (average -
standard deviation) was calculated by calculating the
standard deviation of each sample and then the
average of the last for the extraction of the upper and
lower limits of the deviation panel. It was found that
the panel was not controlled from the first time of the
drawing, due to the samples were out of control limits
(64-77) so they were excluded and drawing the panel
again. The second panel wasn't controlled due to the
samples were out of control limits (110), therefore the
sample out of limits was excluded and the panel was
drawn for the third time (the final panel of Fig. 9) it
was shown to be disciplined after excluding the
uncontrolled samples shown in Figure (10), so it was
transferred to drawing the average panel.
Figure9. Standard deviation panel of filter height - before improvement
Figure10.Samples excluded of the standard deviation panel for filter height - before improvement
In Figure (11), the average plate (Average - standard
deviation) was drawn by calculating the average for
each sample and the deviation for each sample and
then calculating the average mean and the average
deviation for the extraction of the upper and lower
limits of the average plate, Figure (12) shows that the
first plate is not controlled due to the exit of samples
(4-75-77-87-128-147-154) from the control limits, so
the samples were excluded and the drawing again,
and the second plate is disciplined, so The estimated
ratio of 1.12 and the estimated index of 0.82 was
calculated and the company's current level of Sigma
was calculated, which was the third level of Sigma.
Figure11.Samples excluded for average plate (average-standard deviation) Filter height - before Improvement

Int. J Sup. Chain. Mgt Vol. 8, No. 4, August 2019
780
Figure12. Average plate (average - standard deviation) for filter height - before Improvement
3.1. DPMO is calculated by equations (1) (2), (3),
(4), (5) referred to in Table (2).
3.1.1Belts clips: Two Parts
Figure 14 shows that the percentage of defects in the
Belts clips of the filter is equal to 39.53252%, while
the accuracy of the manufacturing processes is
60.46748%, the defect per unit produced is
38.87195% and the defect per opportunity is
0.1976626. The defects for each opportunity are
equal to 197662.6, which mean that The Company's
Sigma is the third level.
3.1.2. Third Stage: Analysis
This Stage involves identifying potential causes of
variances and defects. The Ishikawa Scheme was
used to determine the root causes of problems arising
from differences in process and product defects.
3.1.3. Belts clips: Two Parts
During the repeated interviews with the plant
inspection representative, the main and potential
causes of poor quality and faults were identified. The
main cause of defects in the Belts clips of working
individuals, lack of experience and skill and lack of
training programs were the main causes of the last
main reason. The corrosion of cutting blocks and the
non-maintenance of cutting equipment were the main
reasons for the second reason the tools and
equipment, The third main reason is represented by
raw materials and semi-finished parts. The secondary
causes were poor storage.
3.1.4. Fourth Stage: Improvement
For the purpose of improving the results obtained
from the measurement phase, a number of
suggestions and recommendations were put forward
to the company and to take the necessary measures
for improvement, including:
3. Train and motivate employees to improve the work
method and develop them and raise their achievement
rates to improve the efficiency of the completion of
business
4. Review the procedures used in the inspection
stations by the quality control department and take
the procedures, and the development of the means of
examination through the use of specialized equipment
and new devices and not just theoretical examination
5 - Pay attention to the tools of modern quality
improvement and quality control at the source and
work to apply in all stages of manufacturing to
improve processes and avoid the emergence of
defects
6. Using Pareto charts to diagnose data on operational
problems at all stages
7. Use Ishikawa's chart to analyze the problems that
occur at each stage and identify the real causes
3.1.5. Fifth Stage: Controlling
In order to ensure that the process of improvement is
effectively carried out in the company in question, a
set of data was taken from the company's records

Int. J Sup. Chain. Mgt Vol. 8, No. 4, August 2019
781
after the process of improvement and tested by
extracting the estimated production process and its
capacity. Pareto charts were redrawn for all parts, it
was found that the number of defect types and the
number of defects decreased and consequently the
number of defective producing units decreased; i.e. a
decrease in defects per million chances and hence a
high level of Sigma for the company. 20 research
samples were submitted from 03-01-2018 to 30-01-
2018 (obtained from the factory records) after giving
suggestions for improvement, minimizing operational
defects and problems, and redrawing the medium-
range and medium-standard deviation boards, and
recalculate the ratio of the operation's ability, the last
indicator and the calculation of the company's Sigma
level.
It is possible to observe, through Table (4), that the
number of defects has decreased from 498 to 26 in
the first defect, the accuracy of the weld, decreased in
the second from 280 to 13, and thus the total defects
are reduced and became 39 after being equal to 778,
i.e. the DMAIC methodology has Actually reduced
the overall defects in the production units. In other
words, the costs resulting from the sales returns were
reduced and the cost of re-examination, design,
manufacturing, labor costs, materials, etc. was
reduced.
Figure13. Pareto Belts clips - after Improvement
Height of filter: 660 mm, ±2 mm: two parts
Figure14. Filter height views - after Improvement
Int. J Sup. Chain. Mgt Vol. 8, No. 4, August 2019
782
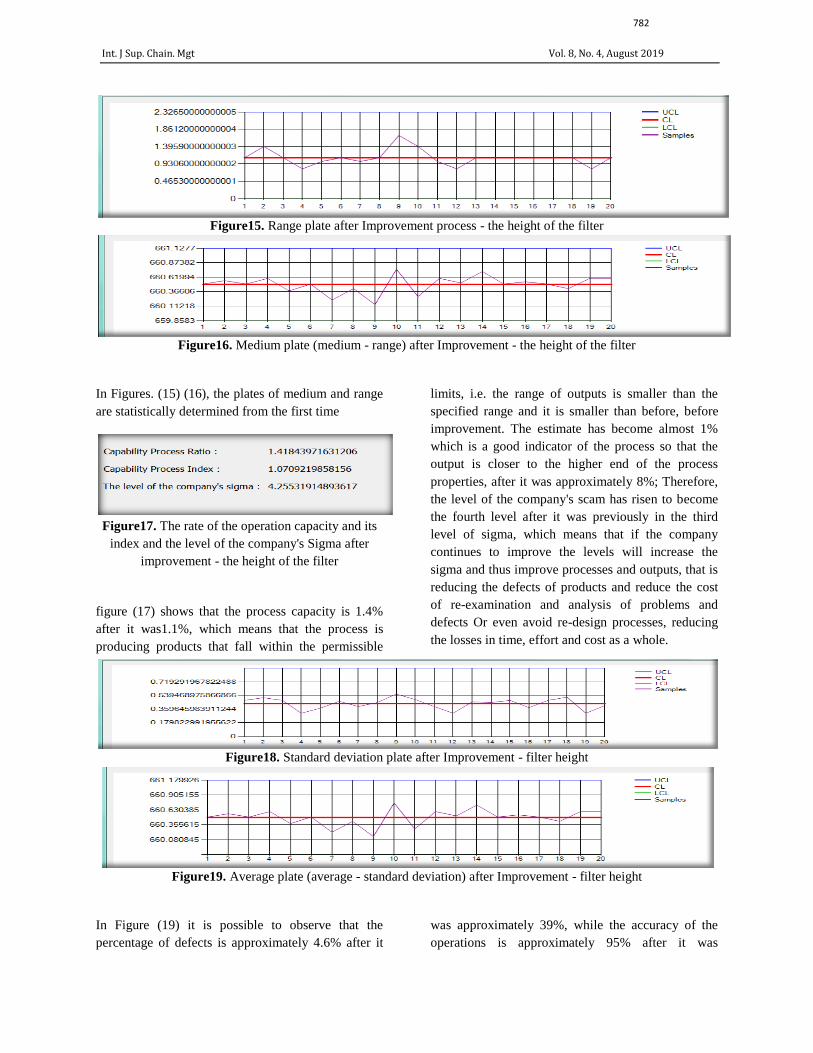
Figure15. Range plate after Improvement process - the height of the filter
Figure16. Medium plate (medium - range) after Improvement - the height of the filter
In Figures. (15) (16), the plates of medium and range
are statistically determined from the first time
Figure17. The rate of the operation capacity and its
index and the level of the company's Sigma after
improvement - the height of the filter
figure (17) shows that the process capacity is 1.4%
after it was1.1%, which means that the process is
producing products that fall within the permissible
limits, i.e. the range of outputs is smaller than the
specified range and it is smaller than before, before
improvement. The estimate has become almost 1%
which is a good indicator of the process so that the
output is closer to the higher end of the process
properties, after it was approximately 8%; Therefore,
the level of the company's scam has risen to become
the fourth level after it was previously in the third
level of sigma, which means that if the company
continues to improve the levels will increase the
sigma and thus improve processes and outputs, that is
reducing the defects of products and reduce the cost
of re-examination and analysis of problems and
defects Or even avoid re-design processes, reducing
the losses in time, effort and cost as a whole.
Figure18. Standard deviation plate after Improvement - filter height
Figure19. Average plate (average - standard deviation) after Improvement - filter height
In Figure (19) it is possible to observe that the
percentage of defects is approximately 4.6% after it
was approximately 39%, while the accuracy of the
operations is approximately 95% after it was

Int. J Sup. Chain. Mgt Vol. 8, No. 4, August 2019
783
approximately 60%, and the defects per unit
produced is equal to about 38% to about 3% per unit,
and the defects for each opportunity became almost
2.3 after it was 19.7%, and the defects per million
chances were about 197 thousand and became about
23 thousand, which means that the company's level of
Sigma after the improvements became the fourth
level after the third level , That is, advanced levels
can be achieved by reducing defects and improving
the accuracy of operations Improvements have gone
through, leading to customer satisfaction and high
standards, so the improvement process is clear.
3.2. Application of the Taguchi function (Design
of Experiments DOE) in the manufacturing
line / air filter plant - Al-Zawraa General
Company
Filter height: In Figure 19, filter (cylindrical +
conical): Height (660) mm and permissible limits 2
mm increase or decrease. The worker's level, the
worker's code, the worker's description, the first level,
the second level. The skill of the worker was
determined as the first factor and the radius of the
cutting stone as a second factor. Then the first and
second levels of the first and second factors were
determined by a high low, 4 cm 5 cm respectively.
The matrix of experiments was determined using
MinitabL4, Factors: 2Runs: 4, L4 (2 ^ 2). It is worth
mentioning that the specific factors and the specific
levels can be L4, L8, L12, L16 or L32, but since the
design Experiments took the lowest number of global
experiments, so L4 was adopted. The experiment
number, factor A, factor B, first viewing, second
viewing, third viewing, fourth viewing, fifth viewing
and the date of the examination.
In Figure (19) the results of the average calculation
for each sample, and the average sample views at
each level as shown below:
�̿�𝑘𝑖=
∑ �̅�𝑘𝑖
𝑘𝑖=1
𝑛
Where:𝑖: the sequence number of the factor according
to level, �̅�: the average, 𝑘: the influencing factor, 𝑛:
the number of samples
The average of sample views averages (General
Average) were then extracted at the levels as a whole
and as shown in the equation below:
�̅� = �̿�𝑘 =�̿�𝑘1
+ �̿�𝑘2+ … �̿�𝑘𝑛
𝑁
𝑁: The average number of factor averages, equal to
the number of levels.
The signal / noise ratio was then calculated after the
standard deviation was calculated for each sample,
and the average signal / noise for each factor was
then calculated in each level by the equation below:
𝑆/𝑁̅̅ ̅̅ ̅̅𝑘𝑖
=∑ 𝑆/𝑁𝑘𝑖
𝑘𝑖=1
𝑛
The average of signal / noise averages (General
Average for signal / noise) for sample views, for each
factor and for the levels as a whole was then
extracted by the equation below:
�̅�𝑆/𝑁 = 𝑆/𝑁̿̿ ̿̿ ̿̿𝑘 =
𝑆/𝑁̅̅ ̅̅ ̅̅𝑘1
+𝑆/𝑁̅̅ ̅̅ ̅̅𝑘2
… + 𝑆/𝑁̅̅ ̅̅ ̅̅𝑘𝑛
𝑁
The relationship between the average effect of the
factor and the general average was estimated by
subtracting the last of the average of the values and at
each level by the equation below:
𝐸𝑘𝑖= �̿�𝑘𝑖
− �̅�
As well as for the average of signal / noise, through
the equation:
𝐸𝑆/𝑁𝑘𝑖= 𝑆/𝑁̅̅ ̅̅ ̅̅
𝑘𝑖− �̅�𝑆/𝑁

Int. J Sup. Chain. Mgt Vol. 8, No. 4, August 2019
784
Figure20. Signal / Noise and Average Boards - Filter Height
In Figure (20), the boards were drawn for each factor
according to the levels, by averages of the pre-
extracted averages of the effect of the relation
between the average mean and the general average of
the last, and between the average signal / noise and
the general average of the last, The levels of factors
in the x-axis and the influence of the signal / noise
represented by the Y-axis in terms of the signal board
/ noise, while the other board represents the factor
levels of the X-axis, the Y axis represents the effects
on the averages of measured values.
In Figure (21), the main effects of the factors of the
resulting signal / noise ratio (shown in the figure
above) were calculated to estimate the theoretical
ratio of the signal / noise ratio to the optimal order of
global levels by taking only the large positive values
for each factor at any level (Figure 26), as shown in
the equation in Figure (21). Therefore, estimates of
the main effects of the mean of the factors were
calculated to calculate the general mean of the factor
averages by taking only the small positive values for
each factor and at any level.
Figure21. Final results - filter height
Figure22. Target values for average and signal / noise - filter height
Although the theoretical height of the air filter
indicates that EA1EB1 is the order to be worked, it
does not optimize for the height of the filter since the
value of ĝ = 661.06 mm, that is a value that exceeds
the allowable limits. Therefore, you must choose
another order of the influencing factors in order to

Int. J Sup. Chain. Mgt Vol. 8, No. 4, August 2019
785
choose the order that minimizes the variances and
achieve the value closer to the value required for the
height of the filter, so EA2EB2 is the order to be
worked is the ideal arrangement that it achieves the
required filter height at the target value of mm660 as
shown below:
ĝ = 660.53 – 0.27 – 0.26
= 660 mm
It achieves the lowest effect of the factors affecting
the height of the filter (noise) as it achieves a signal /
noise ratio equal to 128.92 db, which is less than the
previous value which was equal to 142.29 db:
m (S/N) R = 135.61 – 2.68 – 4.01
= 128.92 db
4. Conclusion and Discussion
SCM quality of the company which directly affects
the production process and company efficacy is
considered in this research and following remarks
concluded:
First: Six Sigma applications (DMAIC model) in the
assembly line / General Company for the automotive
industry: The same steps used in the filters product
were used
Second: Application of the Taguchi function (Quality
Loss Function (QLF)) in the assembly line / General
Company for the automotive industry
The Taguchi loss function was used in the assembly
line instead of experiment design because there were
no variables and levels to study because the company
was committed to its general plan, and the lack of
alternatives for manufacturing parts.
Windshield Wipers Motor: 15 amps, ± 1.2 amps:
Figure 29: The front view of the Windshield Wipers
Motor: 15 amps, ± 1.2 amps, the target value (T) 15,
the upper limit (USL) 16.2, and the cost of loss (C)
37000 dinars.
Figure23. Front view of the Windshield wipers Motor - Taguchi
Figure 24. Quality loss function - Windshield wipers Motor
1 3520 *2 15495.984 = 54545863.68 Dinars
If compared to revenues for the actual production
volume, it will represent the percentage of:
54545863.68 / 36960000000 = 0.14% of sales
volume

Int. J Sup. Chain. Mgt Vol. 8, No. 4, August 2019
786
In witness whereof, it is possible to observe losses
due to deviations from the specifications set which
the company must overcome by taking a set of
procedures that reduce the percentage of defects and
deviations and try to reach zero defects. Therefore, a
reduction rate of 10% was proposed to indicate the
savings that the company will achieve. , As shown in
Table 6:
Table4. Proposed 10% reduction of deviations in the company
Discount rate 10%
Annual savings of
assumed production
volume
Estimated cost
savings
QLF
Proposed
𝜎2Proposed QLF Current The research
topic
1676247.719 393.4853 3543.2593 0.1372 3934.8538 Master
Scanners
116696.097 27.3934 248.2030 0.0657 273.9345 Box lamp
310537.812 72.8962 656.9777 0.3065 728.9623 Lighter
3411365.4 800.7900 7877.9066 0.0387 8007.9009 Central lock
1086442.71 255.0335 2506.3720 0.0504 2550.3353 Fog lamp
Therefore, the total annual savings that would be
achieved if the company followed the reduction
procedures by 10% would be equal to 6601289.738
dinars annually
In this section, Six Sigma and the Taguchi function
were also used, but this time in the assembly line (in
the General Company for automotive industry - Saiba
(Tiba) car assembly). Here we would like to clarify
the following:
1. Six Sigma worked very efficiently in the
assembly line as it significantly reduced the number
of defects and types, as explained in advance in the
application stages, which in turn led to the upgrading
of the company's level of Sigma from level 3 to 4,
which was reached in the manufacturing line also,
Which indicates the effectiveness of Six Sigma in
both lines of research topic.
2. As for Taguchi, it was not possible to apply the
design of the experiments (DOE) in the assembly line
because of the lack of application requirements in this
line. Therefore, we have to resort to the QLF
application, which shows that the proposed QLF is
less than QLF at the current 10% reduction rate as it
became 91.5945 in the motor of wipers. This means
that whenever the company seeks to reduce the
percentage of deviations from the specifications, it
will be able to achieve significant savings, such as
achieved at the reduction of deviations by 10%,
which amounted to 6601289.738 dinars.
References
[1] Pyzdek T, Keller PA. The Six Sigma
Handbook: A Complete Guide for Green
Belts, Black Belts, and Managers at All
Level. New York [ua]: McGraw-Hill. 2003.
[2] Foster ST, Ganguly KK. Managing quality:
Integrating the supply chain. Upper Saddle
River, New Jersey: Pearson Prentice Hall;
2007.
[3] Slack N, Brandon-Jones A. Operations and
process management: principles and
practice for strategic impact. Pearson UK;
2018.
[4] Furphy K. A. Six Sigma-based approach to
leadership in energy and environmental
design for existing buildings: operations and
maintenance (Doctoral dissertation, Arizona
State University), 2010.
[5] Thompson SJ. Improving the performance
of Six Sigma: a case study of the Six Sigma

Int. J Sup. Chain. Mgt Vol. 8, No. 4, August 2019
787
process at Ford Motor Company, 2007.
[6] Eckes, G. Six Sigma For Everyone,2003.
https://doi.org/10.1080/0267257X.1995.996
4328.
[7] Jugulum R, Samuel P. Design for lean six
sigma: A holistic approach to design and
innovation. John Wiley & Sons; 2010.
[8] Cano EL, Moguerza JM, Redchuk A. Six
sigma with R: statistical engineering for
process improvement. Springer Science &
Business Media; 2012.