Using Social Network Analysis to Investigate the ...
174
University of Massachusetts Amherst University of Massachusetts Amherst ScholarWorks@UMass Amherst ScholarWorks@UMass Amherst Doctoral Dissertations Dissertations and Theses August 2015 Using Social Network Analysis to Investigate the Relationship Using Social Network Analysis to Investigate the Relationship between School-Based Team Communication Networks and between School-Based Team Communication Networks and Implementation of Positive Behavior Support Systems Implementation of Positive Behavior Support Systems Shannon K. Barry University of Massachusetts Amherst Follow this and additional works at: https://scholarworks.umass.edu/dissertations_2 Part of the Educational Assessment, Evaluation, and Research Commons, Educational Leadership Commons, Educational Methods Commons, Other Sociology Commons, Quantitative, Qualitative, Comparative, and Historical Methodologies Commons, School Psychology Commons, Student Counseling and Personnel Services Commons, and the Urban Education Commons Recommended Citation Recommended Citation Barry, Shannon K., "Using Social Network Analysis to Investigate the Relationship between School-Based Team Communication Networks and Implementation of Positive Behavior Support Systems" (2015). Doctoral Dissertations. 346. https://doi.org/10.7275/6921651.0 https://scholarworks.umass.edu/dissertations_2/346 This Open Access Dissertation is brought to you for free and open access by the Dissertations and Theses at ScholarWorks@UMass Amherst. It has been accepted for inclusion in Doctoral Dissertations by an authorized administrator of ScholarWorks@UMass Amherst. For more information, please contact [email protected].
Transcript of Using Social Network Analysis to Investigate the ...

University of Massachusetts Amherst University of Massachusetts Amherst
ScholarWorks@UMass Amherst ScholarWorks@UMass Amherst
Doctoral Dissertations Dissertations and Theses
August 2015
Using Social Network Analysis to Investigate the Relationship Using Social Network Analysis to Investigate the Relationship
between School-Based Team Communication Networks and between School-Based Team Communication Networks and
Implementation of Positive Behavior Support Systems Implementation of Positive Behavior Support Systems
Shannon K. Barry University of Massachusetts Amherst
Follow this and additional works at: https://scholarworks.umass.edu/dissertations_2
Part of the Educational Assessment, Evaluation, and Research Commons, Educational Leadership
Commons, Educational Methods Commons, Other Sociology Commons, Quantitative, Qualitative,
Comparative, and Historical Methodologies Commons, School Psychology Commons, Student
Counseling and Personnel Services Commons, and the Urban Education Commons
Recommended Citation Recommended Citation Barry, Shannon K., "Using Social Network Analysis to Investigate the Relationship between School-Based Team Communication Networks and Implementation of Positive Behavior Support Systems" (2015). Doctoral Dissertations. 346. https://doi.org/10.7275/6921651.0 https://scholarworks.umass.edu/dissertations_2/346
This Open Access Dissertation is brought to you for free and open access by the Dissertations and Theses at ScholarWorks@UMass Amherst. It has been accepted for inclusion in Doctoral Dissertations by an authorized administrator of ScholarWorks@UMass Amherst. For more information, please contact [email protected].

USING SOCIAL NETWORK ANALYSIS TO INVESTIGATE THE RELATIONSHIP
BETWEEN SCHOOL-BASED TEAM COMMUNICATION NETWORKS AND
IMPLEMENTATION OF POSITIVE BEHAVIOR SUPPORT SYSTEMS
A Dissertation Presented
By
SHANNON K. BARRY
Submitted to the Graduate School of the University of Massachusetts Amherst in partial fulfillment
of the requirements for the degree of
DOCTOR OF PHILOSOPHY
May 2015
College of Education

© Copyright by Shannon K. Barry 2015 All Rights Reserved

USING SOCIAL NETWORK ANALYSIS TO INVESTIGATE THE RELATIONSHIP
BETWEEN SCHOOL-BASED TEAM COMMUNICATION NETWORKS AND
IMPLEMENTATION OF POSITIVE BEHAVIOR SUPPORT SYSTEMS
A Dissertation Presented
By
SHANNON K. BARRY
Approved as to style and content by: _________________________________________________ Rebecca H. Woodland, Co-Chair _________________________________________________ Sara A. Whitcomb, Co-Chair _________________________________________________ Amanda M. Marcotte, Member _________________________________________________ Christopher E. Overtree, Member
___________________________________________ Christine B. McCormick, Dean College of Education

DEDICATION
To my loving parents, Jane and Richard, who have shown me the importance of
compassion towards others and the profound strength of the human connection.

v
ACKNOWLEDGEMENTS
As reflected in this dissertation, the knowledge and success of one individual
cannot be attributed to just one or a few persons or events. I have interacted and formed
relationships with numerous people over my life as a graduate student, and each one has
shared with me some piece of advice, knowledge, or expertise to make me a stronger
researcher, student, educator, and person. To then acknowledge just a few people would
not appropriately or accurately reflect the significance of the extensive network of people
that has supported me in the process to have success in my graduate program, complete
this dissertation, and earn my doctorate. Therefore, I would like to thank everyone I have
ever met, talked to, worked with, and learned from in my educational and professional
career. The insight and support provided to me are invaluable and I will be forever
grateful to have been part of such an incredible group of seasoned, respected, and
intelligent people. It is impossible to name everyone in this network, but special
recognition must be given to a select few "stars":
First and foremost, I would like to thank the co-chairs of my committee, Drs.
Rebecca Woodland and Sara Whitcomb. As this was an unprecedented topic and thus
unique study to conduct, your ongoing commitment to me and my project's success made
it manageable, feasible, possible and exciting to complete. I am so fortunate to have been
the benefit of two such seasoned and intelligent women committed to improving the
systems in which children are educated, and I owe you both endless gratitude for entering
me into a world of research and practical opportunities that I likely would not have
discovered on my own. Not only are you both incredibly gifted scholars, but also model
human beings full of genuine kindness and compassion. For this, it has been an immense

vi
honor to work and learn with you both for the duration of my graduate career. Thank you
for everything they have done for me now and will continue to do for me in the future. I
look forward to our future learning and working together as colleagues.
I would also like to express my sincere appreciation to my academic advisor and
committee member Dr. Amanda Marcotte. Thank you for encouraging me to pursue my
doctorate and having the confidence in me to do so, and for serving as my academic
advisor for the majority of my graduate program. I am so grateful to have been your
student and the recipient of the wealth of knowledge you possess and articulate so
effortlessly. And as a member of this committee, thank you for being a part of it and
providing ongoing support throughout the process.
I would also like to thank Dr. Chris Overtree for serving on this committee. Thank
you for your guidance and support of my dissertation and me, and for checking in on me
at my first job as a real school psychologist.
My immense gratitude goes to the current and former staff of the Springfield
Public Schools, namely Dr. Gisele Richardson, Dr. Frank Dufresne, Dr. Mimi O’Neill,
Julie Donovan, Cynthia Zingler, and all behavior specialists, who wholeheartedly
supported me and my project, provided me with an incredibly rich and positive internship
experience and venue to conduct my dissertation research. To the administrators,
teachers, and staff of these schools, thank you for allowing me to learn from you through
this study and for your appreciation of research and interest in my study.
A special thank you goes to my friends near and far for your support, advice,
thoughtful reflections, humor, and allowing me to be myself. You have kept me
motivated, grounded, and fed throughout this process, and I am grateful to have found

vii
people who truly reflect what it means to be good people and exceptional friends.
Thank you, Jonathan and Darleen, for your laughter, love, support, and friendship,
and for providing me with a safe, warm, fun, comfortable and supportive environment,
which enabled me to do my work and stay focused on what was important. You will
always be my Western Massachusetts family, whether I'm going walnutz or not. Thank
you for all that you provided me. It truly means everything.
My deepest appreciation and love goes to my family, Sydney, Rich, Dennis,
Susan, Chuck, and Jo, for their endless interest, love, and encouragement. I am so
fortunate to have you all as my foundation, my examples of work ethic and judgment,
and genuine investors in my success.
And last, but certainly not least, I have endless amounts of deep gratitude for my
mother, Jane. Thank you for showing me what it means to think carefully, be kind, work
hard, and persevere with dignity and grace. Your wisdom and kindness are unmatched
and your selfless ongoing support and belief in me have been, without question, the
greatest influences on my personal and professional achievements. I owe everything and
more to you and share this accomplishment with you. Thank you and I love you.

viii
ABSTRACT
USING SOCIAL NETWORK ANALYSIS TO INVESTIGATE THE RELATIONSHIP
BETWEEN SCHOOL-BASED TEAM COMMUNICATION NETWORKS AND
IMPLEMENTATION OF POSITIVE BEHAVIOR SUPPORT SYSTEMS
MAY 2015
SHANNON K. BARRY, B.A., ASSUMPTION COLLEGE
M.Ed., UNIVERSITY OF MASSACHUSETTS AMHERST
Ph.D., UNIVERSITY OF MASSACHUSETTS AMHERST
Directed by: Professor Rebecca H. Woodland & Professor Sara A. Whitcomb
The purpose of this study was to examine the relationship between school-based team
communication networks and implementation of school-wide reform efforts and
initiatives, namely Positive Behavioral Interventions and Supports (PBIS). The study
employed social network analysis (SNA) to determine if a relationship was present
between the structure and properties of the team communication network and the level of
implementation of PBIS, the position and properties of the PBIS leadership team and the
level of implementation of PBIS implementation, and the quality of internal process for
collaboration of the PBIS leadership team and PBIS implementation. It was predicted that
schools in which teachers and staff have opportunities to communicate with their
colleagues within and across teams have a network conducive to access of social capital
and diffusion of innovation, supporting the school-wide implementation of reform efforts.
Team network data were collected from eight elementary schools actively implementing
PBIS and were analyzed at the network and ego-level using social network analyses.
Network analyses were correlated with reports of PBIS implementation, as measured by
ix
the Self-Assessment Survey (SAS). Internal process for collaboration was assessed using
the Teacher Collaboration Assessment Survey (TCAS) and correlated with the SAS.
Moderate findings were present between network properties indicating the number of
nodes, edges, and density of the network and PBIS implementation. A moderate
relationship was also found between the degree centrality, betweenness centrality, and
eigenvector centrality of the PBIS leadership team and the level of PBIS implementation.
Statistically significant and strong correlations were reported for the quality of internal
process for collaboration in PBIS leadership teams and PBIS implementation. The study
concludes with a discussion of the implications of the findings for policy, professional
practice, and future research on implementation of school-wide reform efforts,
particularly from a social network and diffusion of innovations perspective.

x
TABLE OF CONTENTS
Page
ACKNOWLEDGEMENTS ................................................................................................ v
ABSTRACT ..................................................................................................................... viii
LIST OF TABLES .............................................................................................................. x
LIST OF FIGURES ........................................................................................................... xi
CHAPTER
1. INTRODUCTION .......................................................................................................... 1 Social Networks ...................................................................................................... 1 Diffusion of Innovation ........................................................................................... 3 School-wide Implementation of Reform Efforts and Social Capital ...................... 4 School-wide Reform Efforts Aimed to Address Student Behavior ........................ 5
Positive Behavioral Interventions and Supports (PBIS) ............................. 8 Statement of the Problem ...................................................................................... 11 Purpose of the Study ............................................................................................. 12 Research Questions ............................................................................................... 14
2. REVIEW OF THE LITERATURE .............................................................................. 16 Introduction ........................................................................................................... 16 Educational Reform .............................................................................................. 17 Social Network Analysis ....................................................................................... 18
Social Network Analysis in Education ..................................................... 26 Diffusion of Innovation ......................................................................................... 30 Social Capital Theory ........................................................................................... 35 Teams as Vehicles for Diffusion of Innovation and Access to Social Capital ..... 37
Prevention of Social-Emotional-Behavioral Problems ......................................... 41 Positive Behavioral Interventions and Supports (PBIS) ........................... 43
PBIS Systems ................................................................................ 47 PBIS Implementation .................................................................... 49
Conclusion ............................................................................................................ 55 3. METHODOLOGY ....................................................................................................... 56
Introduction and Statement of the Problem .......................................................... 58 Research Questions ............................................................................................... 58 Design and Hypotheses ......................................................................................... 59 Setting and Context ............................................................................................... 61
Recruitment ............................................................................................... 62 Sample ................................................................................................................... 63 Procedures and Measures ...................................................................................... 67

xi
Data Collection ......................................................................................... 67 Phase 1: Team Communication Network Raw Data .................... 67
Team Inventory ................................................................. 68 Staff Member Survey ........................................................ 69
Phase 2: Internal Process for Collaboration Data ......................... 70 Teacher Collaboration Assessment Survey (SAS) ........... 71
Data Analyses ....................................................................................................... 72 Network Analyses ..................................................................................... 75 Correlational Analyses .............................................................................. 80
4. RESULTS ..................................................................................................................... 82
Introduction ........................................................................................................... 82 Research Question 1: To what extent are the network structure and properties of school team communication networks related to the level of PBIS implementation? .................................................................................................... 83
Network Analyses ..................................................................................... 83 Descriptive Network Properties .................................................... 92
Correlational Analyses .............................................................................. 93 Research Question 2: To what extent do the network structural position and properties of the PBIS leadership team relate to the level of PBIS implementation? .................................................................................................... 95
Network Analyses ..................................................................................... 95 Correlational Analyses .............................................................................. 99
Research Question 3: To what extent does the quality of the internal process for collaboration of the PBIS leadership team relate to the level of PBIS implementation? .................................................................................................. 101
Team Internal Process for Collaboration Results ................................... 101 Correlational Analyses ............................................................................ 102
5. DISCUSSION ............................................................................................................. 104
Summary of Findings .......................................................................................... 105 Research Question 1: To what extent are the network structure and properties of school team communication networks related to the level of PBIS implementation? ............................................................................ 105 Research Question 2: To what extent do the network structural position and properties of the PBIS leadership team relate to the level of PBIS implementation? ...................................................................................... 107 Research Question 3: To what extent does the quality of the internal process for collaboration of the PBIS leadership team relate to the level of PBIS implementation? ............................................................................ 109
Conclusions and Implications for Policy and Practice ....................................... 110 Less is More – Fewer Teams, Better Implementation ............................ 111 Smaller Teams, Stronger Implementation .............................................. 115 Consider Direct Ties ............................................................................... 118 Team Internal Process for Collaboration Matters ................................... 119 Implications for the Implementation and Sustainability of PBIS ........... 121

xii
Limitations .......................................................................................................... 123 Design ..................................................................................................... 123 Measurement ........................................................................................... 124 Assumptions of Communication ............................................................. 125 School Characteristics ............................................................................. 126
Directions for Future Research ........................................................................... 127 Conclusion .......................................................................................................... 129
APPENDICES
A. RECRUITMENT EMAIL TEMPLATE ............................................................. 131 B. SELF-ASSESSMENT SURVEY (SAS) ............................................................ 132 C. TEAM INVENTORY ......................................................................................... 135 D. STAFF MEMBER SURVEY ............................................................................. 137 E. TEACHER COLLABORATION ASSESSMENT SURVEY (TCAS) .............. 139 F. SOCIAL NETWORK ANALYSIS CONCEPTS ............................................... 142
REFERENCES ............................................................................................................... 143

xiii
LIST OF TABLES Table Page
1. Sample Schools and Staff Members ........................................................................... 64
2. School Implementation Timeline ................................................................................ 65
3. Level of PBIS Implementation (Self-Assessment Survey Results) ............................ 65
4. Self-Assessment Survey Response Rates ................................................................... 67
5. Team Communication Network Properties Ranked by Implementation .................... 92
6. Pearson correlations matrix among PBIS Implementation and TCN
Properties .................................................................................................................... 95
7. PBIS Leadership Team Centrality Ranked by Implementation
Percentage ................................................................................................................... 98
8. Pearson Correlation Matrix among PBIS Leadership Team Network
Properties and PBIS Implementation ........................................................................ 101
9. PBIS Leadership Team TCAS Results ..................................................................... 102
10. Pearson Correlation Matrix among PBIS Leadership Team
Internal Process Ratings (TCAS) and PBIS Implementation (SAS) ....................... 103

xiv
LIST OF FIGURES
Figure Page
1. School 1 Team Communication Network Sociogram ................................................ 84
2. School 2 Team Communication Network Sociogram ................................................ 85
3. School 3 Team Communication Network Sociogram ................................................ 86
4. School 4 Team Communication Network Sociogram ................................................ 87
5. School 5 Team Communication Network Sociogram ................................................ 88
6. School 6 Team Communication Network Sociogram ................................................ 89
7. School 7 Team Communication Network Sociogram ................................................ 90
8. School 8 Team Communication Network Sociogram ................................................ 91

1
CHAPTER 1
INTRODUCTION
Schools across the nation are faced with the incredible task of best educating all
children. Policies at the national, state, and local level urge educational leaders to
implement practices to ensure immediate and long-lasting improvements in student
achievement in the areas of academics, social-emotional health, and behavior. While
these practices are essential for producing positive outcomes for students, practices are
not enough – there must be a vehicle or structure through which best practices can spread
throughout the school organization. The social context, or the relational foundation in
which school staff are situated is as important, if not more important, to consider when
attempting implementing large-scale change efforts, particularly in the area of social,
emotional health and behavior. A school system in which educators develop relationships
and interact with their colleagues – i.e., form a network - is conducive for quality
changes in instructional practice, and consequently, increased student achievement. More
specifically, implementation of school wide reform efforts is predicated on all members
of the school’s investment in and adoption of their associated practices. Changes in
instructional practice and adoption of new approaches to teaching are dependent upon
school staff members’ social interaction and connection. When school staff interact and
connect, they are able to exchange knowledge and share information, leading to school-
wide changes in instructional practices, ideally aimed to improve student outcomes.
Social Networks
The structural dimension, or the overall network of relationships, is the vehicle to
facilitate information sharing and the exchange of knowledge among individuals in an

2
organization (Leana & Pil, 2006). A social network approach, or social network analysis
(SNA; Butts, 2003; de Nooy, Mrvar, & Batagelj, 2005; Prell, 2011; Wasserman & Faust,
1994) reveals the underlying network structures that are important in understanding
resource exchanges between individuals and groups within an organization (Cross,
Borgatti, & Parker, 2001; Song, Nerur, & Teng, 2007). It serves as a high leverage
approach to study how and what school networks support or impede the large-scale
diffusion of innovations (Rogers, 2003) and reform efforts. By considering the
professional interactions that school staff members have, stakeholders and researchers
gain a solid picture of a school’s capacity to support large-scale expertise and
implementation.
The social network approach is predicated on a relational way of thinking in
which individuals and groups are seen as structured, embedded, and active social
networks. It is unlike more traditional forms of social science research in which
individuals are considered independent and astructural, and whose distinguishing
attributes (e.g. gender, race, age, social class, etc.) are treated with causational or
correlational power (Daly, 2010; Papachristos, 2011). Therefore, an individual or group’s
placement in the network highly influences and is influenced by the happenings of the
network. Theoretically, individuals or groups placed in advantageous (i.e. far-reaching
and accessible) locations in the network are more likely to access and create knowledge,
change behavior, and enact new or highly supported instructional practices. Further,
networks with connected members are more likely to support transfer of knowledge and
thus, implementation of new or supported instructional practices.

3
Diffusion of Innovation
Diffusion of innovation theory is concerned with social networks, communication
channels, and inter-professional relationships, and how they influence the spread of new
ideas, knowledge, and practices across social systems (Rogers, 2003). Diffusion of
innovation theory posits that social relationships support and impede contagion, that is,
the quality, depth, type, and rate of innovation spread throughout a network of actors.
Depending on the strength and attributes of an organization’s network, a positive
innovation may be adopted, never adopted, discontinued, or a network could spread
negative information about an innovation (Rogers, 2003).
Diffusion of innovation is elemental to the consideration of implementing school-
wide reform efforts, as they include new ideas, knowledge, and practices – i.e.
innovations. As they are school-wide efforts, the intent would be for every educator, in
every setting, to implement each associated routine and practice. The routines and
practices associated with the innovations are only effective when at least 80% of staff
buy-in and consistently apply the elements to their practice (Sugai & Horner, 2006;
Merrell & Buchanan, 2006; Stein, Hoagwood, & Cohn, 2002). In order for each staff
member to implement its practices, he/she must be exposed to and aware of the decisions
made related to implementation.
Teams, serving as the primary vehicles for implementation of school-wide
practices (Pinchot & Pinchot, 1993; Gajda & Koliba, 2008; Woodland & Hutton, 2012),
allow for the diffusion of innovation to occur and create a teaming network conducive to
supporting changes to instructional practice systemically (McIntosh et al., 2013, Barnard,
1950; DuFour & Eaker, 1998; Senge et al., 2000; Gajda & Koliba, 2008;). Teams

4
provide established and formal venues in which teachers and staff interact on an ongoing
basis to move forward the work of the school. Team members connect to “solve
problems, share ideas, set standards, and build tools” (Snyder, Wenger, & de Sousa
Briggs, 2003, p. 17), all aimed at improving instructional practice and overall school
capacity.
Teams that maintain a high quality internal process for collaboration, in which
they follow a cycle of inquiry of dialogue, decision-making, action, and evaluation of
practices related to student learning and instructional practice builds the capacity of
school staff members to make significant, positive changes in their instructional practice
and produce significant increases in student achievement (Darling-Hammond, Ancess, &
Ort, 2002; Gajda & Koliba, 2007; Goodlad, Mantle-Bromley, & Goodlad, 2004; Hiebert,
1999; US Dept. of Education, 2001; Wasley et al., 2000; Zito, 2011; City, Elmore,
Fiarman, & Teitel, 2009; Stevens & Kahne, 2006; Dufour & Eaker, 1998, Dufour,
Dufour, & Eaker, 2005; Pounder, 1998). High quality teams create a high quality system,
or network, in which all members of the school collaborate in a way that is conducive for
diffusion of innovation to occur. Teams also provide ongoing social interaction and
relationship-building in a structured, formal way. Diffusion of innovation relies upon a
well-functioning social system (network) to support widespread flow of information and
knowledge exchange. When the teaming network is structured for widespread transfer, it
is more likely for diffusion of innovation to occur and for school-wide reform efforts to
be implemented universally and as intended.
School-wide Implementation of Reform Efforts and Social Capital
Diffusion of innovation involves the transfer of knowledge and spread of

5
information across a well-structured network. Information and knowledge exchange leads
to widespread professional learning and expertise, which then leads to school-wide
implementation of reform efforts. Professional learning and building of expertise occurs
between and among educational actors who co-construct, make sense of, and implement
reform through a social process of interaction, as explained by social capital theory
(Degenne & Forsé, 1999; Portes, 1998; Scott, 2000).
Social capital theory posits that social structure, or the web of relationships
among individuals, offers opportunities and constraints for the exchange of resources.
Resources may include strategies, information, practices, decisions, approaches, or prior
knowledge. Individuals may tap into the resources that are available in the social
structure in which they are embedded and leverage these resources to achieve individual
or organizational goals (Nahapiet & Ghoshal,1998). In schools, teachers and staff
members who are connected via teams and thus have access to peers and colleagues and
their resources, learn from one another, creating collective and personal knowledge, and
furthering professional learning and internal expertise. The social capital of peers
supports the behavior, functioning, and quality of the collective group as the group is
consistent and equitable in regards to its level of knowledge and receipt of quality
resources. It also supports individual and collective knowledge of all those within the
school. Social capital is integral to systematic implementation of reform, as the school is
structurally supportive of social interaction and thus professional learning, universal
implementation is more likely to occur.
School-wide Reform Efforts Aimed to Address Student Behavior
As stated previously, schools are responsible for providing quality instruction to
6
students that support long-lasting achievement in the areas of academics, social-
emotional health, and behavior. School-wide reform efforts then must aim for positive
outcomes in all areas by ensuring that teachers and staff have consistent relational access
to their colleagues through quality teaming. A team network in which teachers and staff
consistently work together to improve their instructional practices, is conducive to
diffusion of innovation and social capital, and thus implementation of school-wide reform
efforts.
Although schools are tasked with addressing all facets of student outcomes, a
major focus in schools is in social-emotional health and behavior, as the pervasiveness of
social, emotional, and behavioral problems that children face across the United States is
vast. One in five children in the United States experience some type of mental health
related problem and 1 in 10 has a diagnosable disorder, such as anxiety, depression,
conduct disorder, and attention deficit hyperactivity disorder (ADHD) (Costello and
Angold, 2000). At any given time between the ages of 9 and 16, one out of six children
will develop an emotional or behavioral disorder, with many of them developing
comorbid disorders (Costello, Mustillo, Erkanli, Keeler, & Angold, 2003). Nearly 22% of
students enrolled in public education have behavioral problems severe enough to
necessitate mental health services (Hoagwood and Erwin, 1997). These numbers are
likely an underestimation of the true prevalence of mental health related issues, given that
they do not include a substantial number of individuals who manifest subclinical or
undiagnosed disorders (Mash & Dozois, 2002). In fact, the rate of disruptive problem
behaviors related to such issues is escalating (U.S. Surgeon General, 2000). The single
most common request for assistance from teachers is related to behavior and classroom

7
management (Elam, Rose, & Gallup, 1999), as 87% of teachers report their classes
include students with behavioral challenges (Gates Foundation, 2012). Such behavioral
challenges may then turn into problems that increase in cost and severity and decrease in
chance of remediation over time (Sprague & Walker, 2005).
The expression of social, emotional, and behavior problems in schools affects
teacher instruction, classroom environment, and student learning. Students with social,
emotional, behavioral disorders or challenges, generally, are noncompliant, fail to follow
social routines or norms or are socially withdrawn, display aversive interpersonal
behaviors (e.g. lying, yelling, excessive motor activity), are inattentive and off-task, and
are physically aggressive (Breen & Altepeter, 1990). Such behaviors compromise the
learning environment whereby academic activities are interrupted, instructional time is
taken away, curriculum content is not covered, teacher authority is undermined, and most
importantly, there are decreased opportunities to learn (McIntosh, Horner, Chard, Boland,
& Good, 2006; Sprague, et al., 2001). Teachers report spending an average of 36 minutes
per day dealing with student misbehavior, which translates to about 10% of their day
(Cains & Brown, 1996; Gates Foundation, 2012; Wang, 1985). When added up across
time, that time taken away from instruction to deal with behavioral incidents is large, thus
impacting students’ opportunities to optimally access the curriculum and instruction.
Further, high rates of behavioral incidents are associated with a negative school climate, a
breakdown of teacher-student relationships, and a decline in academic achievement
(DeBriere & Wehby, 1993; Shores, Jack, Gunter, Ellis, Sugai & Horner, 1999; Sulzer-
Azaroff & Mayer, 1994; Tolan & Guerra, 1994), thus inhibiting both academic and
social-emotional-behavioral growth. In comparison, lower rates of behavioral problems

8
and a positive school climate are associated with positive youth development, effective
risk prevention and health promotion, better student learning and academic achievement,
increased graduation rates, and teacher retention (Center for Social and Emotional
Education, 2010).
Facilitating positive social behavior and preventing negative, antisocial behavior
leads to enhanced academic achievement and improved social-behavioral and mental
health outcomes for students. Students are less likely to develop mental health and
behavior problems that otherwise would increase in severity over time when introduced
early to a comprehensive and sustained social-behavioral prevention system in school
(Ford & Lerner, 1992).
Given their potential impact, there is a clear need to address the expression of
social-emotional and behavioral challenges that students and educators are facing and
that are taking away from a focus on academic and social achievement. To do so,
educators must look at the ways in which school-wide reform efforts that address social-
emotional health and behavior and prevent future problems are best implemented in their
schools.
Positive Behavioral Interventions and Supports (PBIS)
A well-supported and commonly utilized school-wide reform effort (innovation)
for prevention and intervention of social-emotional health and behavior is Positive
Behavioral Interventions and Supports (PBIS; Sugai & Horner, 2002; Lewis & Sugai,
1999), which aims to prevent disruptive behavior and social-emotional challenges, and
enhance the school’s organizational climate by creating and sustaining a comprehensive
system of social-behavioral support (Bradshaw et al., 2008; Horner & Sugai, 2006). PBIS
9
is a prevention-oriented framework focused on creating environments that reflect safety,
social competence, and healthy school climates. PBIS is a multi-tiered approach focusing
on student social, emotional, and behavioral learning. It is guided by the following
principles: 1) develop a continuum of scientifically based behavior and academic
interventions and supports; 2) use data to make decisions and solve problems; 3) arrange
the environment to prevent the development and occurrence of problem behavior; 4)
teach and encourage prosocial skills and behaviors; 5) implement evidence-based
behavioral practices with fidelity and accountability, and 6) screen universally and
monitor student performance & progress continuously (OSEP Center for PBIS, 2009).
PBIS is not a packaged curriculum, rather relies on a continuum of behaviorally-oriented
practices, measurement tools and data gathering that informs decision-making regarding
service delivery, and organizational systems and structures that support the
implementation of practices and ongoing use of data (Horner, Sugai, Todd, & Lewis-
Palmer, 2005; Sugai & Horner, 2006).
The PBIS leadership team is a key element of PBIS systems. The PBIS leadership
team is a cohesive, integrated, and representative collection of individuals who lead the
systems change and implementation process of PBIS. It is responsible for the
coordination of training, coaching, and evaluation activities related to PBIS, and make
ongoing data-based decisions regarding systemic efforts to support behavior (OSEP,
2004). The quality of the PBIS leadership team is a major factor in its initial
implementation and longevity (McIntosh, et al., 2013; Doolittle, 2006).
Previous research has indicated that implementation of PBIS is associated with a
reduction in office discipline referrals (Taylor-Greene et al., 1997) and suspensions

10
(Horner, Sugai, Todd, & Lewis-Palmer, 2005), and improvements in academic
performance (Nelson, Martella, & Marchand-Martella, 2002). Without universally strong
implementation in all settings (classroom, cafeteria, bus, playground, hallway), practices
are less likely to benefit students, leading to diminished social-behavioral achievement
for students. The implementation of PBIS, like any large-scale innovation, takes on a
systems approach, in which the collective actions of individuals within the school predict
how the school operates (Lewis, Barrett, Sugai, & Horner, 2010). All individuals within
the school have a common goal and consistently use the universally known routines and
practices (Horner, 2003). As PBIS is a systemic effort, it includes the effective and
efficient selection and implementation of practices by school personnel (e.g., teachers,
school psychologists, administrators). These practices include the development of
policies and guiding principles, operating routines, resource supports, and administrative
leadership. With such systems in place, internal behavioral expertise and capacity are
developed, and data-based decision making is emphasized to improve the selection,
adoption, outcomes, and durability of practices (Sugai, Horner, & Lewis, 2009).
While relying on “experts” to deliver training and provide on-going technical
assistance is a long-standing model within education (Guskey, 2000), school-wide reform
depends on building “expertise” across all educators within a school (Lewis et al., 2010),
suggesting that professional learning and development will have to be embedded into the
jobs and daily functions of the educators. In this sense, the capacity for schools to support
professional learning and knowledge exchange through social interaction and
communication is a major consideration in the implementation of far-reaching behavior
support systems, such as PBIS.

11
In order to support professional learning and knowledge exchange, the social
network in which teachers and staff are embedded must be structured to diffuse the
innovation (i.e. PBIS) and provide access to social capital (i.e. resources, practices,
decisions, knowledge of PBIS). Implementation relies on diffusion of related practices to
all those within the network. Therefore, the successful implementation of PBIS is
dependent upon a network whose structures and properties are conducive to diffusion of
innovation.
Statement of the Problem
Implementation/diffusion of PBIS entails the transmission of practices across all
those individuals who will be expected to use them (i.e. administrators, teachers, school
staff). The introduction, commitment and use (i.e. implementation/diffusion) of an
innovation such as PBIS is supported through high quality, ongoing, job embedded
professional interaction and learning for school staff. Systems and structures in which
school staff members work together in and across teams is a key component of school
improvement and the attainment of educational goals and outcomes (Croft, Croft,
Coggshall, Dolan, Powers, & Killion, 2010; Dufour, 2011; Dufour & Eaker, 1998; Gajda
& Koliba, 2008; Hattie, 2009; Hord, 2004; Leana, 2011; Little, 2003; Pounder, 1998).
The diffusion of an innovation such as PBIS depends upon a connected network of
administrators, teachers, and school staff following a cycle of inquiry (Woodland &
Hutton, 2012; Gajda & Koliba, 2008) and communicating within and across teams
(Rogers, 1963; Sugai & Horner, 2006). A network of administrators, teachers, and staff
working with their colleagues structured to support diffusion of innovation is likely to be
associated with strong school-wide implementation of instructional practices and

12
consequently, positive student outcomes. Conversely, network of teams structured to
constrain diffusion of innovation, thus inhibiting student outcomes is likely to be
associated with poor implementation.
In summary, structured teacher teaming networks is associated with improving
the quality of instructional practice in K-12 education. Practices aimed supporting
positive student outcomes are most likely to succeed and be sustained in schools in which
teachers work in teams and communicate with one another consistently and at a high
quality (McIntosh et al., 2013, Dolittle, 2006; Gajda & Koliba, 2008; Woodland &
Hutton, 2012). To ensure successful implementation and longevity of school-wide
practices, leaders and researchers must assess schools’ capacity of their teaming networks
to support the diffusion of best practice and instructional innovation. By analyzing the
structure and attributes of school teaming networks, educators can then improve
children’s school environments to better address their needs.
Purpose of the Study
The primary purpose of this study was to closely examine the relationship
between the structure of school teaming networks and the implementation of PBIS. First,
this study attempted to identify which network properties supported or constrained
diffusion of PBIS by determining the relationship between the teacher teaming network
structure and PBIS implementation. It was hypothesized that there would be a
relationship between implementation of PBIS and the structure and properties of the
teacher teaming network, and that a moderately connected and far-reaching network in
which each team was connected to at least one other supported diffusion of PBIS.
Conversely, a disconnected, highly centralized network in which teams were isolated or

13
frequently inaccessible, constrained diffusion of innovation, and thus implementation of
PBIS.
This study also aimed to determine how the accessibility and influence of the
PBIS leadership team over the teaming network supported and constrained diffusion of
PBIS. To do so, it sought to examine the relationship between the structural position and
properties the PBIS leadership team within the network and PBIS implementation.
Position is the PBIS leadership team’s influence and power over the network and
accessibility to other teams within the network, indicating its capacity to enact or support
diffusion of PBIS to the rest of the network. Properties are measures of its connections to
other teams, role in the transfer of information, central location, and accessibility to other
teams within the network. PBIS leadership teams in highly central and influential
positions and properties within the network would support diffusion of PBIS practices,
and thus implementation PBIS. PBIS leadership teams with positions on the periphery
and who had properties indicating inaccessibility to or lack of influence over other teams
within the network constrain diffusion of PBIS.
A third purpose of the study was to examine the PBIS leadership team’s internal
process for collaboration and its relation to PBIS implementation. It was hypothesized
that there would be a positive relationship between PBIS implementation and PBIS
leadership team’s internal process, indicating the internal process for collaboration does
support PBIS implementation.
An additional purpose of this study was to pilot the social network approach in the
evaluation of PBIS implementation and sustainability. Literature surrounding PBIS
implementation is emerging; and this study attempted to add an additional lens to

14
understanding schools’ capacity to implement PBIS school-wide. Furthermore, a large
body of research has pointed to social networks as valuable foci in education reform and
innovation research, but none to date has used the social network approach in research on
behavior support implementation in schools, especially PBIS. Thus, this study sought to
add a social-emotional and behavioral support perspective to the SNA literature base.
Research Questions
1. To what extent are the structure and properties of a school’s team communication
network related to the level of PBIS implementation?
2. To what extent does the structural position and properties of the PBIS leadership
team relate to the level of PBIS implementation?
3. To what extent does the quality of the internal process for collaboration of the
PBIS leadership team relate to the level of PBIS implementation?
More specifically,
• What is the level of PBIS implementation at each school?
• What are the properties of the team network for each school? How do they
correlate with measures of implementation?
o How many discrete, formal teams exist within the schools? How many
connections exist between teams?
o Where are the stars, bridges, bottlenecks, and cliques in the network?
o What are the density, average path length, and centralization of the
network?
• What is the position of the PBIS leadership team within the team network?
o Is the PBIS team a star, bottleneck, isolate, part of a clique in the network?

15
o What are the degree, betweenness, eigenvector, and closeness centralities
of the PBIS leadership team within the team network? How do they
correlate with measures of PBIS implementation?
• What is the quality of the internal process for collaboration of the PBIS leadership
teams? To what extent do they follow a cycle of inquiry? How does it correlate
with measures of PBIS implementation?
In conclusion, this study will aim to use SNA to examine how the structure,
properties, and quality of the teaming network supports or constrain the diffusion of
innovation, and uses PBIS as the model school-wide innovation. A more detailed
explanation of theoretical underpinnings and previous research informing this study are
further discussed in the upcoming review of literature.

16
CHAPTER 2
REVIEW OF THE LITERATURE
Introduction
The purpose of this study was to investigate the relationship between the structure
and properties of school-based team networks, team quality of internal process for
collaboration, and the implementation level of positive behavior support systems.
Consideration of this topic requires a well-formed knowledge of a wide range of
theoretical orientations and background in numerous perspectives. While on their own,
the theories and perspectives are often presented as distinct, they in fact share many
common themes and messages aimed to explain how and why things happen within
organizations, and in this case, why and how PBIS happens within and across a school
system. As such, the following literature review will primarily describe the theoretical
models that most appropriately informed this study’s purpose and methodology of data
collection and analysis.
The most prominent theoretical framework that undergirds this study is that of
social network analysis (SNA; Butts, 2003; de Nooy, Mrvar, & Batagelj, 2005; Prell,
2011; Wasserman & Faust, 1994). SNA is a theoretical and methodological approach to
describing and examining the structures and effects of social relationships. As stated
earlier, SNA is different from traditional attribute-based methodological approaches in
that it addresses the profound implications of the configuration of social systems (i.e.
networks) on access to information, resources, and the flow of ideas, practices, and
routines. SNA is used to explain the “diffusion of innovations” which is theory that
explicates how and why new ideas spread between actors in networked organizations.

17
And SNA is used to examine “social capital theory”, which explains the resources and
knowledge that are leveraged from social relationships and are existent and accessible
within networks. Both diffusion of innovation theory and social capital theory emphasize
the great importance of social interaction and relationships between individuals. In this
study, SNA, diffusion of innovation, and social capital theories guided the theory that
quality teaming networks structured to support diffusion of innovation and social capital
would support implementation of school-wide reform efforts.
Educational Reform
Federal policies and programs such as the No Child Left Behind Act (NCLB) and
Race to the Top have put the pressure on schools to engage in reform efforts to bring
about improvement in student outcomes (Finnigan & Daly, 2012). School leaders are
expected to make major changes in their schools (Deal, Purinton, & Waetjen, 2009).
Efforts aimed to address, reform, and refine educational practice in schools have been
introduced through a variety of means. Educational leaders, policy-makers, and
researchers have provided a range of documented fixes, which have often been technical,
and include prescribed or mandated policies, structures, and processes for change
(Moolenaar & Daly, 2012). Numerous suggestions, invitations, mandates and legislations
have been delivered in hopes of changing behaviors, attitudes, knowledge, and
understanding of school leaders, teachers, and staff (Hall & Hord, 2011).
The process in which to enact these mandates and practices within schools is not a
simple task. And while these technical fixes are necessary for large-scale change in
schools, they are embedded within a larger social system, which must also be considered.
As schools are organizations of people, there exists a social system, in which teachers,

18
staff, parents, and students interact and communicate consistently and form relationships
with one another. These interpersonal ties matter because they transmit behavior,
attitudes, information, and goods (de Nooy, Mrvar, & Batagelj, 2005; Moolenaar & Daly,
2012). The social system, or structure or patterns of relationships, is often referred to as a
network. For the purposes of this study, the network of school staff (i.e. teachers,
administrators, counselors, support staff) is one of interest when considering how
changes in instructional practice are implemented and sustained. The educator network
and process of social interaction and relationship-building provides an important context
for the work of the school to be completed and progress to be made in improving
educational outcomes. Therefore, it is important to consider network capacity to support
widespread change and implementation of new ideas and practices within schools. The
success of school-wide reform efforts depends on a network conducive to support them.
Social Network Analysis (SNA)
SNA is a methodological approach that enables the examination of relationships
(Moolenaar, 2012; Coburn & Russell, 2008; Penuel et al., 2009). SNA enables
researchers to more accurately understand and appreciate how the social network
supports or constrains the implementation of school improvement initiatives. Social
network analysts theorize that the patterns of social relationships among individuals offer
a valuable unit of investigation to explain behavior, beliefs, and knowledge. In schools, it
is the assumption that the relational structure (or social network) of the school staff is of
importance and serves as a platform for capacity building and diffusion of practice via
communication, collaboration, and interaction (Moolenar & Daly, 2012).

19
( refers to an approach to studying social relationships, their structuring, and their
quality. It involves theoretical concepts, methods, and analytic techniques to uncover the
social relations that tie individuals and groups together, the structure of those relations,
and how relations and their structures influence or are influenced by behavior, attitudes,
beliefs, and knowledge. The SNA approach posits that relations between individuals
(called actors) create systems called social networks, and that much of culture and nature
seem to be structured as networks. Actors are tied together due to a shared relation or
relations, which are defined as the linkages between entities (Borgatti, Everett, &
Johnson, 2013). Relations can be consistent as states, such as social roles, cognitions, or
similarities; or discrete events, such as shared membership or attendance in a social
interaction (Borgatti, Everett, & Johnson, 2013).
Social networks are alive, ever-changing, and ever-evolving based on the relations
between its members (Samet, n.d.). A general hypothesis of SNA is that “an actor’s
position in a network determines in part the constraints and opportunities that it will
encounter, and therefore identifying that position is important for predicting outcomes
such as performance, behavior, or beliefs” (Borgatti, Everett, & Johnson, 2013, p. 1).
Social network analysts also hypothesize that “what happens to a group of actors is in
part a function of the structure of connections among them” (Borgatti, Everett, &
Johnson, 2013, p. 1). Social network analysts treat the social network in which
individuals are included as the primary unit of analysis and investigation. Individuals are
considered to be interdependent, who do not behave independently from each other, but
rather gain capital from others based on the pathways of which they have access (Deal,
Purinton, & Waetjen, 2009). Individuals’ behavior, beliefs, and performance are then

20
dependent upon the social network’s capacity to provide them. SNA is a method that
focuses upon the relationships between individuals in a given context, rather than a
method that views individuals as independent and autonomous units. A particular
advantage of SNA is its ability to examine both social structures and individual attributes
simultaneously. Therefore, SNA has the capacity to account for structural regularities but
also individual attributes, and it is well suited for investigating the complex relations that
exist within schools (Lusher, Robins, & Kremer, 2010).
In a social network, the relationship does not just refer to a social network as
members who “socialize with” or who are their friends. Social is a general term
describing an inter-personal interaction or relation. Certainly, friendship is a type of
social network relation, but there are many others, such as trust, advice, communication,
collaboration, and even negative relations such as conflicts or bullying (Deal, Purinton, &
Waetjen, 2009; Prell, 2011; Lusher, Robins, & Kremer, 2014). SNA is concerned with
examining a specific relation between network members, because this will provide
detailed information about the ways in which particular types of relations operate within
a group or organization. In addition, individual-level attributes (such as age, years
teaching, gender, role/title, focus, process of team) can be incorporated into a social
network investigation to see how such attributes are associated with social relations
within the school (de Nooy, Mrvar, & Batagelj, 2005; Deal, Purinton, & Waetjen, 2009;
Daly et al., 2010). In this study, the main network of interest is the team communication
network: the patterns of relationships between teachers and school staff created by their
membership to carefully created teams in the school. Theoretically, social interactions
and relationships are created within and between teams. That is, teachers and staff who

21
share membership to a team or teams have the opportunity to interact, communicate, and
share ideas within the team(s). Then ideally, each teacher and staff member would have
membership to multiple teams, which would then create a relationship between many
teams, in which ideas can be communicated from one team to the next. These patterns of
communication create an overall team communication network, in which communication
is a result of the connections between teams. When teachers and staff members
communicate, they can share ideas and information about what is happening within the
school and implement change based on their new knowledge (Deal, Purinton, &Waetjen,
2009; Moolenaar, 2012; Moolenaar & Daly, 2012; Daly et al., 2010).
The concept of social networks has its foundations in sociological research with
the theoretical work of social theorists such as Ferdinand Tonnies, Emile Durkheim, and
Gustave LeBon who are credited with first describing social ties. According to Tonnies
(1895/1936), social groups exist as the social ties that link individuals who share common
personal or impersonal commonalities. Personal commonalities refer to shared values and
beliefs, where impersonal commonalities were instrumental or purposeful (Freeman,
2004). Durkheim (1893/1964) argued that social phenomena arise through the
interactions between individuals, and cannot be solely attributed to the properties of
individual actors. Society then develops out of cooperation between individuals, rather
than a compilation of individual traits. LeBon (1897/1995) studied crowd behavior and
structure of social ties. He suggested that when individuals become members of crowds
they lose their individual identities by imitating them. He also said that ideas and
behaviors diffuse from person to person by a process of contagion (Freeman, 2004).
German sociologist George Simmel is often credited with first attempting to

22
understand how social phenomena and social laws emerge by explicitly investigating the
structure of social interactions. His research attempted to explain and describe large-scale
institutions by observing and analyzing the social interactions within society. According
to Simmel (1907), a collection of human beings does not become a society objectively.
He said, “society arises from the individual and the individual arises out of association”
(p. 163). There must be a reciprocal influence between individuals in which one has an
effect on another to create an interaction. To study society then, one must study the
patterns of interaction. Further, he suggested that it was the nature of ties themselves
rather than the social groups, that lie at the center of many human behaviors. He believed
that the social interaction affects the way that individuals’ personality and belief
structures are formed. Simmel’s students continued his work and suggested that society is
a “system of relations” and a “network of linkages between men” (Wiese & Mueller,
1931/1941, p. 30 as cited in Freeman, 2004).
In the mid 1900s, the study of social ties and interaction continued with the work
of Jacob Moreno, a student of psychiatry from Vienna, who was the first to develop a
methodology for studying social ties, and was the first to operationalize the term social
network. Moreno’s studies focused on Gestalt psychology, which looks at the interplay
between perceptions and the larger structures of the human mind. Moreno and his
university colleagues argued that the structure of the whole mind mattered more than the
individual parts of the mind or individual perceptions, and that individual well being must
be linked to a whole structure. Moreno’s foundations in Gestalt psychology then
precipitated his interests in how the psychological well-being of individuals was linked to
the social relations in which they were embedded (Prell, 2011; Freeman, 2004). Moreno

23
first introduced sociometry, the precursor to modern SNA, in which he created
sociograms to visualize social networks.
SNA continued to grow in the mid twentieth century, precipitated by the work of
Moreno’s sociometry and other scholars. By the 1950s, scholars at that time began to
introduce a number of new approaches to objectively understanding social relations, and
make more meaningful conclusions about networks, beyond that what sociograms could
provide. Graph theory, a sub-field of mathematics, was then integrated into studying
networks, which makes use of notation, visual graphs, and theorems (de Nooy, Mrvar, &
Batagelj, 2005; Prell, 2011). SNA then emerged as a more precise, objective, and
rigorous mathematical approach to the study of relational ties.
While SNA has its foundations first in sociological research, it has since
developed through its very essence, the collaborations and linkages between topics
pertinent to numerous areas of social science research, including psychology,
anthropology, sociology, public health, and political science. Its development is ongoing
and the result of a long history and work of scholars, theorists, and mathematicians.
Today, social network analysts continue to create sociograms to demonstrate the visual
structure of a network and perform complex statistical models using graph theory aimed
to provide an objective understanding of the social ties within groups.
The use of SNA is not limited to just one or a few disciplines, as a wide range of
researchers have utilized it in recent years to describe and investigate the behavior,
beliefs, and performance of individuals based on the social structures in which they
belonged. As a broad set of techniques, SNA has been used extensively in organizational
settings such as business and government (e.g., examining leadership, governance of

24
environmental resources, advice relations, innovation, information sharing), health-
related applications (e.g., HIV networks, mental health support, bullying in schools),
politics (alliance formation, social movements), and defense (e.g., terrorist networks)
(Lusher & Robins, 2010).
For example, sociologists have studied the social structure of gangs to predict
murders using SNA (Papachristos, Braga, & Hureau, 2012). In this study, the authors
investigated the relationship between an individual’s position in a high-risk social
network and the probability of being a victim of a fatal or non-fatal gunshot wound. They
found that each person within the network was less than five handshakes away from the
victim of a gun homicide or non-fatal shooting. Their findings demonstrated that the
closer one is to a gunshot victim, the greater the probability that person will be shot, and
each network step away from a gunshot victim decreases one’s odds of getting shot by
approximately 25 percent (Papachristos, Braga, & Hureau, 2012). This study provides
evidence that the relationships individuals have play integral roles in behavior, and
therefore, the network in which they are embedded.
Psychologists have also used SNA to study the effects of popularity on depressive
symptoms in friendship networks. A longitudinal study collected friendship network data
from 376 adolescents and determined who held positions of strong popularity. Data
indicated that friendship network popularity was associated with increases in depressive
symptoms in females and decreases for males. The authors suggested that the network
structure is of importance when considering expression of behavior collectively and
individually (Kornienko & Santos, 2014).
Health scientists have used SNA to identify individuals that would be most likely

25
to be affected by infectious disease and to predict who have good health intervention
behaviors. Researchers asked members of an African community to identify their friends.
Using measures of nomination frequency (in-degree) and how often one friend was a link
between two other sets of friends (betweenness), they concluded that people with more
friend nominations were more likely to self-report illness, while the individuals serving
as the link between friends were more likely to report good health behaviors. The results
suggested that intervention efforts should include consideration of the networked
positions of its intended audience, rather than an individual trait such as their health
status (Chami, Ahnert, Voors, & Kontoleon, 2014).
Political scientists have employed SNA to investigate lobbying behavior and
patterns in government. After interviewing lobbyists about their social connections to
other lobbyists and collecting network data of which organizations endorsed certain bills,
they concluded that organizations converge on “popular” bills and lobbying organizations
influence each other when their lobbying agendas overlap. Results showed that the policy
domain is a social community that consists of ongoing relationships, trust, and
information sharing. Therefore, the structure of the lobbyist social networks seemed to be
related to their policy endorsement behaviors (Scott, 2013).
The studies mentioned above provide a very basic overview of the types of
studies that have been conducted using SNA. As noted previously, SNA is not specific to
one area of scholarly research or oriented toward one or a few disciplines. The
application of SNA across disciplines to explain or describe phenomena is extensive and
proven to be informative to each discipline that has employed it. The possibilities of

26
using SNA are truly limitless and applicable to a wide array of research interests and
venues.
Social Network Analysis in Education
The social network approach has recently emerged as a useful approach to
understanding the ways in which information is spread and work gets done within
organizations, compared to traditional conceptualizations of productivity and knowledge
creation. In educational settings, specifically schools, the use of SNA has become an
important tool in empirically examining capacity of school networks to educator learning
and implementation of instructional practices. SNA is advantageous in the educational
setting, as schools can be viewed as a micro-social systems with clear boundaries and
opportunities for relationship building (Moolenaar & Daly, 2012; Daly et al., 2010; Deal,
Purinton, & Waetjen, 2009; Moolenaar, 2012). While the SNA literature is emerging in
the education field, this innovative approach has been applied to describe a range of
networks and their relationships with school reform, professional learning, and
productivity.
In a study funded by the National Science Foundation, policy analysts sought to
see how the choices of teachers about whom to seek out for advice influenced the
structure of their network. The school had just introduced a school-wide mathematics
initiative and researchers were interested in how the network would change based on who
teachers sought out for advice regarding mathematics. Researchers worked with a group
of teachers for three years and mapped their social networks. They found that teachers’
reasons for seeking others out to discuss mathematics changed dramatically over time
(Coburn et al., 2010) and concluded that social arrangements and organizational

27
structures to support collaboration and communication greatly influence individual
choice. They found that the colleagues who had direct ties were more likely to ask for
advice from one another. They stated, “tie formation - the foundation of social networks -
can be influenced in profound ways by existing organizational norms, structures, and
practices” (Coburn et al., 2010, p. 46). They suggested that administrators should concern
themselves with systematically understanding and configuring the network in purposeful
ways to support relationship building via interaction and communication between their
staff.
In their study, Penuel, Sun, Frank, and Gallagher (2012) aimed to investigate how
interactions between teachers augment learning from formal professional development. In
this longitudinal study with 20 schools, the authors followed teachers undergoing
partnership and professional development activities from the National Writing Project.
They analyzed advice-giving network data and self-report of writing instruction provided
by teachers, and concluded that both professional development and collegial interactions
between teachers were associated with changes in writing instructional practices,
therefore suggesting the social interactions teachers have matter when implementing
changes in practice.
SNA has been used to identify the teachers, staff, and administrators who are
change agents, opinion leaders, and individual and group stars, who drive the adoption
and spread of innovations. For example, Tuomainen, Palonen, and Hakkarainen (2010)
investigated one special education teacher’s activity within his workplace community and
his external professional network. Using SNA, the teacher was identified as a “networked
expert” who served as a bridge of knowledge resources in the community. Spillane and
28
Min Kim (2012) used SNA to study formal school leaders’ positions in advice seeking
and information networks within 30 elementary schools. They found that leaders (both
formal and informal) play central roles in the school organization and advice seeking
networks, by brokering relations and spreading pertinent information. In a study
conducted by Kochan and Teddlie (2005), school leaders used SNA to investigate
patterns of teacher collaboration, and identify highly connected individuals and the
presence of isolated cliques at the secondary school level. They concluded that effective
schools are characterized by a network of highly linked teachers, while lower performing
schools are comprised of disconnected cliques and isolates.
SNA has also been used to investigate large-scale school-community efforts at
reform. Cross, Dickman, Newman-Gonchar, and Fagan (2009) used SNA to explore,
measure and describe the development of intra-agency collaboration as part of a multi-
year Safe Schools/Healthy Students initiative involving partnerships among two dozen
community agencies. Levels of integration were shown to increase over time and were
correlated with other important outcome measures related to student safety and health.
Similarly, Coburn, Russell, Kaufman, and Stein (2012) studied how teachers’ social
networks were related to sustainability of school-wide reform efforts. In this longitudinal
study, the researchers asked teachers whom they talked to about mathematics, how often,
and why and observed their classroom mathematical practices. They concluded that the
social networks with ties, high expertise, and high-depth interaction enabled teachers to
sustain instructional practices related to this mathematics reform, even after initial
training supports were withdrawn. Their findings suggest, again, that the interactions and
relations between school staff have importance to instructional practice and overall

29
school performance. Hawe and Ghali (2008) examined the implementation of a school-
wide health promotion program using SNA. Their work revealed that SNA could provide
useful information about the structure of the school and to whom to introduce
programming, predicting that the individuals with the most ties within the school would
be the ones to facilitate the information and introduction of the program most efficiently
and effectively. Daly, et. al, (2010) employed mixed methods to examine social networks
and teacher work perceptions in an under-performing school district engaged in system-
wide reform. They concluded that social networks significantly influence the rate and
depth of school reform. Finnigan and Daly (2012) continued this work and investigated
whether underperforming schools under sanction exhibited the necessary processes,
relationships and school climates to support organizational learning and improvement.
They found that schools with sparse ties (and thus weak relationships) and negative
school climates inhibited flow of ideas and practices school-wide and district-wide to
implement change.
Recently, Woodland, Barry, and Crotts Roohr (2014) used SNA to examine an
elementary school network’s capacity for instructional innovation, and found that grade
level teachers who would be most responsible for introducing instructional changes to
their practice were not optimally positioned within the team task network to do so. They
were sparsely tied to their colleagues and leaders who would create change and introduce
reform efforts. Researchers also showed findings for school leaders; administrators
reconfigured their own positions within the network to become less redundant and over-
worked, to make diffusion and communication more efficient. Woodland and colleagues

30
emphasized that SNA has great utility in educational evaluation and can produce
meaningful results about network capacity for diffusion of instructional innovation.
Woodland, Whitcomb, and Barry (under review) also utilized SNA to examine
the configuration and position of the PBIS Leadership team within two schools’
respective networks. Authors reported more advantageous network centrality for
diffusion of innovation in schools who reported stronger implementation of PBIS at Tier
1. Their findings suggested that PBIS leadership team configuration and the position of
the team in the school’s overall communication network together influence the degree to
which teachers and school staff accurately articulate their school’s core values, teach
those core values in the classroom, and implement core PBIS practices across the school
community.
Diffusion of Innovation
The diffusion of the innovation, or the spreading of new practices and fixes, is an
integral part to the overall change process, and serves as a powerful approach to
understanding how efforts of school reform are implemented. Therefore, school leaders
and policy makers must aim to best support the diffusion of innovations by considering
the capacity of their school networks to do so.
Diffusion of innovation is a theory concerned with social networks, and seeks to
explain how information is spread between individuals, and specifically, how, why, and
at what rate new ideas are efficiently and effectively adopted across cultures (Rogers,
2003). Diffusion of innovation theory has been studied and applied in a vast array of
academic disciplines, including communication and marketing, healthcare and medicine,
organizational development and management, education, and anthropology (Moseley,

31
2004; Rogers, 2003), to help researchers and program developers understand the process
through which new ideas and technologies become translated into widespread practice
(Murray, 2009).
Diffusion of innovation originated in the 1920s and 1930s in Midwestern United
States as agriculture technology was rapidly advancing with rural sociologists, who
examined how independent farmers were adopting hybrid seeds, equipment, and
techniques. Often considered a seminal study in diffusion research, Ryan and Gross
(1943) studied the rate of adoption in hybrid corn seed in two communities in rural Iowa.
Because it was new, this hybrid corn was considered an innovation and some farmers
decided to adopt it quickly, while others delayed it for years. In their study, Ryan and
Gross reviewed the history of adoptions in the two communities by interviewing more
than three hundred farmers. Analyses revealed two major points: 1) The adoption process
began with a small number of farmers who adopted hybrid corn soon after it was
released. From these farmers, the innovation diffused to other farmers. 2) The most
influential source of information on this innovation was neighbors. When farmers saw
and interacted with farmers who had adopted hybrid corn, they adopted it too. Basically,
these findings implied that if innovative farmers were targeted to adopt innovations, other
farmers would soon follow, which would speed up the adoption of new agricultural
practices, and emphasized that the interaction between the farmers facilitated adoption
(Ryan & Gross, 1943; Hall & Hord, 2011).
In 1962, rural sociology professor Everett Rogers synthesized diffusion studies
across the fields and produced diffusion of innovation, a theory of adoption of
innovations among individuals and organizations. Based on his review of these studies,

32
Rogers defined diffusion as the process by which an innovation is communicated through
certain channels over time among the members of a social system (Rogers, 1962; 1995).
The end results of diffusion are adoption, implementation, and institutionalization. An
individual or organization (a) adopts an innovation upon the decision to acquire the
innovation, (b) implements the innovation by putting it into practice and testing it, and (c)
institutionalizes an innovation by supporting it fully and incorporating it into typical
practice routines (Dusenbury & Hansen, 2004; Oldenburg, Sallis, French, & Owen,
1999).
Rogers and other diffusion theorists posit that diffusion of innovation has four
main elements: the innovation, communication channels, time, and the social system
(1995). In this study, the innovation (PBIS), communication channels (the PBIS
leadership team), and the social system (teacher teaming network) were examined in
relation to the diffusion of PBIS.
Innovation
An innovation is an idea, practice, or object that is perceived new by an individual
or other unit of adoption. The newness of the idea is not just objectively “new”
knowledge. Someone may know about the knowledge, but has not yet formed an opinion
on it, or made the decision to reject or adopt. Therefore, newness of the innovation can be
understood in terms of one’s knowledge of, attitude toward, or decision to adopt it
(Rogers, 1995). For the purposes of this study, an innovation is considered a set of
instructional practices introduced to school staff and intended for them, as the units of
adoption to implement. The innovation of interest in this study is PBIS.

33
Communication Channels
For diffusion to occur, the process requires 1) the innovation, 2) an individual that
has knowledge of that innovation or experience using it, 3) an individual who had not yet
had experience, and 4) communication channel between those units or individuals
(Rogers, 1995). According to Rogers and other diffusion theorists, the communication
channels are the means by which messages get from one individual to another.
Communication channels often include mass media such as television, radio, social
media, or newspapers, interpersonal relationships, and the face-to-face exchange of
information between two or more individuals. The essence of diffusion is the information
exchange from one to other(s), and the communication channel allows for that to occur.
According to Rogers (1995), the nature of the information exchange relationship between
a pair of units determines the conditions under which a source will or will not transmit
the innovation to the receiver, and the effect of the transfer. Interpersonal influences can
either speed up or slow down the diffusion process (Dearing, 2004). Essentially, diffusion
of innovation will not happen unless there is a venue in which they can exchange
information (Rogers, 1995). In this study, the communication channels of interest are
established/formal teams of teachers within the school.
Social System
The social system is essential to diffusion of innovation. It is defined as a set of
interrelated units that are engaged in joint problem solving to accomplish a common goal
(Rogers, 1995), and constitutes a boundary for diffusion to occur. The members of the
system may be individuals, informal groups, and/or subsystems. They can be
distinguished from one another, but cooperate in order to reach a mutual goal. In

34
education, the system is the school, which is inclusive of all staff aiming to provide
quality instruction for their students.
The structure of the social system affects the diffusion of innovation. Structure,
defined as the patterns of arrangements of the units of a system, facilitates or impedes the
diffusion of innovation. When considering the structure of the social system, it allows
one to predict behavior within that system with some degree of accuracy, as its
arrangements can determine the extent to which members interact. For the purposes of
this study, the communication structure, or the linkages resulting from communication
between and among educators within and across educational systems, plays an integral
role in diffusing policies and procedures aimed to improve student outcomes.
Communication structures create interactions between all school staff and foster the
conversations about the innovations. In turn, structures allow for differentiated flows of
information exchange between and across individuals. Structures for the communication
of information about new ideas are essential in order to create positive perception of the
benefit and favorable attitude toward the innovation being described (England & Stewart,
2007).
Rogers and other diffusion theorists, again, emphasize interaction within the
social or communication structure as the facilitator of diffusion. This interaction occurs
within a larger social system, also known as a network. The network must be then
structured to support communication and interaction. In schools, the structures between
educators create a network in which information is spread to all those included. The
concept of studying the school networks is predicated on the idea that networks either
support or constrain diffusion of innovation and then the learning and performance of

35
teachers and other school staff. Networks must be structured to enable information to be
spread to all its members. In schools, educators must be positioned with mechanisms in
through which they communicate and work with another consistently. Those individuals
or groups who make decisions and have new ideas regarding school practice must be
positioned to spread the innovations to those who do not have them. The success of the
school is then dependent upon its communication network, to either support or constrain
implementation and application of innovative practices aimed to improve student
performance.
Rogers outlined the essential elements of diffusion, and emphasized the
importance of interaction and relationships between individuals. Clearly then, the
interactions between and among educators have significant influence on what happens
within a school. Educators who have access to their colleagues through communication
channels and social networks have opportunities to communicate with one another, make
meaning of information received and transferred, create new knowledge or expand upon
learned knowledge, and apply it to their instructional practice, ideally to improve the
outcomes of their students. Consequently, diffusion occurs, and change at the system-
level is equitable, consistent, and universal.
Social Capital Theory
Social capital refers to the value found within social networks as well as the value
one gains access to through social networks (Prell, 2011). More generally, social capital
has been understood as the actual and potential resources existing in the personal
relationships and linkages among members of a group or organization (Bourdieu, 1986;
Leana & Pil, 2006; Nahapiet & Ghoshal, 1998). The term first appeared in community

36
studies, where it was used to describe networks of strong, overlapping personal
relationships that developed over time within city neighborhoods. These relationships
formed the basis for cooperation, trust, and collective action, serving a critical role in
ensuring the survival and proper functioning of such neighborhoods (Nahapiet &
Ghoshal, 1998), implying that the capital produced via the network of community
members provided them with skills and vital information to stay productive as a
community.
Research on social capital from a social network perspective tends to focus on
how the structure of the social network relate to various outcome measures, and endorses
the idea that the networks serve valuable resources for the management of social
happenings (Prell 2011; Nahapiet & Ghoshal, 1995). For example, Leana and Pil
indicated that the structural dimension, or the overall network of relationships, is able to
facilitate information sharing and the exchange of knowledge among individuals (2006).
More specifically, the relational dimension accessible through the network is able to
foster enhanced levels of trust among individuals, which in turn encourages an
environment of collaboration. The cognitive dimension, which develops over time as
individuals interact with one another as part of the group, enables the group to develop a
shared vision and common goals (Leana & Pil, 2006; Zito, 2011).
Social capital is also quite prominent in diffusion of innovation. Given the
emphasis and importance on communication channels and social systems, the innovation
may be carried across the network, not through formal lectures or training, but through
positive social interaction. The social capital, which is accessible and created through
these social interactions, is then diffused across the system. Individuals within the

37
network possess a certain knowledge that is then transferred to others, allowing for
continued diffusion of the innovation, given a well-structured network.
Teams as Vehicles for Diffusion of Innovation and Access to Social Capital
Groups, teams, and committees of people who engage in inter-professional
collaboration are ‘‘the basic building blocks of an intelligent organization’’ (Pinchot &
Pinchot, 1993, p. 66). Because teams are the predominant unit for decision making and
getting things done in any organization (Barnard, 1950; DuFour & Eaker, 1998; Senge et
al., 2000; Gajda & Koliba, 2008), they serve as the best mechanisms for communication,
access to social capital between and amongst school staff members, and diffusion of
innovation. Communication can and does happen spontaneously between teachers and
actors in any given network, for example through friendships or informal gatherings or
commonalities (Deal, Purinton, & Waetjen, 2009). However, teams, i.e. connections
between people created by design, form an established network structure and increase the
likelihood that educators will collaborate and communicate consistently about what is
happening within the school (Gajda & Koliba, 2008; Dufour & Eaker, 1998; Woodland,
Barry, & Crotts, 2014). Educators who share membership within and between teams have
access to their colleagues and are best positioned to diffuse information across the
network.
Optimal school reform is more likely when the team communication network is
structured to support diffusion of innovation, and when the collaborative process of the
teams within the network is of high quality (Gajda & Koliba, 2008; Woodland & Hutton,
2012; Woodland, Barry & Crotts Rohr, 2014). High quality teacher teaming is
empirically linked with increases in teacher knowledge and skills, instructional quality,

38
and student learning (Garet, Porter, Desimone, Birman, & Yoon, 2010; Goddard,
Goddard, and Tschannen-Moran, 2007). Effective teacher teams engage in a process
focused on improving students' achievement and solving problems (Woodland & Hutton,
2012; Gajda & Koliba, 2008; Hiebert, 1999). One model of an effective team process is
DDAE (Gajda & Koliba, 2008; Woodland & Hutton, 2012), in which teams follow a
cycle of inquiry towards problem solving and improving practice. More specifically, a
well functioning team may include teachers solving problems of instructional practice
through a continuous cycle of dialogue, decision-making, action-taking, and evaluation
(DDAE). The process of DDAE around shared problems of instructional practice builds
the capacity of teachers to make significant, positive changes in their instructional
practice and produce significant increases in student achievement (Darling-Hammond,
Ancess, & Ort, 2002; Gajda & Koliba, 2007; Goodlad, Mantle-Bromley, & Goodlad,
2004; Hiebert, 1999; US Dept. of Education, 2001; Wasley et al., 2000; Zito, 2011; City,
Elmore, Fiarman, & Teitel, 2009; Stevens & Kahne, 2006; Dufour & Eaker, 1998,
Dufour, Dufour, & Eaker, 2005; Pounder, 1998).
Dialogue
Highly functioning teacher teams will engage in collective dialogue about student
learning, the effects of instruction on student achievement, and how to provide an
appropriate level of challenge and support to every student (Woodland & Hutton, 2012).
Lower functioning teacher teams may discuss more administrative issues such as
grouping and placement, scheduling, materials, and curriculum alignment (Pappano,
2007). Effective dialogue includes member attendance, balanced and shared participation
of members, a set agenda and summary of meetings, organized facilitation, procedures

39
for disagreements, and a consistent focus on student achievement and instructional
practice (Woodland & Hutton, 2012).
Decision Making
The most important decisions that teachers can make are those that deal with the
quality and merit of their individual and collective instructional practices and their effects
on student learning (Little, 1990; Valli & Buese, 2007). Sharing curriculum ideas,
swapping strategies, choosing textbooks, or crafting discipline procedures are not enough
to improve practice and increase student learning (Gajda & Koliba, 2008; Woodland &
Hutton, 2012). Teachers at all levels must uncover and determine relative differences in
instructional quality and make decisions about what and how to improve practice through
group consensus, transparency, a process, and focus on relevant topics (Woodland &
Hutton, 2012).
Action
By itself, a decision, or a plan to act, does not produce results (Woodland &
Hutton, 2012). If teachers do not take actions as a result of their team decisions, the cycle
of inquiry ceases to move forward and continuous improvement falters (Gajda & Koliba,
2008). Actions must be directly related to the improvement of practice and entail a degree
of sophistication through documentation of actions, equity, and coordination (Woodland
& Hutton, 2012). Without action of the team’s members, progress towards
implementation or change is halted, and process towards improvement is less likely to
progress. Team members must follow through on their decisions to ensure continuous
progress toward instructional goals.

40
Evaluation
Evaluation of decisions and actions is a crucial component of a fully developed
teacher team process of cycle of inquiry (Woodland & Hutton, 2012). Educators must
continually assess their effectiveness using data (i.e. tangible evidence that students are
acquiring essential knowledge, skills, and dispositions and practices and policies are in
place; Earl & Katz, 2006; Goldring and Berends, 2009, Stiggins, 2005; Dufour et al.,
2005). The extent to which the actions of a teacher team and changes made to practice
have merit or worth is determined through evaluation and action research: the systematic
collection, analysis, and use of data (Patton, 2012; Gay, et al., 2005). Teachers in high
functioning teams will systematically collect and analyze data whereas less effective
teacher teams tend to rely on opinion, memory, and disjointed observation.
In summary, social relationships are created through interpersonal interaction,
whether they be communication, attendance, attitudes, or just exposure. Inter-personal
interaction can be done by design via the formal team structure. Social capital is
cultivated and accessed via interaction, and the benefits of the social interaction are
greater when a network is structured to support further interaction and consequently,
diffusion of capital (e.g. knowledge, beliefs). Theoretically, when ideas and knowledge
are diffused across a network of individuals, they are more likely to adopt and implement
these ideas into current knowledge base. Ideally, adoption and implementation of ideas
and knowledge regarding best practice will then change their behavior and beliefs. In the
educational setting, this may translate into changing instructional practices, ideally
designed to improve and enhance academic, social, emotional, and behavioral student
outcomes.

41
Prevention of Social-Emotional-Behavioral Problems
Of all institutions, schools play the largest role in intervening with the social,
emotional, and behavioral problems that face youth (Koppelmann, 2004; Mayer, 1995;
Sprague & Walker, 2006; Sugai & Horner, 1994; Walker et al., 1996). However, the
ways in which schools have traditionally addressed behavioral concerns has been
problematic. Historically, traditional approaches have relied on restrictive, reactive, and
punitive approaches to managing and changing student behaviors. Schools often have
inconsistent rules and behavioral expectations and inconsistent and punitive management
practices (Lewis, 2006). The use of reprimands, penalties, loss of privileges, detention,
suspension, corporal punishment, and expulsion, with the exclusion of proactive and
positive approaches does not bring long-term change in behavior (Colvin, Kame’enui, &
Sugai, 1993; Sprague & Walker, 2006). Indirect intervention approaches, such as
counseling, used in isolation are ineffective and actually increase the incidence of
antisocial behavior (Sprague et al., 2001). Zero tolerance policies fail to give students the
opportunity to learn and practice social skills and self-management skills (Bear, 2010;
Colvin, Kame’enui & Sugai, 1994). In fact, exclusive use of punishment leads to
increases in aggression, truancy, vandalism, harassment, dropping out, and other problem
behavior (Lewis & Sugai, 1999; Mayer, 1995; Mayer & Sulzar-Azaroff, 1991; Skiba &
Peterson, 1999; Sprague et al., 2001). In response to the lack of empirical support for
reactive and punitive behavior management, schools have been urged to look toward a
more systematic proactive approach to address behavior. Sugai and Horner (2009) state,
“the reauthorizations of the Individuals with Disabilities Educational Act (1997, 2004)
increased attention to the use of scientifically based behavioral interventions and

42
supports, in particular to prevent the development of problem behaviors and to address
the educational needs of students with serious behavior challenges.” (p. 226-227).
Schools also have access to large numbers of children and are settings uniquely and
ideally positioned to proactively provide early efforts aimed at preventing problems and
promoting positive social, emotional, and behavioral outcomes for children. Researchers
have found that prevention programs can both reduce mental disorders and problem
behaviors and promote youth competence (Greenberg et al., 2004; Durlak, Weissberg,
Dymnicki, Taylor, & Schellinger, 2011). Evidence-based prevention efforts, when
implemented early in a student’s development, improve the outcome of the student both
behaviorally and academically, and in doing so improves the overall health and
functioning of the school.
In schools, prevention oriented reforms have become widely known as Response
to Intervention (RtI), Multi-Tiered Systems of Support (MTSS), Positive Behavioral
Interventions and Support (PBIS), etc. Conceptually, these models are adapted from
public health models, and typically include a framework for offering a population of
individuals universal, selective and indicated intervention support (Merrell & Buchanan,
2006; Strein, Hoagwood, & Cohn, 2002). Universal support (Tier 1) is offered
preventatively and consistently to all individuals, which often consists of the core
academic and social curriculum and instructional delivery practices that are offered to all
students. Selective support (Tier 2) is more intensive than universal support and is
offered to those who are not entirely responsive to what is provided universally. This
support is targeted and may include curricula or interventions offered to small groups of
students. Finally, indicated support (Tier 3) is intensive and individualized. In schools,

43
this may include specialized instruction in very specific domains. In essence, decisions
made within tiered support frameworks are those that adjust the intensity and nature of
support depending on assessment of students’ needs and responsiveness (Adelman &
Taylor, 2006). Research in schools, that have taken a preventive orientation to mental
health and behavior following a multi-tiered model of supports, reported associated
improved academic outcomes for students, a stronger connection to school among
students, a more positive school climate, reduced school violence and peer victimization,
and increased organizational health (Bandura, & Zimbardo, 2000; Bear, 2010; Bradshaw,
Koth, Thornton, & Leaf, 2009; Caprara, Barbaranelli, Pastorelli, Luiselli, Putnam,
Handler, and Feinberg, 2005; Domitrovich, Bradshaw, Greenberg, Embry, Poduska,&
Ialongo, 2010; Horner et al., 2009; Metzler et al., 2001; Zins, Bloodworth et al., 2004).
Positive Behavior Interventions and Supports (PBIS)
One commonly used system-wide framework for improving student outcomes is
PBIS. It is a prevention-oriented framework focused on creating environments that reflect
safety, social competence, and healthy school climates and has been adopted by nearly
20,000 schools in the United States (Horner, 2013). Research also suggests that
implementation of PBIS supports academic performance (Algozzine, Putnam, & Horner,
2010; Luiselli, Putnam, Handler, & Fienberg, 2005; McIntosh, Chard, Boland & Horner,
2006; McIntosh, Horner, et al., 2006; Metzler, Biglan, Rusby, & Sprague, 2001; Musscot
et al., 2008; Bradshaw, Koth, Thornton, & Leaf, 2009; Horner et al., 2009) and
reductions in problem behavior (Colvin et al., 1993; Horner et al., 2009; Nelson, 1996;
Nelson, Hurley, Synhorst, & Epstein, 2008; Nelson, Martella, & Galand, 1998; Nelson,
Martella, & Marchand-Martella, 2002; Safran & Oswald, 2003) and out-of-school

44
suspensions (Bradshaw, Mitchell, & Leaf, 2009; Horner et al., 2009).
The conceptual model of PBIS is a collaboration of (a) principles of applied
behavior analysis, (b) the multi-tiered prevention logic from community health (Walker
et al., 1996), (c) rigorous use of universal screening and progress monitoring (Fairbanks,
Sugai, Guardino, & Lathrop, 2007; Fuchs & Fuchs, 1986; Shinn, Walker & Stoner,
2002), (d) integration of behavioral and education practices for improving behavior and
learning (Algozzine & Algozzine, 2009; McIntosh, Horner, Chard, Boland, & Good,
2006), and (e) the implementation technology needed to apply effective practices at large
scales (Fixsen et al., 2005).
PBIS is a multi-tiered approach focusing on student social, emotional, and
behavioral learning. It is guided by the following principles: 1) develop a continuum of
scientifically based behavior and academic interventions and supports; 2) use data to
make decisions and solve problems; 3) arrange the environment to prevent the
development and occurrence of problem behavior; 4) teach and encourage prosocial skills
and behaviors; 5) implement evidence-based behavioral practices with fidelity and
accountability, and 6) screen universally and monitor student performance & progress
continuously (OSEP Center for PBIS, 2009).
PBIS is not a packaged curriculum, strategy, package, or product (Colvin, 2010,
Sugai & Horner, 2006). Rather, it is a framework in which essential features interact as a
system, which includes continuum of behaviorally-oriented practices, measurement tools
and data gathering that informs decision-making regarding service delivery, and
organizational systems and structures that support the implementation of practices and
ongoing use of data (Horner, Sugai, Todd, & Lewis-Palmer, 2005; Sugai & Horner,

45
2006). Universal practices associated with a PBIS model include clearly defining,
teaching, and acknowledging behavioral expectations and engaging in consistent
strategies for discouraging undesirable behavior across all school settings. These
practices are created by school staff and are able to be seen across all school settings
(classrooms, cafeteria, hallway, bus, playground, etc.). All members of the school
community including staff, parents, and students define and know the expectations. They
work collaboratively to teach and acknowledge the same expected behaviors and prevent
undesired behaviors in clear and consistent ways (Sugai & Horner, 2006).
Measurement of how well school staff are implementing PBIS practices and how
students are responding to these practices is critical (Sugai & Horner, 2006). Ongoing
assessment provides school leaders and stakeholders with information necessary for
validating decisions, identifying areas of success and targeting areas of need, making
decisions, and provide a general picture of the progress of an innovation. Data reveal
strengths and weaknesses and provide direction (Learning Point, 2004). Prior to
answering questions related to the outcomes of social-behavioral learning, it is essential
to assess if practices that enable student learning have actually been implemented. A
critical feature of high quality implementation is evidence of the extent to which critical
features of PBIS are being or have been implemented as intended (Algozzine et al.,
2010). A range of measures allows schools to assess the extent and quality of
implementation of PBIS practices school wide. These measures reveal if all practices are
apparent in all settings and to what extent. Together, these data produce a comprehensive
report of overall PBIS implementation. Measures include, but are not limited to: the
Team Implementation Checklist (TIC; Sugai, Horner, Lewis-Palmer, & Rossetto Dickey,

46
2011), Benchmarks of Quality (BoQ; Kincaid, Childs, & George, 2010), Self-Assessment
Survey (SAS; Lewis & Sugai, 1999; Sugai, Tood, & Horner, 2000; 2009), School-wide
Evaluation Tool (SET; Todd, Lewis-Palmer, Horner, Sugai, Sampson, & Phillips, 2012),
and Tiered Fidelity Inventory (TFI; Algozzine et al., 2014).
Measures of implementation, generally, assess the extent to which the essential
features necessary for PBIS are in place within a school. They include the establishment
of a functioning PBIS leadership team, staff commitment, leadership support, procedures
for dealing with discipline, development of expectations and rules, establishment of a
reward/acknowledgement system, systems and procedures for teaching
expectations/rules, data entry and analysis plans and routines, and a plan for continued
implementation and evaluation (Sugai et al., 2010). When PBIS is implemented, these
essential features are in place through observation, documentation, application to
classroom management and instructional practice, and embedded within normal school
functioning. Adequate implementation is generally observed as 70 to 80 percent or
higher, depending on the measure of implementation, which implies that intensive
coaching and training are no longer necessary. Any score below 70 to 80 percent shows
low implementation, and may indicate additional targeted support is needed to see
essential features of PBIS in place (Sugai, 2006; Cohen, Kincaid, Elfner Childs, 2007;
McIntosh et al., 2011; Kincaid, Childs, Blase, & Wallace, 2007).
In addition to measuring the implementation of PBIS efforts, it is critical that
school professionals consistently collect outcome data. These data are considered
indicators of the defined valued outcomes and may focus on academic achievement,
school climate, school discipline and/or social-emotional health. Often, office disciplinary

47
referrals (ODRs) are a source of data used to describe the overall behavioral climate of a
school and can be used to evaluate the extent to which a school-wide, universal
intervention such as PBIS is effective. ODRs have been correlated with important
outcomes such as student behavior, student perceptions of school climate, school and
classroom safety/orderliness (Irvin, Tobin, Sprague, Sugai, & Vincent, 2004). ODRs have
been previously defined as “an event in which (a) a student engaged in a behavior that
violated a rule/social norm in the school, (b) a problem behavior was observed by a
member of the school staff, and (c) the event resulted in a consequence delivered by
administrative staff who produced a permanent (written) product defining the whole
event” (Sugai, Sprague, Horner, & Walker, 200, p. 96). When ODR data are consistently
collected, managed, and analyzed, they can be helpful in illuminating school
professionals’ understanding of the overall behavioral functioning of their school. These
data rely on a shared understanding among staff for which behaviors should be managed
in the classroom versus those that need to be handled by an administrator.
PBIS Systems
School staff members need to have structures and mechanisms available that
support their work related to PBIS. Structures and mechanisms are the foundation for
implementation and provide consistency and expectations in practice. Together, they
create the whole framework (Sugai, 2006). School leadership provides the catalyst and
creates the conditions for diffusion of innovation and the successful implementation of
school reform (Leithwood, Harris, & Hopkins, 2008). A key variable in the successful
implementation of any school-wide initiative is the identification or establishment of a
leadership team responsible for facilitating the innovation (Marzano, Waters, McNulty,
48
2005) and having authority over the innovation (Horner et al., 2012). The establishment of
a PBIS leadership team is an essential component in the planning and delivery of PBIS-
related professional development, building capacity to enact PBIS practices, using data to
make decisions, and communicating and diffusing the initiative school-wide. Careful
development of the leadership team is defined as an essential process for achieving high
fidelity and high sustainability of PBIS (Horner et al., 2012).
An effective PBIS Leadership Team is recommended to consist of a group of
individuals that is representative of the school. For example, in addition to an
administrator, grade level teachers, special educators, a behavioral specialist,
paraprofessionals, parents, and even students may be considered “representative”
stakeholders. The collective knowledge, skills, and access to resources created by the
team members are necessary for setting a vision for implementation, developing and
carrying out a plan to fulfill that vision, and providing the necessary professional
development and support to staff (Coffey & Horner, 2012). Stakeholder representation is
also important “to ensure careful and thorough consideration of the implications of
proposed decisions for groups impacted by the team’s decisions, and may have a positive
impact on educators’ buy-in to adopted practices” (Broxterman & Whalen, 2013). A
broad team base is considered essential to ensuring a manageable workload for team
members, which in turn helps to maintain morale and motivation (Taylor et al., 1999).
Schools that sustainably implement school-wide practices are those in which leadership
teams are representative and carve out time to meet at least monthly to use student data
and/or process data to problem-solve, to target further professional development needs,
and to identify information that needs to be communicated school-wide (McIntosh et al.,

49
2013).
Practices with a team-based approach to implementation are more likely to
achieve adequate fidelity of implementation and see improved outcomes (Fixsen, Blase,
Duda, Naoom, & Van Dyke, 2010). Effective leadership team meetings tend to be those
in which participant roles are clearly defined and the meeting itself is organized. For
example, Newton, Todd, Algozzine, Horner, and Algozzine (2009) suggest that PBIS
leadership team meetings have an assigned facilitator, recorder, data analyst, and active
members. Having a defined process for what happens before, during, and after meetings
is critical, as is having a clear agenda that makes room for previous discussion points,
current problem-solving, and action steps. Algozzine et al. (2009) have created a model
that enables teams to effectively use time to engage in data-oriented problem-solving.
Schools engaging in Team-Initiated Problem-Solving (TIPS) meetings are those that
effectively collect and manage PBIS implementation and outcome data, regularly use
those data to generate precise problem statements, set measureable goals for behavioral
improvement, explore and implement evidence-based interventions based on analysis of
data, monitor the fidelity with which interventions are implemented, and evaluate the
effectiveness of interventions in an ongoing way. Research suggests that the TIPS model
has increased the organization and thoroughness of team meetings, and additionally has
improved teams’ use of data-based decision-making (Newton, Algozzine, Algozzine,
Horner, & Todd, 2011; Todd et al, 2011).
PBIS Implementation
The implementation of PBIS, like any large-scale innovation, takes on a systems
approach, in which the collective actions of individuals within the school predict how the

50
school operates (Lewis, Barrett, Sugai, & Horner, 2010; Colvin, 2010). All individuals
within the school have a common goal and consistently use the universally known
routines and practices (Horner, 2003). As PBIS is a systemic effort, it includes the
effective and efficient selection and implementation of practices by school personnel (e.g.,
teachers, school psychologists, administrators). Systems include the development of
policies and guiding principles, operating routines, resource supports, and administrative
leadership. With such systems in place, internal behavioral expertise and capacity are
developed, and data-based decision making is emphasized to improve the selection,
adoption, outcomes, and durability of practices (OSEP, 2004). While relying on “experts”
to deliver training and provide on-going technical assistance is a long-standing model
within education (Guskey, 2000), school-wide reform depends on building “expertise”
across all educators within a school (Lewis et al., 2010), suggesting that professional
learning and development will have to be embedded into the jobs and daily functions of
the educators. This can be done through a well-formed communication network. In this
sense, the capacity for schools’ networks to support ongoing high leverage professional
learning through diffusion of the innovation is a major consideration in the
implementation of far-reaching behavior support systems, such as PBIS.
Literature regarding the implementation of PBIS suggests it takes three to five
years to implement PBIS, and it occurs in six stages, allowing for the innovation of PBIS
to diffuse across the school network (Fixen et al. 2005; Fixen, 2011). Although these
phases are not necessarily linear, they provide a framework to follow and help to direct
school leaders’ decision-making and activities in the process towards implementation. In
the Exploration/Adoption stage, users make the decision to commit to adopting the

51
program and policies and supporting the successful implementation of PBIS. They will
consider if it will meet a need in their school, align with the school’s culture and
established practices, and have the capacity and support of school staff, administrators,
and district leadership. Fixsen et al. (2005) note that training does not start in this stage
because it is a time only for decision-making. Implementation continues only after key
stakeholders have had the time to examine current status, consider options, and determine
the feasibility and value of a new approach to how things are done within their school
(Horner et al., 2012).
Upon the end of the first stage, schools then move into the Installation stage, in
which they set up an infrastructure and foundation so that successful implementation can
take place and be supported. Activities in this phase include establishing a team and its
practices and routines, creating systems for data collection, development of diffusion
practices and training, and initial decision making of core PBIS practices such as defining
and teaching behavioral expectations and consequences. Horner et al (2012) emphasize
that a successful installation stage is one where a school identifies how to make the
practices fit into the local social, cultural, political, and geographic context. The capacity
of the network, specifically, is of utmost examination during this phase. The network
must support the diffusion of these practices to become in place across settings and
groups of school staff. Disconnected networks in which school staff do not have venues
to interact and converse with one another about decisions regarding PBIS impede
systematic implementation of PBIS. Conversely, collaborative networks in which school
staff have ample focused opportunities of exposure and communication about PBIS

52
support its implementation and sustainability (Finnigan & Daly, 2012; Woodland, Barry,
& Crotts Roohr, 2014).
Then occurs a transition into the Initial Implementation stage, in which school
users put practices in place, but try them out on a small-scale. This may include putting
PBIS into place in just one setting like the cafeteria, or with one grade level, or certain
elements. This stage is important to try out what had been planned and identify any
organizational, technical and practical barriers encountered at first try of PBIS (Fixen,
2001; Horner et al., 2012). Initial implementation involves documenting that a practice is
possible and produces the outcomes promised. Of major importance for PBIS, however,
initial implementation focuses using it not as a time of demonstration, but establishing
investment in the school’s capacity for training, coaching, evaluation, and development
of behavioral expertise (Horner et al., 2012), all with the intent to send the message that
the school’s network is capable of supporting expansion and sustainability of this major
initiative. Any problems within the school’s network may be noticed within this phase,
and as such, adjustments are made to best support diffusion through communication and
relationship-building of staff.
The next stage, according to Fixen and his colleagues (2005; 2011) is Full
Implementation. This phase includes expanding PBIS school-wide. The structure and
properties of the communication network of the school support the diffusion of PBIS, as
all elements are put into place, at all tiers and all settings. Training and coaching
procedures are put in place and refined, and capacity to sustain them is established (Fixen
et al, 2005; Fixen, 2011; Horner et al., 2012). PBIS leadership team also establish
schedules for continuous assessment of implementation and procedures for improvement.
53
The fifth and sixth stages of implementation are Innovation and Sustainability
(Fixen et al., 2005). Because schools are highly dynamic settings (Horner et al., 2012),
sustained implementation of PBIS must include active adaptation and continuous
improvement (Colvin, 2010). PBIS is not a one time installation, and should be modified
based on the needs of the school culture, expectations of the community, and experiences
of schools staff tasked with implementing it. Organizational culture, leadership, and staff
need to be nurtured and maintained. This translates into continuously training school
staff, evaluating practice, configuring the network to support continued diffusion, and
collecting implementation fidelity data to best meet the needs of all school community
members (Fixen et al., 2005; Fixen, 2011; Horner et al., 2012).
Facilitators of PBIS Implementation and Sustainability
PBIS, like any school-wide practice, requires significant time, effort, and
resources to implement. Sometimes PBIS is highly implemented and sustained, while
other times it is initially adopted, but quickly weakened or abandoned over time, leading
to low levels of implementation (Colvin, 2010). Research suggests that passive strategies,
such as guidelines and manuals or training alone are not effective strategies for
implementation of PBIS (Schectman, Schroth, Verme, & Voss, 2003; Schofield,
Edwards, & Pearce, 1997; Showers & Joyce, 1996), while ongoing training and coaching,
development of systemic routines and practices, and support from the whole school
community are associated with stronger reports of implementation (Sugai, 2006; Kincaid
et al., 2007; McIntosh et al., 2009; 2011; Horner et al., 2013).
Doolittle (2006) completed a study of 285 schools identifying what critical
features of PBIS implementation predicted (a) initial implementation (full

54
implementation within 3 years) and (b) sustained implementation (full implementation
for 5 years). Her results indicated that systems for teaching expectations and use of
school-wide data were significant predictors of initial implementation. Effective
administrator and school team leadership and an active student reward system were
significant predictors of sustained implementation.
Bambara, Nonnemacher, and Kern (2009) completed a qualitative interview study
of factors affecting sustainability of individual student support systems within SWPBS.
The authors identified five factors critical to sustainability: school culture, building
administrator support, time efficiency, capacity building, and stakeholder involvement.
In their study of PBIS implementation, Kincaid, Child, Blase, and Wallace (2007)
systematically worked with schools of high PBIS implementation and low
implementation to determine the barriers and facilitators of implementation. Barriers
included lack of time, high staff turnover, lack of knowledge, and misunderstandings and
misperceptions about PBIS. A fit into the school culture and social system, leadership
team preparation and representative membership, ongoing training and administrative
support, positive student outcomes, and staff buy in served as common facilitators of
PBIS implementation (2007).
More recently, McIntosh and colleagues (2013) measured the factors most
predictive of sustained implementation of PBIS across schools. The authors had
previously developed a model of sustainability, which delineated priority (staff
commitment, administrator support, resources, and integration into new and existing
efforts), effective teaming and skills, efficiency, and continuous regeneration by way of
using data and building capacity as the factors necessary for sustained implementation.

55
While all factors predicted sustainability within all schools, the two most associated with
sustained implementation of PBIS were the functioning of the PBIS leadership team,
especially its use of data, and capacity building (2013).
Conclusion
SNA, diffusion of innovation, social capital, and quality of school staff member
team process all inform the theoretical foundation of this study, and have been supported
and explained in many disciplines and numerous writings. Each one is concerned with
relationship building, communication networks, and the influence of social ties on greater
learning, productivity, and performance. Given that school-wide efforts such as PBIS has
taken on a systemic approach to implementation, it seems appropriate to study their
implementation through a social network perspective.
Relationships between school staff members are formed by interactions within
and between high functioning teams; these connections between teams form a school’s
communication network. The quality, attributes and dynamics of the network structure
have the capacity to support or impede diffusion of innovations related to school-wide
practices. Implementation occurs when the innovation is diffused. Furthermore, PBIS is
more likely to be implemented and sustained when there is capacity to support it and a
well functioning team leading the charge within the school’s larger teaming network.
Therefore, when considering implementation, we must consider the innovation itself, the
capacity of the network, AND the quality of internal process for collaboration of its teams.

56
CHAPTER 3
METHODOLOGY
Introduction and Statement of the Problem
Communication networks structured to support implementation of systemic
reform are associated with improving the quality of instructional practice in K-12
education. Teams are the predominant unit for decision-making and getting things done
in any organization (Barnard, 1950; DuFour & Eaker, 1998; Senge et al., 2000; Gajda &
Koliba, 2008), therefore they serve as the primary mechanism for intra-organizational
communication. A school’s team communication network supports or constrains the
spread of knowledge, diffusion of innovation, and adoption of reform. School
professionals are faced with the tremendous task of improving the instructional practices
that support the healthy social-emotional-behavioral outcomes of children. Practices
aimed at supporting and improving student outcomes are most likely to succeed and be
sustained in schools in which school staff members are able to communicate and
collaborate with one another via a team structure (McIntosh et al., 2013; Croft, et. al,
2010; Dufour, 2011; Dufour & Eaker, 1998; Gajda, 2004; Gajda & Koliba, 2008; Leana,
2011; Little, 2003; Hattie, 2009; Hord, 2004; Pounder, 1998). To ensure successful
implementation and longevity of school-wide reform, leaders and researchers must assess
schools’ capacity of their communication networks to support the diffusion of best
practice and instructional innovation (Coburn, Choi, & Mata, 2010; Deal, Purinton, &
Waetjen, 2009; Daly, et. al, 2010). Analysis of team communication networks enables
educators to make informed decisions about improving children’s school environments to
better address their needs.

57
Diffusion of innovation is elemental to the consideration of implementation of
school-wide initiatives and reform efforts. Diffusion of innovation theory (Rogers, 1963)
posits that when an idea is adopted by a user and applied to his or her practice, it is
considered implemented. Therefore, when a new idea has been implemented, diffusion
has occurred (Rogers, 1995; Dusenbury & Hansen, 2004; Oldenburg, Sallis, French, &
Owen, 1999). For the purpose of this study, implementation is considered a direct
indicator of diffusion.
A large body of research has pointed to communication networks as valuable foci
in education reform and innovation and systems-level implementation research (Deal,
Purinton, & Waetjen, 2009; Daly et al., 2010; Moolenaar, 2012; Moolenaar & Daly,
2012; Penuel et al., 2010). PBIS is a widely used school-wide framework in schools
aimed at promoting positive social-emotional-behavioral health by providing systematic
behavioral supports for all students (Horner, 2013; Sugai & Horner, 2006). With school-
wide efforts, the intent would be for every educator, in every setting, to become aware
and adopt practices by way of diffusion and then implement each associated system and
practice.
The purpose of this study was to closely examine the relationship between
structure of team communication networks and implementation of PBIS. First, this study
attempted to identify which network structural positions and properties supported or
constrained diffusion of PBIS practices, by determining how network structural
properties were related to the level of PBIS implementation. Second, the study aimed to
detect which network structural positions and properties of the PBIS leadership team
supported and constrained diffusion of PBIS practices, by determining the relationship of

58
the network structural position and properties of the PBIS leadership team and the level
of PBIS implementation. Third, this project sought to identify how the PBIS leadership
team’s quality of internal process for collaboration supported or constrained diffusion of
PBIS, by determining how the PBIS leadership team’s internal process for collaboration
was related to PBIS implementation.
SNA, the study of relationships and networks, and their influence on individual,
group, and system behavior, served as the primary methodological approach to this study.
SNA was chosen intentionally as the study’s approach and design because allows for
making insights into how network structure supports or constrains diffusion of
innovations.
Research Questions
The following three research questions, and their sub-questions, were addressed in
this correlational, network analysis study:
1. To what extent are the structure and properties of a school’s team communication
network related to the level of PBIS implementation?
a. What is the relationship between general network properties (number of
vertices and number of edges) as well as properties indicative of cohesion
(density, average path length, and centralization) and percentage of PBIS
implementation, as measured by the Self Assessment Survey (SAS)?
b. Which network structural properties of the team communication network
support or constrain diffusion of PBIS?
2. To what extent does the structural position and properties of the PBIS leadership
team relate to the level of PBIS implementation?

59
a. What is the relationship between network properties indicative of
influence (centrality) and percentage of PBIS implementation, as
measured by the SAS?
b. Which network structural properties of the PBIS leadership team support
or constrain diffusion of PBIS?
3. To what extent does the quality of the internal process for collaboration of the
PBIS leadership team relate to the level of PBIS implementation?
a. What is the relationship between the quality of the PBIS leadership teams’
internal process for collaboration, as measured by the Teacher
Collaboration Assessment Survey (TCAS) and percentage of PBIS
implementation, as measured by the SAS?
b. Does the quality of the internal process for collaboration of the PBIS
leadership team support or constrain the diffusion of PBIS?
Design and Hypotheses
The purpose of this study was to investigate the relationship between the structure
of team communication networks and implementation of PBIS. This was achieved
through the analysis of the communication networks of teachers and other school staff
members from schools currently implementing PBIS. The study used SNA as its primary
methodological and analytic approach and followed a descriptive and correlational design
(Gravetter & Wallnau, 2007). A descriptive design allowed for the observation of the
school networks within the context of PBIS implementation without any manipulation of
variables. A correlational design addressed research questions aimed at determining if
there was a relationship between the variables described (network structure and

60
properties and PBIS implementation). The underlying theoretical model directing data
collection and analysis was that structure of communication networks supports or
constrains school staff members’ access to social capital and overall school capacity for
diffusion of innovations.
This study was designed to explore three main questions. First, the study sought
to identify properties of the network that would support or constrain diffusion of PBIS.
Second, the study aimed to determine structural positions and network properties of the
PBIS leadership team that would either support or constrain diffusion of PBIS. Third, it
aimed to determine how the quality of the internal process for collaboration of PBIS
leadership teams supported or constrained diffusion of PBIS. Given the study’s aims and
assumptions, hypotheses for this correlational research study were as follows:
(H1): There is a moderate to strong relationship between network properties and PBIS implementation.
(H1a): A moderately connected and far-reaching network in which each team is
connected to at least one other support diffusion of PBIS. A disconnected and short-reaching and highly centralized network in which teams are isolated or frequently inaccessible, constrain diffusion of PBIS.
(H1b): Measures of network properties and of network cohesion are moderately related to the level of PBIS implementation.
(H2): There is a moderate to strong relationship between network structural properties of the PBIS leadership team and PBIS implementation.
(H2a): PBIS leadership teams in highly central and influential positions within the network support diffusion of PBIS. PBIS leadership teams with positions on the periphery and who are inaccessible constrain diffusion of PBIS.
(H2b): Measures of centrality are moderately related to the level of PBIS implementation.
(H3): There is a strong, positive relationship between the PBIS leadership team’s quality of the internal process for collaboration and PBIS implementation.
(H3a): PBIS leadership teams who show high quality of internal process for collaboration (i.e. engage in a cycle of inquiry) support diffusion of PBIS. PBIS

61
leadership teams who show poor quality of internal process for collaboration constrain diffusion of PBIS. (H3b): PBIS leadership team inner process for collaboration is strongly related to the level of PBIS implementation.
Setting and Context
The study was conducted in an urban school district in the Commonwealth of
Massachusetts. The district serves over 25,000 students from preschool to grade 12 and
consists of 36 elementary schools, 10 middle schools, and 5 high schools. The district
includes traditional public school models, charter and magnet schools, and some
alternative settings. During the 2013-2014 academic year, 52% of the student body was
male and 48% was female. In terms of ethnicity, 20% of students were African
American, 2% Asian, 62% Hispanic, 12% White, and 3% Multiracial. Approximately
87% of students received free or reduced price meals (Massachusetts Department of
Elementary and Secondary Education [MA DESE], 2014). In terms of school and
teacher demographics, 20% were male and 80% were female. 5% of teachers were
African American, 1% Asian, 5% Hispanic, 89% White, and 1% Multiracial. 94% of
teachers were licensed and considered “highly qualified” (MA DESE, 2014).
The district is one that was identified with “Level 4” status, indicating that the
district, overall, was among the lowest performing and least improving based on state
accountability measures. The state classifies schools and districts from Level 1 (highest
performing) to Level 5 (lowest performing). Of the district’s 55 schools, 23 were at Level
3 status and ten schools were identified as Level 4 status based on state accountability
guidelines. Through its district strategic improvement plan, the district sought to improve
student performance in these schools by introducing a number of initiatives, including
additional learning time per day, improved and additional professional development for

62
teachers, and the institution of health and wellness support networks to students and
families. One major reform effort aimed at improvement of Level 3 and 4 schools in the
district was the introduction of PBIS. Implementation of PBIS started in the 2011-2012
school year with 16 schools across all grade levels and followed a cohort model, in which
groups of schools started implementation at the same time and received coaching and
training together. Each year additional cohorts of schools were added and by 2013-2014,
24 schools district-wide had begun implementation of PBIS.
Recruitment
Prior to initiating the recruitment process, the study was approved by the
Institutional Review Board (IRB) of the Human Research Protection Office of the
College of Education at the University of Massachusetts Amherst and the IRB of the
Assessment, Research, and Accountability Department of the district.
Because the study was aimed to analyze the relationship of the structure of
communication networks and implementation of PBIS, the investigator sought only to
include those who had been identified as implementing PBIS. In addition, to control for
variability in grade level of students, only elementary schools were intended to be part of
the sample. Sixteen of the 24 schools implementing PBIS within the district were
elementary schools.
After permission to conduct the study was granted from several district leaders
and stakeholders of PBIS within the district, schools were recruited for participation by
means of an informational email distributed to building administrators (principals and/or
assistant principals responsible for oversight of PBIS activities). Per directives from
district leadership, emails were not directly sent by the investigator, but rather via the

63
district behavior specialists who served as the in-district PBIS coaches assigned to
support each school and had established relationships with the school administrators. The
email explained that the purpose of the study was to investigate the implementation of
PBIS and the nature and quality of educator networks, at the school-wide level. The email
described the basic procedures of the study, focusing on the commitments of
administrators and school staff would make distributing and/or completing short surveys
(see Appendix A for a sample of the recruitment email).
From the email correspondence, six school administrators initially agreed for their
schools to be to part of the study and in turn, their staff to be participants. A district PBIS
coach/behavior specialist invited the investigator to meetings with two additional school
administrators, in which the study was presented again, and administrators agreed to
participate. A total of eight elementary schools were included in the study.
Sample
A power analysis was conducted using the G*Power 3 software program (Faul,
Erdfelder, Lang, & Buchner, 2007) to determine the number of subjects needed for the
study. Given the use of two independent data sets (network and implementation), a power
analysis for an independent means t-test was run. With a power of .80, an alpha level of
.05, and an expected large effect size, d=.80, a total sample size of at least 7 subjects
(school networks, PBIS leadership teams) was needed. A large effect size was anticipated
based on previous research that found the network-level measures or position are
associated with performance, innovation, and success across varied professional settings
(Ouimet, 2004; Wang & Zhang, 2012; Clifton, Turkheimer, & Oltomanns, 2009).
The sample included eight schools within the district that had implemented PBIS.

64
The number of staff within each school are in Table 1. Staff included teachers,
administrators, counselors, and support staff.
Table 1
Sample Schools and Staff Members
School Total Staff Members (n=)
School 1 56 School 2 50 School 3 47 School 4 42 School 5 29 School 6 56 School 7 69 School 8 57
PBIS Implementation
As noted previously, implementation of PBIS followed a cohort model within the
district. As such, schools started receiving training and technical support from PBIS in-
district and out-of-district coaches at different times, starting in 2011. At the time of the
study, each school was still receiving training and technical support. Training was
identical and teams received it at the same meetings occurring throughout the school
year, at which PBIS coaches were present. Table 2 shows each school’s cohort, initial
training date, and date of implementation.

65
Table 2
School Implementation Timeline
School Cohort Training Date Date of Implementation School 3 1 February 2011 September 2011 School 8 1 February 2011 September 2011 School 1 2 June 2011 September 2011 School 4 2 June 2011 September 2011 School 6 2 June 2011 September 2011 School 2 3 May 2012 September 2012 School 5 3 May 2012 September 2012 School 7 3 May 2012 September 2012
In Table 3, Schools are ordered by level of implementation. 70 percent indicates
adequate implementation of the essential features of PBIS. As can be seen in Table 3,
School 5 demonstrated the strongest overall implementation with 89 percent and School 1
had the lowest reported implementation with 42 percent.
Table 3
Level of PBIS Implementation (Self-Assessment Survey Results)
School Percent Implemented
School 5 89 School 8 77 School 2 71 School 6 69 School 3 59 School 7 58 School 4 45 School 1 42
PBIS implementation data were collected through the implementation measure
used within the district and available from PBISApps.org: the PBIS Self-Assessment
Survey Version 2.0 (SAS; Lewis & Sugai, 1999; Sugai, Tood, & Horner, 2000; 2009). The

66
SAS is used by school staff for assessment of staff awareness of PBIS practices and
perception of the implementation status and improvement priority for across four
systems: 1) school-wide, 2) classroom, 3) non-classroom, and 4) individual student
systems. It includes a total of 46 items, in which respondents rate whether a particular
element is “In Place”, “Partially in Place” or “Not in Place” and at a “High”, “Medium”,
or “Low” level of priority. Results then provide a status of implementation and can help
to inform an action plan for implementing and sustaining PBIS systems throughout the
school. It has demonstrated moderate to high-level technical adequacy and shown
valuable for program evaluation and applied research of PBIS (Safran, 2006; Hagan-
Burke & Burke, 2005).
The School-Wide System subscale of the SAS, which is comprised of 18 items
targeted at: 1) the presence of a team, 2) identifying and teaching expectations, and 3)
procedures for addressing behavior was used to determine the level of PBIS
implementation. Appendix B includes the School-wide subscale of the SAS.
The SAS was completed online by staff members at each school between March
and June 2014. Permission to access SAS data was also obtained between March through
June 2014 through communication with school administrators, the in-district PBIS
coordinator, and the out-of-district PBIS consultant. Survey completion ranged from 20%
to 100% across the eight schools. Table 4 shows response rates of the SAS for each
school. Schools with lower response rates may limit the validity and reliability of the
SAS and accuracy of PBIS implementation.

67
Table 4
Self-Assessment Survey Response Rates
School Response Rate Percentage
School 1 20 School 2 60 School 3 34 School 4 100 School 5 76 School 6 50 School 7 78 School 8 58
Procedures and Measures
Data Collection
Data collection occurred in two phases. Phase one consisted of garnering
communication network data and creating an inventory and matrix displaying teams and
members. In phase two, the investigator gathered information regarding PBIS leadership
team quality of internal process for collaboration.
Phase 1: Team Communication Network Raw Data
Data regarding schools’ formal teams were collected to generate an accurate
inventory and in order to create a map of the team communication network in each school
included in the sample, and to thus analyze its structures and properties as delineated by
both research questions one and two. A school formal team is a team, group, or
committee of staff members within a school. It is purposefully created and organized by
school administrators, tied to school operations or improvement goals, and can typically
be identified in organizational charts (Woodland, Barry, & Crotts Roohr, 2014). It is not a
group or tie created organically outside the formal structure of the organization, such as

68
friendships, personal relationships, social groups and clubs, common lunch time, ad-hoc
planning, or shared or closely placed workspaces or classrooms.
Data collection for SNA has typically been accomplished through surveys and
questionnaires (Scott, 2000; O’Malley & Marsden, 2008; Prell, 2011). Descriptive data
about the teams were gathered via a survey of each school’s administrator and school
staff and made into a matrix identifying teams (columns) and their members (rows).
Team Inventory
The Team Inventory is a researcher-created tool to gather information about
schools’ teams and team members. It follows approaches delineated by the Collaboration
Evaluation and Improvement Framework (CEIF; Woodland & Hutton, 2012) and
Teacher Collaboration Improvement Framework (TCIF; Gajda & Koliba, 2008), which
have been used by school leaders and researchers to identify teams and communities of
practice, and improve their network structures and collaborative practices. The Team
Inventory employed in this study was adapted from the suggested instruments included in
the CEIF and TCIF. The Team Inventory includes six prompts in which respondents
identify: 1) the formal teams or groups within a school, 2) members of the teams/groups,
3) members’ titles/roles within the school, 4) when and how often teams meet, as well as
their 5) duration, and the 6) purpose/focus of each team. See Appendix C for the Team
Inventory. Data about titles of team members, team meeting times and durations, and
purposes of the teams were not utilized in this study.
Attached to each recruitment email sent to administrators was the Team
Inventory. Administrators returned the completed Team Inventory to the investigator via
email or hard copy via interoffice mail, based on the preference of the recipient. They

69
were completed between February and April 2014.
Staff Member Survey
To confirm the accuracy of the data provided through the Team Inventory, the
investigator cross-referenced them with a survey of school staff in which they identified
their team memberships. The Staff Member Survey is researcher-created and adapted
from the tools and approaches to taking inventory of teams and communities of practices
within schools and organizations explicated by the CEIF (Woodland & Hutton, 2012) and
TCIF (Gajda & Koliba, 2008). It includes three items, in which school staff identified 1)
their names, 2) their primary role within the school, and 3) the teams of which they
belonged. Staff member surveys prompted staff to check off teams to which they
belonged (teams were provided by the administrators via the Team Inventory), and
provided spaces to add those teams or groups not identified by the administrator. Each
Staff Member Survey was adapted based on the team names per school, but followed a
uniform format. Appendix D includes a template of the Staff Member Survey.
Surveys were distributed by hard copy to individual school staff members and
returned through a variety of methods (interoffice mail, participation at a staff meeting,
and/or picked up directly from school administrative assistants). School staff members
who completed the survey were entered into a raffle entry for a gift card as incentive for
participation. Participation in survey completion ranged from 13% to 90% across schools,
with an overall completion of 53%. Surveys were administered between March and May
2014. Although overall survey completion was 53%, a response rate of 100% was not
necessary for the inventory process because administrators had identified and therefore
accounted for all staff members and teams of their respective schools via the Team

70
Inventory, thus creating a full dataset. It was interesting to note that staff added a mean of
3.38 additional teams (range 2 to 6) that had not been identified by administrators
through the Team Inventory, indicating that teachers and staff may have a more accurate
understanding of teams within their schools.
School Staff Lists and Matrices
Upon cross-reference of administrator and staff surveys, the investigator then
complied a final spreadsheet of school staff and their team memberships, using staff lists
available from school websites and/or documents provided by district leaders. This
spreadsheet was then sent via email to administrators for confirmation of valid data.
100% of administrators responded with confirmation that their respective school’s data
were indeed, accurate. Correspondence regarding review of spreadsheets with
administrators occurred between March and May 2014.
The final inventory was then used to create a two-mode matrix as an ©Excel
spreadsheet. School staff members were listed in rows and teams were listed as the
columns. A ‘1’ in a cell represented membership to a team. The inventory of network raw
data is both valid and reliable because 100% of administrators verified the final
inventories to be accurate, reflecting no discrepancies revealed during the data collection
cross-referencing verification process. Administrators confirmed the addition of the
teams added by their teachers and staff in the Staff Member Survey. They account for all
teams and staff members within each school.
Phase Two: PBIS Leadership Team Internal Process for Collaboration
The third research question aimed to determine the relationship of PBIS
implementation with the internal process of the PBIS leadership team and quality of

71
collaboration within the PBIS leadership team (i.e. the extent to which they follow a
cycle of inquiry).
Teacher Collaboration Assessment Survey (TCAS)
The third research question aimed to determine the relationship of PBIS
implementation with the internal process of the PBIS leadership team and quality of
collaboration within the PBIS leadership team (i.e. the extent to which they follow a
cycle of inquiry). Data were collected via self-assessment using the Teacher
Collaboration Assessment Survey (TCAS; Woodland & Hutton, 2012; Gajda & Koliba,
2008). The TCAS is included in Appendix E. The TCAS allowed team members to rate
their team’s internal process, or the extent to which the team followed a cycle of inquiry,
which includes the quality of dialogue, decision-making, action-taking, and evaluation
that occurs throughout team meetings. The TCAS generated likert scale scores (1-5) for
each of the 4 process domains (Dialogue, Decision Making, Action, and Evaluation) and
a total score of overall process for collaboration. It is a formative assessment measure
that has demonstrated adequate reliability and validity (Crotts, Colvin, Li & Randall;
Cook, Foster, and Randall, 2011; Lee & Randall, 2011; Woodland, Kim, & Randall,
2013; Zito, 2011). Analysis of the assessment’s internal consistency or inter-item
reliability revealed coefficient alphas of at least .930 (Zito, 2011). An assessment of
TCAS administration to nearly 600 educators revealed item reliability of separation of the
five scales ranged from 0.97 to 1.00 and person reliability of separation from .80 to .90
(Woodland, Kim, & Randall, 2013). In terms of validity, construct, convergent and
discriminant validity were demonstrated by the scale scores of the DDAE were more
highly correlated with one another (.58 to .83) than other related variables, such as

72
instructional improvement (.41 to .46), student achievement (.45 to .51), administrative
support (.30 to .41). The TCAS’ content validity is supported, as it was developed by
experts on the topic of teacher collaboration and based on theoretical and empirical
knowledge (Woodland, Kim, & Randall, 2013).
Hard copies of the TCAS were given in May and June 2014 to in-school and in-
district PBIS coaches, who were responsible for then distributing them to their respective
PBIS leadership teams. Each member of the PBIS leadership team at each school
completed the TCAS individually during a PBIS leadership team meeting, and returned
them to the investigator via interoffice mail. Seven out of eight school PBIS leadership
teams completed the TCAS and 100% of PBIS leadership team members at those seven
schools completed it. TCAS data were aggregated and analyzed to provide an overall
quality of functioning and process for each school’s PBIS leadership team (Woodland &
Hutton, 2012).
Data Analyses
The primary analytic approach for this study was SNA Butts, 2003; de Nooy,
Mrvar, & Batagelj, 2005; Prell, 2011; Wasserman & Faust, 1994), an approach used to
visually and mathematically examine and analyze social relationships. SNA is predicated
on a relational way of thinking in which individuals and groups are seen as structured,
embedded, and active social networks. It is different than typical methods of social
science research, which operate on a variable way of thinking, in which individuals are
independent or astructural, and their distinguishing characteristics (e.g. race, gender,
socioeconomic status, etc.) take on causal power. Instead, the network analysis approach
rejects the independence assumption, and the social web or network in which the

73
individuals lie becomes the primary unit of investigation and explanation for behavior
(Woodland, Barry, & Crotts Roohr, 2014; Papachristos, 2010; Daly et al., 2010).
Findings derived from SNA can be used to 1) describe existing programs, patterns
of knowledge transfer, and network attributes, in which networks are treated as dependent
variables and/or 2) predict, for example, how information spreads throughout a network
or interventions or programs will become integrated throughout a system (Woodland,
Barry, & Crotts Roohr, 2014; Papachristos, 2010; Daly et al., 2010). When networks are
used for predictive purposes, they serve as independent variables and are informative for
determining capacity for diffusion of innovation. As mentioned in Chapter two, social
network analysts interested in diffusion of innovations study how an innovation gets
communicated through the network, and how individual actors are influenced by the
network to adopt or reject a given innovation (Prell, 2011). For the purposes of this study,
school networks were treated as independent variables, whose structural properties
accelerate or constrain communication, and serve as indicators of its capacity to support
diffusion of innovation (i.e. PBIS practices, systems, routines), and thus influence the
extent to which PBIS was implemented school-wide. Therefore, social network analyses
were used to make inferences regarding the capacity of the team communication network
to diffuse PBIS practices throughout the school community. PBIS is typically measured
through self-assessment or observational tools that assess the extent to which certain
deemed-essential practices or parts of PBIS are in place and observable. SNA add value
to these usual assessments by providing a picture of the social context (network) in which
these practices are embedded, and the capacity of that network to either support or
constrain the continued use of them. Findings derived from SNA can inform adjustments

74
to be made in order to best enable PBIS practices to be in place and useful.
Network analysts construct sociograms (maps) that show the attributes,
properties, and structure of a bounded network (i.e. a complete network such as a work
organization or village in which only its members are the ones included). In these maps,
individuals (or groups) are represented as the actors (also known as vertices or nodes),
which are discrete persons, teams, departments, programs or anything capable of forming
relationships with another entity (Daly, 2010; Deal et al., 2009). Edges (also referred to
as lines, paths, or ties) indicate connections between people in the network (Penuel et al.,
2006). Further, statistical analyses are also performed to indicate whole-network structure
of connectedness and capacity for diffusion. Actor-level properties were calculated to
make conclusions regarding PBIS leadership teams’ positional power and influence, and
access to the rest of the network. Network-level and actor-level analyses were used to
inform the network capacity for diffusion of innovation.
To address the relationship of network structure and properties and PBIS
implementation, (Research Question 1), analyses of network sociograms and properties
aimed to inform conclusions at whole-network capacity to support diffusion of PBIS
innovations and practices. To investigate the extent to which PBIS leadership team
properties within the network are related to PBIS implementation, (Research Question 2),
network sociogram and property analyses were used to highlight the position of the PBIS
leadership team within the greater network, its influence over the network, and thus
ability to diffuse PBIS innovations and practices. Using SNA a Team Communication
Network (TCN) – one socio-gram depicting the TCN - was created for each school. The
TCN is a formal network of connections between teams, groups, or committees, through

75
which teams communicate with one another, therefore allowing work of the school to be
completed, and for diffusion of innovation to take place. Teams within the TCN serve as
their own sub-networks, displaying patterns of communication and interaction. The TCN
is an adaptation from the Team Task Network (TTN; Woodland, Barry, & Crotts Roohr,
2014), and emphasizes teams’ capacity to communicate by means of co-membership
between teams. The TCN is purposefully created by school-based personnel, typically
administrators, to address the needs and organizational goals of the school. It is not
created by friendships or advice-seeking/giving, for example, but rather carefully created
to provide school staff members with communication channels to interact, become aware
of innovative priorities and practices of the school, and to increase capacity of the
diffusion of innovation. The TCN is similar to an organizational chart, as it is derived
from the job functions of individuals and their focused goals and tasks. However, it is
different from an organizational chart, as it shows how those included within the
organization are connected to one another and the extent to which they can interact to
complete the work of the school.
All network statistical analyses were calculated from one adjacency (actor by
actor) matrix of all team ties (team by team). All data matrices included binary data for
which a score of 1 was given when there was a tie between two teams, and a score of 0
when two teams were not tied together. A tie between a team is one or more individual
people who belong to both those teams (i.e. dual-memberships between teams).
Network Analyses
To determine the extent to which the network is configured to support or
constrain diffusion of PBIS (Research Question 1), each school’s whole school TCN was

76
analyzed. The properties of the PBIS leadership teams within the TCN were analyzed at
the ego-level (Research Question 2). The relevant network analyses are outlined below.
Network analyses were conducted in R (Urbanek & Bibiko, 2012) using the ‘statnet’
package (Handcock, Hunter, Butts, Goodreau, & Morris, 2007) and UCINET (Borgatti,
Everett, & Freeman, 2002).
Descriptive Network Properties
A count of the number of nodes and edges was conducted to provide an analysis
of the structure of the school’s TCN. Nodes within the TCN represented teams and edges
signified ties between teams. Such descriptive network properties provide an overview of
the size and connectedness of a network, which allow to address research question one
and determine a sense of each network’s capacity for diffusion.
Visual Analysis
Network sociograms were created to show a picture of each school’s TCN. A
visual inspection of the sociograms showed the structure and properties of the networks,
and allowed for a preliminary analysis of the cohesion and connectedness of the
networks, likelihood and frequency of teams to be connected to one another, and
identification of teams as isolates, stars, bottlenecks, bridges, and cliques (definitions of
relevant network concepts are included in Appendix F). By visually inspecting the
sociograms in relation to research question one, the investigator was able to make
inferences about the networks’ capacities for social capital and diffusion, based on
network theory. For research question two, a visual inspection of TCN sociograms was
performed to identify the network position and properties of the PBIS leadership team.
Analyses were then limited to the PBIS Leadership team; the investigator was able to see

77
exactly where the PBIS leadership teams were within the TCN, make inferences about
the team’s connectedness to other teams, and position of influence and power within the
network, and the leadership team’s capacity to diffuse PBIS practices.
Density
Density is a network property that looks at cohesion of a network. Density is the
proportion of how many actual ties exist in a network to the potential ties that could exist
in the network. The higher the density (i.e. closer to 1), the more cohesive and connected
the network. Ideally, the density would be moderate, to allow for efficient flow of
information (Wasserman & Faust, 1974; Granovetter, 1973). For the implementation of
PBIS, density influences a network’s capacity to efficiently diffuse its practices from
team to team. The cohesion of the network reveals capacity for staff members to access
information across teams and communicate with many colleagues.
Average Path Length
As another measure of network structure in relation to research question one is
average path length. Average path length is a means for exploring the quick reachability
of a network. Path length is the distance between two actors, or how many steps an actor
has to take to get to another actor. The average path length, the mean path length between
all actors, was calculated to indicate, overall, how many steps it takes to get from one
team to another, on average, in the TCN. Average path length thus reflects how fast
information could travel from one node (team) to the other. Theoretically, the more steps
it takes for information to travel from one to another, the less likely it is for innovations
to diffuse quickly or at all. Therefore, information travels faster in networks with shorter
distances, and information is diffused efficiently and farther.

78
Centralization
Network centralization, an additional property of network structure intended to
answer question one, was computed to determine the extent a network is dominated by a
single actor or distributed across several actors (Borgatti, Everett, & Johnson, 2013). The
higher the centralization (i.e. closer to 1), the more the network is dependent upon on one
actor (team). If centralization is too high, all actors rely too heavily on one actor,
constraining diffusion because of lack of ties between actors and consequently, lags in
communication.
Centrality
To answer research question two, the PBIS leadership teams’ actor-level analyses
were performed. Centrality was calculated to determine the position of the PBIS
leadership team within the TCN. Centrality is a measure of the structural importance of a
particular actor to a network (Borgatti, Everett, & Johnson, 2013). Higher centrality
scores tend to indicate those actors who are more visible, and active and known
throughout the network. Higher centrality suggests more opportunities to influence,
access, and diffuse information. Several measures of centrality were calculated to
describe the PBIS leadership team’s position within the TCN of each school.
Degree centrality
Degree centrality is the number of immediate contacts an actor has within a
network. Degree centrality was computed to determine each PBIS leadership team’s level
of involvement or activity in the network. An actor (e.g. PBIS leadership team) with high
degree centrality is one that has many connections and can be considered to be a major
channel for diffusion and communication (i.e. works/speaks with many others and

79
accesses and spreads information quickly). Since a connection is an individual person or
persons, it also is an indicator of how many members are on a team, as a connection
would also serve as a member on that team, demonstrating the size of the team.
Betweenness centrality
Betweenness centrality is a measure that takes into account how often an actor is
situated in the communication network between two other actors. It calculates how many
times an actor sits on the shortest path (i.e. geodesic) linking two other actors together.
Betweenness centrality was calculated to show how much potential control the PBIS
leadership team has over the flow of information and influence over whether to withhold
or transmit information.
Eigenvector centrality
Eigenvector centrality is the sum of an actor’s connections to other actors,
weighted by the sum of the degree centralities of the adjacent actors to whom it is
connected. This measure takes into account the centrality of actors immediately adjacent
to the focal actor. In other words, an actor with high eigenvector centrality is connected
to actors that are themselves well connected. Eigenvector centrality was computed to
determine the PBIS leadership team’s access to and potential influence over information
across the network.
Closeness centrality
Closeness centrality is a measure of an actor’s independence within the network
and potential for mobilizing a network. It is determined by the distance between actors;
an actor who has high closeness centrality has the shortest distance to other actors. It was
computed to show how quickly the PBIS leadership team was able to reach others and

80
others to reach the PBIS leadership team without relying on others, thus demonstrating
access to the network and influence over diffusion.
Correlational Analyses
Simple correlations were conducted to statistically identify which whole-network
and actor-level network properties support or constrain diffusion of innovation.
Correlational analyses were conducted to determine the relationship between the structure
of TCNs and PBIS implementation (RQ1), to determine the relationship of the properties
(RQ2), and to determine the relationship of PBIS leadership team quality of inner process
for collaboration and PBIS implementation (RQ3). Specifically, Pearson product-
moment coefficient of correlation, commonly expressed as Pearson r, were computed. To
answer research question one, scores from the SAS were correlated with network
measures of nodes, edges, density, average path length, and centralization of the TCN.
For research question two, two correlations were computed: TCAS and degree,
betweenness, eigenvector, and closeness centralities of the PBIS leadership team. For
research question three, TCAS and SAS scores were correlated. TCAS data have been
previously correlated with other measures to “determine what patterns of team process
yield the greatest outcomes” (Woodland & Hutton, 2012; Zito, 2011), as have network
properties to describe social structures and systems and predict diffusion (Papachristos,
2010). Correlations closer to 1.0 or -1.0 (e.g., .97) indicate a very strong relationship,
while those closer to zero (e.g., - 0.02) indicate a very weak relationship, hence reflecting
the direction of the relationship between two variables (either positive or negative) and
the magnitude (the relative strength) of the relationship between those variables
(Boslaugh & Watters; Coladarci, et al., 2004). Correlations do not imply causation;

81
therefore these analyses simply revealed the relationship between measures of TCN
structural properties and positions, PBIS leadership team internal team process, and PBIS
implementation. Together these data enables us to describe and predict the factors that
may support or constrain diffusion of innovation.

82
CHAPTER 4
RESULTS
Introduction
The purpose of this study was to investigate the capacity of the structure and
properties of team communication networks, the structural positions and network
properties of the PBIS leadership team, and the quality of PBIS leadership team process
for collaboration to support diffusion of PBIS practices, routines, and systems. The study
took place in eight elementary schools within a large urban school district located in
Massachusetts. Research questions aimed to determine the extent to which the structures
and properties of the TCN and the position of the PBIS leadership team within the TCN
support or constrain the diffusion of PBIS implementation, and the relationship of PBIS
leadership teams’ quality of process and level of PBIS implementation. A moderate
relationship was present between the number of nodes, edges, and density of the Team
Communication Network (TCN) and implementation of PBIS, indicating a relationship
between the connectedness of the network and the level of PBIS implementation.
Moderate correlations were reported in the relationship of the degree centrality,
betweenness centrality, and eigenvector centrality of the PBIS leadership team and PBIS
implementation. In other words, PBIS leadership teams with central locations in the TCN
were associated with higher levels of PBIS implementation. Strong and statistically
significant correlations were found between the overall quality of process for
collaboration of PBIS leadership teams and implementation of PBIS, suggesting the
internal process of the PBIS leadership team supports diffusion of PBIS.

83
Findings for research question one include: 1) visual analysis of TCN structure, 2)
network properties of the TCN, and 3) correlational analyses of SAS data and network
properties. Findings for research question two include: 1) visual analysis of the position
of the PBIS leadership team within the TCN, 2) network properties of the PBIS
leadership team, and 3) correlational analyses between network properties and SAS data.
Findings for research question three include: 1) PBIS leadership team’s TCAS results,
and 2) correlational analyses of TCAS (subscales and overall) and SAS data. Implications
of the findings for practice, policy, and research will be discussed in Chapter Five.
Research Question 1: To what extent are the network structure and properties of
school team communication networks related to the level of PBIS implementation?
Network Analyses
A series of network analyses were conducted to determine the overall structure
and properties of the communication networks of the eight schools. Network analyses
were performed on the TCN to observe cohesion of the networks and to make
preliminary conclusions regarding capacity for diffusion of innovations across each
network based on patterns of structure across highly-implemented schools versus lower-
implemented schools.
Visual Analyses
Figures 1 to 8 provide visual representations of the structure of the TCN of each
school. In each of the sociograms, each node represents a team. The edges (i.e. lines)
between nodes indicate ties between teams. That is, when an edge is present between
teams, it indicates that one or more of the same people are on both teams. For example, if
a line is present between the PBIS and First Grade teams, at least one person on the PBIS

84
team is also on the First Grade Team. In addition, the length of lines and therefore,
placement of the nodes within the sociogram indicate likelihood or frequency of
connections. Nodes placed in close proximity to one another with shorter lines
connecting them represent teams that have many of the same members and therefore,
have stronger overlap in membership compared to those nodes farther away. Neither
node size, color, and shape, nor the thickness of line have significance or meaning.
School 1
Figure 1. School 1 Team Communication Network Sociogram
Examination of the TCN structure of School 1 reveals that the network was
controlled by three major stars: the Student Teacher Assistance Team (STAT),
Instructional Leadership (ILT)/Key, and PBIS Leadership Teams. The School Centered
Decision Making (SCDM), Fourth Grade, Crisis, and PBIS Leadership teams served as
bridges between the main network and teams on the periphery. The proximity of the
Kindergarten, Fifth Grade, and Third Grade team nodes demonstrate frequent overlap in
PBIS
SCDMCrisis
STAT
ILT.Keys
Kindergarten
First.GradeSecond.Grade
Third.Grade
Fourth.Grade
Fifth.Grade
SPED
ESOLELA.Task.Force
Home.Visit.Project

85
membership. The length of lines connecting grade level teams to other teams placed them
at the periphery of the network and thus farther away from other teams, as well as the
ELA, Special Education (SPED), and Crisis Teams. Without any edges connecting it to
the network, the English for Speakers of Other Languages (ESOL) team was the isolate.
School 2
Figure 2. School 2 Team Communication Network Sociogram
A visual analysis of the School 2 socio-gram reveals that there are many central
actors in School 2’s TCN. There are many connections and shared membership between
eight teams, namely the PBIS Leadership Team, Special Education, Crisis, School
Operating Team (SOT), Academic Coaches, STAT, ILT, and SCDM teams, indicating
many central actors, based on proximity of those nodes and the length of the edge
PBIS
ILT
SCDM
SOT
Literacy
STAT
Sunshine
Engagement
ELL
Special.Education
Kindergarten
First.Grade
Second.Grade
Third.Grade
Fourth.Grade
Fifth.GradeAcademic.Coaches
Crisis
Intervention

86
connecting them. Said teams also created a clique. Outside of the clique of the main
network, examination revealed a generally disconnected network, and sparse overlaps in
membership between grade level teams and the ELL and Intervention teams. The Special
Education, Engagement, ILT, and SCDM teams serve as bridges between the Second
Grade, Fifth Grade, Literacy, and English Language Learners (ELL) teams, while the
Kindergarten and First Grade teams are isolates, meaning they have no connections to
any other team within the network.
School 3
Figure 3. School 3 Team Communication Network Sociogram
The TCN of School 3 appears moderately connected without any major hub or
clear star. However, the PBIS leadership team, STAT, Third Grade, and SCDM teams are
centrally located and serve as a clique due to many connections between those teams,
PBIS
SCDM
Sunshine
Department.Chairs
ILT
KEYS
Communication
PTO
Crisis
STAT
Kindergarten
First.Grade
Second.Grade
Third.Grade
Fourth.Grade
Fifth.Grade
Home.Visit
Special.Ed

87
relative to other teams. The SCDM, Communication, and Crisis Teams serve as bridges,
and the ILT is a bottleneck because many teams have access to it, but it does not have
any lines going out of it to connect it to other parts of the network. Grade level teams
tend to be on the periphery of the network, as well as the Department Chairs, Special
Education, and Home Visit teams. No isolates are present, meaning every team had
access to at least one other team within the network.
School 4
Figure 4. School 4 Team Communication Network Sociogram
Examination of the TCN indicates a very connected or dense network in which
most teams are closely connected. The SCDM, Parent Teacher Organization (PTO),
Kindergarten, and Second Grade teams appear to be in control of the network because
PBIS.Tier.I
PBIS.Tier.II
SCDM
OLT
PTO
ILTKindergarten
First.Grade
Second.Grade
Third.Grade
Fourth.Grade
Fifth.Grade
Preschool
Encore
Field.Day
SEBS
SPED

88
they are at the center of the network with many edges going in and out, and therefore
serve as the stars. The Fourth Grade, First Grade, OLT, ILT, and PBIS Tier I and II
leadership teams are bridges they connect the Encore, SPED, and Field Day teams to the
rest of the teams. The SEBS and Preschool Teams, based on the placement of their nodes
and length of edges, are not well connected to the network. The SPED, Encore, and Field
Day teams are bottlenecks within the TCN, because they are on the periphery of the
network and only have lines going into them from one direction. All teams have
connections to at least one other team, indicating no isolates within the network.
School 5
Figure 5. School 5 Team Communication Network Sociogram
. The TCN of School 5 is a sparse network, with fewer nodes (n=6) and long
edges connecting them. The ILT and OLT serve as the stars of the network, as they have
direct connections to all but one team. The ILT, OLT, and PBIS leadership teams have
frequent overlap in members, based on their node placements in relation to one another.
PBIS
ILT
OLT
Home.Visit.Program
SCDM
Learning.Center

89
The PBIS leadership team is the bridge to the Learning Center team (the only classroom-
teacher based team), and allows it access to the main network. The edge connecting the
SCDM to the main network is long, indicating fewer frequent overlaps in memberships.
No isolates are present in this network.
School 6
Figure 6. School 6 Team Communication Network Sociogram
Visual analysis of the TCN of School 6 suggests a dense network with frequent
ties between teams. The network appears to be controlled by grade level, the PBIS
leadership, and Special Education teams. The SCDM, PBIS leadership, ILT, and Home
Visit teams serve as bridges. The Fifth Grade and Social Emotional Behavioral Support
(SEBS) teams are bottlenecks. The counselors, PTO, and ESOL are also bottlenecks, and
PBIS
ILT
SCDM
PTO
Fifth.Grade.PLC
Fourth.Grade.PLCThird.Grade.PLCSecond.Grade.PLC
First.Grade.PLCKindergarten.PLC
Pre.School.PLCHome.Visit
Special.Ed
SEBS
Counselors
ESOL

90
are placed on the far periphery of the network. No teams are isolated from the rest of the
TCN.
School 7
Figure 7. School 7 Team Communication Network Sociogram
One main network is present in the TCN of School 7 with 3 isolate teams (Special
Education, Technology, Preschool). The main network is dense and connected due to
many lines between nodes. The PBIS leadership, Crisis, ILT, First Grade, and Fifth
Grade teams are centralized and serve as stars. The SCDM, STAT, Literacy, Book Fair,
Department Chairs, Kindergarten, Sunshine, and PTO teams are bottlenecks at the
periphery of the network. The position of the Third Grade team indicates it serves as a
bridge from the main network to the Read to Achieve Team. The Second Grade, Math,
and Field Day teams are also bridges within the main network. The length of lines within
PBISCrisis
ILT
SCDM
STAT
Kindergarten
First.Grade
Second.Grade
Third.GradeFourth.Grade
Fifth.Grade
Department.Chairs
Sunshine.Committee
Literacy.Team
Math.TeamPTO
Field.Day.Committee
Technology
Book.Fair
Special.Education
Read.to.Achieve
Preschool

91
the network appears to be of similar length and the nodes are in close to equal proximity,
indicating equal and frequent overlap in membership amongst teams.
School 8
Figure 8. School 8 Team Communication Network Sociogram
Visual analysis of School 8’s TCN reveals a loosely dense network with fewer
connections between teams. There are two main stars: the Grade 5 and Instructional
Leadership Teams. Additional grade level teams are on the periphery of the network,
serve as bottlenecks, and are a clique. The Crisis, PBIS leadership, SCDM, and
Counselors serve as a clique. However, the Crisis, PBIS leadership, and SCDM also
serve as bridges from one clique to the other. The Special Education/IEP Team is also a
bottleneck and appears farther away from teams, suggesting lesser overlaps in
PBIS
Instructional.Leadership
K.Team
Grade.1Grade.2Grade.3
Grade.4
Grade.5
Special.Ed.IEP
SCDM
Humanics
Crisis
ESOL
Counselors

92
membership. Two isolates, the ESOL and “Humanics” Teams, are not connected to the
main network, and are therefore, isolates.
Descriptive Network Properties
Table 5 includes a descriptive count of the number of nodes (actors in the
network) and edges (connections between actors) of each school. The actors are the teams
in the TCN. In the TCN, a range of 15 to 22 nodes and 42 to 108 edges were present
across schools.
Table 5
Team Communication Network Properties Ranked by Implementation
School (Percent
Implemented)
Nodes Edges Density Average Path
Length
Centralization
School 5 (89) 6 10 0.666 1.524 0.433 School 8 (77) 14 42 0.462 1.409 0.359 School 2 (71) 19 59 0.333 1.706 0.07 School 6 (69) 16 61 0.508 1.517 0.409 School 3 (59) 18 51 0.346 1.725 0.404 School 7 (58) 22 108 0.468 1.398 0.376 School 4 (45) 17 71 0.544 1.515 0.304 School 1 (42) 15 46 0.438 1.495 0.483
Density
Table 5 provides a list of network measurements of density for each school’s
TCN. Density represents the proportion of total possible ties with total actual ties present
within the network. Across the eight schools, density ranged from 0.33 to .66 in the TCN,
indicating overall moderate connectedness across teams within each school.
Average Path Length
Table 5 specifies the centralization of schools’ TCN. Centralization is a measure
of how dominated a network is by one actor, thus indicating the extent to which one actor

93
controls power or influence over a network. It provides a proportion of actors that have
connections to one centralized actor. For this property, a range of .070 to .483 is present
in the TCN across schools, suggesting upwards of 48 percent of teams have similar
membership (in School 1).
Centralization
Table 5 specifies the centralization of schools’ TCN. Centralization is a measure
of how dominated a network is by one actor, thus indicating the extent to which one actor
controls power or influence over a network. It provides a proportion of actors that have
connections to one centralized actor. For this property, a range of .070 to .483 is present
in the TCN across schools, suggesting upwards of 48 percent of teams have similar
membership (in School 1).
Correlational Analyses
The TCN analyses described above describe the network structures of density,
average path length, and network centralization. Correlational analyses were performed
to answer research question one and its sub-question: What structure and properties
support or constrain diffusion of PBIS practices? And to what extent are the network
properties related to the level of PBIS implementation?
Table 6 summarizes the correlations between network properties of the TCN and
PBIS implementation. It was predicted that a moderate relationship would be present
between the properties of the TCN and PBIS implementation. More specifically, there
would be a relationship between general network properties (number of vertices and
number of edges) as well as properties indicative of cohesion (density, average path
length, and centralization) and percentage of implementation, as measured by the SAS.

94
A moderately strong, negative relationship was found between number of nodes
(r=-.569) and edges (r=-.529) and level of implementation, suggesting that the presence
of fewer teams and lower volume of connections within the TCN is associated with
stronger implementation of PBIS. A moderate positive relationship between the density
of the network and SAS scores was observed (r=. 359), indicating a moderately
connected network supports diffusion of innovation. These findings confirms theoretical
arguments in favor of moderate density and capacity for information flow (Granovetter,
1973). No relationship was present in terms of the average path length between teams of
the network with measures of PBIS implementation, provided by the SAS (r=-.083),
indicating the accessibility of teams across the network does not seem to have importance
in considering capacity for diffusion of innovation. A weak negative relationship was
found in the centralization of a network and SAS scores (r=. 138), suggesting the extent
to which a network is controlled by one or a few actors is of no significance in diffusion
of innovation.
Overall, it appears that number of teams and connections, and density within the
TCN are associated with stronger PBIS implementation. Schools with fewer teams
connected through weak ties support diffusion of innovation. School 5, which reported
strongest implementation of PBIS, was a smaller school, relative to other schools
included in this sample, with only 29 teachers and staff members.

95
Table 6
Pearson Correlation Matrix Among PBIS Implementation (SAS) and TCN Properties
TCN
Nodes TCN Edges
TCN Average Degree
TCN Density
TCN Path
Length
TCN Centralization
Implementation Pearson Correlation -.569 -.529 -.138 .359 -.083 -.138
Sig. (2-tailed) .141 .177 .744 .382 .845 .745
(Note: No statistically significant findings reported)
Research Question 2: To what extent do the network structural position and
properties of the PBIS leadership team relate to the level of PBIS implementation?
Network Analyses
In addition to understanding overall network capacity to diffuse the innovation of
PBIS, it was also important to examine the role of the PBIS Leadership Team, which is
formed and charged with enabling the development and implementation of PBIS school-
wide. A series of network analyses were conducted to determine the position and
properties of the PBIS leadership teams within the TCN of the eight schools. Network
analyses of centrality were performed to indicate position of the teams and inform
conclusions regarding capacity for diffusion of innovations across each network, based
on where the PBIS leadership team is positioned within the network.
Visual Analysis
Additional analyses of Figures 1 to 8 were conducted. However, in this analysis,
only the PBIS leadership team’s position was examined. Common themes and patterns
across schools and their resulting implications will be discussed in Chapter Five.

96
School 1
The PBIS leadership team is a central actor in this network, thus making it a star.
It has direct ties to thirteen out of fifteen teams. Its placement near other nodes indicates
its members are also members of the ITL/Keys, STAT, and Fourth Grade Teams.
School 2
Examination of the PBIS leadership team within the TCN of School 2 indicates
that it is a star of the network, due to its central position. It has frequent overlap in
membership with the Crisis, SOT, Special Education, and Engagement Teams. It has
direct ties to one grade level team.
School 3
A visual analysis of the PBIS leadership team within the TCN of School 3
demonstrates its central position within the network; thus making it a star. It is within a
dense clique of teams. Its close proximity to the Third Grade, STAT, and SCDM teams
indicate many of its members are also on those teams. It has direct connections to the
First, Third, and Fifth grade teams. The longer lines connecting it to the ILT, Special Ed,
and Kindergarten Teams suggest minimal overlap in membership with those teams.
School 4
Two PBIS leadership teams are present within the TCN of School 4. Both PBIS
leadership teams are on the periphery of the central clique of the network. They also
serve as bridges to the teams on the outside of the network. PBIS Tier II leadership has
three direct ties to grade level teams. PBIS Tier I leadership has direct ties to the Third
Grade team, PTO, ILT, and SPED teams.
School 5

97
The PBIS leadership team of School 5 serves a bridge to the Learning Center
Team (the only classroom-based team of the network). Although its placement is
seemingly on the periphery, it appears to be one of the central actors due to its direct ties
to all teams.
School 6
Examination of the PBIS leadership team’s position in the TCN of School 6
demonstrates its central position within the network. It is a star of the network due to its
many ties to other teams within the network and close proximity to other nodes and
length of lines connecting it to other teams. The long lines connecting it to the ESOL and
Counselors’ Teams suggest minimal overlap in membership with these teams.
School 7
The PBIS leadership team within the TCN of School 7 is positioned on the
periphery of the central clique of teams. It does not appear to be one of the main stars, but
is connected to them. Its close placement to the Crisis Team indicates frequent overlaps
in membership between the teams. It has direct ties to two grade level teams.
School 8
Visual analysis of the PBIS leadership team’s position with the TCN of School 8
indicates its direct ties to the stars of the network (Grades 3 and 5 and Instructional
Leadership Teams). It is tied closely to the Crisis Team, indicating frequent overlap. It
has direct ties to the Grade 3, 4, and 5 teams. It serves as a bridge between the Counselors
and Grade 4 teams.

98
Table 7
PBIS Leadership Team Centrality Ranked by Implementation Percentage
School (Percent
Implemented)
Degree Centrality
Betweenness Centrality
Eigenvector Centrality
Closeness Centrality
School 5 (89) 6 4.33 0.496 0.857 School 8 (77) 8 2.791 0.276 0.565 School 2 (71) 10 11.264 0.408 0.621 School 6 (69) 14 22.217 0.344 0.882 School 3 (59) 12 30.305 0.371 0.773 School 7 (58) 15 3.772 0.27 0.618 School 4 (45) 13 28 0.291 0.842 School 1 (42) 13 17.033 0.408 0.824
Degree Centrality
A calculation of the degree centralities of each PBIS leadership team is included
in Table 7. Degree centrality is a count of how many ties a team has to another team.
PBIS leadership teams had a range of 6 connections to 15 connections within the overall
TCN of each school.
Betweenness Centrality
The betweenness centralities of the PBIS leadership teams within the TCN are
included in Table 7. A measure of betweenness centrality indicates how many times one
actor (the PBIS Leadership Team) is situated between another actor in the transfer of
information or in communication, and thus the capacity of the node to act as a bridge of
information between other nodes. The PBIS leadership teams’ betweenness centrality
ranged from 2.79 to 30.31, meaning that the PBIS leadership team connects as many as
thirty pairs of nodes within the TCN.

99
Eigenvector Centrality
Table 7 provides the eigenvector centrality of each PBIS leadership team within
the TCN. Eigenvector centrality is a measure of an actor’s position of influence based on
its adjacent connections’ positions of influence. Across schools, the PBIS leadership
teams’ eigenvector centralities ranged from .27 to .49, indicating that upwards as 49% of
ties across the networks include both the PBIS Leadership Team and its direct
connections.
Closeness Centrality
Table 8 provides the closeness centralities of the PBIS leadership teams across the
eight schools. Closeness centrality is a measure of the extent to which an actor holds all
the ties in the network. Across schools, the closeness centrality of the PBIS leadership
team ranged from .565 to .882, indicating 56% to 88% of actors were directly tied to the
PBIS leadership team across schools.
Correlational Analyses
Correlational analyses were performed to examine how the structure and network
proporties of the PBIS leadership team supported or constrained PBIS diffusion.
Structural position and properties were measured by network analyses of various
centralities of the PBIS leadership team within the TCN. It was hypothesized that a
moderate to strong relationship would be present between PBIS leadership team
centralities within the TCN and PBIS implementation.
Correlational analyses of the PBIS leadership team’s properties and PBIS
implementation are presented in Table 4-15. A strong, negative and statistically
significant relationship (-.784, p<.05) was found between the degree centrality of the

100
PBIS leadership team and SAS scores, indicating schools with PBIS leadership teams
with fewer connections to other teams may report stronger implementation of PBIS.
Degree centrality is dependent upon the number of members in a team, as it is a count of
connections to the PBIS leadership team, which is the form of an individual person, as
the entity capable of making that tie. Therefore, the observed negative correlation may
also indicate that fewer members on a PBIS leadership team is associated with stronger
PBIS implementation because members are the ones capable of making the connections,
so with fewer members, as many ties to other teams are less likely to occur. A moderate,
negative correlation (r=-.579) was found for the betweenness centrality of PBIS
leadership teams and SAS scores, hence the less frequent the PBIS leadership team is
between two teams, the stronger the PBIS implementation. A moderate, positive
relationship (r=. 376) was observed for the eigenvector centrality and SAS scores,
suggesting that a PBIS leadership team positioned adjacent to teams also with
advantageous positions within the TCN is associated with stronger PBIS implementation,
indicating the closer position of the PBIS leadership team to actors with advantageous
positions in the network, the higher level of PBIS implementation is reported. A weak
negative relationship (r=-.138) between the closeness centrality of the PBIS leadership
team and SAS scores was observed, suggesting the access the PBIS leadership teams
through minimal steps is of little significance to PBIS implementation.
Overall, data suggest that PBIS leadership teams of a moderate size and thus
moderate capability to form ties to other teams (degree centrality), located in positions
that do not fall between pairs of teams team to another (betweenness centrality), and with

101
direct connections to teams with influential or advantageous positions support diffusion
of PBIS practices (eigenvector centrality).
Table 8
Pearson Correlation Matrix Among PBIS Leadership Team Network Properties and PBIS
Implementation (SAS)
PBIS Degree
Centrality
PBIS Betweenness
Centrality
PBIS Eigenvector Centrality
PBIS Closeness Centrality
Implementation Pearson Correlation -.784(*) -.579 .376 -.138
Sig. (2-tailed) .021 .132 .358 .992 * p<0.05 level (2-tailed)
Research Question 3: To what extent does the quality of the internal process for
collaboration of the PBIS leadership team relate to the level of PBIS
implementation?
Teacher Collaboration Assessment Survey (TCAS) Results
In addition to considering the network structures and properties of the TCN and
PBIS Leadership team, it was also hypothesized that the quality of the PBIS leadership
team process, i.e. how well they engage in a cycle of inquiry, would also influence TCN
capacity to diffuse the innovation of PBIS. PBIS leadership team members self-assessed
quality of their team process for collaboration, as indicated by the extent to which they
followed a cycle of inquiry via the Teacher Collaboration Assessment Survey (TCAS).
Seven out of eight PBIS leadership teams completed the TCAS; School 4 did not return
any completed surveys (interestingly they had one of the lowest levels of PBIS
implementation). Individual responses to the TCAS were then collected, and the mean
score of each scale was reported. Sums of each subscale were then computed to provide

102
an overall team process score. School 8’s PBIS leadership team had a nearly perfect
process, while the team at School 1 (the school with the lowest level of implementation)
reported the lowest ratings of its process, based on total scores. TCAS results are as
follows in Table 9.
Table 9
PBIS Leadership Team TCAS Results
School (Percent
Implemented)
Subscale Total Score
(/52)
Dialogue (/14)
Decision Making
(/14)
Action (/12)
Evaluation (/12)
School 5 (89) 12 12.625 10.25 9.5 45.75 School 8 (77) 14 14 12.5 11.5 51 School 2 (71) 12 11.5 9.75 9 42.25 School 6 (69) 11.4 11.5 10 7 39.9 School 3 (59) 12.5 11.83 8.33 5.83 38.5 School 7 (58) 11.7 10.8 8.5 6.7 37.7 School 1 (42) 7.75 9.25 3.75 3.75 24.5
Correlational Analyses
Correlations were conducted between SAS scores and each of the four subscales
(Dialogue, Decision-making, Action, Evaluation) of the TCAS and summarized in Table
10. Total scores of the TCAS were also correlated with SAS scores. As predicted, strong
relationships were observed in all analyses. A strong positive relationship between
Dialogue subscale scores and SAS scores was noted (.708), suggesting PBIS leadership
teams who display quality patterns of discussion and communication within the team are
associated with strong implementation of PBIS. Within the Decision-Making subscale of
the TCAS, strong positive and statistically significant correlations (0.824, p<.05) were
observed, indicating PBIS leadership teams who make decisions regularly are associated
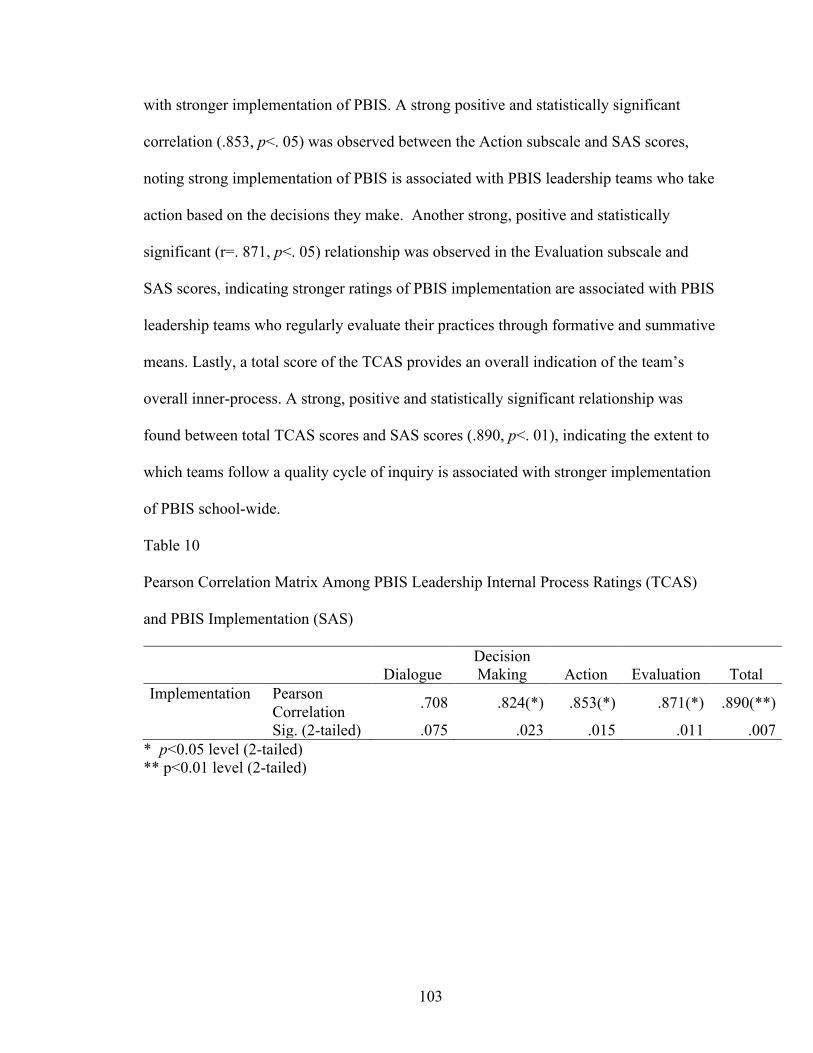
103
with stronger implementation of PBIS. A strong positive and statistically significant
correlation (.853, p<. 05) was observed between the Action subscale and SAS scores,
noting strong implementation of PBIS is associated with PBIS leadership teams who take
action based on the decisions they make. Another strong, positive and statistically
significant (r=. 871, p<. 05) relationship was observed in the Evaluation subscale and
SAS scores, indicating stronger ratings of PBIS implementation are associated with PBIS
leadership teams who regularly evaluate their practices through formative and summative
means. Lastly, a total score of the TCAS provides an overall indication of the team’s
overall inner-process. A strong, positive and statistically significant relationship was
found between total TCAS scores and SAS scores (.890, p<. 01), indicating the extent to
which teams follow a quality cycle of inquiry is associated with stronger implementation
of PBIS school-wide.
Table 10
Pearson Correlation Matrix Among PBIS Leadership Internal Process Ratings (TCAS)
and PBIS Implementation (SAS)
Dialogue Decision Making Action Evaluation Total
Implementation Pearson Correlation .708 .824(*) .853(*) .871(*) .890(**)
Sig. (2-tailed) .075 .023 .015 .011 .007 * p<0.05 level (2-tailed) ** p<0.01 level (2-tailed)

104
CHAPTER 5
DISCUSSION
The primary purpose of this study was to investigate the network structures and
properties that support the diffusion of innovation, specifically to determine the
relationship of team communication network structures and properties and
implementation of PBIS. The study also assessed the extent to which the network
structural position and properties of the PBIS leadership team were related to PBIS
implementation, and which ones supported diffusion of innovation. Lastly, the study
attempted to determine how the quality of the process for collaboration of the PBIS
leadership team supported the diffusion of innovation, by examining the relationship of
team process for collaboration and PBIS implementation. The study employed SNA as its
methodological and analytic approach to uncover the structural dimensions of team
communication networks and quality of process for collaboration within a sub-network.
Several network and correlational analyses were performed to answer the study’s
research questions and fulfill its purposes, as outlined above.
The conceptual model behind this investigation was founded on principles of
SNA, diffusion of innovation, and social capital theories, which promote the importance
of social interaction and relationship building on knowledge creation and transfer. The
study also followed the theory of action that the structure and properties of
communication networks by way of quality teacher teaming support or constrain access
to information and knowledge, which in turn, facilitate or impede the diffusion of
innovation and system-wide implementation.

105
Summary of Findings
Research Question 1: To what extent are the network structure and properties of
school team communication networks related to the level of PBIS implementation?
Diffusion of innovation is dependent upon a network structured to support
interaction, flow of information, and communication (Rogers, 1995). The structure of the
Team Communication Networks included in this study varied by school. However, a
sense of what is necessary for diffusion became apparent upon visual, network, and
correlational analyses of school personnel reports of stronger implementation outcomes
versus weaker implementation. Level or degree of implementation indicates the extent to
which diffusion of innovation has occurred; i.e. essential practices, procedures, and
systems are observable in practice and utilized by members of the school community.
It was hypothesized that moderately dense, far-reaching networks support
diffusion of innovation, and disconnected, highly centralized networks in which teams
are isolated or frequently inaccessible to one another constrain diffusion of PBIS. In this
study, diffusion of PBIS was found to be supported by team communication networks
with moderate densities, and impeded by highly (perhaps overly) dense networks with
too many teams and connections. For instance, school 5, which displayed highest level of
PBIS implementation had a smaller amount of teams and connections between teams,
compared to School 4, the lowest PBIS-implemented school, which displayed over-
connected teams with an overabundance of teams and ties between teams.
As hypothesized, a moderate relationship was present between the structure and
properties of the TCN and implementation of PBIS. Visual analysis of TCN sociograms
and interpretation of TCN network properties indicated several patterns and relationships

106
to be present. Visual analyses revealed that schools with stronger PBIS implementation
(70% or higher) had fewer numbers of teams, moderate connectivity between teams, and
leadership teams appeared to be the stars of the networks (actors with several ties to other
teams and who held a prominent, central position in the network). Schools with weaker
PBIS implementation (below 70%) tended to have highly dense networks (i.e. Schools 3,
4, and 7), cliques on the periphery of the network, and leadership teams not necessarily in
centralized positions within the network. Network property calculations confirmed that
highly implemented schools have fewer nodes, edges, and average degree (i.e. teams and
connections between teams, and average connections between teams) and moderate
reports of density (.3 to .4). Schools with weaker PBIS implementation tended to report
more nodes (17 to 22), edges (71-108), and average degree (7.62 to 9.81), and higher
density scores (.5 to .6). Based on an observation of network sociograms and properties,
there appeared to be distinct differences between strongly implemented and weakly
implemented schools in terms of number of teams within the network and level of
connectedness between those teams.
Correlational analyses revealed a moderate negative correlation between the
number of nodes and edges within a network and PBIS implementation, which suggests
that fewer teams within a school’s team communication network is associated with higher
implementation of PBIS. Because the number of edges is dependent upon the number of
nodes (as a connection cannot exist without two actors present), the correlation also
suggests that fewer connections within a network are associated with stronger PBIS
implementation. A moderate positive relationship was observed in correlations of TCN
density and PBIS implementation, suggesting that a moderate relationship exists between

107
the level of connectivity and implementation. However, because weaker ties are theorized
to be advantageous for information flow (Granovetter, 1973), a moderate correlation is
actually quite ideal, as the moderateness of the network property is accounted for within
the correlation. Weaker ties indicate that there are fewer connections between teams, as
opposed to frequent, direct ties from one team to another. In other words, a perfect
positive 1.0 correlation would indicate completely dense networks and full
implementation. However, because one would want a report of moderate density to
support efficient and effective diffusion of innovation, a moderate correlation including
density would be ideal.
It was predicted that a moderately connected and far-reaching network would
support diffusion of innovation. Findings suggest that a network with relatively few
teams and moderate level of connectedness supports diffusion of innovation, and dense
networks constrain diffusion of innovation, supporting the hypothesis.
Research Question 2: To what extent do the network structural position and
properties of the PBIS leadership team relate to the level of PBIS implementation?
As expected, a relationship was present between both the position and properties
of the PBIS leadership team and PBIS implementation. Position refers to the placement
of the team within the TCN and properties as measures of their central influence or
accessibility in the network. Visual analyses indicated one major pattern across schools.
PBIS leadership teams in schools with higher PBIS implementation did not have direct
ties to each team, but did to other stars of the network, as reflected by their measures of
eigenvector centrality, which tended to be other leadership teams within the school. PBIS

108
leadership teams of weakly implemented schools had connections to nearly every other
team within the network.
Social network analyses of centrality indicated PBIS leadership teams had lower
degree centralities in schools with strong implementation, compared to those with lower
reports of PBIS implementation. They also had lower betweenness centralities and
stronger eigenvector centralities.
Correlational analyses revealed a strong and statistically significant negative
relationship between degree centrality and PBIS implementation, indicating that the
fewer ties a PBIS leadership team has to other teams, higher ratings of implementation
are also present. Degree centrality can be a proxy of sorts to how many members the
team has. Since a connection from team to team is in the form of one or more individuals,
degree centrality is related to the size of the team itself, suggesting that schools in which
PBIS leadership teams have fewer members report higher implementation of PBIS.
Degree centrality and betweenness centrality were seen to have moderate, negative
relationships with PBIS implementation, suggesting that PBIS leadership teams with
fewer members is a support to diffusion of innovation, while larger teams impede it.
When the PBIS leadership team stands between two teams too frequently, it impedes on
diffusion of innovation, while if it is not, diffusion of innovation is supported.
It was predicted that PBIS leadership teams in highly central and influential
positions within the network support diffusion of PBIS. The relationship between PBIS
leadership teams’ eigenvector centrality and PBIS implementation was found to be
moderately positive, indicating higher PBIS leadership team eigenvector centrality is
correlated with stronger PBIS implementation. Eigenvector centrality is a measure of

109
both a team’s centrality in the network, but takes into account the centrality of its direct
ties. Theoretically, a team could have relatively low centrality on its own, but be
connected to a team that has higher centrality, producing higher eigenvector centrality.
Correlations present in this study indicate that when a PBIS leadership team has direct
ties to other teams with strong centralities, and thus are in influential positions, PBIS
implementation in that school is also higher. Findings reveal that PBIS leadership teams
with strong eigenvector are associated with their schools reporting higher levels of PBIS
implementation, suggesting a PBIS team in a central position that is close to another
central player supports diffusion of innovation.
Research Question 3: To what extent does the quality of the internal process for
collaboration of the PBIS leadership team relate to the level of PBIS
implementation?
Given that the quality of the process for collaboration within individual teams is
of utmost importance to educational outcomes (McIntosh et al., 2013; Kincaid, Blase, &
Wallce, 2007; Woodland & Hutton, 2012; Gajda & Koliba, 2008), it was predicted that a
positive relationship would be present between the quality of process of the PBIS
leadership team and PBIS implementation. As expected, a statistically significant strong
relationship was present between PBIS leadership team process and PBIS
implementation. A strong positive correlation was present between PBIS leadership
team’s dialogue and PBIS implementation, suggesting that the extent to which the PBIS
leadership team engages in meaningful dialogue is associated with the extent to which
PBIS is implemented within the school. Strong, statistically significant relationships were
also found in decision-making, action, and evaluation correlations with PBIS
110
implementation. Of the four subscales, evaluation had the strongest correlation with
implementation. The relationship between the total score of team process, which provides
a picture of overall quality of process, and PBIS implementation was also found to be
strong and statistically significant at the .01 level. These findings strongly support the
notion that well-functioning teams are associated with positive educational outcomes,
such as implementation of PBIS as reported by previous research, such as McIntosh and
colleagues’ recent study (2013) that found the functioning of the PBIS team was the
strongest predictor of sustained PBIS implementation. The hypothesis that teams that
follow a high quality internal process for collaboration support diffusion of innovation,
while teams that have low quality internal process constrain diffusion of innovation, was
supported.
Conclusions and Implications for Policy and Practice
One aim of this study was to determine the relationship of team communication
network properties and PBIS implementation at the whole network level. It also sought to
uncover a relationship between network properties of the PBIS leadership team and PBIS
implementation, and also the process of the PBIS leadership team and PBIS
implementation. Across all three aims, relationships were present, resulting in four major
conclusions, which have strong implications for educational practice, policy, and
research. Overall, findings of this study indicate certain network structures and properties
to be associated with diffusion of innovation. These findings are congruent with SNA
theoretical and empirical literature that states that network structure is able to facilitate
information exchange, knowledge sharing, and serve as venues of social capital, and that
social arrangements and organizational structures to support collaboration and

111
communication greatly influence behavior. (Leana & Pil, 2006; Nahapiet & Ghoshal,
1995; Zito, 2011; Prell, 2011; Coburn, 2010, Penuel, Sun, Frank, & Gallagher, 2012).
The current findings also support literature suggesting that the performance of schools is
related to the extent to which schools staff work with one another, as high-performing
schools are often characterized by networks of linked teachers, while lower performing
schools are comprised of disconnected cliques and isolates (Kochan & Teddlie, 2005).
Less is More - Fewer Teams, Better Implementation
Results of this investigation suggested that the number of nodes and edges within
a network were negatively associated with PBIS implementation. In this case, the more
teams present within a school, the lower the implementation would be, leading one to the
conclusion that the size of the network and the number of teams within a school may be
related to how well practices are diffused and work is completed. Generally speaking,
schools with many teams may experience poor progress in widespread change and
consequently decreases in student achievement. There are multiple pathways of diffusion
and fewer focused directions for implementation to take place. Transfer of knowledge
may also be inefficient, or certain information may get misinterpreted, due to many
different teams having access and responsibility for spreading it. On the other hand,
these findings suggest that schools with fewer teams are more likely to support the
diffusion of innovation, aimed to promote positive student achievement.
Further, findings suggest that many teams within a school may inhibit the
diffusion of innovation. Because teams are designed to be focused on achieving the
organizational goals of the school, teams are likely tasked with leading school-wide
initiatives. In this case then, schools with fewer initiatives will likely have stronger

112
implementation/diffusion of those efforts. Competing initiatives may take away the
attention, effort, and resources necessary for wide-spread implementation to occur.
School leaders and policy makers are then urged to encourage schools to have a focus
and direction to the initiatives they choose to implement, and do so few at a time. With
many teams responsible for many initiatives in place, schools are less efficient and their
teachers and staff will not be able to effectively diffuse their practices as intended or
system-wide.
It is important to recognize that findings are specific to the implementation of
PBIS, so number of teams may be a factor when considering PBIS implementation.
Findings suggest that schools with fewer teams are facilitators of high levels of PBIS
implementation. It is possible that other school-wide initiatives, apart from PBIS, actually
rely on a large number of teams within a school, as they require a more integrated effort
across many different stakeholders within the school community. From a policy
standpoint, findings support PBIS policy makers emphasis on determining the existing
initiatives in place, integrating them with PBIS, or implementing PBIS at a time when
teachers and staff have the time, effort, and attention to do so. PBIS implementation
guides include activities in which PBIS leadership teams are to audit the different teams
within their schools and consider how to eliminate or reduce redundancies (Sugai et al.,
2010). Practitioners are urged to complete these activities, as they are beneficial to the
successful implementation of PBIS. Further, findings of this study support
recommendations from PBIS implementation scholars, which state that for PBIS to be
successful, it should be among the top three initiatives listed in the school or district
improvement plan (Simonsen, Sugai, & Negron, 2008), suggesting that when PBIS is

113
within a small number of initiatives within a school, it is more successful. Again, leaders
who wish to implement PBIS within their schools or districts must follow these
guidelines to ensure that PBIS is, in fact, a top priority and can be implemented well.
Further, moderate density was related to stronger PBIS implementation. As
density is the proportion of how many ties would be present to what is actually present, it
is dependent upon the number of nodes within a network. In other words, a moderately
dense network could reflect fewer teams and consequently fewer ties between teams or
many teams with few connections. In either sense, weak ties between actors within the
network produce moderate density, which avoids overlaps and redundancies in
communication, which leads to more efficient information flow across communication
channels within the network, and then diffusion of the innovation. Conclusions regarding
network density and diffusion of innovation are consistent with Granovetter’s theory of
the “strength of weak ties”, which posits less contact with another is more advantageous
for productivity (1973). Current findings of density also support Woodland, Barry, &
Crotts Roohr (2014)’s conclusion that reconfiguring a network to reduce redundancies
and support efficiency supports diffusion of instructional innovation. In practice, this
implies that all teachers and staff do not necessarily have to be directly connected to one
another, but rather have access to others via their connections. In other words, for
information flow efficiently, it can get passed from one teacher to another by way of a
mutual connection, not a direct tie. Schools with teachers connected to one another with
weak ties are more likely to produce substantive changes in instructional practice,
compared to those with dense, over-connected, redundant networks of teachers and staff.
Reform efforts are also likely to occur with more success when the network is structured

114
in a moderately dense way and produce instructional changes aimed to improve
achievement. Policy makers should aim to encourage educators to consider the capacity
of their networks, and promote systems in which redundancies in communication and
interaction are minimal to ensure best implementation of school-wide practices.
Teams are the building blocks for getting any work done in a school (Barnard,
1950; DuFour & Eaker, 1998; Senge et al., 2000; Gajda & Koliba, 2008), so therefore,
each one would be tasked with specific decisions to make and practices to enact and
evaluate. It is quite plausible that when there are too many teams within a school, there
are too many demands or competing initiatives in place. School staff and school leaders
may feel that they do not have the capacity to focus on each topic, or to devote their time
and effort to all that is going on within the school. As a result, too much information is
being transmitted at once or the depth of information is limited, due to the competition
between demands. The network then constrains diffusion, as there are redundancies and
inefficiencies in the structure. Lack of diffusion restricts implementation, and
demonstrated by only parts of the initiative installed and/or done so with poor quality.
Leaders then should consider what their priorities are for their school and chose carefully
the ones they are most capable of supporting. Schools with few initiatives are likely to
support stronger implementation of those few, compared to moderate implementation of
many. Stronger implementation and focus on activities will also support continued use
and sustainability of the initiative.
Results of this study suggest that school leaders must be thoughtful about what
teams are in place based on the priorities of the school and purposefully design their team
network. Stages of implementation models (Fixen et al., 2005; 2011) suggest that the first

115
step in implementation requires an evaluation of the school’s capacity to support the
initiative, and if it fits into the existing structure. The aims of this stage of
implementation lends itself quite well to determining whether or not the current team
network can accommodate an additional team and related set of priorities. Policy makers
then are encouraged to promote thoughtful and evidence-based decision making
processes for leaders to follow regarding the focus of teams and integration of new
initiatives into existing school systems. Practices may include aligning school initiatives
with school goals and improvement plans to ensure focused attentions and priorities of all
teams, taking an inventory of the current teaming structure and to make all teams are
included and accessible in the central network of teams, creation or expansion of a
leadership team to include new initiatives, and distributed membership across teams
within the school system, just as outlined within the PBIS implementation guidelines and
literature, such as completing an audit or needs assessment to determine if and how
redundancies in priorities may be reduced.
Smaller Teams, Stronger Implementation
Just as school networks with fewer teams are more advantageous for PBIS
implementation, PBIS leadership teams with smaller membership numbers were also
associated with stronger implementation of school-wide practices and systems. Findings
suggested that degree centrality of PBIS leadership teams, i.e. higher numbers of
members, is negatively related to PBIS implementation. School-based PBIS leadership
teams are tasked with providing guidance and training, promoting a vision, making
decisions, and leading the charge for systemic practices and policies (Marzano, Waters,
McNulty, 2005; Horner, 2012). Scholars and policy makers recommend having a

116
representative leadership team to promote investment in the cause, ensure the
perspectives of all stakeholders, and utilize the varied skills of members of the school
community (Broxterman & Whalen, 2013; Horner, 2012). In the current study, findings
from this study suggest that leadership teams of a smaller size are associated with
stronger implementation. There are many possible factors related to how the size may
relate to implementation. Perhaps within an overcrowded team, accountability for action
taking and follow through are diminished. Team members may assume someone else will
take responsibility. Decision-making is more difficult as too many opinions are to be
considered. Teams meetings may be difficult to schedule, as they would be trying to
accommodate multiple people’s schedules, leading to missed meetings and opportunities
to make progress towards implementation. Perhaps the likelihood of team members to
miss meetings is more likely, just by sheer numbers and natural probability, leading to
decreased attendance and access to opportunities for information pertinent for
implementation, collective decision-making, and enactment of essential practices.
Regarding diffusion, high numbers of team members may also inhibit efficiency
and cause redundancies. With too many people taking responsibility for sharing
information, the process is repetitive and time for diffusion is increased. Many members
also may come with many opinions, interpretation of information, and perceptions
towards the cause. The information shared may be inaccurate or misconstrued, inhibiting
diffusion of the intended innovations. Schools with teams with fewer members, instead,
may report better outcomes in implementation due to increased accountability,
attendance, decision-making processes, and focused diffusion practices and information-
sharing.

117
Literature suggests that all staff members within a school should have
membership to at least one team within the school for the school to produce substantive
outcomes in professional learning and student outcomes (Gajda & Koliba, 2008;
Woodland & Hutton, 2012; Woodland & Mazur, in press). However, school leaders and
policy makers must be careful when applying this evidence-based suggestion to practice.
Once again, they must be thoughtful and considerate of the configuration of teams and
capacities of school staff members. Equal representation on a team does not necessarily
entail representation of every subgroup within the school’s system. When thinking from a
SNA perspective, the team may include a representative sample of staff members with
advantageous positions to diffuse information to their colleagues. For example, team may
include a member with direct ties to the principal or identified leader within the school.
The size of the team also lends itself for practitioners to consider dividing existing
groups. For example, a leadership team could be divided into sub-groups with specific
short-term goals. These working groups have a specific purpose and are of a smaller size
and can therefore focus on specific activities for implementation or diffusion of
instructional practice. The overall team may still stay in place, but would be split up into
working groups to ensure efficiency and progress towards long-lasting change. School
staff members must have access to their colleagues to create a culture of collaboration
and communication conducive to diffusion of instructional innovation and support
through teaming. However, creating teams and processes for these teams require much
time and effort to ensure best outcomes.

118
Consider Direct Ties
This study attempted to emphasize the importance and effects of social ties. The
next major conclusion of this study is focused on the direct ties an individual actor has;
that is, who or what that actor is connected to through just one step. Eigenvector
centrality is a type of centrality that takes into account the influence and power (or
potential for influence and power) of oneself, but also of an individual’s direct ties (Prell,
2011; Borgatti, Everett, & Johnson, 2013). Results of this study demonstrated the positive
relationship between the eigenvector centrality of the PBIS leadership team and PBIS
implementation, which leads to the conclusion that the teams to which leadership teams
are connected are very important to supporting productive outcomes in schools. Teams
who are connected to influential or central players within the network are then influential
and central by association. They are in highly advantageous positions to receive and send
information, diffuse innovation, and be a part of the happenings of the network. These
findings support the foundational research of diffusion of innovation in farming, which
identified the direct ties (farmers’ neighbors) to be most influential in transmission of
new ideas and practices; individuals who implemented new practices were closer to the
ones who had earlier access and had adopted them previously (Ryan & Gross, 1943).
Upon visual analysis of sociograms, it is clear that the PBIS leadership teams of
highly implemented schools were close to other leadership teams such as the Instructional
Leadership Team, for example within the network. Proximity to other teams
demonstrated frequent overlaps in membership and opportunities to transmit information
efficiently to teams capable of sending and receiving information quickly and effectively.
In this sense, structure of the network to enable diffusion depends on the position not

119
only of the team in charge of the innovation, but the existing teams in place as well.
Effective schools will have leadership teams connected to other leadership teams, while
lower performing schools will have disjointed networks and lack of ties between teams
responsible for carrying out the work of the school. Practitioners again must be mindful
of representation and ensure that the leadership teams have access to other powerful
teams within the network. For example, if principals appear to be a part of teams across
the network, it may be helpful to have principal or administrator representation on teams,
or direct ties to those key people.
Team Internal Process for Collaboration Matters
The most significant finding from this study was the relationship between the
quality of process of the PBIS team and implementation of PBIS. Previous literature has
suggested that the team quality is directly related to sustained changes to instructional
practice and implementation of school-wide systems (McIntosh et al., 2013; Kincaid,
Blase, & Wallace, 2007, Garet, Porter, Desimone, Birman, & Yoon, 2010; Goddard,
Goddard, and Tschannen-Moran, 2007) and that leadership play integral roles in
networks (Spillane & Min Kim, 2012; Doolittle, 2006; Bambara, Nonnemacher, and
Kern, 2009; Kincaid, Child, Blase, and Wallace, 2007). Current findings support previous
notions; all four elements of an effective team process – dialogue, decision-making,
action-taking, and evaluation – were found to be strongly and positively correlated with
measures of PBIS implementation, and all but ‘dialogue’ correlated with statistical
significance. Evaluation, which correlated most strongly, supports McIntosh and
colleagues’ (2013) findings that the factor most related to sustainability of PBIS was the
functioning of the PBIS leadership team, especially its use of data. The premise of the

120
Evaluation subscale is the use of data in teams. These results suggest that the ways in
which the members of a team work together to solve problems of practice related to
student achievement and school functioning are directly related to educational outcomes
for teachers and students. Implications are far-reaching beyond PBIS and support
numerous scholarly and empirical studies endorsing the importance of collaboration
amongst colleagues in the school setting and the use of data to make decisions (Darling-
Hammond, Ancess, & Ort, 2002; Gajda & Koliba, 2007; Goodlad, Mantle-Bromley, &
Goodlad, 2004; Hiebert, 1999; US Dept. of Education, 2001; Wasley et al., 2000; Zito,
2011; City, Elmore, Fiarman, & Teitel, 2009; Stevens & Kahne, 2006; Dufour & Eaker,
1998, Dufour, Dufour, & Eaker, 2005; Pounder, 1998).
Because the quality of the team’s internal process is so important to the diffusion
of innovations (Gajda & Koliba, 2008; Woodland & Hutton, 2012; Woodland, Barry, &
Crotts Roohr, 2014), policy makers and school leaders are encouraged to spend time and
resources on training educators on effective team meeting procedures, strategies for
collective dialogue and decision-making, conflict resolution, and the analysis of data in
meetings. Cycles of inquiry should become a part of the school culture and drive each
interaction educators have with one another. School staff members must be trained on
how to collaborate with one another effectively and understand the vitality of the
opportunity to interact with their colleagues. Leaders must consistently assess the quality
of their schools’ teams to ensure effective adherence to the cycle of inquiry, and provide
intense support and problem solving for those who are not. An ineffective team is likely
to be unproductive and ineffectual, thus inhibiting their own learning and diffusion of
innovations. In regards to implementation of large scale efforts, such as PBIS or RTI, the

121
focus of consultants, district leaders, coaches, and administrators should first start with
the leadership team. The extent to which the leadership team engages in effective
collaborative processes is a strong predictor of a school-wide reform effort’s continued
success or failure in the future. Policies should also reflect a strong importance of
building an effective team and providing the necessary resources to do so, including
creating and providing agendas and protocols for dialogue and decision making, and
ongoing use of formative and summative data to evaluate practices. Members of
leadership teams should also put in significant effort in making sure they work well
together and refine their practices as necessary.
Implications for the Implementation and Sustainability of PBIS
An additional purpose of this study was to introduce SNA to the study of PBIS.
Findings of this study support the notion that SNA provides a unique and additional
methodology for assessing the capacity of PBIS to be implemented and sustained within
a school. As noted in previous sections, evaluation of PBIS typically has included
observational, self-assessment, checklist-type measures aimed to indicate the presence (or
non-presence) of its practices and systems (i.e. observable expectations, establishment of
a leadership team, and a documented system of acknowledgement and consequences).
These measures are important as they provide a picture of what elements of PBIS are in
place and effective at a given time. However, they do not take into account the effects of
the people and social system that are responsible for enacting them. The social system, or
the network, is an essential part to consider in implementation (Fixen et al., 2005; 2011)
yet few approaches are available to objectively measure and observe that system in
action. As practitioners and policy makers consider the capacity of systems to support

122
PBIS, it makes great sense to study the social networks first. As such, school leaders are
encouraged to take inventory of their teams, carefully assign members to the PBIS
leadership team, and set their system to support diffusion of PBIS effectively. They
should also have PBIS as a top priority in their schools, as a part of a few focused
initiatives, not one of many. As schools with many teams (and many initiatives) report
lower implementation, capacity is dependent upon a system that only has a few reform
efforts in place.
SNA serves as an indicator of success and also an explanation for current status
of PBIS, which allows leaders and policy makers to make adjustments to the network as
necessary. Measures of centrality indicated that PBIS leadership teams should be
positioned near other leadership teams within the network, and avoid being in between
the path of two teams. In this sense, the PBIS leadership team must play a central role in
the network and maintain its attention to its own practices to ensure implementation of
PBIS. PBIS leadership teams closely tied to other leadership teams (such as an
Instructional Leadership Team or Administrative Team), will facilitate consistency
between initiatives and provide access to resources, capital, and knowledge from key
players within the school. PBIS practices will then align with current initiatives and have
the capacity to diffuse in a well-developed, focused way.
The also study supported previous literature that the quality of the PBIS
leadership team is a predictor of implementation and sustainability, implying that in
practice, the PBIS leadership team is of top priority to leaders. Schools with PBIS
leadership teams who follow a high quality internal process for collaboration will report
higher levels of PBIS implementation. These teams will dialogue about PBIS practices,

123
make timely and relevant decisions regarding those practices, act upon them effectively,
and consistently evaluate their progress towards implementation school-wide. If
implementation is faltering, practitioners are urged to assess the quality of the PBIS
leadership team to determine if their internal process for collaboration is conducive to
diffusion of innovation.
PBIS is a large-scale reform effort aimed at improving student behavior through a
systematic coordination of practices, policies, and systems. In order to be most effective,
it appears that the school must maintain consistent attention towards PBIS and focus its
resources, time, and personnel towards it. A major implication of all SNA findings relate
to the idea that PBIS is best supported when its network allows it be a focused and
important priority to the school’s functioning.
Limitations
Design
Although the process of SNA is quite rigorous and the study produced
informative results, the correlational, non-experimental design to which it was applied
serves as a limitation to this study. Correlational analyses limit the ability to make any
causational statements between the variables studied (Heppner, Kivlighan, & Wampold,
1999). For example, it is possible that it is not the network that theoretically supported
implementation of PBIS, but PBIS as a school-wide initiative, done well, actually made
the schools’ staff more communicative, leading to better diffusion across the network.
Also, there are many other factors that could influence the extent to which PBIS was
implemented in these schools that extend beyond the structure of the network, the
positioning of the PBIS team, or the process of the PBIS team. A correlational research

124
design would not control for these factors, so we cannot say that the network is the only
reason for implementation.
Measurement
Several issues with measurement within this study also serve as limitations. Three
out of four measures were self-report: the Staff Member Survey, Self Assessment Survey,
and Teacher Collaboration Assessment Survey, which rely on the perceptions of team
members and school staff. Self-reports are often troublesome because they respond in a
way that reflects a response bias rather than the construct being measured (Heppner,
Kivlighan, & Wampold, 1999). With the SAS and TCAS especially, they were not
objective measurements, and relied only what staff members perceived to be in place, as
no direct observational evaluation tools were used in assessing PBIS and team process,
respectively.
Limitations are also present in terms of the tools used to collect network data. The
Team Inventory and Staff Member Survey, while based on researched and supported
theories of data collection for identifying teams within a school (Gajda & Koliba, 2008;
Woodland & Hutton, 2012; Woodland, Barry, & Crotts, 2014), are not researched tools,
so they do not have any psychometric properties or empirical evidence to suggest they are
reliable or valid.
Another limitation of measurement is the response rate of staff members on the
Staff Member Survey and Self Assessment Survey. Both measures had relatively low and
inconsistent response rates across schools, meaning that all information may have not
been accounted for. Regarding the SAS, implementation of PBIS practices may have
been higher or lower than what was reported by staff members.

125
Assumptions of Communication
This study defined a team as the mechanism for school staff to communicate with
one another. However, as noted in the literature, individuals are capable of having
numerous relationships, including friendship, advice-seeking, family, or close proximity
in work spaces (Deal, Purinton, & Waetjen, 2009; Prell, 2011; Borgatti, Everett, &
Johnson, 2013). While literature suggests that the work of any organization is
accomplished through teams (Barnard, 1950; DuFour & Eaker, 1998; Senge et al., 2000;
Gajda & Koliba, 2008), work completion and communication can also exist outside the
team. A limitation to this study is that it assumes that the primary avenue for interaction
and communication is through co-membership on formal teams. However, there could be
many other informal groups and networks that facilitate or inhibit diffusion of innovation
within the school.
Another limitation is the assumption that school staff members actually
communicate within and across teams. Structuring a network to include teams as the
opportunities for communication about school goals increases the likelihood that they
will interact and communicate about practice (Rogers, 2003; Prell, 2011; Moolenaar &
Daly, 2012; Daly et al., 2010), but does not guarantee it, as they may actually not take
advantage of what has been put into place. Schools with a well-structured network, in
theory, should communicate, which is what this study aimed to explore: the capacity for
the network to support any communication. However, it did not study actual patterns of
nature, direction, or frequency of communication. Communication was also assumed to
be positive, productive, and related to school goals. This study did not use methods to
determine the nature of the communication itself, which could have been negative,

126
tangential, or unrelated to anything relevant to the school. In this case, implementation
could have faltered due to the nature of the communication, even if the networks were
structured to support diffusion. It is important to consider and investigate the content and
the way in which school staff members are actually talking with one another. Further, a
major point of emphasis in this study was to investigate capacity for diffusion through
communication, not the actual communication patterns themselves. The investigator did
not observe or map actual interactions between staff members and teams, but only
inferred potential for communication and diffusion based on the structures in place.
School Characteristics
Another limitation of the study is the time of initial training and implementation
of PBIS across the schools. The District did not introduce PBIS to the eight schools at the
same time, and they all received initial training at different times. Schools that had
implemented sooner would have therefore received more coaching and technical
assistance, and had the time to progress in their implementation, compared to those who
implemented later. Given that PBIS takes three to five years to implement (Adelman &
Taylor, 1997; Bradshaw & Pas, 2011; Fixsen et al., 2005), those schools farther along in
that timeline could be further implemented purely based on time. Therefore, stronger
implementation of PBIS may have been a result of more time and support, not just the
team communication network or process of the PBIS leadership team.
The District included in this study had many different student needs to meet and
corresponding educational programs in place. Across the eight schools included in this
study were various educational programs, including intensive social-emotional-
behavioral support programs for students with emotional impairments and social

127
maladjustment (School 5). Considering that these programs already have a focus on
promoting positive behavior, the differences in orientation or programmatic focus of the
schools serves as a limitation to this study. Schools whose main focus is to intervene with
behavior likely have a background knowledge and appreciation of practices related to
PBIS. Therefore, it is possible the practices and policies of the school even outside the
realm of PBIS are similar to those of PBIS, thus impacting the implementation. The focus
of the school could have supported diffusion, not the configuration of the communication
network.
Directions for Future Research
These findings build upon the investigations initiated by Woodland, Whitcomb, &
and Barry (under review) who found that PBIS teams must be representative of the
school community, and that representation could be observed through SNA. This study
examined the relationship of collaborative practices within teams and the structured team
communication networks and implementation of school-wide positive behavior support
systems by correlating network and collaboration measures with measures of PBIS
implementation. While important, significant findings were noted, the study was limited
due to its correlational design. It is recommended that future research in this area follow
an experimental design to control for other factors that could have contributed to the
structure of the network, implementation of PBIS, and or the collaborative process within
the teams. Measurement may also include more direct observational tools of
implementation and psychometrically supported questionnaires.
Beyond experimental adjustments to the current study, there are many directions
research in this area could take. Firstly, given the implications of the quality of teaming,

128
an overall measure of team quality would provide useful information regarding the whole
network’s capacity to support school-wide change. The TCAS or like instruments could
be given to all teams within the school, and researchers should report on time spent in
teams, examine their focus, and also representation within teams, in addition to
connectivity measured by social network analyses.
Next, replication of this study in other schools and districts, perhaps with a larger
sample size could help in working towards determining the structures that are best for
diffusion of innovation. Because this study is preliminary and first of its kind, previous
research has not made the explicit link between network properties and implementation.
Sociograms which demonstrate ideal conditions for diffusion should be created, and
network properties such as density, centralization, count of nodes and edges, and
centrality will need to be calculated to make conclusions regarding what the optimal
network structure is for successful school functioning.
This study investigated a network’s capacity to support diffusion of innovation
and implementation. Capacity is an essential piece to planning initial installation and
implementation of school-wide innovation. However, future research may also include
examination of actual communication patterns within and across all teams. As noted
within the limitations, teams provide an excellent venue to communicate within and
across the school network. However, it will be important to also know the reality of that
communication. Surveys and observations should include prompts for school staff
members to list who they actually talk to and how often about particular practices to
determine how communication patterns constrain or support diffusion.

129
An investigation of other school-wide practices and initiatives is also
recommended for future research. Schools will be well informed if its stakeholders and
researchers study how certain curricula, programs, or policies will be best supported in
their schools. Researchers are urged to study academically-based programming,
additional social-emotional-behavioral practices, and general school operational decisions
from the SNA and diffusion of innovation perspective. As evidenced by the current
study, taking a relational way of thinking to leadership and professional development is a
high leverage, yet underutilized approach, to determine school capacity for sustainability
and implementation.
Lastly, this study investigated implementation and had implications for the job-
embedded professional learning of school staff. However, because the intention of school
is to ultimately to support students, future research on the effects of network structure and
collaborative process on student learning is essential. Future research must include
outcome data, in the form of standardized test scores, state-wide assessments, social-
emotional-behavioral outcome data, graduation and dropout rates, and special education
rates, for example. A relationship is likely to be present, and will then have even more
profound implications for how to educate students effectively.
Conclusion
This study used SNA to investigate the relationship of team communication
networks and implementation of positive behavior support systems. Significant
relationships were found between the collaboration process quality in PBIS leadership
teams and PBIS implementation. Moderate to strong relationships were demonstrated in
network property measures, indicating fewer teams and thus moderate density of a

130
network is ideal for diffusion of innovation and implementation of school-wide social-
emotional-behavior practices and systems. Results suggest that school leaders and policy
makers should be very thoughtful during the planning stages of school-wide
implementation to ensure efficient and quality social relationship building and
collaborative practices within and across the team communication network of schools.
More specifically, best diffusion and implementation of school-wide systems, practices,
and routines are best supported in schools with fewer teams and loosely connected teams
and staff members, and lead by well-functioning leadership teams of a smaller size and
with ties to central teams, who follow a cycle of dialogue, decision-making, action-
taking, and evaluation.
This study builds on existing literature describing the theory and application of
social capital, diffusion of innovation, and SNA on individual and organizational
behavior. To date, very few studies have been conducted from the SNA perspective in
educational settings especially, and few have been conducted to explicitly determine the
existence of a relationship between network structure and innovation. Furthermore, this is
the first study to use SNA in studying the implementation of school-wide supports for
positive behavior. Therefore, this study adds a tremendous and valuable look into the
power of school staff working together to support high quality and equitable educational
outcomes. Additional research is needed to further investigate the influence and effects of
school networks. So far, it is clear that relationships matter to educational practice, and
that studying those relationships offers a high leverage approach to conceptualizing
school improvement and best practice in supporting student outcomes.

131
APPENDIX A
Recruitment Email Templates Dear [name of administrator and/or PBIS coach], We have a school psychology intern, Shannon Barry, working in the district this year who is studying PBIS as her dissertation study at UMass Amherst. I am writing to share with you an overview of her study (see below) and ask for your participation. It will consist of a short survey to fill out by you and your staff and a brief self-report assessment of PBIS leadership team meetings. Results of this study will be shared when it is complete and provide helpful insights into the quality of collaboration within your school and its relationship to implementation of PBIS. Shannon is willing to meet with you to discuss the study further and/or fill out any materials, if you so desire. Thank you for your support on this. Any questions, please let me or Shannon know. Best, [Behavior specialist name] --- Dear [name of administrator], My name is Shannon Barry and I am a School Psychology Intern in the district and doctoral candidate in School Psychology at UMass Amherst. I am writing to request your full participation in my dissertation research study entitled “Using Social Network Analysis to Investigate the Relationship between Teacher Networks and Implementation of Behavior Support Systems”. Your school has been specially selected due to its participation in Positive Behavioral Interventions and Supports (PBIS). The project has also been supported by the district PBIS coordinators and coaches. About the Dissertation Study Rationale: PBIS is best sustained and most effective when teams function at a high quality (McIntosh et al., 2013). These teams then support a connected, collaborative network of administrators, teachers, and school staff. The network then supports strong PBIS implementation and consequently, positive social-emotional-behavioral student outcomes. Purpose: To closely examine the relationship between the implementation of PBIS and the nature and quality of educator networks, at the school-wide level and within the classroom.

132
Collection of Data Phase One: I will first ask that you fill out an inventory of the teams and groups that exist within your school. Upon receipt of your completed survey, I will then provide hard copies of a short survey to be distributed to your staff, in which they will be prompted to identify the teams of which they are a member. Both methods of data collection are brief and should take at most 5 minutes to complete. Teacher surveys will be in multiple choice/check-box format, allowing for simple and efficient completion. Staff who complete the survey will be entered into a raffle to win a $25 gift card. Phase Two: Members of the PBIS leadership team will be asked to complete a short assessment rubric about the process of their team. It will take about 5 minutes to complete. This phase will occur in June. Confidentiality All information gathered as part of this study will be kept strictly confidential. Each staff person’s name will be replaced by a pseudonym and no identifying personal information will be provided. All data will be analyzed on the aggregate to protect the identity of school staff. Participation To have meaningful data, it is essential that every team and staff member is identified, and 100% of your staff complete the survey. Staff should be assured that they are simply reporting whom they work with in groups, not their personal relationships, or anything related to their job performance. Such information is not relevant to the purposes of this project. Consent forms will be distributed to teachers selected to be observed, outlining the study and the benefits/minimal risks associated with their participation. Dissemination of Results Upon completion of this study, you will be offered and provided a report summarizing major findings. Such information will be highly informative to the overall functioning of your school’s quality of collaboration, teaming, and PBIS implementation. If you have any questions or would like to meet regarding this dissertation project, please do not hesitate to contact me at [email protected] or 508-254-1393. Best, Shannon K. Barry, M.Ed. Doctoral Candidate, School Psychology University of Massachusetts Amherst [email protected]

133
APPENDIX B
PBIS Self-Assessment Survey (Lewis & Sugai, 1999; Sugai, Horner, & Todd, 2009).
SCHOOL WIDE SYSTEMS
Current Status
Feature
Priority for Improvement
In
Place
Partial
in Place
Not in Place
School-wide is defined as involving all students, all staff, & all settings.
High
Med
Low
1. A small number (e.g. 3-5) of positively & clearly stated student expectations or rules are defined.
2. Expected student behaviors are taught directly.
3. Expected student behaviors are rewarded regularly.
4. Problem behaviors (failure to meet expected student behaviors) are defined clearly.
5. Consequences for problem behaviors are defined clearly.
6. Distinctions between office v. classroom managed problem behaviors are clear.
7. Options exist to allow classroom instruction to continue when problem behavior occurs.
8.Procedures are in place to address emergency/dangerous situations.
9. A team exists for behavior support planning & problem solving.
10. School administrator is an active participant on the behavior support team.

134
Current Status
Feature
Priority for
Improvement
In Place
Partial
in Place
Not in Place
School-wide is defined as involving all students, all staff, & all settings.
High
Med
Low
11. Data on problem behavior patterns are collected and summarized within an on-going system.
12. Patterns of student problem behavior are reported to teams and faculty for active decision-making on a regular basis (e.g. monthly).
13. School has formal strategies for informing families about expected student behaviors at school.
14. Booster training activities for students are developed, modified, & conducted based on school data.
15. School-wide behavior support team has a budget for (a) teaching students, (b) on-going rewards, and (c) annual staff planning.
16. All staff are involved directly and/or indirectly in school-wide interventions.
17. The school team has access to on-going training and support from district personnel.
18. The school is required by the district to report on the social climate, discipline level or student behavior at least annually.

135
APPENDIX C
Team Inventory
Using Social Network Analysis to Investigate the Relationship between Teacher Networks and Implementation of Behavior Support Systems: A
Dissertation Study by Shannon Barry Please fill in the chart on the page below with the following information. An example has been provided. Please attach this document and email back to [email protected] or print and send via inter-school mail to Shannon Barry (Psychology Intern) at Middle School. Or I can pick it up in person, if desired. Thank you! Team Name – Name all teams, groups, and committees of staff members within the school that have been created to meet. Team Members & Titles –List the full names of all members of each team and their positions (e.g. John Jones, Counselor; Sally Smith, 4th grade teacher) Time Frequency and Duration – List how often they meet and how long their meetings typically are. (e.g. Every Tuesday for two hours; monthly for one hour) Team Focus/Purpose – Identify the purpose of the team. What is its focus? What was it created to discuss? (e.g. Mental Health Team – student mental health concerns, Tier 2 and Tier 3 intervention, data; 8th grade team – student data analysis, instruction strategies, curriculum alignment. ) Be specific as possible. Example Name of School: Hills Elementary School
Team Name
Team Members and Titles
Meeting Time, Frequency and
Duration
Team Focus/Purpose
PBIS leadership team
Cathy Rossi – principal Will MacMillan – 4th grade teacher Shane Allen – 1st grade teacher Beth Potter - guidance counselor/internal coach Abigail Ferry – behavior specialist/district coach Sharon Fitzpatrick –
Every other Monday 3:30-4:30 (twice/month)
PBIS leadership committee. Discuss events for school-wide rewards, analyze SWIS data, develop interventions, monitor implementation

136
music teacher Maria Santiago – 2nd grade teacher
progress
Fourth Grade Team
Will MacMillan, Steve Jones, Sarah Smith, Rebecca Ronaldson, Donna Ortiz (all teachers)
Every Tuesday 1:20-2:00
Plan lessons, analyze student data, design assessments
Name of School:
Team Name Team Members and Titles
Meeting Time, Frequency and
Duration
Team Focus/Purpose

137
APPENDIX D
Staff Member Survey Dear School staff member, With the support of your school’s leadership and PBIS leadership teams, School is participating in a dissertation research project entitled Using Social Network Analysis to Investigate the Relationship between Teacher Networks and Implementation of Positive Behavior Support Systems. The primary purpose of this research is to closely examine the relationship between the implementation of PBIS and the structure and quality of teaming. The following survey will help to create an inventory of teams at your school and be used to explore the relationship between team connectedness and PBIS implementation. Your participation is greatly appreciated. Please be assured that you are simply reporting the people with whom you work with in teams, not personal relationships, or anything related to job performance or accountability. Such information is not at all relevant to the purposes of this project. If you would like additional information about this project, please do not hesitate to email me at. All results will be accessible to all staff upon completion of the study. Please fill out and return to your principal. THANK YOU! Shannon K. Barry. M.Ed. Doctoral Candidate, School Psychology University of Massachusetts Amherst

138
[Name of Elementary School] 1. What is your name? Names are asked solely to create an inventory of
teams. All names will be changed to pseudonyms upon analysis and report of data. All data is stored securely and kept confidential.
2. What is your primary position at School? 3. Please identify ALL teams of which you are a member. Add any that are
not listed.
! PBIS Tier I Team
! PBIS Tier II Team
! SCDM Team ! OLT Team ! PTO ! ILT Team
! Kindergarten Team
! First Grade Team
! Second Grade Team
! Third Grade Team
! Fourth Grade Team
! Fifth Grade Team
! Other(s) (please specify):
! __________ ! __________ ! __________ ! __________
4. Would you like to be entered into a raffle to win a $25 gift card?
! Yes ! No
Please fill out and return to your principal by [date].

139
APPENDIX E
Teacher Collaboration Assessment Survey (TCAS; Woodland & Hutton, 2012; Gajda & Koliba, 2008)
TCAS ©2014 [email protected] 1
Teacher Collaboration Assessment Survey (TCAS)
Name of Team/Group: ________________________________________________________________ Team Members: ______________________________________________________________________ Date: _______________________________________________________________________________ Group/Person Completing the Assessment: _________________________________________________ DIRECTIONS: 1. Choose a process for administering/completing the TCAS (see below). 2. Review the criteria for Dialogue, Decision-Making, Action and Evaluation on the following pages. 3. Circle one response per row that most accurately reflects the current quality/attributes of team
functioning. 4. Total the scores for each section and summarize results on page 1. 5. Use findings for developmental and/or formative assessment purposes and for resource allocation. Process Used for Administering the TCAS: (check all that apply):
! recollection and reflection by a team member ! observation of team meeting(s) (via video) ! observation of team meeting(s) (in person) ! review of meeting agendas/plans
! review of meeting running record/minutes ! administrator consultation with team member(s) ! other __________________________
Team - Collaboration Assessment Scores
I. Dialogue /14
II. Decision-making /14
III. Action /12
IV. Evaluation /12
Total /52
Areas of Strength: Areas for Improvement: Resources Needed:

140
TCAS ©2014 [email protected] 2
2 1 0
aAn agenda for team dialogue is pre-planned
and accessible to all in advance of every team meeting.
A written agenda for group dialogue is provided for most team meetings.
There is no pre-planned agenda for group dialogue/team meetings.
b The team meets regularly and all meetings are attended by all members.
The team meets with some regularity and most meetings are attended by all members.
The team meets sporadically, or full attendance at team meetings is rare.
cTeam meetings are facilitated and employ the
use of protocols to structure and guide dialogue.
Occasionally, team meetings are purposefully facilitated, and/or guided by protocols.
Team dialogue/meetings are generally improvisational, unstructured, and not
purposefully facilitated.
dTeam dialogue is consistently focused on the
examination of instructional practice and student performance.
Team dialogue occasionally centers on quality of instructional practice and student
performance.
Team dialogue rarely focuses on the quality of instructional practice and
student performance.
e
Inter-professional disagreements about issues of practice are typical - these disagreements
are expected, openly examined and thoughtfully discussed.
Inter-professional disagreements about important issues are not typical, often go
unexamined, or remain addressed.
The group avoids conflict, tends to confirm present practices, or inter-
professional disagreements are said not to exist.
fTeam members participate equally in group
dialogue; there are no hibernators or dominators.
Most team members contribute to the dialogue, but there are some hibernators and
dominators.
Team members contribute unequally to the dialogue; there are regular dominators and hibernators.
gAn accurate record of team dialogue,
decisions, and subsequent actions is recorded and accessible to all members.
A record of team dialogue, decisions, and intended actions exists.
No accurate or accessible record of team dialogue, decisions, and
subsequent actions exists.
2 1 0
a
Team members regularly identify and determine specific actions that they will take to
improve instructional practice and student learning.
Team members occasionally identify and determine actions that they will take to
improve instructional practice and student learning.
Team members do not identify or determine specific actions that they will take to improve instructional practice
and student learning.
bThe team uses a specific process for every
decision it makes (e.g. consensus, majority, or some other decision-making structure).
The team occasionally uses a process for making decisions (e.g. by consensus,
majority, or some other decision-making structure).
The team does not use specific processes for making decisions.
cDecisions made by the team are clearly and
directly related to the improvement of instructional practice and student learning.
Decisions made by the team are occasionally related to the improvement of instructional
practice and student learning.
Teams decisions are not related to the improvement of instructional practice
and student learning.
dThe team regularly makes decisions about what specific instructional practices it will
initiate, maintain, change and discontinue.
The team occasionally makes decisions about what specific instructional practices it will initiate, maintain, change or discontinue.
The team does not make decisions about instructional practices to initiate, maintain, change and/or discontinue.
e All team decisions are informed by full group dialogue.
Most team decisions are informed by some level of group dialogue.
Team decisions are not informed by group dialogue.
fAll team decision-making is transparent; each member knows what the decisions are/were
and how and why they were made.
Decision-making is somewhat transparent; members are aware of team decisions and
how they were were made.
Group decision-making is not transparent; members are not aware of
how group decisions were made.
gThe team regularly determines what specific instructional practice and student learning
information it intends to obtain and analyze.
The team occasionally decides what specific instructional practice and student learning information it needs to obtain and analyze.
The team does not determine instructional practice and student
learning information it needs to obtain and analyze.
Circle one box per row
Dialogue Total /14
DECISION MAKING
Decision-Making Total /14
DIALOGUE Circle one box per row

141
TCAS ©2014 [email protected] 3
2 1 0
aTeam members know the specific individual actions that they should take as a result of
group dialogue and decision-making.
Most team members know the specific individual actions that they should take as a
result of group dialogue and decision-making.
Team members are unaware of specific actions that they should take as a result of group dialogue and decision-making.
b
Intended actions to be taken by team members are high leverage (i.e. team
members believe their actions will directly improve instructional practice).
Intended actions are somewhat high leverage (i.e. team members believe their actions could contribute to the improvement of
instructional practice).
Intended actions are not high leverage (i.e. team members don’t know how or
if their actions will improve instructional practice).
c Team members actions are specific and measurable/observable.
Team members actions are specific or measurable/observable.
Team members actions are not specific, nor measurable/observable.
d Team member actions are coordinated and interdependent.
Team member actions are coordinated or interdependent.
Individual team member actions are independent and coordinated with one
another.
e
Action-taking is equitable among members (i.e. every member acts to improve individual instructional practice and group performance
as a result of team decision-making.)
Action-taking is somewhat equitable (i.e., most members regularly take steps to
improve individual instructional practice and group performance.)
Action-taking is not equitable (i.e., some members take most of the action,
some take very little or none.)
f
The group has clear, continuous, and accessible documentation of the instructional
practices that they have stopped, started and/or changed over time.
The group has some documentation of the instructional practices they have stopped,
started and/or changed over time.
Little, if any, documentation exists of the practices that the group has
stopped, started and/or changed over time.
2 1 0
aThe team accurately understands what
evidence is available to them regarding quality of instructional practice and student learning.
The team is aware of some evidence that is available to them regarding quality of
instructional practice and/or student learning.
The team does not understand what evidence is available to them regarding quality of instructional practice and/or
student learning.
b
The team regularly analyzes the quality of their students' actual work (i.e. work
completed by their students in response to their instruction).
The team infrequently examines the quality of their students' actual work (i.e. work
completed by their students in response to their instruction).
The team does not examine the quality of their students' actual work (i.e. work
completed by their students in response to their instruction).
c The team regularly analyzes the quality of their classroom-based instructional practice.
On occasion the team will analyze the quality of their classroom-based instructional
practice.
The team does not analyze the quality of their classroom-based instructional
practice.
dTeam members regularly observe each other’s
classroom instructional practices, either in person or indirectly via technological means.
Team members occasionally observe each other’s classroom instructional practices,
either in person or indirectrly via technological means.
Team members do not observe each other’s classroom instructional
practices, either in person or indirectly via technological means.
e
The team consistently generates targeted, specific, and timely feedback for team
members about how to improve instructional practice and student learning.
The team occasionally generates some ideas for how team members might improve quality of instructional practice and student learning.
The team does not generate targeted, specific, and timely feedback about quality of instructional practice and
student learning.
f
The group has clear, continuous, and accessible documentation and substantiation of how their instructional practice affects their
student's learning.
The group has some documentation of how their instructional practice affects their
student's learning.
The team does not document or substantiate the effects of their actions
on student learning.
Circle one box per row
Circle one box per row
Action Total /14
Evaluation Total /14
ACTION - Circle one box per row
EVALUATION

142
APPENDIX F
Social Network Analysis Concepts
Network Concept Definition Actor/Nodes/Vertices Discrete persons, teams, departments, programs, or anything
capable of forming relationships with another entity (Daly, 2010; Deal et al., 2009)
Lines/Paths/Ties Indicate connections between people in the network (de Nooy, Mrvar, & Batagelj, 2005)
Stars Nodes with the greatest of connections and tend to appear in the center of the sociogram (Deal et al., 2009)
Bridges Nodes that connect other nodes and function as gateways of information flow (Deal et al., 2009)
Bottlenecks Similar to bridges, but control the flow of information through the network (Deal et al., 2009)
Isolates
A node with very few or no ties with other nodes (Deal et al., 2009).
Clique A sub-set of a network in which the actors are more closely and intensely tied to one another than they are to other members of the network.

143
REFERENCES
Adelman, H. S., & Taylor, L. (2003). On sustainability of project innovations as systemic change. Journal of Educational and Psychological Consultation, 14, 1-26.
Adelman, H. S., & Taylor, L. (2011). Expanding school improvement policy to better address barriers to learning and integrate public health concerns. Policy Futures in Education, 9, 431-436. Algozzine, B. & Algozzine, K. (2009). Facilitating academic achievement through School-wide Positive Behavior Support. In W. Sailot, G. Dunlap, G. Sugai, & R. Horner (Eds.) Handbook of Positive Behavior Support (pp. 521-550). New York, NY: Springer. Algozzine, B., Putnam, B., & Horner, R. (2010). What comes first-the achievement or the behavior (problem)? Charlotte, NC: University of North Carolina Behavior and Reading Improvement Center.
Algozzine, B., Barrett, S., Eber, L., George, H., Horner, R., Lewis, T., Putnam, B., Swain-Bradway, J., McIntosh, K., & Sugai, G (2014). School-wide PBIS Tiered Fidelity Inventory. OSEP Technical Assistance Center on Positive Behavioral Interventions and Supports. Retrieved from http://www.pbis.org. Algozzine, R., Horner, R., Sugai, G., Barrett, S., Rossetto Dickey, C., Eber, L.,...Tobin, T. (2009). Evaluation Blueprint for School-wide Positive Behavior Supports. Eugene, OR: OSEP Technical Assistance Center on Positive Behavioral Interventions and Supports. Retrieved from www.pbis.org. Angold, A & Costello, E.J. (2000). The Child and Adolescent Psychiatric Assessment (CAPA). Journal of the American Academy of Child & Adolescent Psychiatry, 39, 39-48. Bambara, L. M., Nonnemacher, S., & Kern, L. (2009). Sustaining school-based individualized positive behavior support: Perceived barriers and enablers. Journal of Positive Behavior Interventions, 11, 161-176. Bear, G. (2010). School discipline and self-discipline: A practical guide to promoting
prosocial student behavior. New York, NY: Guilford Press. Borgatti, S.P., Everett, M.G., & Freeman, L.C. (2002). Ucinet for Windows: Software for social network analysis. Harvard, MA: Analytic Technologies. Borgatti, S.B., Everett, M.G. & Johnson, J.C. (2013) Analyzing social networks. Los Angeles, CA: Sage Publications.

144
Bourdieu, P. (1986). The forms of social capital. In J.G. Richardson (Ed.), Handbook of theory and research for the sociology of education (pp. 241-258). New York, NY: Greenwood.
Bradshaw, C., Mitchell, M., & Leaf, P. (2010). Examining the effects of school-wide positive behavioral interventions and supports on student outcomes: Results from a randomized controlled effectiveness trial in elementary schools. Journal of Positive Behavior Interventions, 12, 133-148. Bradshaw, C.P., Debnam, K.J., Koth, C., & Leaf, P.J. (2009). Preliminary validation of
the Implementation Phases Inventory for assessing fidelity of school-wide Positive Behavior Supports. Journal of Positive Behavior Interventions, 11, 145-160.
Bradshaw, C., Koth, C., Bevans, K., Ialongo, N., & Leaf, P. (2008). The impact of school-wide positive behavioral interventions and supports (PBIS) on the organizational health of elementary schools. School Psychology Quarterly, 23, 462-473. Bradshaw, C., Koth, C., Thornton, L., & Leaf, P. (2009). Altering school climate through school-wide positive behavioral interventions and supports: Findings from a group-randomized effectiveness trial. Prevention Science, 10, 100-115. Breen, M. J., & Altepeter, T. S. (1990). Situational variability in boys and girls identified as ADHD. Journal of Clinical Psychology, 46(4), 486-490. Broxterman, K. & Whalen, A.J. (2013). RTI team building: Effective collaboration and data-based decision making. New York, NY: Guilford Press. Cains, R.A., & Brown, C.R. (1996). Newly qualified teachers: a comparative analysis of the perceptions held by B.Ed. and PGCE-trained primary teachers of their training routes. Educational Psychology, 16, 257-270. Caprara, G. V., Barbaranelli, C., Pastorelli, C., Bandura, A., & Zimbardo. P. G. (2000). Prosocial foundations of children's academic achievement. Psychological Science, 11, 302-306. Center for Social and Emotional Education. (2010). School climate research summary.
School Climate Brief, 1(1), 1-16. Chami, G., Ahnert, S., Voors, M., & Kontoleon, A. (2014). Social network analysis
predicts health behaviours and self-reported health in African villages. PLOS One, 9(7), 1-9.

145
City, E. A., Elmore, R. F., Fiarman, S. E., & Teitel, L. (2009). Instructional rounds in education: A network approach to improving teaching and learning. Cambridge, MA: Harvard Education Press. Clifton, A., Turkheimer, E., & Oltmanns, T.F. (2009). Personality disorder in social
networks: Network position as a marker of interpersonal dysfunction. Social Networks, 31, 26-32.
Coburn, C. & Russell, J. (2008). District policy and teachers' social networks. Educational Evaluation and Policy Analysis, 30(3), 203-235. Coburn, C., Choi, L., & Mata, W. (2010). I would go to her because her mind is math. In
Daly, A. (Ed.), Social Network Theory and Educational Change (pp. 33-50). Cambridge, MA: Harvard Education Press.
Coburn, C. E., Russell, J. L., Kaufman, J., & Strein, M. K. (2012). Supporting
sustainability: Teachers’ advice networks and ambitious instructional reform. American Journal of Education, 119(1), 137-182.
Coffey, J.H. & Horner, R.H. (2012). The sustainability of school-wide positive behavior intervention and supports. Exceptional Children, 78, 407-422. Cohen, R., Kincaid, D., & Childs, K. ( 2007). Measuring school-wide positive behavior support implementation: Development and validation of the Benchmarks of Quality (BoQ). Journal of Positive Behavior Interventions, 9, 203-213. Colvin, G. (2010). 7 steps for developing a proactive school-wide discipline plan. Thousand Oaks, CA: Corwin Press. Colvin, G., Kame’enui, E. J., & Sugai, G. (1993). School-wide and classroom management: Reconceptualizing the integration and management of students with behavior problems in general education. Education and Treatment of Children, 16, 361-381. Colvin, K., Crotts, K., Li, X., & Randall, J. (2011, October). Rating scale utility for teacher collaboration survey: Collaboration, your instructional practice and student achievement scale. Paper presented at the annual meeting of the Northeastern Educational Research Association, Rocky Hill, CT. Cook, R., Foster, C., & Randall, J. (2011, October). Applying the Rasch model to pilot testing an instrument measuring quality of collaboration among K-12 teachers. Paper presented at the annual meeting of the Northeastern Educational Research Association, Rocky Hill, CT.

146
Costello, E.J., Mustillo, S., Erkanli A., Keeler, G., & Angold, A. (2003). Prevalence and development of psychiatric disorders in childhood and adolescence. Archives of General Psychiatry, 60(8), 837-844.
Croft, A., Coggshall, J. G., Dolan, M., Powers, E., Killion, J. (2010). Job-Embedded professional development: What it is, who is responsible, and how to get it done well. Washington, DC: National Comprehensive Center for Teacher Quality. Cross, R., Borgatti, S.P., & Parker, A. (2001). Beyond answers: Dimensions of the advice
network. Social Networks, 23(3), 215-235. Cross, J. E., Dickman, E., Newman-Gonchar, R., & Fagan, J. M. (2009). Using mixed-
method design and network analysis to measure development of interagency collaboration. American Journal of Evaluation, 30(3), 310-329.
Daly, A. (Ed.). (2010). Social network theory and educational change. Cambridge, MA:
Harvard Education Press. Daly, A., Moolenaar, N. M., Bolivar, J. M., & Burke, P. (2010). Relationships in reform: The role of teachers' social networks. Journal of Educational Administration, 48(3), 359-391. Darling-Hammond, L. (2009). The flat world and education: How America’s commitment to equity will determine our future. New York, NY: Teachers College Press. Darling-Hammond, L., & McLaughlin, M.W. (1995). Policies that support professional
development in an era of reform. Phi Delta Kappan, 76(8), 597-604. Darling-Hammond, L., Ancess, J., & Ort, S. (2002). Reinventing high school: Outcomes of the coalition campus schools project. American Educational Research Journal, 39(3), 639-673. de Nooy, W., Mrvar, A., & Batagelj, V. (2005). Exploratory social network analysis with Pajek. New York, NY: Cambridge University Press. Deal, T. E., Purinton, T. & Waetjen, D. C. (2009). Making sense of social networks in
schools. Thousand Oaks, CA: Corwin Press. Dearing, J. W. (2004). Improving the state of health programming by using diffusion theory. Journal of Health Communication, 9, 21–36.
Degenne, A, & Forsé, M. (1999). Introducing social networks. London, England, UK: Sage.
Doolittle, J. H. (2006). Sustainability of positive behavior supports in schools. Unpublished doctoral dissertation. Eugene, OR: University of Oregon.

147
Dufour, R. (2011). Work together: But only if you want to. Phi Delta Kappan, 92(5), 57-61.
Dufour, R. & Eaker, R. (1998). Professional learning communities that work: Best
practices for enhancing student achievement. Alexandria, VA: Solution Tree. DuFour, R., Eaker, R., & DuFour, R. (Eds.) (2005). On common ground: The power of
professional learning communities. Bloomington, IN: Solution Tree. Durkheim, E. (1893/1964). The division of labor in society. New York, NY: Free Press.
Durlak, J., Weissberg, R., Dymnicki, A., Taylor, R., & Schellinger, K. (2011). The impact of enhancing students’ social and emotional learning: A meta-analysis of school-based universal interventions. Child Development, 82(1), 405-432. Dusenbury, L., & Hansen, W. B. (2004). Pursuing the course from research to practice. Prevention Science, 5, 55–59.
Earl, L. & Katz, S. (2006). Leading schools in a data-rich world: Harnessing data for school improvement. Thousand Oaks, CA: Corwin Press. England, I. & Stewart, D. (2007). Executive management and IT innovation in health: Identifying the barriers to adoption. Health Informatics Journal, 13(2), 75-87
Elam, S.M., Rose, L.C., & Gallup, A.M. (1994). The 26 annual Phi Delta Kappa/Gallup Poll of the public’s attitudes toward the public schools. Phi Delta Kappan, 75, 41- 56 Fairbanks, S., Sugai, G., Guardino, D., & Lathrop, M. (2007). Response to Intervention: Examining classroom behavior support in second grade. Exceptional Children, 73, 288-310. Faul, F., Erdfelder, E., Lang, A.-G., & Buchner, A. (2007). G*Power 3: A flexible
statistical power analysis program for the social, behavioral, and biomedical sciences. Behavior Research Methods, 39, 175-191.
Finnigan, K.S., and Daly, A. (2012). Mind the gap: Organizational learning and improvement in an underperforming urban system. American Journal of Education, 119(1), 41–71. Fixsen, D. L., Blase, K. A., & Van Dyke, M. K. (2011). Mobilizing communities for implementing evidence-based youth violence prevention programming: A commentary. American Journal of Community Psychology, 48, 133-137. Fixsen, D. L., Blase, K. A., Horner, R. H., & Sugai, G. (2009). Scaling up evidence-based practices in education. State implementation and scaling-up of evidence-based practices. Chapel Hill, NC: University of North Carolina at Chapel Hill, FGP

148
Child Development Institute. Fixsen, D. L., Blase, K. A., Horner, R. H., & Sugai, G. (2010). An overview of the state implementation and scaling up of evidence-based practice centers (SISEP). Scaling Up Brief, 4. Fixsen, D. L., Blase, K., Duda, M., Naoom, S., & Van Dyke, M. (2010). Implementation of evidence based treatments for children and adolescents: Research findings and their implications for the future. In J. Weisz & A. Kazdin (Eds.), Implementation and dissemination: Extending treatments to new populations and new settings (2nd Ed., pp. 435-450). New York, NY: Guilford Press. Fixsen, D. L., Naoom, S. F., Blase, K. A., Friedman, R. M., & Wallace, F. (2005). Implementation research: A synthesis of the literature. The National Implementation Research Network Publication, 231(11), 247-266. Ford, D. L., & Lerner, R. M. (1992). Developmental systems theory: An integrative
approach. Newbury Park, CA: Sage. Freeman, L. (2004). The development of social network analysis: A study in the sociology
of science. Vancouver, British Columbia, Canada: Empirical Press. Fuchs, L.S. & Fuchs, D. (1986). Effects of systematic formative evaluation: A meta- analysis. Exceptional Children, 53,199-208. Gajda, R. & Koliba, C. (2007). Evaluating the imperative of inter-personal collaboration: school improvement perspective. American Journal of Evaluation, 28(1), 26-44. Gajda, R. & Koliba, C (2008). Evaluating and improving the quality of teacher
collaboration: A field-Tested framework for school leaders. NASSP Bulletin, 92(2), 133-154.
Garet, M.S., Porter, A.C., Desimone, L.,Birman, B.F, & Yoon, Y.S. (2001). What makes professional development effective? Results from a national sample of teachers. American Educational Research Journal, 38(4), 915–45. Gates Foundation. (2012). Primary sources: 2012 America’s teachers on the teaching profession. Accessed January 17, 2013 from http://www.scholastic.com/primarysources/pdfs/Gates2012_full.pdf
Gay, L. R., Mills, G., & Airasian, P. (2005). Educational research: Competencies for analysis and applications (8th ed.). Boston, MA: Pearson-Prentice Hall.
Goddard, Y. L., Goddard, R. D., & Tschannen-Moran, M. (2007). A theoretical and empirical investigation of teacher collaboration for school improvement and student achievement in public elementary schools. Teachers College Record, 109(4), 877-896.
149
Goldring, E, and Berends, M. 2009. Leading with Data: Pathways to Improve Your School. Thousand Oaks, CA: Corwin Press. Goodlad, J., Mantle-Bromley, C., & Goodlad, S. (2004). Education for everyone: Agenda
for education in a democracy. San Francisco, CA: Jossey-Bass. Granvetter, F. & Wallnau, L. (2009). Statistics for the behavioral sciences (5th edition). Belmont, CA: Wadsworth. Granovetter, M. S. (1973). The strength of weak ties. Journal of Sociology, 78(6), 1360-
1380. Greenberg, M.T., Weissberg, R.P., O’Brien, M.U., Zins, J.E., Fredericks, L., Resnik, H.,
& Elias, M.J., (2003). Enhancing school-based prevention and youth development through coordinated social, emotional, and academic learning. American Psychologist, 58(6/7), 466-474.
Guskey, T. R. (2000). Evaluating professional development. Thousand Oaks, CA:
Corwin. Hall, G. & Hord, S. (2011). Implementing change: Patterns, principles, and potholes (3rd
edition). Upper Saddle River, NJ: Pearson. Hattie, J. (2009). Visible learning: A synthesis of over 800 Meta-analyses relating to
achievement. New York, NY: Routledge. Hawe, P. & Ghali, L. (2008). Use of social network analysis to map the social
relationships of staff and teachers at school. Health Education Research, 23(1), 62-69.
Heppner, P., Kivlighan, D., & Wampold, B. (1999). Research design in counseling (2nd
edition). Belmont, CA: Wadsworth. Hiebert, J. (1999). Relationships between research and the NCTM Standards. Journal for Research in Mathematics Education, 30, 3-19. Hirsh, S. (2009). A new definition. Journal of Staff Development, 30(4), 10–16.
Hoagwood, K., & Erwin, H, (1997). Effectiveness of school-based mental health services for children: A 10-year research review. Journal of Child and Family Studies, 6, 435-451. Hord, S. M. (2004). Learning together, leading together: changing schools through
professional learning communities. New York, NY: Teachers College Press. Horner, R. H. (2013). Don’t stop with a journal article: Lesson learned from

150
implementing SWPBIS. Paper presented at the annual meeting of principal investigators at the Institute of Education Sciences. Horner, R. H., Sugai, G., & Anderson, C. M. (2010). Examining the evidence-base for school wide positive behavior support. Focus on Exceptional Children, 42, 1-14. Horner, R.H., Sugai, G., Todd, A.W., & Lewis-Palmer, T. (2005). School-wide positive behavior support. In L. Bambara & L. Kern (Eds.) Individualized supports for students with problem behaviors: Designing positive behavior plans. (pp. 359- 390) New York: Guilford Press. Horner, R.H., Todd, A.W., Lewis-Palmer, T., Irvin, L.K., Sugai, G., Boland, J.B. (2004).
The school-wide evaluation tool (SET) A research instrument for assessing school-wide positive behavior support. Journal of Positive Behavior Interventions, 6, 3-12.
Horner, R. H., Sugai, G., Smolkowski, K., Eber, L., Nakasato, J., Todd, A., & Esperanza, J. (2009). A randomized, waitlist-controlled effectiveness trial assessing school- wide positive behavior support in elementary schools. Journal of Positive Behavior Interventions, 11, 133-144. Horner, R.H., Kincaid, D., Sugai, G., Lewis, T., Eber, L., Barrett, S…Johnson, N. (2014). Scaling up school-wide positive behavioral interventions and supports experiences of seven states with documented success. Journal of Positive Behavior Interventions, 16(4), 197-208. Irvin, L. K., Tobin, T. J., Sprague, J. R., & Vincent, C. G. (2004). Validity of office discipline referrals measures as indices of school-wide behavioral status and effects of school-wide behavioral interventions. Journal of Positive Behavior Interventions, 6(3), 131-147. Individuals With Disabilities Education Act, 20 U.S.C. § 1400 (2004). Joyce, B., & Showers, B. (1996). The evolution of peer coaching. Educational Leadership, 53(6), 12–16. Kincaid, D., Childs, K., Blase, K., & Wallace, F. (2007). Identifying barriers and facilitators in implementing school-wide positive behavior support. Journal of Positive Behavior Interventions, 9(3), 174-184. Kochan, S. & Teddlie, C. (2005). An evaluation of communication among high school
faculty using network analysis. New Directions for Evaluation, 107, 41-53.
Koppelman, J. (2004). Children with mental disorders: Making sense of their needs and systems that help them. NHPF Issue Brief, 799, 2-24.

151
Kornienko, O. & Santos, C. (2014). The effects of friendship network popularity on depressive symptoms during early adolescence: Moderation by fear of negative evaluation and gender. Journal of Youth and Adolescence, 43, 541-553.
Leana, C. (2011). The missing link in school reform. Stanford Social Innovation Review.
Retrieved January 15, 2013 from: http://www.ssireview.org/articles/entry/the_missing_link_in_school_reform
Leana, C. & Pil, F. (2006). Social capital and organizational performance: Evidence from
urban public schools. Organization Science, 13(3), 1-14. Lee, M. K. & Randall, J. (2011, October). Applying the Rasch model to evaluate the rating scale measuring the perceptions about collaboration among K-12 teachers. Paper presented at the annual meeting of the Northeastern Educational Research Association, Rocky Hill, CT. LeBon, G. (1897/1995). The crowd. New Brunswick, NJ: Transaction Pub. Leithwood, K., Harris, A. & Hopkins, D. (2008). Seven strong claims about school leadership. School Leadership and Management, 28(1), 27-44. Lewis, T.J. & Sugai, G. (1999). Effective behavior support: A systems approach to proactive school-wide management. Focus on Exceptional Children, 31(6), 1-24. Lewis, T., Barrett, S., Sugai, G., & Horner, R. (2010). Blueprint for School-wide Positive Behavioral Interventions and Support Training and Professional Development. Eugene, OR: University of Oregon, OSEP Technical Assistance Center on Positive Behavioral Interventions and Supports. Retrieved from http://www.pbis.org Lewis, T., Jones, S., Horner, R. H., & Sugai, G. (2010). School-wide positive behavior support and students with emotional/behavioral disorders: Implications for prevention, identification and intervention. Exceptionality, 18, 82-93. Lewis, T.J., Newcomer, L.L., Trussell, R., & Richter, M. (2006). School-wide positive behavior support: Building systems to develop and maintain appropriate social behavior. In C.M. Evertson & C.S. Weinstein (Eds.), Handbook of classroom management: Research, practice and contemporary issues (pp. 833-854). Mahwah, NJ: Lawrence Erlbaum Associates. Little, J. W. (1990). The persistence of privacy: Autonomy and initiative in teachers’ professional relations. Teachers College Record, 91(4), 509-536. Little, J. W. (2003). Inside teacher community: Representations of classroom practice.
Teachers College Record, 105(6), 913-945.

152
Luiselli, J. K., Putnam, R. F., Handler, M. W., & Feinberg, A. B. (2005). Whole-school positive behavior support: Effects on student discipline problems and academic performance. Educational Psychology, 25, 183–198. Lusher, D., Robins, G., & Kremer, P. (2010). The application of social network analysis
to team sports. Measurement in Physical Education and Exercise Science, 14, 211-224.
Martella, R., Nelson, J., & Marchand-Martella, N. (2003). Managing disruptive
behaviors in the schools. Boston, MA: Pearson Education. Marzano, R., Waters, T., & McNulty, B. (2005). School leadership that works: From research to results. Alexandria, VA: ASCD. Mash, E. J. & Dozois, D.J. A. (2003). Child psychopathology: A Developmental-systems perspective. In E. Mash, E.J. & R. Barkley (Eds.) Child Psychopathology (2nd edition; pp. 3-74). New York, NY: Guilford Press. Massachusetts Department of Elementary and Secondary Education [MA DESE]. (2014) School/district profile. Retrieved October 29, 2014 from http://profiles.doe.mass.edu/profiles/general.aspx?topNavId=1&orgcode=028100 00&orgtypecode=5& Mayer, G. R. (1995). Preventing antisocial behavior in the schools. Journal of Applied Behavior Analysis, 28(4), 467-478. McIntosh, K., Chard, D. J., Boland, J. B., & Horner, R. H. (2006). Demonstration of combined efforts in school-wide academic and behavioral systems and incidence of reading and behavior challenges in early elementary grades. Journal of Positive Behavior Interventions, 8, 146-154. McIntosh, K., Mercer, S., Frank, J., Turri, M., & Mathews, S. (2013). Factors related to sustained implementation of School-wide Positive Behavior Support. Exceptional Children, 79(3), 293-311. McIntosh, K., Flannery, K. B., Sugai, G., Braun, D. H., & Cochrane, K. L. (2008). Relationships between academics and problem behavior in the transition from middle school to high school. Journal of Positive Behavior Interventions, 10, 243- 255. McIntosh, K., Horner, R. H., Chard, D. J., Boland, J. B., & Good, R. H., III. (2006). The use of reading and behavior screening measures to predict nonresponse to school- wide positive behavior support: A longitudinal analysis. School Psychology Review, 35, 275-291. Merrell, K.W., & Buchanan, R. (2006). Intervention selection in school-based practice:

153
Using public health models to enhance systems capacity of schools. School Psychology Review, 35,167–180. Metzler, C., Biglan, A., Rusby, J., & Sprague, J. (2001). Evaluation of a comprehensive behavior management program to improve school-wide positive behavior support. Education and Treatment of Children, 24, 448-479. Moolenaar, N. (2012). A social network analysis perspective on teacher collaboration in
schools: Theory, methodology, and applications. American Journal of Education, 119(1), 7-39.
Moolenaar, N. & Daly, A. (2012). Social networks in education: Exploring the social side of the reform equation. American Journal of Education, 119,1-6. Moseley, S. F. (2004). Everett Rogers’ diffusion of innovations theory: Its utility and value in public health. Journal of Health Communication, 9, 149–151. Murray, C. (2009). Diffusion of innovation theory: A bridge for the research-practice gap
in counseling. Journal of Counseling and Development, 87, 108-116. Muscott, H. S., Mann, E. L., & LeBrun, M. R. (2008). Positive behavior interventions and supports in New Hampshire: Effects of large- scale implementation of School-wide Positive Behavior Support on student discipline and academic achievement. Journal of Positive Behavior Interventions,10, 190–205. Nahapiet, J., & Ghoshal, S. (1998). Social capital, intellectual capital, and the
organizational advantage. Academy of Management. The Academy of Management Review, 23(2), 242-266.
Nelson, J. R., Duppong Hurley, K., Synhorst, L., & Epstein, M. (2008). The Nebraska three-tiered behavioral prevention model case study. In C. Greenwood, T. Kratochwill, and M. Clements (Eds.). School-wide prevention models: Lessons learned in elementary schools (pp. 61–86). New York, NY: Guilford. Nelson, J. R., Martella, R., & Galand, B. (1998). The effects of teaching school expectations and establishing a consistent consequence on formal office disciplinary actions. Journal of Emotional and Behavioral Disorders, 6(3), 153– 161. Nelson, J. R., Martella, R.C. & Marchand-Martella., N.E. (2002). Maximizing student learning: The effects of a comprehensive school-based program for preventing disruptive behaviors. Journal of Emotional and Behavioral Disorders, 10, 136– 148. Newton, J. S., Algozzine, B., Algozzine, K., Horner, R. H., & Todd, A. W. (2011). Building local capacity for training and coaching data-based problem solving with

154
positive behavior intervention and support teams. Journal of Applied School Psychology, 27, 228- 245. Newton, J.S., Horner, R., Algozzine, B., Todd, A. W., & Algozzine, K. M. (2009). Using a problem-solving model for data-based decision making in schools. In W. Sailor, G. Dunlap, G. Sugai, & R. Horner (Eds.). Handbook of positive behavior support (pp. 551-580). New York, NY: Springer O'Malley, J.A., & Marsden, P. (2008). The analysis of social networks. Health Services
and Outcomes Research Methodology 8, (4), 222-269. Oldenburg, B.R., Sallis, J.F., French, M.L., & Owen, N. (1999). Health promotion
research and the diffusion and institutionalization of interventions. Health Education Research, 14, 121-130.
Ouimet, M., Landry, R., & Amara, N. (2004, June). Network positions and radical
innovation: A social network analysis of the Quebec optics and photonics cluster. Paper presented at the DRUID Summer Conference on Industrial Dynamics, Innovation and Development.
Papachristos, A. V. (2011, April 25). Social network analysis: A brief overview. Class
Lecture Special Presentation. University of Massachusetts Amherst School of Education, Amherst, Massachusetts.
Papachristos, A.V., Braga, A.A., & Hureau, D.M. (2012). Social networks and the risk of
gunshot injury. Journal of Urban Health, 89, 992-1001. Pappano, L. (2007). More than “making nice”: Getting teachers to (truly) collaborate. Harvard Education Letter, 23(2), 1-3.
Patton, M. (1997). Utilization-focused evaluation: The new century text. Thousand Oaks, CA: Sage.
Penuel, W. R., Sun, M., Frank, K. A., & Gallagher, H. A. (2012). Using social network analysis to study how collegial interactions can augment teacher learning from external professional development. American Journal of Education, 119(1), 103- 136. Penuel, W. R., Sussex, W., Korbak, C. & Hoadley, C. (2006). Investigating the potential of using social network analysis is educational evaluation. American Journal of Evaluation, 27, 437-451. Portes, A. (1998). Social capital: Its origins and applications in modern sociology. Annual Review of Sociology, 24, 1-24. Pinchot, G., & Pinchot, E. (1993). The intelligent organization: Engaging the talent & initiative of everyone in the workplace. San Francisco, CA: Berrett-Koehler Pub.

155
Pounder, D. G. (1998). Restructuring schools for collaboration: Promises and pitfalls. Albany, NY: SUNY Press.
Prell, C. (2011). Social network analysis: History, theory, and methodology. Thousand Oaks, CA: Sage Publishing. R Development Core Team. (2011). R: A language and environment for statistical computing. Vienna, Austria: R Foundation for Statistical Computing. Retrieved from http://www.R-Project.org. Rogers, E. M. (2003). Diffusion of innovations (5th edition). New York, NY: Simon and Schuster. Ryan, B., & Gross, N. C. (1943). The diffusion of hybrid seed corn in two Iowa
communities. Rural Sociology, 8, 15-24. Safran, S. P. (2006). Using the Effective Behavior Supports Survey to guide development of school-wide positive behavior support. Journal of Positive Behavior Interventions, 8, 3-9. Safran, S. P., & Oswald, K. (2003). Positive behavior supports: Can schools reshape disciplinary practices? Exceptional Children, 69(3), 361–373. Samet, M. (n.d.) Network theory. TED-Ed Originals. Retrieved November 7, 2014 at http://ed.ted.com/lessons/what-facebook-and-the-flu-have-in-common-marc- samet. Saunders, W. M., Goldenberg, C. N., & Gallimore, R. (2009). Increasing achievement by focusing grade-level teams on improving classroom learning: A prospective, quasi-experimental study of Title I schools. American Educational Research Journal, 46(4), 1006-1033. Schofield, M., Edwards, K. and Pearce, R. (1997) Effectiveness of two strategies for dissemination of sun-protective policy in New South Wales primary and secondary schools. Australian and New Zealand Journal of Public Health, 21, 743-750. Scott, J. (2000). Social network analysis. London, England, UK: Sage. Scott, J. (2013). Social processes in lobbyist agenda development: A longitudinal
network analysis of interest groups and legislation. The Policy Studies Journal, 41(4), 609-636.
Senge, P., N. Cambron-McCabe, T. Lucas, B. Smith, J. Dutton, and A. Kleiner. (2000). Schools that learn: A fifth discipline fieldbook for educators, parents, and everyone who cares about education. New York: Doubleday.

156
Shinn, M.R., Stoner, G. & Walker, H.M. (Eds.), Interventions for academic and behavior problems: Preventive and remedial approaches (pp. 1–26). Silver Spring, MD: National Association of School Psychologists. Shores, R. E., Jack, S. L., Gunter, P. L., Ellis, D. N., DeBriere, T. J., & Wehby, J. H. (1993). Classroom interactions of children with behavior disorders. Journal of Emotional and Behavioral Disorders 1, 27–39. Simmel, G. (1908/1971). On individuality and social forms. Chicago, IL: University of Chicago. Simonsen, B., Sugai, G., & Negron, M. (2008). School-wide positive behavior supports: Primary systems and practices. Teaching Exceptional Children, 40(6), 32-40. Skiba, R. J., & Peterson, R. (1999). The dark side of zero-tolerance: Can punishment lead to safe schools? Phi Delta Kappan, 80 (5), 372-382. Snyder, W. M., Wenger, E., & de Sousa Briggs, X. (2003). Communities of practice in government: Leveraging knowledge for performance. The Public Manager, 32(4), 17-22.
Song, S., Nerur, S., & Teng, J. (2007). An exploratory study on the roles of network structure and knowledge processing orientation in the work unit knowledge management. Advances in Information Systems, 38(2), 8-26. Spillane, J. & Min Kim, C. (2012). An exploratory analysis of formal school leaders’
positioning in instructional advice and information networks in elementary schools. American Journal of Education, 119(1), 73-102.
Sprague, J. & Walker, H. (2005). Safe and healthy schools: Practical prevention
strategies. New York: Guilford Press. Sprague, J., Walker, H., Golly, A., White, K., Myers, D.R., & Shannon, T. (2001). Translating research into effective practice: The effects of a universal staff and student intervention on indicators of discipline and school safety. Education and Treatment of Children, 24, 495-511.
Stevens, D., & Kahne, J. (2006). Professional communities and instructional improvement practices: A study of small high schools in Chicago. Unpublished report, University of Chicago Consortium on Chicago School Research.
Stiggins, R. (2005). Assessment for learning: Building a culture of confident learners. In R. DuFour, R. Eaker, & R. DuFour (Eds.), On common ground: The power of professional learning communities (pp. 155-175). Bloomington, IN: National Education Service.

157
Strein W., Hoagwood, K.E., & Cohn, A. (2003). School psychology: A public health perspective: I. Prevention, populations, and systems change. Journal of School Psychology, 41(1):23-38. Sugai, G., & Horner, R. H. (1999). Discipline and behavioral support: Preferred processes and practices. Effective School Practices, 17, 10-22. Sugai, G., & Horner, R.H. (2002). The evolution of discipline practices: School-wide positive behavior supports. Child and Family Behavior Therapy, 24, 23-50. Sugai, G., & Horner, R. H. (2006). A promising approach for expanding and sustaining school-wide positive behavior support. School Psychology Review, 35, 2, 245- 259. Sugai, G., & Horner, R. H. (2009). Responsiveness-to-intervention and school-wide positive behavior supports: Integration of multi-tiered approaches. Exceptionality, 17, 223-237. Sugai, G., Horner, R.H., & Todd, A.W. (2009). Self-Assessment Survey 3.0. Eugene, OR: Educational and Community Supports. http://www.pbis.org/evaluation-tools Sugai, G., Horner, R. H., Algozzine, R., Barrett, S., Lewis, T., Anderson, C., & Simonsen, B. (2010). School-wide positive behavior support: Implementers’ blueprint and self-assessment. Eugene, OR: University of Oregon, OSEP Technical Assistance Center on Positive Behavioral Interventions and Supports. Sugai, G., Horner, R. H., Fixsen, D., & Blase, K. (2010). Development system-level capacity for RtI implementation: Current efforts and future directions. In T. A. Glover & S. Vaughn (Eds.) The promise of Response to Intervention: Evaluating current science and practice (pp. 286-309). New York, NY: Guilford Press. Sugai, G., Horner, R. H., Lewis-Palmer, T., Rossetto Dickey, C. (2011). Team Implementation Checklist, Version 3.1. Eugene, OR: Educational & Community Supports, University of Oregon. Sulzer-Azaroff, B. & Mayer, G.R. (1991). Behavior analysis for lasting change. Fort Worth, TX: Harcourt Brace. Sulzer-Azaroff, B., & Mayer, G. R. (1994). Achieving educational excellence: Behavior analysis for achieving classroom and school-wide behavior change. San Marcos, CA: Western Image. Taylor, L., Nelson, P., & Adelman, H.S. (1999). Scaling-up reforms across a school district. Reading and Writing Quarterly, 15, 303-325.

158
Taylor-Greene, S., Brown, D., Nelson, L., Longton, J., Gassman, T., Cohen, J., Swartz, J., Horner, R. H., Sugai, G., & Hall, S. (1997). School-wide behavioral support: Starting the year off right. Journal of Behavioral Education, 7, 99-112.
Todd, A.W., Horner, R.H., Newton, J.S., Algozzine, R.F., Algozzine, K.M., & Frank, J.L. (2011). Effects of a Team Initiated Problem Solving on meeting practices of school-wide behavior support teams. Journal of Applied School Psychology, 27(1), 42-59. Tolan, P., & Guerra, N. (1994). What works in reducing adolescent violence: An empirical review of the field. Boulder, CO: Center for the Study and Prevention of Violence. Tonnies, F. (1955/1936). Gemeinschaft und Gesellschaft. East Lansing, MI: Michigan
State University. Tuomainen, J., Palonen, T. & Hakkarainen, K. (2010). A special education teacher’s
networks: A Finnish case. International Journal of Special Education, 25(1), 46-58.
U.S. Department of Health and Human Services. (2000). U.S. public health service, report of the Surgeon General’s conference on children’s MH: A national action agenda. Washington, D.C. Valli, L., & Buese, D. (2007). The changing roles of teachers in an era of high-stakes accountability. American Educational Research Journal, 44(3), 519-558. Walker, H. M., Horner, R. H., Sugai, G., Bullis, M., Sprague, J. R., Bricker, D., & Kaufman, M. H. (1996). Integrated approaches to preventing antisocial behavior patterns among school-age children and youth. Journal of Emotional and Behavioral Disorders, 4, 194-209. Wang, M. (1985). An analysis of program design implications for teacher and student use of time. In C.W. Fisher & D.C. Berliner, (Eds). Perspectives on instructional time (pp.55-70). New York, NY: Longman. Wang, A. & Zhang, X. (2012). A study of the correlation between online tutors’ social network position and their performance. Hybrid Learning Lecture Notes in Computer Science, 74(11), 351-361. Wasley, P.A., Fine, M., Gladden, M. Holland, N.E., King, S.P., Mosak, E., & Powell, L.C. (2000). Small schools: Great strides. New York, NY: Bank Street College of Education. Wasserman, S. & Faust, K. (1994). Social network analysis: Methods and applications.
Cambridge, UK: Cambridge University Press.

159
Wiese, L. & Mueller, H. (1931/1941). Sociology. New York, NY: O.Piest. Woodland, R., Whitcomb, S., & Barry, S. (under review). Examining school leadership team influence on degree and pace of school reform: A case study of PBIS implementation using social network analysis. Unpublished manuscript. Woodland, R. & Hutton, M. (2012). Evaluating organizational collaborations: Suggested entry points and strategies. American Journal of Evaluation, 33(3), 366-383. Woodland, R. and Mazur, R. (in press). Teacher teaming and professional development. In G. Scarlett (Ed.) Encyclopedia of Classroom Management: An A-Z Guide. Thousand Oaks, CA: SAGE Publications. Woodland, R.H., Barry, S.K., & Crotts Roohr, K.M. (2014). Using social network analysis to promote school-wide instructional innovation: A case study. Journal of School Leadership, 24, 114-144. Woodland, R., Lee, M.K., & Randall, J. (2013). A validation study of the Teacher Collaboration Assessment Survey. Educational Research and Evaluation, 19(5), 442-460. Zins, J. E., Weissberg, R. P., Wang, M. C., & Walberg, H. J. (Eds.) (2004). Building academic success on social and emotional learning: What does the research say? New York, NY: Teachers College Press. Zito, M. (2011). Is working together worth it?: Examining the relationship between the
quality of teacher collaboration, instruction, and student achievement. (doctoral dissertation). University of Massachusetts Amherst, Amherst, MA. Available at: http://proquest.umi.com/pqdweb?did=2423420471&sid=1&Fmt=2&clientId=70548&RQT=309&VName=PQD