Using Rasch to Develop and Validate an Assessment of ...
15
Using Rasch to Develop and Validate an Assessment of Students’ Progress on the Energy Concept Cari F. Herrmann-Abell, Joseph Hardcastle, George E. DeBoer AAAS Project 2061 Paper presented at the 2018 AERA Annual Conference New York, NY April 13-17, 2018 Abstract This paper describes the development and validation of a set of three assessment instruments that can be used to assess students’ progress on the energy concept (ASPECt) from fourth through twelfth grade. Rasch analysis techniques were used throughout the development process to guide the construction of an item bank and the selection of items for inclusion on the instruments. Rasch analysis techniques were also used to validate the instrument and design support materials to aid in the interpretation of student performance. A cross-sectional analysis was performed to determine the match between the instruments and students and revealed that currently the difficulties of intermediate and advanced instruments are greater than the average performance level of students in grades four through twelve. Wright maps and option probability curves were created to help users interpret student performance. 1. Objectives or purposes: Energy is an important concept in science education because it has applications in physical, life, and earth sciences, as well as in engineering and technology. In the Next Generation Science Standards (NGSS), it is considered both a disciplinary core idea and a crosscutting concept (NGSS Lead States, 2013). Therefore, it is essential to have assessments that can uncover what students do and do not know about energy and help monitor how students’ progress as they learn about energy. Several research-based energy assessments are available; however, their usefulness in locating K-12 students on a learning progression for energy is limited either because they were designed for only high school and university students (Ding, 2007; Singh & Rosengrant, 2003) or they target too narrow of a range of energy ideas (Wattanakasiwich, Taleab, Sharma, & Johnston, 2013; Lee & Liu, 2009). To address the need for a more general energy assessment for K-12 students, we developed a set of vertically-equated instruments that provide an overall picture of students’ energy understanding. This paper outlines the instrument development and validation process and the role Rasch analysis played. It also summarizes the findings from the data collected during the project and describes the support materials developed to aid in the interpretation of student performance.
Transcript of Using Rasch to Develop and Validate an Assessment of ...

Using Rasch to Develop and Validate an Assessment of Students’ Progress on the Energy Concept
Cari F. Herrmann-Abell, Joseph Hardcastle, George E. DeBoer
AAAS Project 2061
Paper presented at the
2018 AERA Annual Conference
New York, NY
April 13-17, 2018
Abstract
This paper describes the development and validation of a set of three assessment instruments that can be used to assess students’ progress on the energy concept (ASPECt) from fourth through twelfth grade. Rasch analysis techniques were used throughout the development process to guide the construction of an item bank and the selection of items for inclusion on the instruments. Rasch analysis techniques were also used to validate the instrument and design support materials to aid in the interpretation of student performance. A cross-sectional analysis was performed to determine the match between the instruments and students and revealed that currently the difficulties of intermediate and advanced instruments are greater than the average performance level of students in grades four through twelve. Wright maps and option probability curves were created to help users interpret student performance.
1. Objectives or purposes:
Energy is an important concept in science education because it has applications in physical, life, and earth sciences, as well as in engineering and technology. In the Next Generation Science Standards (NGSS), it is considered both a disciplinary core idea and a crosscutting concept (NGSS Lead States, 2013). Therefore, it is essential to have assessments that can uncover what students do and do not know about energy and help monitor how students’ progress as they learn about energy.
Several research-based energy assessments are available; however, their usefulness in locating K-12 students on a learning progression for energy is limited either because they were designed for only high school and university students (Ding, 2007; Singh & Rosengrant, 2003) or they target too narrow of a range of energy ideas (Wattanakasiwich, Taleab, Sharma, & Johnston, 2013; Lee & Liu, 2009). To address the need for a more general energy assessment for K-12 students, we developed a set of vertically-equated instruments that provide an overall picture of students’ energy understanding. This paper outlines the instrument development and validation process and the role Rasch analysis played. It also summarizes the findings from the data collected during the project and describes the support materials developed to aid in the interpretation of student performance.

Herrmann‐Abell, Hardcastle, & DeBoer, AERA 2018
2
2. Perspective(s) or theoretical framework:
Learning progressions have become essential for describing how students develop their understanding of science ideas. Corcoran et al. (2009) has described learning progressions as continuums of successively more sophisticated ways of thinking about a concept that develops over time. These progressions commonly have an upper level, or “upper anchor,” that describes the knowledge that students are expected to have when considered proficient. Below the upper anchor are a series of levels, or “steps along the way,” that students may follow as they learn the topic.
A number of studies have investigated learning progressions for the energy concept (Liu & Collard, 2005; Lee & Liu, 2010; Liu & McKeough, 2005). In these progressions, students are thought to progress in a linear fashion from understanding of energy as activity, to an understanding of energy forms, then energy transfer, and then energy dissipation. The upper anchor is considered to be an understanding of conservation of energy. More recently, researchers have proposed that students make progress by understanding aspects of multiple and interrelated energy concepts at the same time, not by mastering one concept before moving on to the next (Neumann, Viering, Boone, & Fischer, 2013). This is the model one finds in NGSS and is the model we used in developing our learning progression.
Once a learning progression is articulated, researchers must empirically validate it. Rasch analysis (Rasch, 1980) is a powerful tool for developing instruments that can be used to validate learning progressions (Wilson, 2009). In the dichotomous Rasch model, the probability that a student will respond to an item correctly is determined by the difference in the student’s performance level and the item’s difficulty. Student and item measures are expressed on the same interval scale and are mutually independent. If the data is shown to have good fit to the model, then the order of item difficulty represents the order in which students develop competency in the ideas being tested. Thus, the order of item difficulty can be used to validate a learning progression.
3. Methods
We took a construct-centered approach to assessment development similar to Evidence-Centered Design (Mislevy, Steinberg, & Almond, 2003) and Construct Modeling (Wilson, 2005). The foundation of these approaches is the development of a detailed description of the content to be assessed. Traditional assessment development approaches tend to omit the construct definition part and begin with the writing of items, which often leads to poor-quality assessments that focus on recognition or recall of facts and definitions. Having clear descriptions of the content brings the construct to be assessed to the forefront and helps ensure that the resulting assessments are actually assessing the construct and providing the evidence needed to determine a students’ performance level. The development process used to develop the ASPECt instruments is summarized below.
Construct Definition. The concept of energy is commonly separated into four categories: (1) Energy Forms and Transformations; (2) Energy Transfer; (3) Energy Dissipation and Degradation; and (4) Energy Conservation (e.g. Duit, 2014). In our study, we divided the Energy Forms and Transformations category into five forms of energy along with the idea of energy

Herrmann‐Abell, Hardcastle, & DeBoer, AERA 2018
3
transformations itself, and we expanded the Energy Transfer category into six specific mechanisms of energy transfer (see Table 1).
Table 1: Energy Ideas Targeted by the Assessment ItemsIdeas about the Forms of Energy Ideas about Energy Transfer Other Energy Ideas
Kinetic Energy Conduction Energy ConservationThermal Energy Convection Energy Dissipation Gravitational Potential Energy Radiation & DegradationElastic Potential Energy Transferring Energy by ForcesChemical Energy Transferring Energy ElectricallyEnergy Transformations Transferring Energy by Sound
For each idea, we described a learning progression that, for most ideas, was made up of three levels. The basic level of the progression focuses on simple energy relationships and easily observable effects of energy processes, similar to the elementary expectations in NGSS. The next level, the intermediate level, focuses on more complex energy concepts and corresponds to the middle school NGSS expectations. The upper anchor, the advanced level, focuses on still more complex energy concepts, often requiring an atomic/molecular model to explain phenomena. The advanced level covers many of the high school NGSS expectations. For example, the basic level idea for conduction states that when warmer things are touching cooler ones, the warmer things get cooler and the cooler things get warmer until they all are the same temperature. The intermediate level expects students to know that conduction is the transfer of energy that occurs when a warmer object comes in contact with a cooler object without a transfer of matter. Finally, the advanced level expects students to know that energy is transferred by conduction by the random collisions of atoms and molecules that make up the objects. See Appendix A for descriptions of the levels for each energy idea.
Item Bank Development. Item development followed an iterative procedure that involved input and feedback from a number of sources (Herrmann-Abell & DeBoer, 2014). Initially, multiple-choice items aligned to the different ideas and levels on the learning progression were drafted using common student misconceptions as distractors (Sadler, 1998). Sample items aligned to the progression for conduction are shown in Figure 1. The items were then pilot tested with students from across the county and evaluated by a panel of external reviewers. During the pilot test, students were asked to select what they thought was the correct response to the item and to answer follow-up questions about the item (DeBoer, Herrmann-Abell, Gogos, Michiels, Regan, & Wilson, 2008). The follow-up questions provided information about how well the item was performing, including information about what knowledge the students were using to answer the question and any difficulties they had in understanding the question. During the panel review, scientist, science education experts, and classroom teachers evaluated the items’ scientific accuracy and flagged construct irrelevant features. The items were revised and then field tested with a larger group of students. Rasch analysis was used to evaluate their psychometric properties and build the final item bank of 372 items.

Herrmann‐Abell, Hardcastle, & DeBoer, AERA 2018
4
Figure 1: Sample items aligned to the progression for conduction

Herrmann‐Abell, Hardcastle, & DeBoer, AERA 2018
5
Instrument Development. The Rasch measures obtained from the field test data, along with the construct definition, were used to inform the selection of items for the instruments. Three instruments, each made up of 35 items, were drafted. The basic test includes mostly items that assess the basic level of each of the energy ideas. The intermediate test consists of primarily intermediate items and the advanced test consists of primarily advanced items. There were two items that appeared on all three tests, three items that appeared on the basic and intermediate tests, and three items that appeared on the intermediate and advanced tests. The instruments were then pilot tested to determine how well the items perform as sets. Rash analysis was used to evaluate the draft instruments (Hardcastle, Herrmann-Abell, & DeBoer, 2017). Differential item functioning and cross-plotting of item difficulties indicated that two linking items were not performing well. The instruments were revised to replace these items. On the final versions, five items link the basic and intermediate versions and five items link the intermediate and advanced versions. In addition, it was decided that item difficulties would be anchored to the full data set so that all of the items in the bank would be on the same scale. Finally, the revised instruments were field tested and the comparability of computer-based and paper-based versions of the instruments was investigated. The comparability study results indicated that scores from the computer-based version and paper-based versions can be considered equivalent (Herrmann-Abell, Hardcastle, & DeBoer, 2018).
Support Material. In order to support users in interpreting the results of the instruments, support materials, including raw score to Rasch scale score tables, Wright maps, and option probability curves, were developed.
Raw score to Rasch scale score tables. Because we cannot expect users of our instruments to conduct their own Rasch analysis, we developed a conversion table from raw scores to Rasch scale scores. These scaled scores are based on the assumption that students’ response patterns follow a Guttman pattern, where if a student responds correctly to a particular item, they also respond correctly to the items that are easier. Common Rasch units of analysis are logits (log odds units) which range from approximately -3.0 to 3.0 for most respondents, with a mean score of zero. Because reporting scores as negative numbers can be confusing, we utilized a transformation to express all possible student performance with positive numbers ranging from 200 to 800.
Wright maps. We constructed Wright maps that help provide a more qualitative meaning to the scale scores. A Wright map can be considered a visual depiction of the learning progression for a construct. On the map, a vertical line is drawn to represent the scale. Students’ performance level is commonly shown on the left-hand side, and item difficulties are shown on the right-hand side. Less knowledgeable students and easier items are toward the bottom of the map, and more knowledgeable students and harder items are toward the top of the map. When a user finds a student’s scale score on the map, they can determine where the student is on the progression, that is, what energy ideas have they mastered, what ideas are they developing, and what ideas have they yet to learn. When a student’s performance level matches an item’s difficulty, the student has a 50% chance of successfully responding to that item. Therefore, the student is more likely to respond correctly to items with a lower difficulty and less likely to respond correctly to items with a higher difficulty.
Option probability curves. Option probability curves plot the probability that students will select each answer choice as a function of their Rasch scale score. With traditional analysis of multiple-choice items, curves are often generated for correct and incorrect answers, and the results show

Herrmann‐Abell, Hardcastle, & DeBoer, AERA 2018
6
two sigmoidal curves that cross. Because the focus is on whether or not the student selected the correct answer, all of the incorrect answer choices are lumped together. The curve corresponding to the correct answer typically increases monotonically while the curve for the set of distractors typically decreases monotonically with increasing student understanding (Haladyna, 1994). Past research has shown that the curves for distractor-driven items do not match the monotonic behavior of traditional items (Sadler, 1998; Herrmann-Abell & DeBoer, 2011; Wind & Gale, 2015). With distractor-driven multiple-choice items, therefore, it is important to look at the curves for each answer choice because the shape of the curves provides information about what types of students (in terms of their overall understanding) are more likely to select each answer choice, how persistent the misconception represented by the answer choice is, and how the popularity of the answer choice compares to other answer choices. Thus, analyzing the option probability curves for each answer choice provides additional information that is not available when the incorrect answers are analyzed in combination. This information can be used to raise teachers’ awareness of misconceptions, which may help them better select and sequence appropriate instructional activities and respond to the needs of their students.
4. Data sources and Rasch fit
The data set used to determine the anchored item measures was comprised of three separate sources; the item field test, the instrument pilot test, and the instrument field test. A total of 30,811 students from 45 states and Puerto Rico were included in the set (see Table 2). A sample of university students who were likely to have the knowledge being targeted by the items were included as a way of further validating the items. All of the students were studying science but not necessarily energy at the time of testing.
Table 2: Demographic information for the anchoring data set
Item
Field TestInstrument Pilot Test
Instrument Field Test Total
Year Spring 2015 Winter 2016 Fall 2016 Grade Band
4th-5th 2967 (14%) 470 (11%) 848 (15%) 4285 (14%)6th-8th 10390 (50%) 1651 (39%) 2425 (43%) 14466 (47%)9th-12th 7414 (36%) 1895 (44%) 2408 (42%) 11717 (38%)University/College 0 (0%) 244 (6%) 0 (0%) 244 (1%)
Gender Female 51% 53% 54% 52% Male 49% 47% 46% 48%
Primary Language English 89% 88% 92% 89% Not English 11% 12% 8% 11%
WINSTEPS (Linacre, 2016) was used to estimate Rasch student and item measures. The data’s fit to the Rasch model was evaluated using the separation indices, infit and outfit mean-squares, standard errors, and point-measure correlations. Two items were found to have outfit mean-square values greater than 1.4, indicating unexpected responses to these items, and two items had point-measure correlations less than zero, indicating their score responses may not correlate with student knowledge. To improve the data’s fit to the model, we followed an approach described
Herrmann‐Abell, Hardcastle, & DeBoer, AERA 2018
7
by Andrich, Marais, & Humphry (2012) in which students’ responses with large z-residual values are replaced with missing data. We replaced all responses with z-residuals greater than 4 resulting in a total of 648 responses being replaced with missing data.
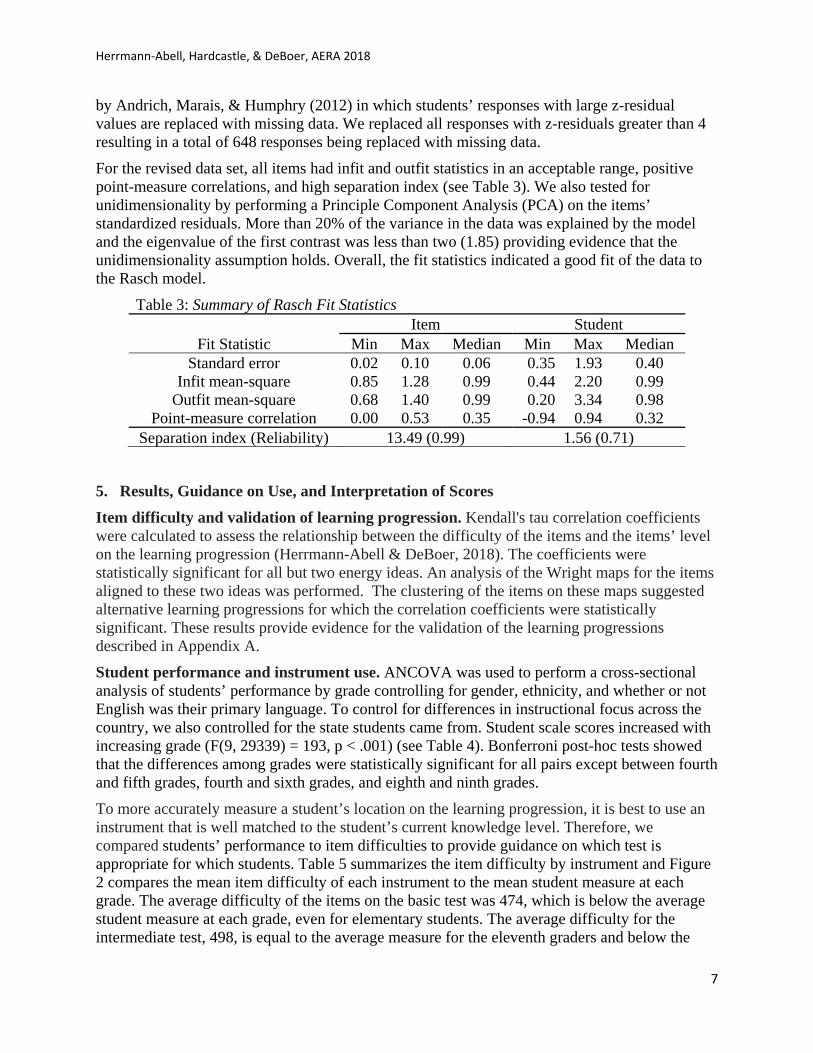
For the revised data set, all items had infit and outfit statistics in an acceptable range, positive point-measure correlations, and high separation index (see Table 3). We also tested for unidimensionality by performing a Principle Component Analysis (PCA) on the items’ standardized residuals. More than 20% of the variance in the data was explained by the model and the eigenvalue of the first contrast was less than two (1.85) providing evidence that the unidimensionality assumption holds. Overall, the fit statistics indicated a good fit of the data to the Rasch model.
Table 3: Summary of Rasch Fit Statistics Item Student
Fit Statistic Min Max Median Min Max MedianStandard error 0.02 0.10 0.06 0.35 1.93 0.40
Infit mean-square 0.85 1.28 0.99 0.44 2.20 0.99Outfit mean-square 0.68 1.40 0.99 0.20 3.34 0.98
Point-measure correlation 0.00 0.53 0.35 -0.94 0.94 0.32Separation index (Reliability) 13.49 (0.99) 1.56 (0.71)
5. Results, Guidance on Use, and Interpretation of Scores
Item difficulty and validation of learning progression. Kendall's tau correlation coefficients were calculated to assess the relationship between the difficulty of the items and the items’ level on the learning progression (Herrmann-Abell & DeBoer, 2018). The coefficients were statistically significant for all but two energy ideas. An analysis of the Wright maps for the items aligned to these two ideas was performed. The clustering of the items on these maps suggested alternative learning progressions for which the correlation coefficients were statistically significant. These results provide evidence for the validation of the learning progressions described in Appendix A.
Student performance and instrument use. ANCOVA was used to perform a cross-sectional analysis of students’ performance by grade controlling for gender, ethnicity, and whether or not English was their primary language. To control for differences in instructional focus across the country, we also controlled for the state students came from. Student scale scores increased with increasing grade (F(9, 29339) = 193, p < .001) (see Table 4). Bonferroni post-hoc tests showed that the differences among grades were statistically significant for all pairs except between fourth and fifth grades, fourth and sixth grades, and eighth and ninth grades.
To more accurately measure a student’s location on the learning progression, it is best to use an instrument that is well matched to the student’s current knowledge level. Therefore, we compared students’ performance to item difficulties to provide guidance on which test is appropriate for which students. Table 5 summarizes the item difficulty by instrument and Figure 2 compares the mean item difficulty of each instrument to the mean student measure at each grade. The average difficulty of the items on the basic test was 474, which is below the average student measure at each grade, even for elementary students. The average difficulty for the intermediate test, 498, is equal to the average measure for the eleventh graders and below the

Herrmann‐Abell, Hardcastle, & DeBoer, AERA 2018
8
average measures for twelfth grade and university students. The average difficulty for the advanced test, 521, is above the average student measure at each grade. Based on this, we would suggest that users begin with using the basic test with elementary and middle school students and the intermediate test with high school students. After instruction on the energy concept, we would recommend retesting using the next level up to assess student’s progress.
Table 4: Estimated Marginal Student Means by Grade
Grade band Mean Student
Measure Std. Error95% Confidence Interval
Lower Bound Upper Bound 4th 477 .80 475 478 5th 476 .70 474 477 6th 479 .54 478 480 7th 482 .49 481 483 8th 486 .47 485 487 9th 488 .60 487 489
10th 493 .58 491 494 11th 498 .59 496 499 12th 502 .88 500 503
University 509 2.25 504 513
Table 5: Mean Rasch Item Difficulty by InstrumentInstrument Min Max Mean SD
Basic 416 557 474 32Intermediate 438 552 498 29
Advanced 466 579 521 26
Figure 2: Mean Rasch scale score by grade compared to mean Rasch item difficulty by test
Wright maps. Wright maps provide a visual depiction of the learning progression for each energy idea and allow for a more qualitative interpretation of a student’s score. Figure 3 shows a sample map for the items aligned to conduction. The numbers on the left are the Rasch scale scores. Instead of listing individual items on the right side of the map, we grouped together the

Herrmann‐Abell, Hardcastle, & DeBoer, AERA 2018
9
items that targeted the same idea. The boxes on the right outline the range of item difficulty for the items assessing the idea described in the box. A user can locate a student’s scale score on the left and then draw a line to the right to see what boxes correspond to that score. For example, a score of 490 cuts through the lower edges of the top two boxes. This means that the student has a greater than 50% chance of responding correctly to the items assessing the idea in the box below 490 and suggests that this student is likely proficient in this idea (the more phenomenological basic level understanding of conduction). Because 490 cuts through the bottom of the intermediate box, it is likely that this student is still developing this idea. We can also conclude that this student has likely not mastered the advanced level idea because 490 is far below the advanced level idea box.
Rasch Scale Score
590 585 580 575 570 565 560
555
Energy is transferred by conduction through a material by the random collisions of atoms and molecules that make up
the material.
550
545
540
535
Conduction is the transfer of energy that occurs when
a warmer object (or sample of matter) comes in
contact with a cooler object (or sample of
matter) without a transfer of matter.
530
525
520
515
510
505 500
495
490
485
480 When two things touch, the warmer things get cooler and the cooler things get warmer until they all are the same
temperature.
475
470
465
460
455 450 445 440 435 430 425 420 415
Basic Intermediate Advanced
Figure 3: Wright map for items aligned to conduction.
Option probability curves. Like the Wright maps, option probability curves provide a more qualitative interpretation of students’ scores. Option probability curves for items that include misconceptions as distractors provides insight into how students’ misconceptions change as they become more knowledgeable about energy. Figure 4 shows an example item aligned to the

Herrmann‐Abell, Hardcastle, & DeBoer, AERA 2018
10
advanced conduction idea and its corresponding option probability curves. In this item, students are asked to describe how energy is transferred through a rod that is being heated at one end. Answer choice A describes the transfer as resulting from the rubbing of the atoms against one another, which is related to the misconception that thermal energy is produced by atoms rubbing against one another (Kesidou & Duit, 1993; Wiser, 1986). Answer choice B is aligned to the misconception that during conduction, energy is transferred by the movement of matter from a hotter region to a colder region. Answer choice D is related to the misconceptions that heat is like a massless liquid that diffuses through matter (Chiou & Anderson, 2010) and that atoms that make up a solid cannot move (Lee et al., 1993; Novak & Musonda, 1991). The option probability curves show that students at the lower end of the scale are almost equally likely to select between answer choices B and D. The curve for answer choice D (heat moves, atoms don’t) decreases steadily with increasing score, whereas the curve for answer choice B (atoms move from the hotter end to the cooler end) stays constant over much of the scale. Answer choice A (atoms rubbing) is not as popular as the other distractors and decreases along with answer choice D. This indicates that as students learn more about energy, they become less likely to hold the misconceptions associated with answer choices A and D, but they do not seem to let go of the misconception associated with answer choice B until they reach the high end of the scale (around 570).
Figure 4: Sample conduction item and option probability curves

Herrmann‐Abell, Hardcastle, & DeBoer, AERA 2018
11
6. Significance
The instruments developed for this project fill the need for an assessment to measure 4-12 students’ understanding of energy. The instruments and support materials will be made available on our website, assessment.aaas.org. Use of the instruments will allow teachers to accurately diagnose their students’ thinking and misconceptions, which will help inform instruction. Researchers can use the instruments to objectively evaluate the effectiveness of curriculum materials and instructional approaches because the instrument is carefully aligned to ideas contained in national content standards and not to any single instructional approach or curriculum.
The research conducted as part of this project contributes to a fuller awareness of the complexity of the energy concept and how students’ understanding of it progresses by providing an empirically validated learning progression and associated assessments to measure students’ growth from grade four to grade twelve. Additionally, this study contributes to more effective use of Rasch in the development of instruments for assessing science learning, in particular, using Rasch to investigate the progression of understanding across grade bands and to reveal how misconceptions change as a function of performance level.
Acknowledgements
The research reported here was supported by the Institute of Education Sciences, U.S. Department of Education, through Grant R305A120138 to the American Association for the Advancement of Science. The opinions expressed are those of the authors and do not represent the views of the Institute or the U.S. Department of Education.
References
Andrich, D., Marais, I., & Humphry, S. (2012). Using a theorem by Andersen and the dichotomous Rasch model to assess the presence of random guessing in multiple choice items. Journal of Educational and Behavioral Statistics, 37(3), 417-442.
Chiou, G. L., & Anderson, O. R. (2010). A study of undergraduate physics students’ understanding of heat conduction based on mental model theory and an ontology–process analysis. Science Education, 94, 825-854.
Corcoran, T., Mosher, F. A., & Rogat, A. (2009). Learning progressions in science: An evidence-based approach to reform. New York, NY: Columbia University, Teachers College, Center on Continuous Instructional Improvement.
DeBoer, G. E., Herrmann-Abell, C. F., Gogos, A., Michiels, A., Regan, T., & Wilson, P. (2008). Assessment linked to science learning goals: Probing student thinking through assessment. In J. Coffey, R. Douglas, & C. Stearns (Eds.), Assessing student learning: Perspectives from research and practice (pp. 231-252). Arlington, VA: NSTA Press.
Ding, L. (2007). Designing an Energy Assessment to Evaluate Student Understanding of Energy Topics (Doctoral dissertation). Retrieved from NCSU Libraries, https://repository.lib.ncsu.edu/handle/1840.16/4050
Herrmann‐Abell, Hardcastle, & DeBoer, AERA 2018
12
Duit, R. (2014). Teaching and learning the physics energy concept. In R. F. Chen, A. Eisenkraft, D. Fortus, J. Krajcik, K. Neumann, J. Nordine, & A. Scheff (Eds.). Teaching and learning of energy in K-12 education (pp. 67-85). New York: Springer.
Hardcastle, J., Herrmann-Abell, C. F., & DeBoer, G. E. (2017, April). Validating an Assessment for Tracking Students’ Growth in Understanding of Energy from Elementary School to High School. Paper presented at the 2017 NARST Annual International Conference, San Antonio, TX.
Herrmann-Abell, C. F., & DeBoer, G. E. (2014). Developing and using distractor-driven multiple-choice assessments aligned to ideas about energy forms, transformation, transfer, and conservation. In R. F. Chen, A. Eisenkraft, D. Fortus, J. Krajcik, K. Neumann, J. Nordine & A. Scheff (Eds.), Teaching and learning of energy in K – 12 Education (pp. 103-133). New York: Springer.
Herrmann-Abell, C. F., & DeBoer, G. E. (2018). Investigating a learning progression for energy ideas from upper elementary through high school. Journal of Research in Science Teaching, 55(1), 68-93.
Herrmann-Abell, C. F., Hardcastle, J., & DeBoer, G. E. (2018, March). Comparability of Computer-Based and Paper-Based Science Assessments. Paper presented at the 2018 NARST Annual International Conference, Atlanta, GA.
Kesidou, S., & Duit, R. (1993). Students’ conceptions of the second law of thermodynamics—An interpretive study. Journal of Research in Science Teaching, 30(1), 85–106.
Lee, O., Eichinger, D. C., Anderson, C. W., Berkheimer, G. D., & Blaskeslee, T. D. (1993). Changing middle school students’ conceptions of matter and molecules. Journal of Research in Science Teaching, 30(3), 249–270.
Lee, H.-S., & Liu, O. L. (2009). Assessing learning progression of energy concepts across middle school grades: The knowledge integration perspective. Science Education, 94(4), 665–688.
Linacre, J. M. (2016). WINSTEPS Rasch measurement computer program. Version 3.92.1. Beaverton, Oregon: Winsteps.com.
Liu, X., & Collard, S. (2005). Using the Rasch model to validate stages of understanding the energy concept. Journal of Applied Measurement, 6(2), 224–241.
Liu, X., & McKeough, A. (2005). Developmental growth in students’ concept of energy: Analysis of selected items from the TIMSS database. Journal of Research in Science Teaching, 42(5), 493–517.
Mislevy, R.J., Steinberg, L.S., & Almond, R.A. (2003). On the structure of educational assessments. Measurement: Interdisciplinary Research and Perspectives, 1, 3-67.
Neumann, K., Viering, T., Boone, W. J., & Fischer, H. E. (2013). Towards a learning progression of energy. Journal of Research in Science Teaching, 50(2), 162–188.
NGSS Lead States. (2013). Next generation science standards: For states, by states. Washington, DC: The National Academies Press.

Herrmann‐Abell, Hardcastle, & DeBoer, AERA 2018
13
Novak, J. D., & Musonda, D. (1991). A twelve-year longitudinal study of science concept learning. American Educational Research Journal, 28, 117–153.
Sadler, P.M. (1998). Psychometric models of student conceptions in science: Reconciling qualitative studies and distractor-driven assessment instruments. Journal of Research in Science Teaching, 35(3), 265-296.
Singh, C., & Rosengrant, D. (2003). Multiple-choice test of energy and momentum concepts. American Journal of Physics, 71(6), 607–617.
Rasch, G. (1980). Probabilistic models for some intelligence and attainment tests. (Expanded ed.). Chicago: University of Chicago Press (Original work published 1960).
Wattanakasiwich, C., Taleab, P., Sharma, M., & Johnston, I. D. (2013). Development and implementation of a conceptual survey in thermodynamics. International Journal of Innovation in Science and Mathematics Education, 21(1), 29-53, 2013.
Wilson, M. (2005). Constructing measures: An item response modeling approach. Mahwah, NJ: Erlbaum.
Wilson, M. (2009). Measuring progressions: Assessment structures underlying a learning progression. Journal of Research in Science Teaching, 46(6), 716–730.
Wiser, M. (1986). The differentiation of heat and temperature: An evaluation of the effect of microcomputer teaching on students’ misconceptions. Cambridge, MA: Harvard Graduate School of Education.

Herrmann‐Abell, Hardcastle, & DeBoer, AERA 2018
14
Appendix A Energy Ideas Assessed by the Instruments
Energy Idea Basic level Intermediate level Advanced level Kinetic Energy The amount of energy an object
has depends on how fast it is moving.
The amount of kinetic energy (motion energy) an object has depends on the speed and the mass of the object.
The amount of kinetic energy (motion energy) an object has is proportional to the mass of the object and increases rapidly with increasing speed.
Thermal Energy The amount of energy an object has depends on how warm it is.
The amount of thermal energy an object has depends on the temperature and the mass of the object and the material of which the object is made.
The amount of thermal energy an object has depends on the disordered motions of its atoms or molecules and the number and types of atoms or molecules of which the object is made.
Gravitational Potential Energy
The amount of energy an object has depends on how high it is above the surface of the earth.
The gravitational potential energy of an object near the surface of the earth is related to the distance the object is above the surface of the earth (or an alternate reference point), and the mass of the object.
Gravitational potential energy is associated with the separation of mutually attracting masses.
Elastic Potential Energy
The amount of energy an elastic object has depends on how much the object is stretched, compressed, twisted, or bent.
The amount of elastic potential energy an elastic object has is related to the amount the object is stretched or compressed and how difficult it is to stretch or compress the object.
The amount of elastic potential energy stored in a stretched or compressed elastic object increases when the object is further stretched or compressed because stretching and compressing an object changes the distances between the atoms and molecules that make up the object.
Chemical Energy
Energy is released when fuel is burned. Energy is also released when food is used as fuel in animals.
Some chemical reactions release energy into the surroundings, whereas other chemical reactions take in energy from the surroundings.
Chemical energy is associated with the arrangement of atoms that make up the molecules of the reactants and products of a chemical reaction. Because the arrangement of atoms making up the molecules is different before and after the chemical reaction takes place, the amount of chemical energy in the system is also different.
Energy Transformations
Most of what goes on in the universe—from exploding stars and biological growth to the operation of machines and the motion of people—involves some form of energy being converted into one or more other forms of energy.

Herrmann‐Abell, Hardcastle, & DeBoer, AERA 2018
15
Appendix A continued. Energy Ideas Assessed by the Instruments Energy Idea Basic level Intermediate level Advanced levelTransferring Energy by Conduction
When warmer things are touching cooler ones, the warmer things get cooler and the cooler things get warmer until they all are the same temperature.
Conduction is the transfer of energy that occurs when a warmer object (or quantities of a solid, liquid, or gas) comes in contact with a cooler object (or quantities of a solid, liquid, or gas) without a transfer of matter.
Energy is transferred through a material by conduction by the random collisions of atoms and molecules that make up the material.
Transferring Energy by Convection
When air or water moves to another location, it can change the temperature of the air or water at that location.
Temperature variations in fluids such as air and water lead to currents that circulate the fluid and transfers energy from place to place in the fluid
In a fluid, regions that have different temperatures have different densities. The differences in density lead to an imbalance between the downward gravitational force and upward (buoyant) forces exerted by the surrounding fluid, creating currents that contribute to the transfer of energy.
Transferring Energy by Radiation
When light shines on an object, the object typically gets warmer.
Light transfers energy from a light source to a receiver.
Energy can be transferred by electromagnetic radiation.
Transferring Energy by Forces
When objects collide, the contact forces can transfer energy from one object to another resulting in a change in the objects’ motion.
Energy is transferred mechanically whenever an object exerts a force, either by contact or at a distance, on another object.
When two objects change relative position as a result of a gravitational, magnetic, or electric force, the potential and kinetic energies of the system change.
Transferring Energy Electrically
Energy can be transferred electrically when an electrical source is connected in a complete circuit to an electrical device.
Electrostatic potential energy can be stored in the separation of charged objects.
Transferring Energy by Sound
Sound can transfer energy from one location to another. Energy is transferred by sound because of coordinated collisions between the atoms or molecules that make up the medium through which the sound travels.
Energy Dissipation & Degradation
Objects tend to get warmer when use or take in energy or when they interact with each other.
Transformations and transfers of energy within a system usually result in some energy being released into its surrounding environment causing an increase in the thermal energy of the environment.
Unless prevented from doing so, energy will become uniformly distributed.
Conservation of Energy
Everything has energy. A decrease in energy in one object or set of objects always is accompanied by an increase in energy in another object or set of objects.
Regardless of what happens within a system, the total amount of energy in the system remains the same unless energy is added to or released from the system.