Using Packages and the Scipy Stackcs.brown.edu/courses/cs004/lectures/lec22.pdf · NumPy- what...
32
Using Packages and the Scipy Stack Scientific Computing in Python Slides adopted with permission from CS4670/5670 – Introduction to Computer Vision @ Cornell University http://www.cs.cornell.edu/courses/cs4670/2018sp/
Transcript of Using Packages and the Scipy Stackcs.brown.edu/courses/cs004/lectures/lec22.pdf · NumPy- what...

Using Packages and the Scipy StackScientific Computing in Python
Slides adopted with permission from CS4670/5670 – Introduction to Computer Vision @ Cornell Universityhttp://www.cs.cornell.edu/courses/cs4670/2018sp/

What are Packages?• Packages (aka libraries) are independent pieces of
software that can be imported into Python ● Built-in packages come with Python: random, math, os, sys,
multiprocessing/multithreading, subprocess ● Outside packages are coded by developers outside of the
main python organization ● Scipy Stack: Numpy, Pandas, Scipy, Matplotlib, IPython, Sympy● Astropy, Biopy, RDKit etc.● Tensorflow, Keras, NLTK, scikit-learn etc.● MPI, CUDA etc.
2

Why use Packages?• As a programming
scientist/engineer etc., you are not a computer scientist ● All you care is that code
works (accuracy) and it runs in reasonable time
● DON’T REINVENT THE WHEEL
3

Why learn programming?• Extend the function of packages and outside
software● This is why OOP is so important- inheritance and
abstraction• Connect various packages together
● Rarely will a single package have what you need specifically
• Occasionally, write completely novel code
4

Managing Packages•Multiple types of package managers●Most common is pip, (i.e pip
install <some package>)● Most usage, but also low level and
kind of tempermental ●Alternative solution: conda● Less usage, but still has a majority of
packages that you are likely to use● Straight forward, can separate
different packages into different environments
● Install instructions generally on the github page for the package
5

Using Packages•After installing them, import them at the top of your code●Only import what you need- if you need 1 function from
a package, only import that single package●You can shorten the names of packages using the as
keyword- this can be useful for names that are really long ● Some common shorthand that you will see:
● import numpy as np● from matplotlib import pyplot as plt● import math.random as random
6

You’ll end up using A LOT of packages• Packages depend on other packages
● You won’t use many backend packages, but they are necessary for running primary packages
● Version control issues - some packages require older versions of code, some require newer versions - this is why you should use Anaconda to make environments
7

Pros of Packages• Most features are already built for you
● Faster and more accurate than what the majority of people can code
• Wide development base means more brains
• Generally extensible and can be combined together in multiple packages
8

Cons of Packages• Bugs are really hard to track down
● You did not write the code so you have no clue where to look
● Many packages of scientific code are maintained by generations of PhD students- nobody has any clue which code does what after a while or the package dies when the person graduates :(
• Version control can be tough- some packages need some dependencies in very specific versions
• Stuck with stupid developer decisions
9

Con Example
10

The SciPy Stack
11

NumPy- what makes Python useful• NumPy is a numerical computation library for
Python● Basically gives it the power of fast
vector/matrix-based computation- this is similar to Matlab
● Syntax is also incredibly similar to Matlab (still 0 indexed like true CS!)
• Every single useful package in ML/ deep learning/ most scientific computation will use NumPy for numerical computation
12

NumPy- nuts and bolts• Built upon C (this means it is fast)• Standard data type- the ndarray
● Homogenous typing● In general, preallocated memory
• 1000 x 1000 matrix multiply● Python triple loop takes > 10 min.● Numpy takes ~0.03 seconds
13
No One:Absolutely No One:Me: import numpy as np

ArraysStructured lists of numbers.
•Vectors
•Matrices
•Images
•Tensors
•ConvNets
14

Arrays, creation•np.ones, np.zeros
•np.arange
•np.concatenate
•np.astype
•np.zeros_like, np.ones_like
•np.random.random
15
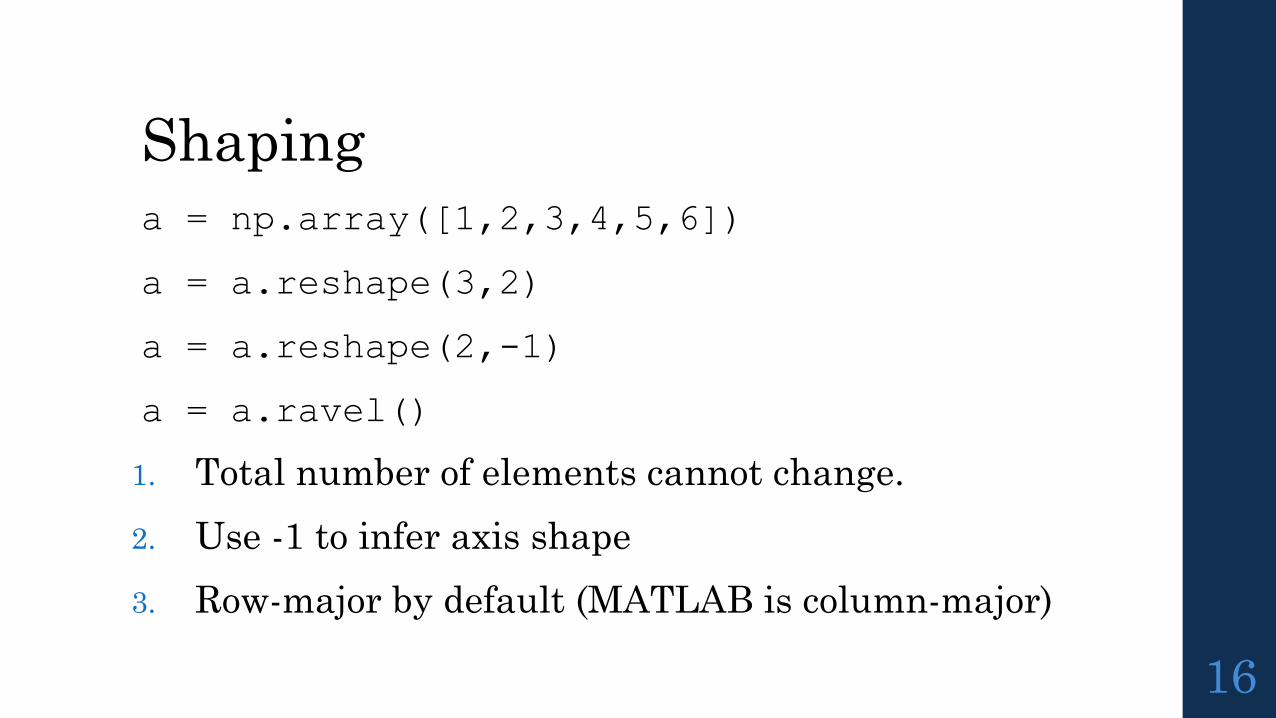
Shapinga = np.array([1,2,3,4,5,6])
a = a.reshape(3,2)
a = a.reshape(2,-1)
a = a.ravel()
1. Total number of elements cannot change.
2. Use -1 to infer axis shape
3. Row-major by default (MATLAB is column-major)
16
Math, universal functionsAlso called ufuncs
Element-wise
Examples:●np.exp●np.sqrt●np.sin●np.cos●np.isnan
17
Math, universal functionsAlso called ufuncs
Element-wise
Examples:●np.exp●np.sqrt●np.sin●np.cos●np.isnan
18

Math, universal functionsAlso called ufuncs
Element-wise
Examples:●np.exp●np.sqrt●np.sin●np.cos●np.isnan
19

Indexingx[0,0] # top-left element
x[0,-1] # first row, last column
x[0,:] # first row (many entries)
x[:,0] # first column (many entries)
Notes:●Zero-indexing●Multi-dimensional indices are comma-separated (i.e., a
tuple)
20

Indexing, slices and arraysI[1:-1,1:-1] # select all but one-pixel border
I = I[:,:,::-1] # swap channel order
I[I<10] = 0 # set dark pixels to black
I[[1,3], :] # select 2nd and 4th row
1. Slices are views. Writing to a slice overwrites the original array.
2. Can also index by a list or boolean array.
21

Python SlicingSyntax: start:stop:step
a = list(range(10))
a[:3] # indices 0, 1, 2
a[-3:] # indices 7, 8, 9
a[3:8:2] # indices 3, 5, 7
a[4:1:-1] # indices 4, 3, 2 (this one is tricky)
22

Axesa.sum() # sum all entries
a.sum(axis=0) # sum over rows
a.sum(axis=1) # sum over columns
a.sum(axis=1, keepdims=True)
1. Use the axis parameter to control which axis NumPy operates on
2. Typically, the axis specified will disappear, keepdims keeps all dimensions
23

SciPy• SciPy furthers many of the elements of NumPy
● Built on top of the array structure in NumPy● Includes features like:
● FFT● Clustering Algorithms● Linear Algebra routines beyond NumPy● Useful tools for engineers
24

Pandas• Pandas makes tables
● Great for manipulating labeled data and time series data
● As opposed to numerical indexing, use a combination of numerical and labeled indexing
• Generally, used for data pre-processing as opposed to actual processing● Heavily used in the fields of finance and public
health ● Basically, spreadsheets in python
25

More Pandas• The generic data type in Pandas is called
dataframes ● Load in data directly from CSV files ● Indexing is a little weird, so always brush up on
syntax • Just like NumPy, very fast and very optimized
● Back-end for critical code written in C (do you see the trend?)
26

Matplotlib- make pretty plots• Matplotlib adds significant plotting
functionality to Python● Heavily based on the Matlab coding environment● Two ways to use plotting:
● Object-oriented based- more control but this can be super confusing at times
● Command-based- less control, but easy to use interface that is similar to Matlab
● All types of plots are accessible: heat maps, scatter plots, histograms, pie charts, 3D plots
● Works well with NumPy and Pandas
27

Other Plotting Tools• Bokeh adds the ability to make interactive plots
● Javascript front end allows embedding in website and other documents
• Seaborn- built on top of Matplotlib ● Make your plots even prettier! (And add trend lines)
• Plotly
28

Workflow Tools• Generally, most significant coding should
happen in an IDE● This is what PyCharm is- important tools like code
autocompletion, refactoring, and automatic usage of Version Control Software (VCS) like Github
● If you need to code more than 200 lines, especially for classes, you should use an IDE
• If you need to run/test code, or do data analysis, other types of tools that you should be using.
29

Workflow Tools-IPython• Enhancement to the basic Python shell
● Supports code autocompletion, which is a game changer
● Test out code that you write here, especially fragment or snippets or when you’re not sure what to write
● Memory recall - saves outputs of previous lines, really nice when trying to debug code
● Through extensions, supports automatic reloading of code- this is a great tool to use of test driven design.
● So are there any cons?● Not really- you should 99.9% of the time be using this
instead of the normal Python shell
30

Workflow Tools- Jupyter Notebooks• Combines IPython with the power of an IDE
● Write complicated code AND be able to run small snippets
● Useful for data analysis scripts and visualization ● Supports plotting within the interface
● Segment code into blocks- only run what you need to run
● Runs through your browser● Biggest issue- you still need to use a GUI to work with this
program ● Use this tool frequently
31

More Resources• scipy.org • Documentation, documentation, documentation• Github pages for various packages • Read people’s blogs
● People LOVE to brag about the code they wrote or how they used it
32