Using ODS to Detect Faults in Rotating Equipment: Three Case Studies
10
Presented at ICCM, GITAM University, Visakhapatnam. India 24– 25 February, 2011 Page 1 of 10 Using Operating Deflection Shapes to Detect Faults in Rotating Equipment: Three Case Studies Surendra N. Ganeriwala (Suri) Mark Richardson Spectra Quest, Inc Vibrant Technology, Inc 8201 Hermitage Road 5 Erba Lane, Suite B Richmond, VA 23228 Scotts Valley, CA 95066 [email protected] [email protected] ABSTRACT In this paper, we present three case studies of the use of operational deflection shapes (ODS’s) of a rotating ma- chine as a means of detecting shaft misalignment and unbalance in its rotating components. Our purpose is to show that a significant change in the ODS can be used as an early warning indicator of mechanical faults in rotating machines. INTRODUCTION Unscheduled maintenance of rotating machinery in a process plant can account for a significant percentage of the plant’s downtime. Not only is equipment downtime expensive because of lost production revenue, but most machine faults will result in increased costs of replacement parts, in- ventory, and energy consumption. Traditionally, vibration signatures (level profiling of single-point vibration spectra), and time domain based orbit plots have been the preferred tools for detecting and diagnosing machine faults. Al- though these tools may be effective when used by an expert, ODS comparison offers a simpler, more straightforward approach for fault detection. Many machine faults are more easily characterized by a visual as well as a numerical comparison of a machine’s ODS when compared with its Baseline ODS. Case #1: Shaft Misalignment Tests were performed on a machinery fault simu- lator under various degrees of shaft misalignment. Since misalignment produces dominant motion at the machine running speed, this data is used to construct and compare ODS’s. Case #2: Unbalance Tests were performed on a machinery fault simu- lator under various conditions of unbalance. It is shown that unbalance also produces a change in the ODS at the rotor running speed and its har- monics. ODS data was extracted from frequency domain functions which were calculated from ac- quired acceleration data. Case #3: Using Proximity Probes In this study, vibration data was simultaneously acquired from accelerometers and proximity probes on a rotating machine. Both misalignment and unbalance cases were simulated, and ODS da- ta was extracted from frequency domain functions of the acceleration and displacement responses of the machine. Two different numerical measures were used to quantify changes in the ODS of the machine. These changes can be used in an automated warn- ing level (alert, alarm, and abort) detection scheme to give early warnings of machine faults. The re- sults of this work provide a new method for de- tecting machinery faults, and offer a simplified approach for on-line health monitoring of rotating equipment. What is an ODS? An ODS is the deflection of two or more points on a machine or structure. Stated differently, an ODS is the deflection of one point relative to all others. Deflection is a vector quantity, meaning that it has both location & direction associated with it. Deflection measured at a point in a specif- ic direction is called a DOF (Degree of Freedom). An ODS can be calculated from vibration data, either at a moment in time, or at a specific fre- quency. Different types of frequency domain functions (Linear spectra (FFTs), Auto & Cross spectra, Frequency Response Functions, Trans- missibility’s, or ODS FRFs [4]), can be used to define an ODS.
-
Upload
vibrant-technology -
Category
Documents
-
view
216 -
download
0
description
In this paper, three case studies of the use of operational deflection shapes (ODS’s) of a rotating machine as a means of detecting shaft misalignment and unbalance in its rotating components are presented. The purpose is to show that a significant change in the ODS can be used as an early warning indicator of mechanical faults in rotating machines.
Transcript of Using ODS to Detect Faults in Rotating Equipment: Three Case Studies

Presented at ICCM, GITAM University, Visakhapatnam. India 24– 25 February, 2011
Page 1 of 10
Using Operating Deflection Shapes to Detect Faults in Rotating Equipment: Three Case Studies
Surendra N. Ganeriwala (Suri) Mark Richardson Spectra Quest, Inc Vibrant Technology, Inc 8201 Hermitage Road 5 Erba Lane, Suite B Richmond, VA 23228 Scotts Valley, CA 95066 [email protected] [email protected]
ABSTRACT
In this paper, we present three case studies of the use of operational deflection shapes (ODS’s) of a rotating ma-chine as a means of detecting shaft misalignment and unbalance in its rotating components. Our purpose is to show that a significant change in the ODS can be used as an early warning indicator of mechanical faults in rotating machines.
INTRODUCTION
Unscheduled maintenance of rotating machinery in a process plant can account for a significant percentage of the plant’s downtime. Not only is equipment downtime expensive because of lost production revenue, but most machine faults will result in increased costs of replacement parts, in-ventory, and energy consumption.
Traditionally, vibration signatures (level profiling of single-point vibration spectra), and time domain based orbit plots have been the preferred tools for detecting and diagnosing machine faults. Al-though these tools may be effective when used by an expert, ODS comparison offers a simpler, more straightforward approach for fault detection. Many machine faults are more easily characterized by a visual as well as a numerical comparison of a machine’s ODS when compared with its Baseline ODS.
Case #1: Shaft Misalignment Tests were performed on a machinery fault simu-lator under various degrees of shaft misalignment. Since misalignment produces dominant motion at the machine running speed, this data is used to construct and compare ODS’s.
Case #2: Unbalance Tests were performed on a machinery fault simu-lator under various conditions of unbalance. It is shown that unbalance also produces a change in the ODS at the rotor running speed and its har-monics. ODS data was extracted from frequency domain functions which were calculated from ac-quired acceleration data.
Case #3: Using Proximity Probes In this study, vibration data was simultaneously acquired from accelerometers and proximity probes on a rotating machine. Both misalignment and unbalance cases were simulated, and ODS da-ta was extracted from frequency domain functions of the acceleration and displacement responses of the machine.
Two different numerical measures were used to quantify changes in the ODS of the machine. These changes can be used in an automated warn-ing level (alert, alarm, and abort) detection scheme to give early warnings of machine faults. The re-sults of this work provide a new method for de-tecting machinery faults, and offer a simplified approach for on-line health monitoring of rotating equipment.
What is an ODS? An ODS is the deflection of two or more points on a machine or structure. Stated differently, an ODS is the deflection of one point relative to all others. Deflection is a vector quantity, meaning that it has both location & direction associated with it. Deflection measured at a point in a specif-ic direction is called a DOF (Degree of Freedom).
An ODS can be calculated from vibration data, either at a moment in time, or at a specific fre-quency. Different types of frequency domain functions (Linear spectra (FFTs), Auto & Cross spectra, Frequency Response Functions, Trans-missibility’s, or ODS FRFs [4]), can be used to define an ODS.

Presented at ICCM, GITAM University, Visakhapatnam. India 24– 25 February, 2011
Page 2 of 10
Measuring an ODS In general, an ODS is defined with a magnitude & phase value for each DOF that is measured on a machine or structure. This requires that either all response DOFs be acquired simultaneously, or that they are acquired under conditions which guaran-tee their correct magnitude & phase relative to all other DOFs. Simultaneous measurement requires a multi-channel acquisition system that can syn-chronously acquire all responses. Sequential ac-quisition requires that cross-channel measure-ments be calculated between a (fixed) reference response and all other roving responses. This en-sures that each DOF of the resulting ODS has the correct magnitude & phase relative to all other DOFs.
Baseline ODS versus Current ODS The hypothesis of this fault detection method is the following;
Machine Fault Hypothesis: When a rotating ma-chine encounters a mechanical fault, its ODS will change.
Mechanical faults will cause a change in the vibra-tion levels in many parts of a rotating machine. Therefore, an important question is; “What consti-tutes a significant change in vibration level?” This will be answered by calculating a change in the ODS of the machine. In order to measure a change, the current ODS of a machine during op-eration is compared with its ODS when it is oper-ating properly, called the Baseline ODS.
Numerical Comparison of ODS’s Two different numerical methods are used to compare two ODS’s from before a machine fault (Baseline ODS) and after a fault (Fault ODS). One method is called the SCC (Shape Correlation Coefficient), and the other is the SPD (Shape Per-cent Difference). Both of these calculations yield a percentage value. The SCC measures the co-linearity of the two ODS vectors, and the SPD is the difference between the two ODS vectors as a percentage of the Baseline ODS.
SCC (Shape Correlation Coefficient) An ODS is a complex vector with two or more complex components, each component having a magnitude & phase. Each component of the ODS is obtained from a vibration signal measured at a single DOF on the machine. The SCC calculation
measures the similarity between two complex vec-tors. When this coefficient is used to compare two mode shapes, it is called a MAC (Modal Assur-ance Criterion) [3]. The SCC is defined as;
BF
*BF
ODSODS
ODSODSSCC
where: BODS Baseline ODS
FODS Fault ODS
*BODS complex conjugate of BODS
indicates the magnitude squared
indicates the DOT product between two vectors
The SCC is a normalized DOT product between two complex ODS vectors. It has values between 0 and 1. A value of 1 indicates that the two vec-tors are the same. As a “rule of thumb”, an SCC value greater than 0.90 indicates a small change in the ODS. A value less than 0.90 indicates a sub-stantial change in the ODS.
The SCC provides a single numerical measure of a change in the ODS of an operating machine. The ODS can have as many DOFs as are necessary for detecting machine faults. Many DOFs may be re-quired in order to detect certain kinds of faults. The location and direction of the sensors will vary from machine to machine.
One difficulty with the SCC is that it only meas-ures a difference in the “shape” of two vectors. In other words, two vectors can be co-linear, mean-ing that they lie along the same line, but they can still have different magnitudes. If the vibration levels increase in a machine but the “shape” of the ODS does not change, the SCC will still have a value of “1”, indicating no change.
SPD (Shape Percent Difference) A different measure of change in an ODS is the SPD (Shape Percent Difference). The SPD meas-ures both a change in level and in shape. The SPD measures the percentage change in the Fault ODS relative to the Baseline ODS. A value of 0 is no change, and a value of 1 is a 100% change from the Baseline ODS.
B
BF
ODS
ODSODSSPD
where: indicates the magnitude of the vector
Presented at ICCM, GITAM University, Visakhapatnam. India 24– 25 February, 2011
Page 3 of 10
If BF ODSODS then the SPD is negative
To summarize, when a machine is operating prop-erly, the SCC will be at or near 1, and the SPD will be at or near 0. As a fault condition begins to occur, the SCC will decrease toward 0, and the SPD will increase or decrease depending on the change in machine vibration levels.
CASE #1: SHAFT MISALIGNMENT
A survey of the literature [1], [2] reveals that:
Misalignment produces significant changes in vibration levels.
A machine can have parallel misalignment without exhibiting significant 2X vibration levels.
Misalignment is strongly influenced by ma-chine speed and coupling stiffness.
Softer couplings are more forgiving, and tend to produce less vibration.
Level profiling of a single-point vibration spec-trum for a given operating condition does not pro-vide a reliable indication of shaft misalignment.
Data Acquisition To verify our fault hypothesis, tests were per-formed using the machinery fault simulator. Ac-celerometers were attached to the top of both bear-ing housings, the motor, and the base plate of the machine, as shown in Figure 1. The baseline ODS was measured using a 16 channel analyzer, which simultaneously acquired a tachometer signal on channel 1, and 15 accelerometer signals on the remaining channels. Data was taken in two differ-ent acquisitions (or measurement sets), providing ODS’s with a total of 29 DOFs in them. Figure 2 shows where data was acquired for 14 DOFs of the motor and bearing housings. The remaining 15 DOFs were measured at 5 locations on the base plate using tri-axial accelerometers.
Data was acquired at two different operating speeds; 2000 and 4000 RPM. Time domain acce-lerometer data were synchronously acquired on 29 channels at a sampling rate of 5120 Hz over a 25.6 second time period, providing 131,071 samples of per channel. This data was then transformed into its Fourier (Linear) spectrum using an FFT for each channel.
Figure 1. Simulator Showing Accelerometers on Motor & Bearings.
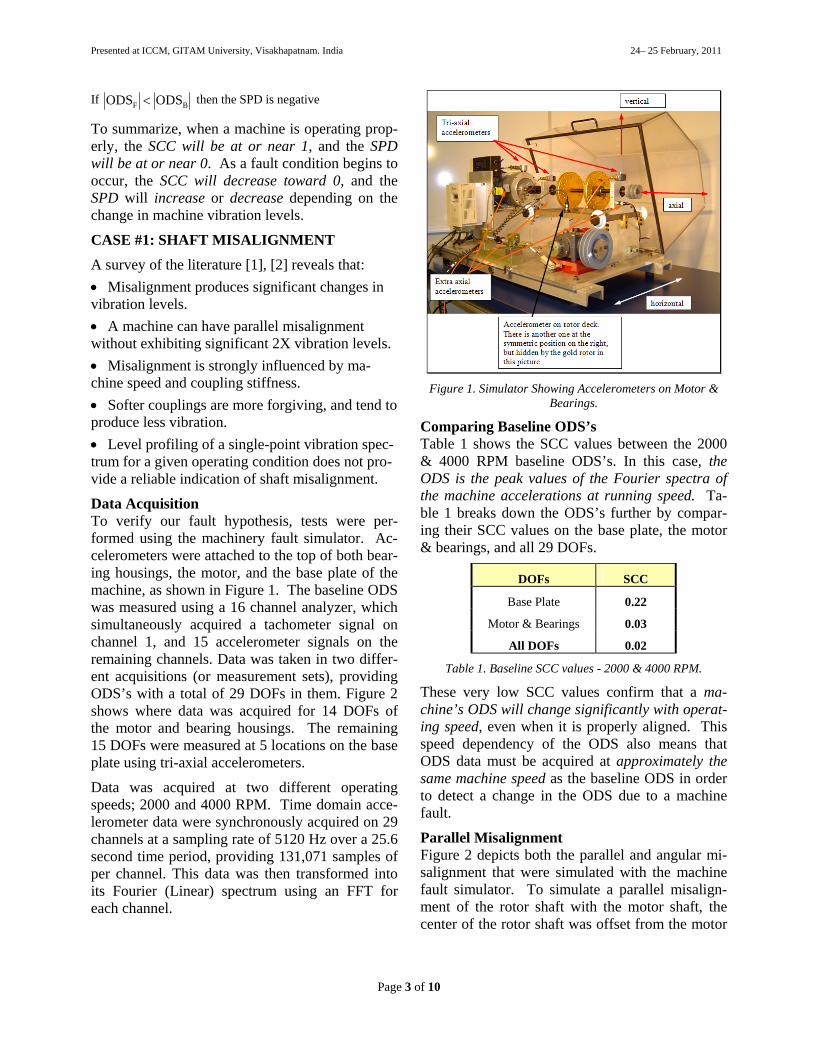
Comparing Baseline ODS’s Table 1 shows the SCC values between the 2000 & 4000 RPM baseline ODS’s. In this case, the ODS is the peak values of the Fourier spectra of the machine accelerations at running speed. Ta-ble 1 breaks down the ODS’s further by compar-ing their SCC values on the base plate, the motor & bearings, and all 29 DOFs.
DOFs SCC
Base Plate 0.22
Motor & Bearings 0.03
All DOFs 0.02
Table 1. Baseline SCC values - 2000 & 4000 RPM.
These very low SCC values confirm that a ma-chine’s ODS will change significantly with operat-ing speed, even when it is properly aligned. This speed dependency of the ODS also means that ODS data must be acquired at approximately the same machine speed as the baseline ODS in order to detect a change in the ODS due to a machine fault.
Parallel Misalignment Figure 2 depicts both the parallel and angular mi-salignment that were simulated with the machine fault simulator. To simulate a parallel misalign-ment of the rotor shaft with the motor shaft, the center of the rotor shaft was offset from the motor

Presented at ICCM, GITAM University, Visakhapatnam. India 24– 25 February, 2011
Page 4 of 10
shaft by 25 mils at both bearing blocks, as de-picted in Figure 4b.
Figure 2. Parallel (b) & Angular (c) Misalignment.
RPM DOFs SCC
2000 Base Plate 0.99
2000 Motor & Bearings 0.00
2000 All DOFs 0.51
4000 Base Plate 0.84
4000 Motor & Bearings 0.94
4000 All DOFs 0.83
Table 2. SCC Values for Parallel Misalignment.
Table 2 shows the SCC values between the base-line ODS with the misalignment ODS at 2000 RPM. The SSC value for all DOFs (0.51) strongly indicates parallel misalignment. Notice also that the base plate ODS has not changed (0.99), whe-reas the motor & bearing ODS has changed signif-icantly (0.00) due to the shaft misalignment.
The results for parallel misalignment at 4000 RPM are also shown in Table 2. These SCC values re-veal a different dynamic behavior than at 2000 RPM, however. At 4000 RPM, the shaft & motor ODS has not changed (0.94), but the base plate ODS has changed significantly (0.84). Perhaps resonances of the base plate are being excited at this operating speed. Nevertheless, the overall ODS has also changed significantly (0.83) to indi-cate the parallel misalignment problem.
Angular Misalignment To simulate an angular misalignment of the rotor shaft with the motor shaft, the inboard and out-board bearings were offset by 6.2 mils and 26 mils respectively to obtain about 0.1 degrees of rotor
shaft misalignment, as depicted in Figure 4c. Fig-ure 6 shows a comparison of the baseline ODS with the fault ODS following an angular misa-lignment. Again, a low SCC value (0.69) strongly indicates angular misalignment at 2000 RPM.
RPM DOFs SCC
2000 Base Plate 0.95
2000 Motor & Bearings 0.29
2000 All DOFs 0.69
4000 Base Plate 0.77
4000 Motor & Bearings 0.89
4000 All DOFs 0.85
Table 3. SCC Values for Angular Misalignment.
The breakdown of SCC values in Table 3 again shows that the base plate ODS has not changed (0.95), while the motor & bearing ODS has changed significantly (0.29). The results for angu-lar misalignment at 4000 RPM are also shown in Table 3. At 4000 RPM, the shaft & motor ODS has changed (0.89) less than the base plate ODS (0.77), but the overall ODS has changed signifi-cantly (0.85) to indicate the angular misalignment problem.
CASE #2: UNBALANCE
Vibration data was acquired from a machine simu-lator when it was considered to be in balance (the baseline condition), and under seven different un-balance conditions. Unbalance was created by adding weights to either or both of the rotors on the simulator, as indicated in Figure 2. Data was acquired for each of the following unbalance con-ditions;
1. Small unbalance (11.25 grams) - Inboard rotor
2. Small unbalance - Outboard rotor
3. Large unbalance (22.5 grams) - Inboard rotor
4. Large unbalance - Outboard rotor
5. Two large unbalances - 0 degrees apart
6. Two large unbalances - 90 degrees apart
7. Two large unbalances - 180 degrees apart
ODSFRFs To calculate ODS’s, first a set of ODSFRFs was calculated between each of the channels of data and a single reference channel. An ODSFRF is a

Presented at ICCM, GITAM University, Visakhapatnam. India 24– 25 February, 2011
Page 5 of 10
“hybrid” cross-channel measurement, involving both an Auto spectrum and a Cross spectrum. It is formed by adding the phase of the Cross spectrum between a roving and a reference (fixed) accele-rometer signal to the Auto spectrum of the roving response signal. The magnitude of an ODSFRF is a true measure of the structural response at its rov-ing DOF. A typical ODSFRF from the simulator is shown in Figure 3. It is clear that the ODSFRF contains peaks at the machine running speed (first order) and its higher orders (multiples of the run-ning speed). The ODS was obtained by saving the peak cursor values at the running speed, or one of its orders, as shown in Figure 3.
Figure 2. Unbalance Weights Attached to Rotors
Figure 3 ODSFRF Showing Peaks at Machine Orders
1 2 3 4 5 6 7
SCC
0
5
10
15
20
25
SCC
SPD
SCC 0.6 0.64 0.57 0.48 0.52 0.45 0.47
SPD 2.83 3.46 8.23 11.53 23.8 11.62 2.96
1 2 3 4 5 6 7
Figure 4. First Order (2000 RPM) ODS Comparisons
An ODS is a collection of peak values from a set of ODSFRFs at one of the orders of the machine.
Figure 4 contains the SCC and SPD values for the ODS’s created from peak values at the running speed or first order (2000 RPM) of the machine. Both the SCC and SPD strongly indicate the un-balance condition for all seven cases. However, the SPD also indicates the vibration level or sever-ity of the fault. Cases 1 through 4 indicate an in-creasing level of vibration from the inboard to outboard rotor, and also from the use of the small-er to the larger unbalance weight.
Cases 5, 6, & 7 show how the vibration level is affected by the locations of the weights on the two rotors. Case 5 gave the highest SPD value be-cause the two large unbalance weights were aligned with one another on both rotors, thus pro-viding the maximum amount of unbalance. The SPD values also show that case 7, with the two large unbalance weights 180 degrees apart, created about the same change in the vibration level as case 2, with the single small weight attached to the inboard rotor.
Figure 5 contains the SCC and SPD values for the ODS’s at the second order (4000 RPM). The second order ODS comparisons give the same re-sults as the first order comparisons. Figure 6 con-tains the SCC and SPD values for the ODS’s at the third order (6000 RPM). One incorrect result ap-pears in these results. The SCC value of 0.97 in-dicates a balanced condition for Case 2. Howev-er, the SPD results are similar to those from the first and second order comparisons, but don’t

Presented at ICCM, GITAM University, Visakhapatnam. India 24– 25 February, 2011
Page 6 of 10
quantify the severity of the unbalance conditions as well as the first and second order comparisons.
Figure 5 contains the SCC and SPD values for the ODS’s at the second order (4000 RPM). The second order ODS comparisons give the same re-sults as the first order comparisons.
Figure 6 contains the SCC and SPD values for the ODS’s at the third order (6000 RPM). One incor-rect result appears in these results. The SCC value of 0.97 indicates a balanced condition for Case 2. However, the SPD results are similar to those from the first and second order comparisons, but don’t quantify the severity of the unbalance conditions as well as the first and second order comparisons.
1 2 3 4 5 6 7
SCC
0
10
20
30
40
50
SCC
SPD
SCC 0.03 0.07 0.24 0.23 0.27 0.23 0.25
SPD 1.15 3.01 12.18 21.18 49.06 16.57 2.21
1 2 3 4 5 6 7
Figure 5. Second Order (4000 RPM) ODS Comparison
1 2 3 4 5 6 7
SCC
05
101520253035
4045
SCC
SPD
SCC 0.45 0.97 0.57 0.86 0.74 0.41 0.46
SPD 2.26 1.7 6.49 5.49 44.2 8.11 3.17
1 2 3 4 5 6 7
Figure 6. Third Order (6000 RPM) ODS Comparisons CASE #3: USING PROXIMITY PROBES
To further verify our hypothesis, tests were per-formed using the machinery fault simulator shown in Figure 11. Accelerometers and proximity probes were used to measure the vibration. The accelerometers provided 7 signals and the proxim-ity probes provided 6 signals. These 13 channels of vibration data were synchronously acquired with a multi-channel data acquisition system.
Time domain records were acquired at a sample rate of 5000Hz for a total of 15.565 seconds, pro-viding 77824 samples of data for each channel. This data was post-processed, and ODSFRFs were calculated between all channels and a single refer-ence channel.
Comparing Baseline ODS’s First, Baseline ODS’s from four different operat-ing speeds were compared to quantify their differ-
ences. Baseline ODSs were compared in the fol-lowing cases;
Case 1: 800 versus 1000 RPM Case 2: 800 versus 2000 RPM Case 3: 800 versus 3000 RPM Case 4: 1000 versus 2000 RPM Case 5: 1000 versus 3000 RPM Case 6: 2000 versus 3000 RPM
Both the SCC and SPD values for these 6 cases are shown in Figure 7. For Case 1, the SCC value (0.95) indicates that the Baseline ODS at 800 RPM is essentially the same as at 1000 RPM. However, the SPD indicates that the vibration lev-el has grown by 58% from 800 to 1000 RPM.
Cases 2, 3, and 4 indicate the greatest changes in the ODS between two different operating speeds. The first critical speed of the machine shaft is 1590 RPM, so large changes in the ODS are ex-pected near this speed. In Case 6, the SCC value (0.90) indicates that the ODS’s are co-linear (similar in shape), but the SPD value (-1.47) indi-cates that the ODS has decreased in magnitude from 2000 to 3000 RPM. This decrease in vibra-tion level occurred because at 3000 RPM, the ma-chine is operating beyond its critical operating speed.

Presented at ICCM, GITAM University, Visakhapatnam. India 24– 25 February, 2011
Page 7 of 10
Figure 7. Baseline ODS Comparisons
Unbalance Faults Two unbalance faults were simulated in the rotat-ing machine simulator by adding unbalance screws to the (gold) rotors on the shaft. Fault 1 was created by adding an unbalance weight of 4 grams to the inboard rotor, and fault 2 by adding an unbalance weight of 4 grams to each of the ro-tors. ODS data was obtained for the following 8 cases.
Case 1: Fault 1 (One 4 gram unbalance) at 800 RPM Case 2: Fault 1 at 1000 RPM Case 3: Fault 1 at 2000 RPM Case 4: Fault 1 at 3000 RPM
Case 5: Fault 2 (Two 4 gram unbalances) at 800 RPM Case 6: Fault 2 at 1000 RPM Case 7: Fault 2 at 2000 RPM Case 8: Fault 2 at 3000 RPM
The SCC and SPD values for these 8 cases are plotted in Figure 8. In each case the Baseline ODS for a different machine speed is compared with the Fault ODS at the same speed. The values in Figure 6 clearly indicate that Fault 1 is less se-vere than Fault 2. The SCC is on the borderline of no change in the ODS for Cases 1 to 4, but indi-cates a significant change for Cases 5 to 8. The SPD indicates a significant change in all cases, with the smallest change being 62% difference in the ODS for Case 2.
Figure 8. Unbalance ODS Comparisons
Angular Misalignment Faults Two angular misalignment faults were simulated in the rotating machine simulator by turning screws at the base of each shaft bearing block to misalign it with the motor shaft. Fault 3 was created by adding 10 mils of misalignment to the outboard bearing block. Fault 4 was created by adding 20 mils of misalignment to the outboard bearing block. ODS data was obtained for the following 8 cases.
Case 1: Fault 3 (10 mil angular misalign) at 800 RPM Case 2: Fault 3 at 1000 RPM Case 3: Fault 3 at 2000 RPM Case 4: Fault 3 at 3000 RPM Case 5: Fault 4 (20 mil angular misalign) at 800 RPM Case 6: Fault 4 at 1000 RPM Case 7: Fault 4 at 2000 RPM Case 8: Fault 4 at 3000 RPM
The SCC and SPD values for the 8 angular misa-lignment cases are plotted in Figure 9. The values in Figure 9 give a mixed result. The SCC is nearly 1.0 in all cases, meaning that the Baseline and Fault ODS were co-linear at all speeds. However, the SPD indicates a change of the ODS in all cas-es, and its magnitude increased with machine speed, except for the last case. In Case 8, the SPD magnitude was slightly less than the magnitude for Case 7, but still indicated a 15% change in the ODS.

Presented at ICCM, GITAM University, Visakhapatnam. India 24– 25 February, 2011
Page 8 of 10
Figure 9. Angular Misalignment ODS Comparisons
Parallel Misalignment Faults Two parallel misalignment faults were simulated in the rotating machine simulator. Fault 5 was created by adding 10 mils of misalignment to both bearing blocks. Fault 6 was created by adding 20 mils of misalignment to both bearing blocks. ODS data was obtained for the following 8 cases.
Case 1: Fault 5 (10 mil parallel misalign) at 800 RPM Case 2: Fault 5 at 1000 RPM Case 3: Fault 5 at 2000 RPM Case 4: Fault 5 at 3000 RPM
Case 5: Fault 6 (20 mil parallel misalign) at 800 RPM Case 6: Fault 6 at 1000 RPM Case 7: Fault 6 at 2000 RPM Case 8: Fault 6 at 3000 RPM
The SCC and SPD values for the 8 parallel misa-lignment cases are plotted in Figure 10. These val-ues also give a mixed result. The SCC is close to 1.0 for all cases, meaning that the Baseline ODS and Fault ODS are co-linear at all speeds. On the other hand, the SPD indicates a change of the ODS in all cases, and the magnitude of the SPD increased with increased machine speed in all cas-es.
CONCLUSIONS Three case studies were performed to validate the correlation between a machine fault and changes in its ODS. Multiple unbalance and misalignment cases were investigated. Both accelerometers and proximity probes were used to measure the simu-lator’s vibration.
Figure 10. Parallel Misalignment ODS Comparisons
Two different numerical measures of the differ-ence between the Baseline and Fault ODS were used; the SCC (Shape Correlation Coefficient) and SPD (Shape Percent Difference). The SCC indi-cates whether or not the two shapes are co-linear. The SPD measures the percent difference between the two ODS’s, hence it also measures the severity of the machine fault.
Case#1: Shaft Misalignment In this study, accelerometer data from 14 DOFs on the motor & bearings and 15 DOFs on the base plate was used to detect machine faults. ODS’s were constructed using the peak data values of the Fourier spectra of the accelerometer signals, for operating speeds of 2000 & 4000 RPM. Compari-sons of baseline ODS’s with the ODS’s after in-duced misalignment showed a significant change in the ODS in all cases. These results prove that shaft misalignment in a rotating machine is clearly indicated by changes in its ODS at operating speed.
The results also showed that the sensitivity of the ODS change depends on the locations & direc-tions of the accelerometers used to measure the ODS. Accelerometer signals taken only from the base plate did not indicate misalignment at 2000 RPM. Conversely, accelerometer signals taken only from the motor & bearings did not indicate misalignment at 4000 RPM. These results clearly showed that the placement and use of a sufficient number of transducers on a machine is critical for detecting misalignment from changes in its ODS.
Presented at ICCM, GITAM University, Visakhapatnam. India 24– 25 February, 2011
Page 9 of 10
Case#2: Unbalance In this study, seven different cases of unbalance were simulated using a rotating machine fault si-mulator. Accelerometer data from 9 DOFs on the motor & bearings and 5 DOFs on the base plate was acquired using a 16 channel data acquisition system, with the machine running at 2000 RPM. ODS’s were constructed using the peak values from sets of ODSFRF functions at the first, second, and third order frequencies.
Comparisons between baseline (balanced) ODS’s and the ODS’s of seven different unbalance cases were compared. These results strongly confirmed our machine fault hypothesis; namely, “When an operating machine becomes unbalanced, its ODS will change”.
Case #3: Using Proximity Probes In case studies #1 & #2, only accelerometer data was used to sense machine vibrations. In this case, proximity probes, which measured the dis-placement of the shaft relative to its bearing hous-ings, were also used. Three different types of common machinery faults were simulated; unbal-ance, angular misalignment, and parallel misa-lignment. A total of 24 different fault cases were evaluated.
Seven DOFs of vibration data were acquired from the motor & bearings using accelerometers, and 6 DOFs were acquired from the shaft bearings using proximity probes. These 13 channels of acquired data were post-processed, and a set of ODSFRFs was calculated for each fault condition. ODS’s were then created by using the peak values at the first order (running speed) of the machine from each set of ODSFRF functions.
Operating data was acquired at 4 different operat-ing speeds, 800, 1000, 2000 & 3000 RPM. The first critical speed of the machine was at 1590 RPM. By comparing Baseline (no fault) ODS’s for the different operating speeds, it was clear that the ODS’s for speeds below the critical speed were quite different from the ODS’s above the operat-ing speed. This is expected whenever a resonance is excited.
In all cases, the SPD indicated a “significant” change in the ODS when faults were introduced. The high values of the SPD shown in most cases indicated that it has a strong sensitivity to changes
in the ODS. Therefore, the SPD could be used to detect lesser changes in machine responses, pro-viding early detection of impending fault condi-tions.
Other machine faults such as bearing oil whirl, loose connections, gear tooth faults, soft foot (im-proper foundation) might also be detected by ODS comparisons. In addition to vibration data, an “op-erating shape” could also contain other data such as temperatures, pressures, voltages, currents, and flow rates. These parameters could also be corre-lated with certain kinds of machine faults. The simplicity of this approach to machinery fault de-tection makes it a strong candidate for implemen-tation in an online machine health monitoring sys-tem.
The machinery fault simulator used to obtain these results is a product of Spectra Quest, Inc. The ODS analysis software is part of a MechaniCom Machine Surveillance System™, a product of Vi-brant Technology, Inc. REFERENCES
1. S. Ganeriwala, S. Patel, and H. Hartung “The Truth Behind Misalignment Vibration Spectra of Rotating Machinery” Proceedings of International Modal Analysis Conference, PP 2078-205, 1999.
2. J. Piotrowski, “Shaft Alignment Handbook” Third Ed. Marcel Dekker, Inc. New York, 2006.
3. R.J. Allemang, D.L. Brown "A Correlation Coefficient for Modal Vector Analysis", Proceed-ings of the International Modal Analysis Confe-rence, pp.110-116, 1982.
4. Døssing, Ole "Structural Stroboscopy-Measurement of Operational Deflection Shapes" Sound and Vibration Magazine, August 1988.
5. M.H. Richardson, “Is It a Mode Shape or an Operating Deflection Shape?” Sound and Vibra-tion magazine, March, 1997.
6. T. Wolff, M.H. Richardson, “Fault Detection in Structures from Changes in Their Modal Para-meters” Proceedings of IMAC VII, January 30, 1989.
7. B. Schwarz, M.H. Richardson, “Measurements Required for Displaying Operating Deflection Shapes” Proceedings of IMAC XXII, January

Presented at ICCM, GITAM University, Visakhapatnam. India 24– 25 February, 2011
Page 10 of 10
8. Surendra N. (Suri) Ganeriwala, Li Zhuang, M.H. Richardson “Using Operating Deflection Shapes to Detect Shaft Misalignment in Rotating Equipment” Proceedings of International Modal Analysis Conference (IMAC XXVI), February, 2008.
9. Surendra N. (Suri) Ganeriwala, B. Schwarz, M.H. Richardson “Using Operating Deflection Shapes to Detect Unbalance in Rotating Equip-ment” Proceedings of International Modal Analy-sis Conference (IMAC XXVII), February, 2009
Figure 11. Case Study #3 Sensor Locations
Tri-axial accelerometer
Uni-axial accelerometers (vert & horz)
Proximity probes (vert & horz)
V
H