Using MX for SEM analysis. Using Lisrel Analysis of Reader Reliability in Essay Scoring Votaw's Data...
43
Using MX for SEM analysis
-
Upload
brisa-pleas -
Category
Documents
-
view
216 -
download
0
Transcript of Using MX for SEM analysis. Using Lisrel Analysis of Reader Reliability in Essay Scoring Votaw's Data...
Using MX for SEM analysis
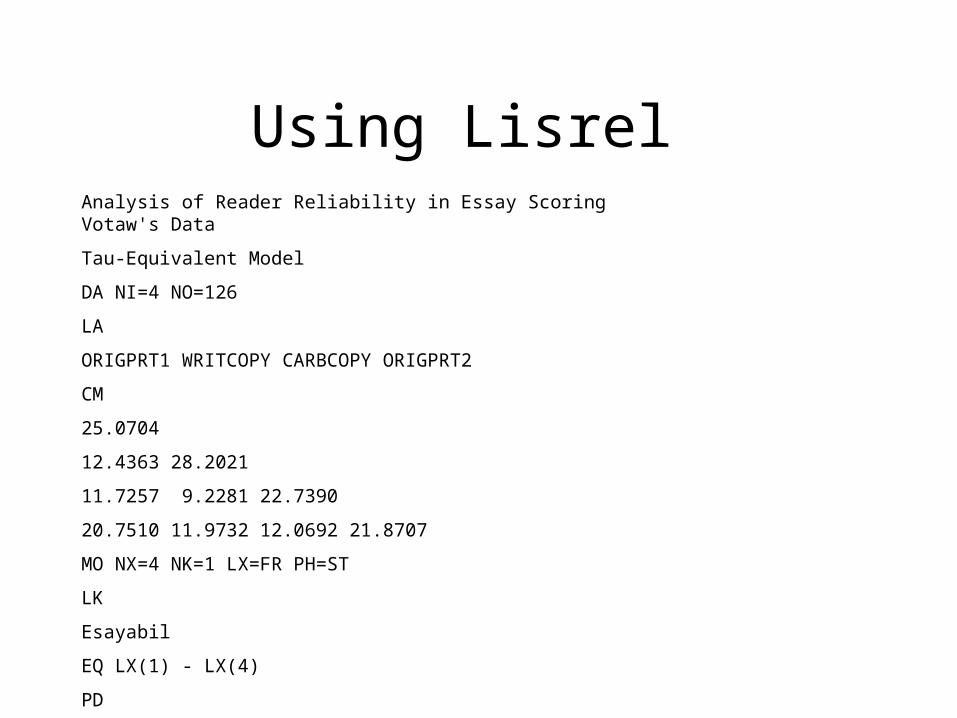
Using Lisrel Analysis of Reader Reliability in Essay Scoring Votaw's Data
Tau-Equivalent Model
DA NI=4 NO=126
LA
ORIGPRT1 WRITCOPY CARBCOPY ORIGPRT2
CM
25.0704
12.4363 28.2021
11.7257 9.2281 22.7390
20.7510 11.9732 12.0692 21.8707
MO NX=4 NK=1 LX=FR PH=ST
LK
Esayabil
EQ LX(1) - LX(4)
PD
OU
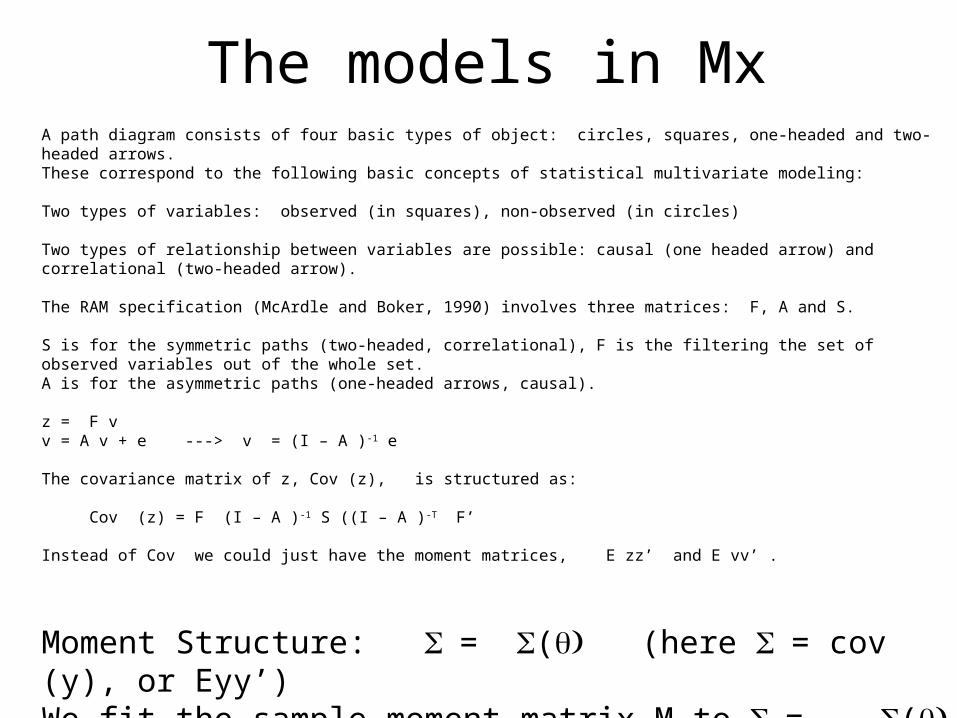
The models in MxA path diagram consists of four basic types of object: circles, squares, one-headed and two-headed arrows. These correspond to the following basic concepts of statistical multivariate modeling: Two types of variables: observed (in squares), non-observed (in circles) Two types of relationship between variables are possible: causal (one headed arrow) and correlational (two-headed arrow). The RAM specification (McArdle and Boker, 1990) involves three matrices: F, A and S. S is for the symmetric paths (two-headed, correlational), F is the filtering the set of observed variables out of the whole set. A is for the asymmetric paths (one-headed arrows, causal). z = F v v = A v + e ---> v = (I – A )-1 e The covariance matrix of z, Cov (z), is structured as: Cov (z) = F (I – A )-1 S ((I – A )-T F’ Instead of Cov we could just have the moment matrices, E zz’ and E vv’ .
Moment Structure: = ( (here = cov (y), or Eyy’) We fit the sample moment matrix M to = (
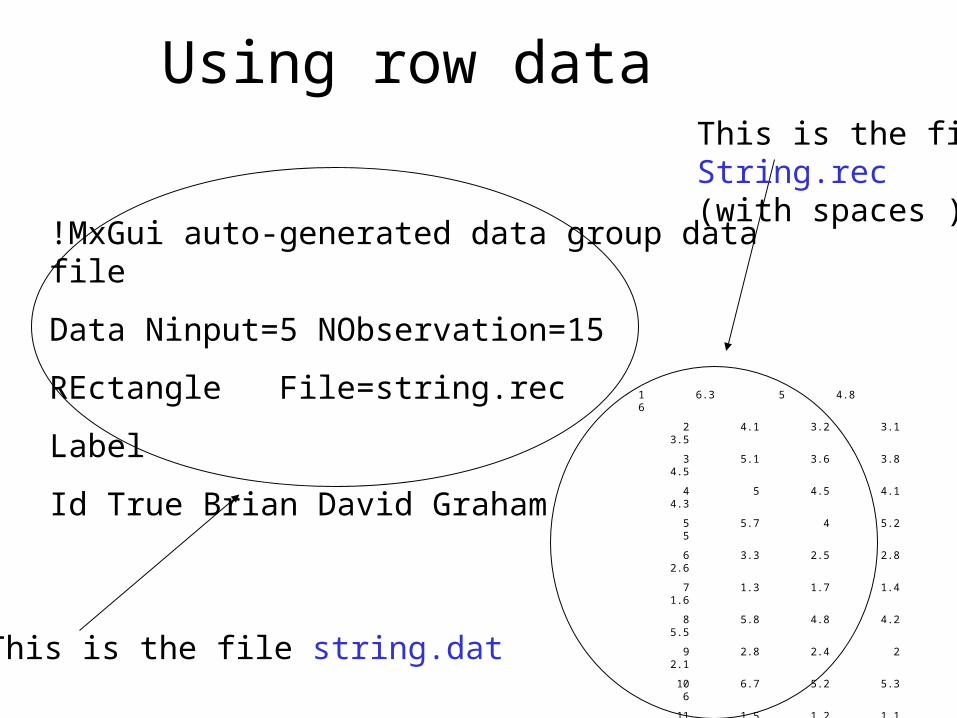
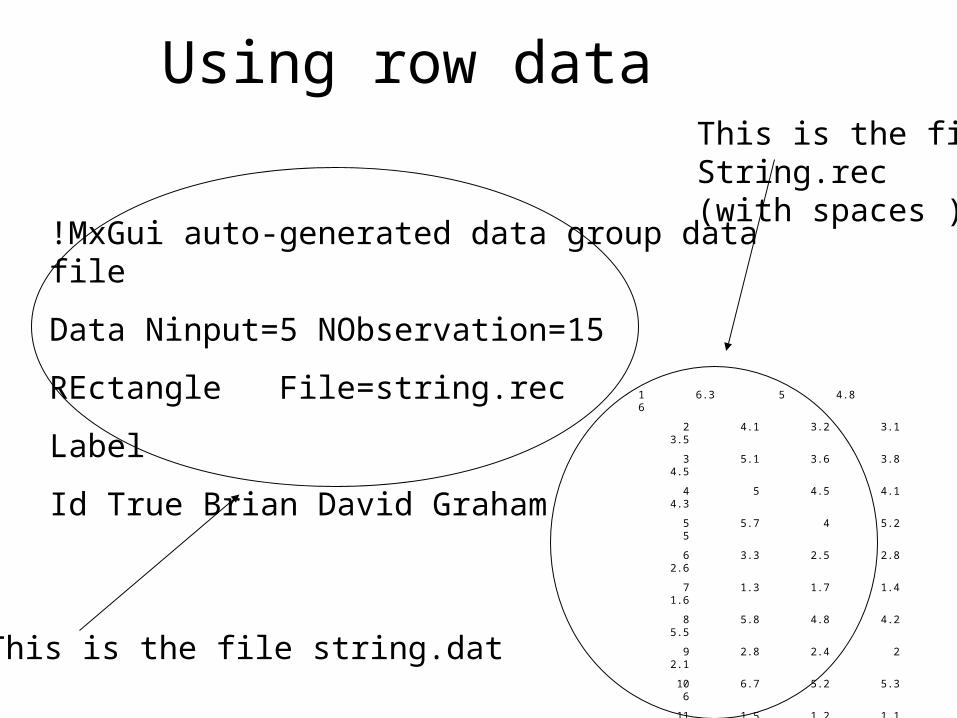
Using row data
!MxGui auto-generated data group data file
Data Ninput=5 NObservation=15
REctangle File=string.rec
Label
Id True Brian David Graham
This is the file string.dat
1 6.3 5 4.8 6
2 4.1 3.2 3.1 3.5
3 5.1 3.6 3.8 4.5
4 5 4.5 4.1 4.3
5 5.7 4 5.2 5
6 3.3 2.5 2.8 2.6
7 1.3 1.7 1.4 1.6
8 5.8 4.8 4.2 5.5
9 2.8 2.4 2 2.1
10 6.7 5.2 5.3 6
11 1.5 1.2 1.1 1.2
12 2.1 1.8 1.6 1.8
13 4.6 3.4 4.1 3.9
14 7.6 6 6.3 6.5
15 2.5 2.2 1.6 2
This is the fileString.rec (with spaces )

Using the graphic interface path diagram > datamap > search for the data file in raw > select variables We do factor analysis model
Brian David Graham
G L
0.06
I1.38 M
3.43
0.14
J1.53
N3.43
0.02
K1.73
O3.77
1.00
Appears OK -2LnLGroup Fit: 77.2941
Fit 77.294Probability 0.000
AIC 0.000RMSEA 0.000
Degrees of freedom 36Free parameters 9
Observed Statistics 45Constraints 0
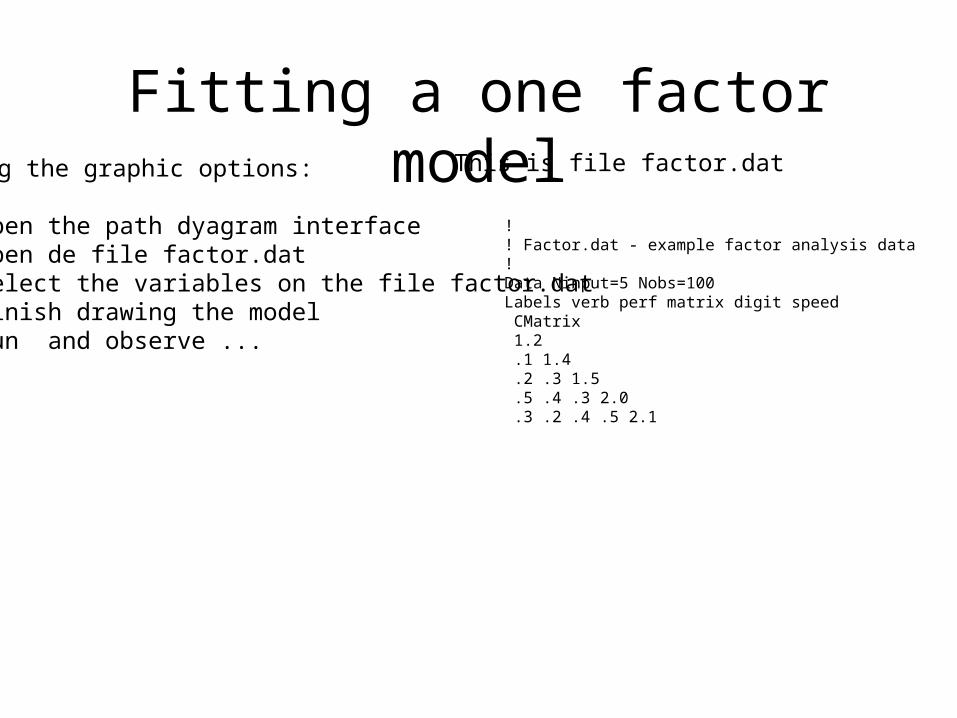
Fitting a one factor modelUsing the graphic options:
• Open the path dyagram interface• Open de file factor.dat • Select the variables on the file factor.dat• Finish drawing the model • Run and observe ...
!! Factor.dat - example factor analysis data! Data Ninput=5 Nobs=100Labels verb perf matrix digit speed CMatrix 1.2 .1 1.4 .2 .3 1.5 .5 .4 .3 2.0 .3 .2 .4 .5 2.1
This is file factor.dat
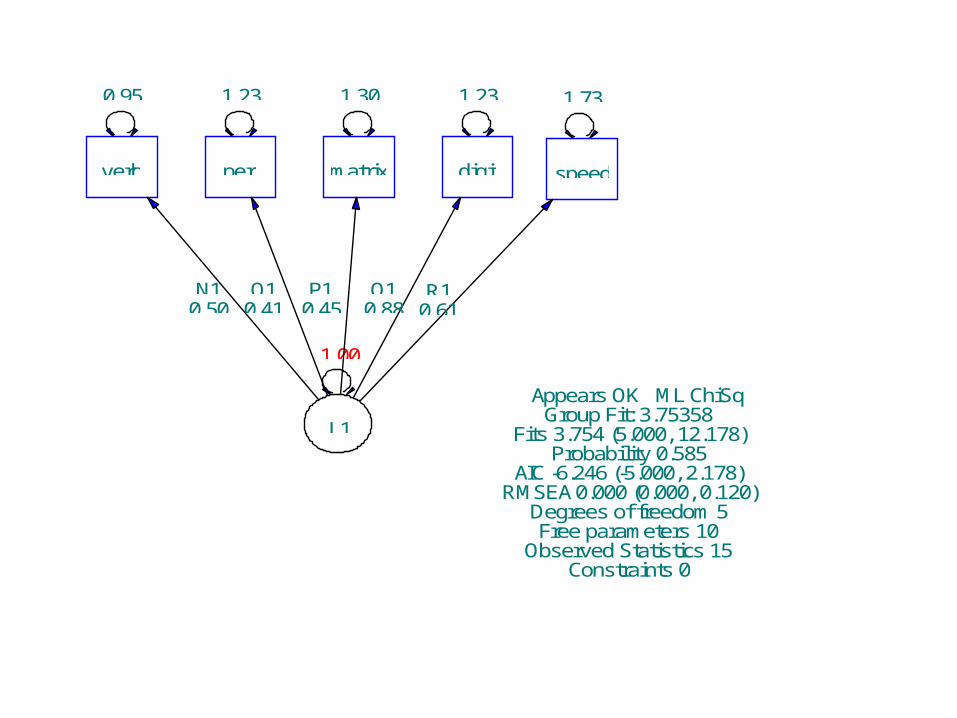
0.95
verb
1.23
perf
1.30
matrix
1.23
digit
1.73
speed
1.00
L1
N10.50
O10.41
P10.45
Q10.88
R10.61
Appears OK ML ChiSqGroup Fit: 3.75358
Fits 3.754 (5.000, 12.178)Probability 0.585
AIC -6.246 (-5.000, 2.178)RMSEA 0.000 (0.000, 0.120)
Degrees of freedom 5Free parameters 10
Observed Statistics 15Constraints 0
More on using Mx
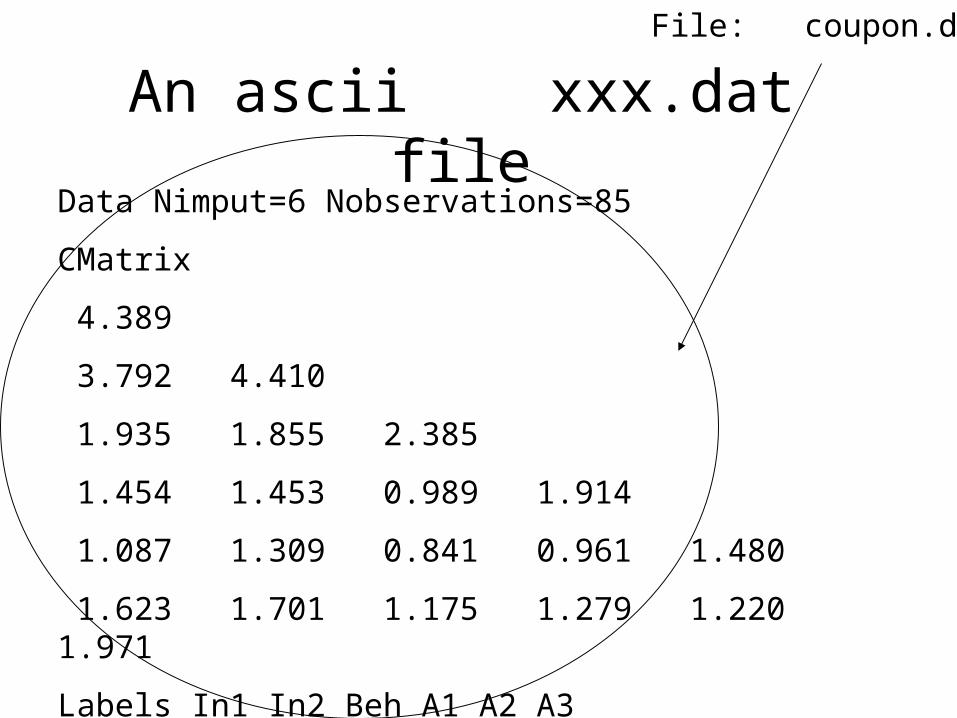
An ascii xxx.dat file Data Nimput=6 Nobservations=85
CMatrix
4.389
3.792 4.410
1.935 1.855 2.385
1.454 1.453 0.989 1.914
1.087 1.309 0.841 0.961 1.480
1.623 1.701 1.175 1.279 1.220 1.971
Labels In1 In2 Beh A1 A2 A3
File: coupon.dat
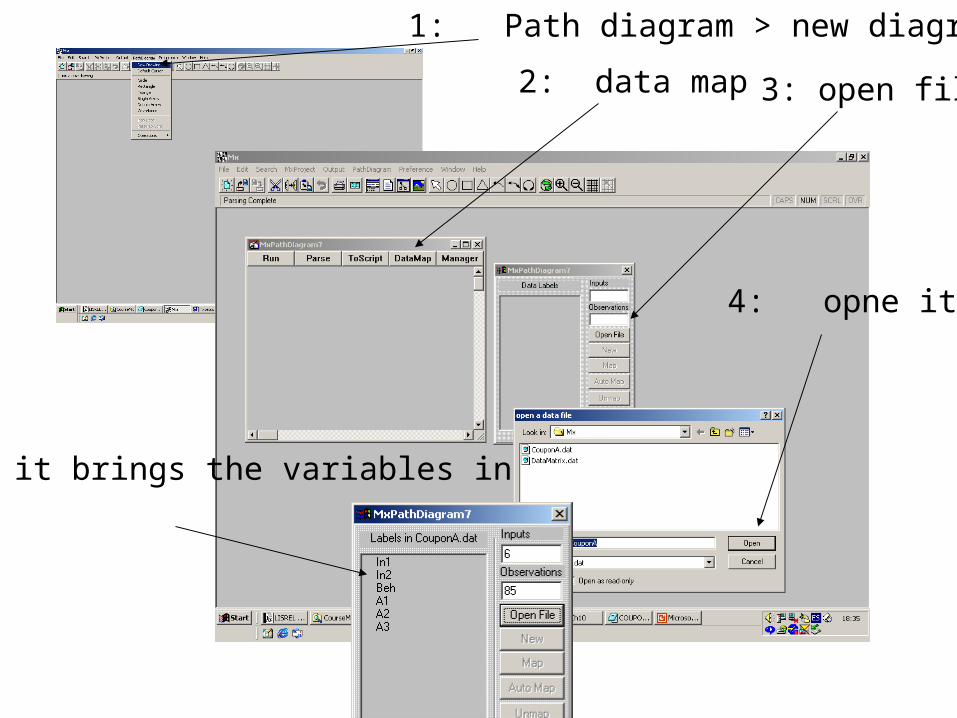
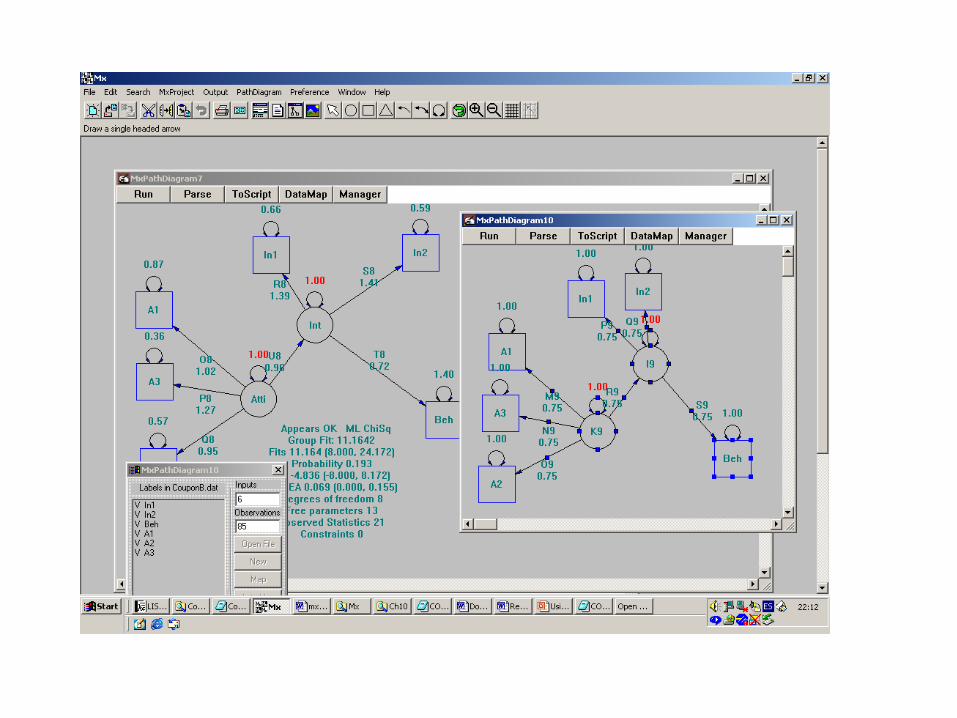
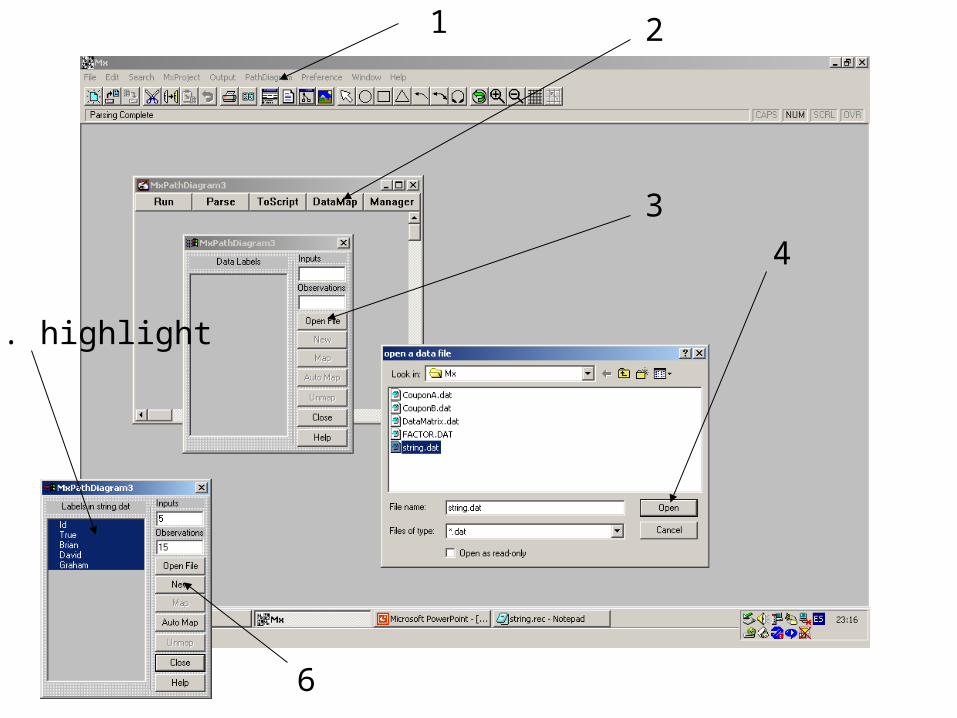
1: Path diagram > new diagram
2: data map 3: open file
4: opne it
5: it brings the variables in
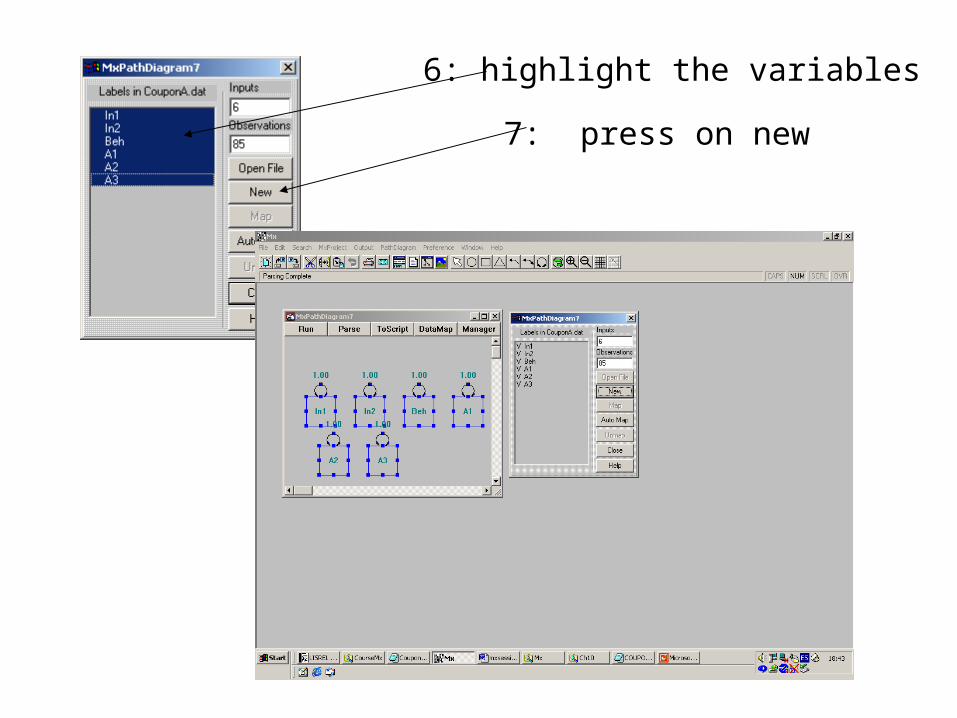
6: highlight the variables
7: press on new

Run the program

Chi2 Goodness of fit
df
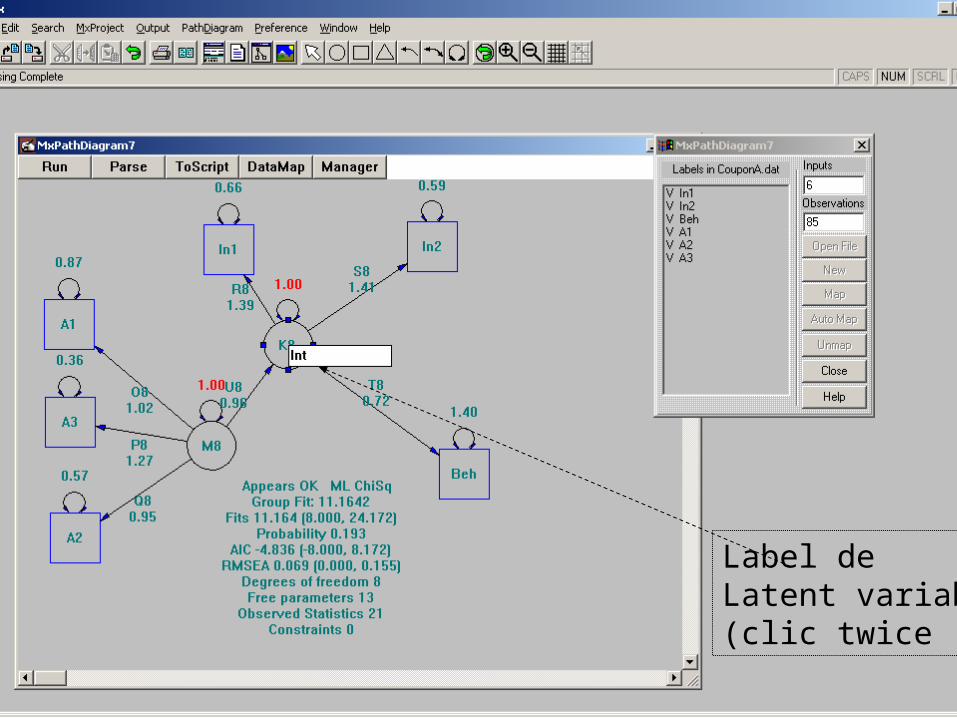
Label de Latent variables(clic twice ...)
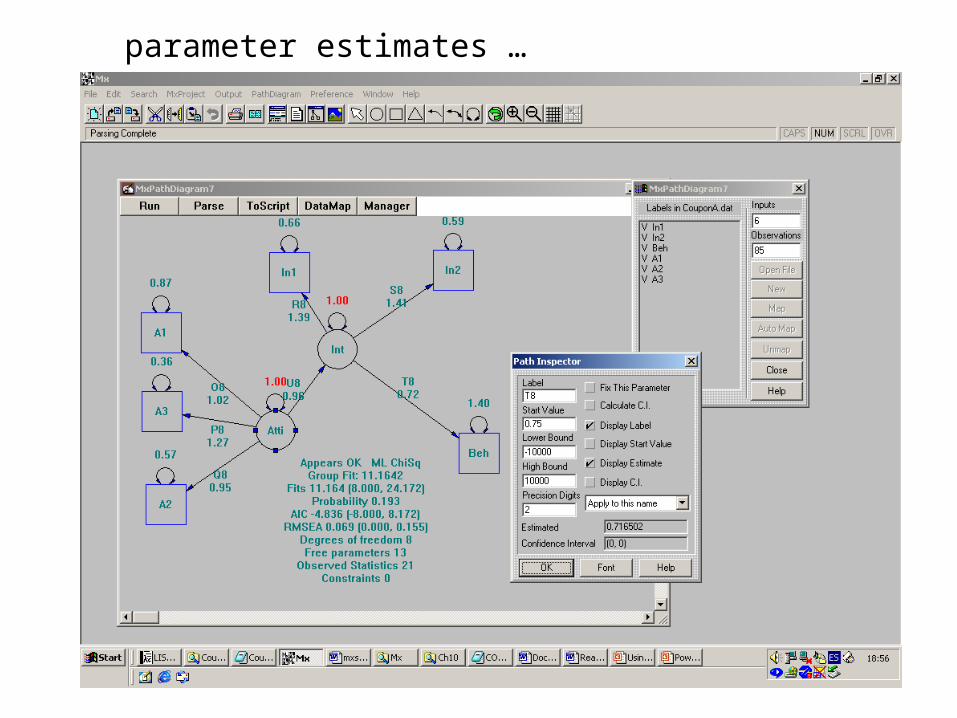
parameter estimates …
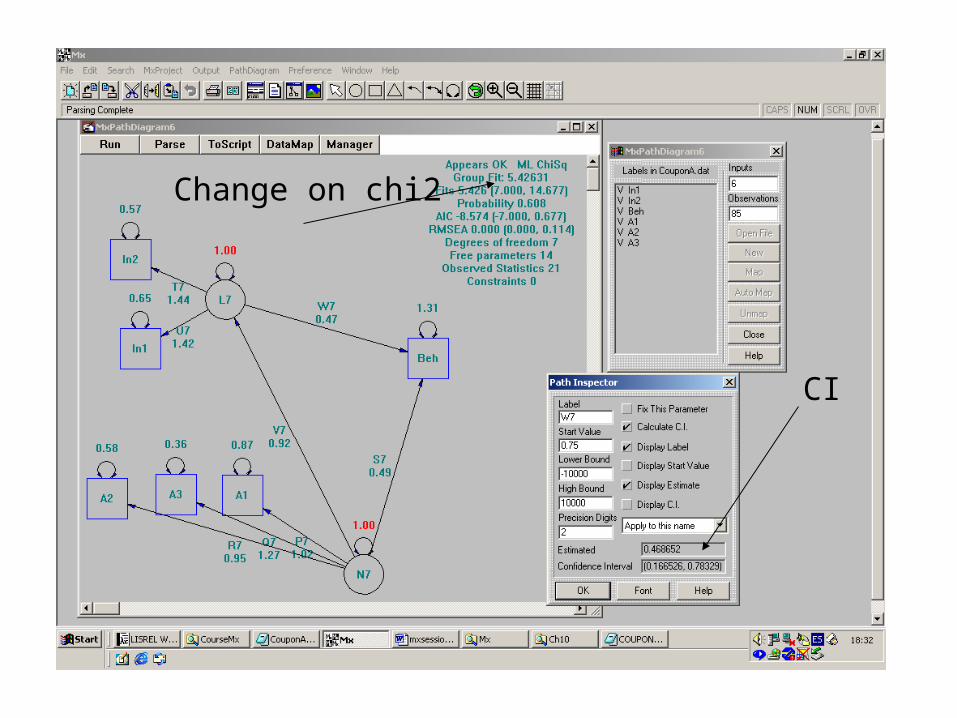
CI
Change on chi2
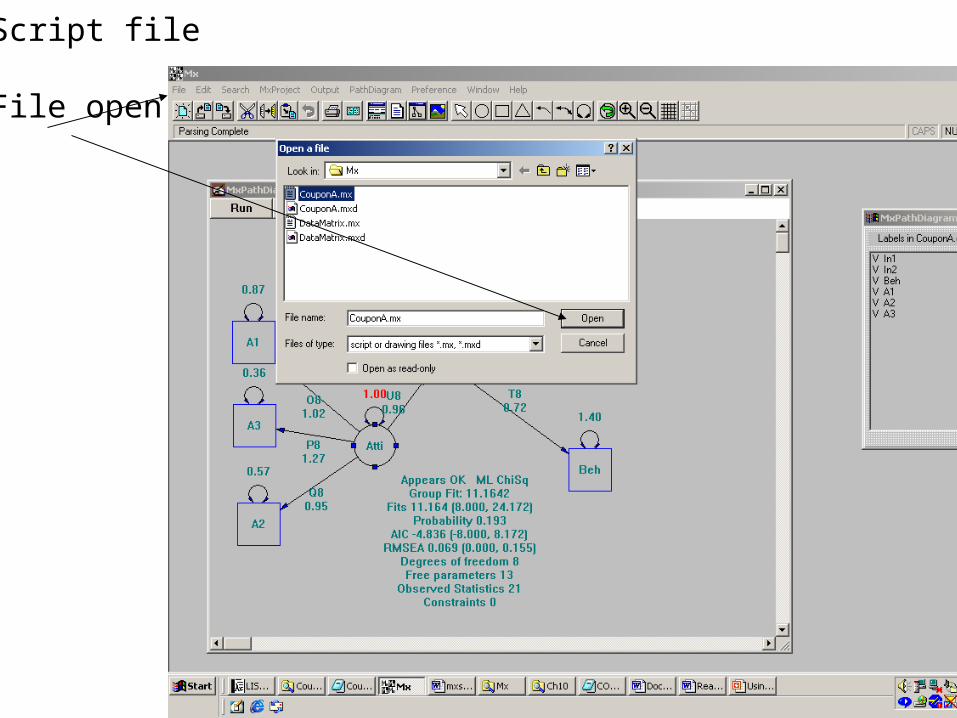
Script file
File open
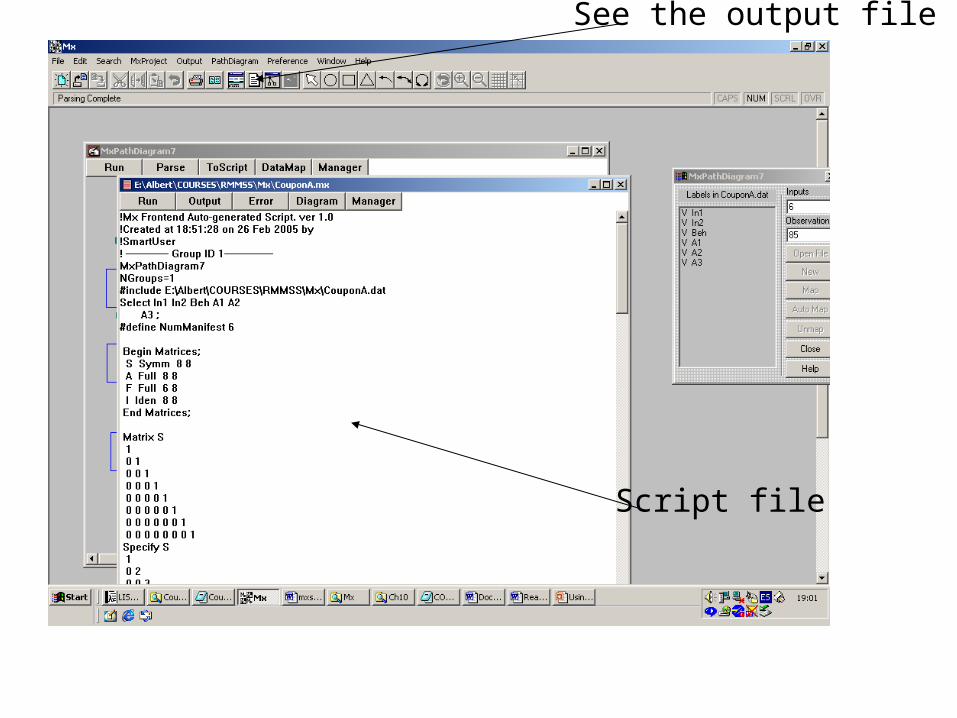
Script file
See the output file
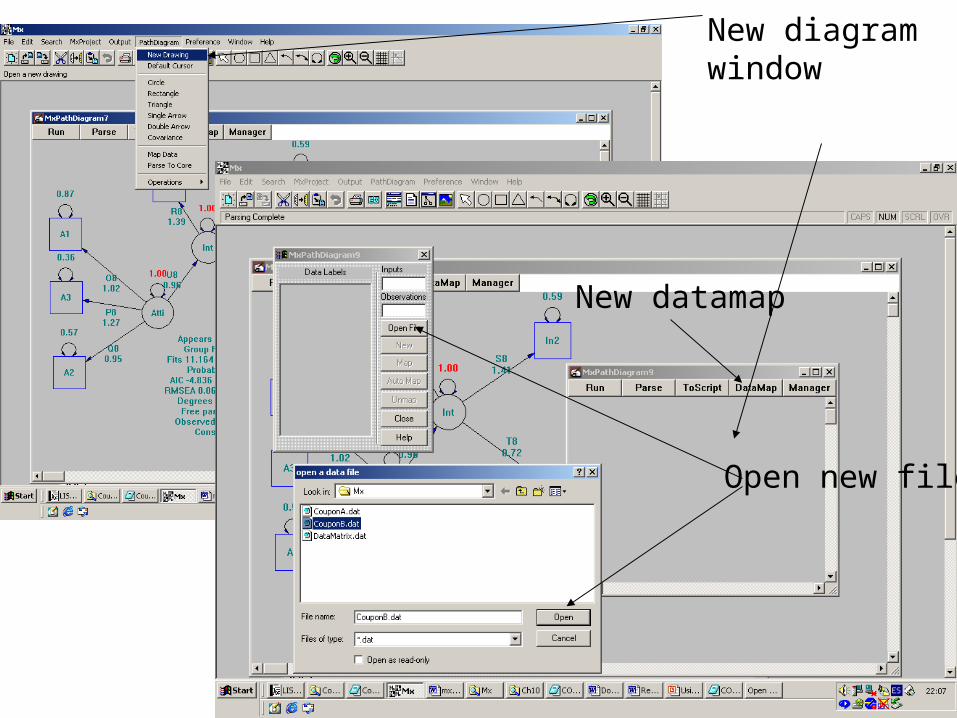
New diagramwindow
Open new file
New datamap
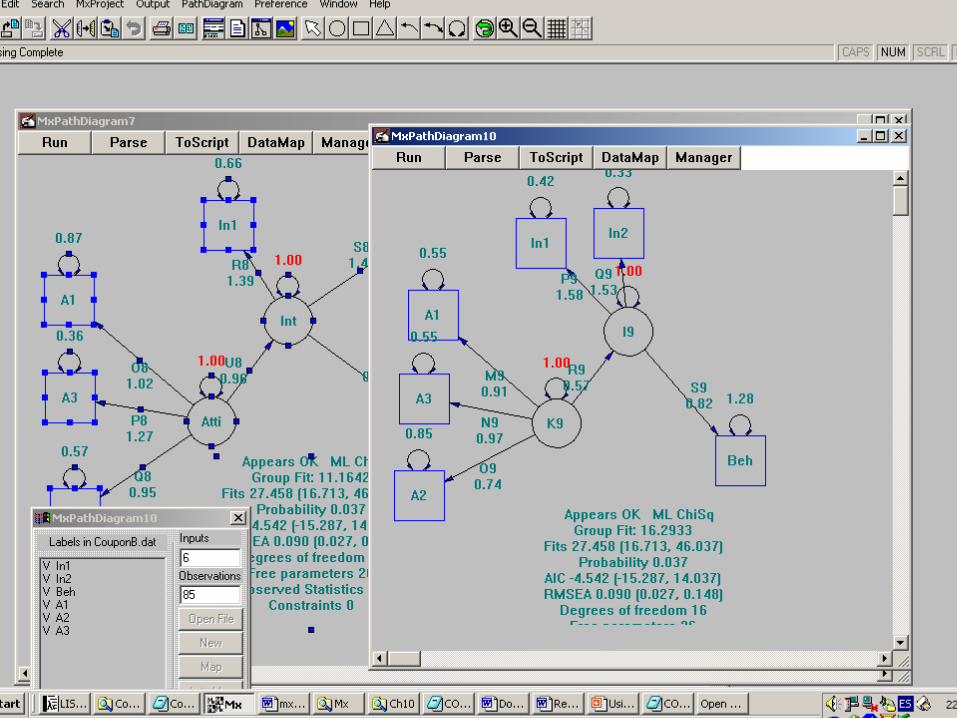
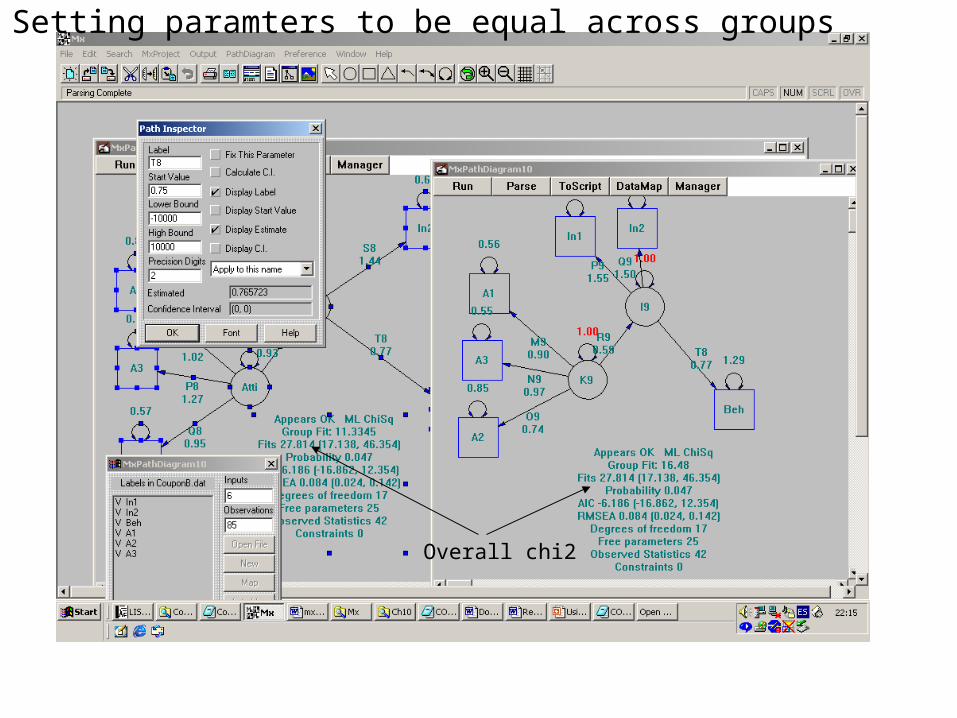
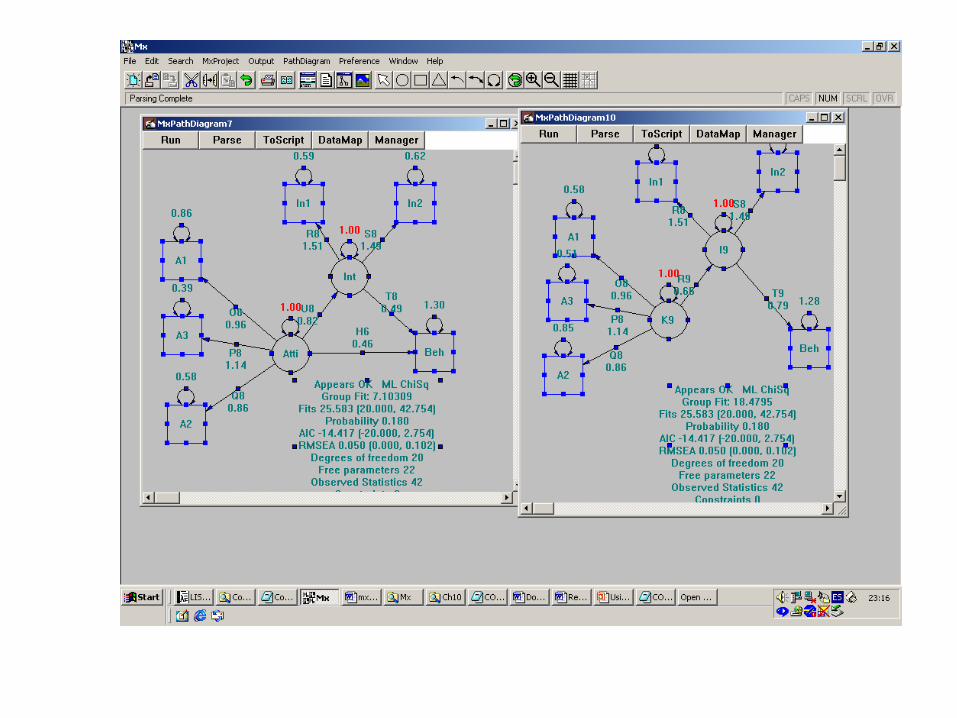
Setting paramters to be equal across groups
Overall chi2

Lattin and Roberts data of adoption new technologies
p. 366 of Lattin et al.
See the data file adoption.txt in RMMRS
Using row data
!MxGui auto-generated data group data file
Data Ninput=5 NObservation=15
REctangle File=string.rec
Label
Id True Brian David Graham
This is the file string.dat
1 6.3 5 4.8 6
2 4.1 3.2 3.1 3.5
3 5.1 3.6 3.8 4.5
4 5 4.5 4.1 4.3
5 5.7 4 5.2 5
6 3.3 2.5 2.8 2.6
7 1.3 1.7 1.4 1.6
8 5.8 4.8 4.2 5.5
9 2.8 2.4 2 2.1
10 6.7 5.2 5.3 6
11 1.5 1.2 1.1 1.2
12 2.1 1.8 1.6 1.8
13 4.6 3.4 4.1 3.9
14 7.6 6 6.3 6.5
15 2.5 2.2 1.6 2
This is the fileString.rec (with spaces )
1 2
3
4
5. highlight
6
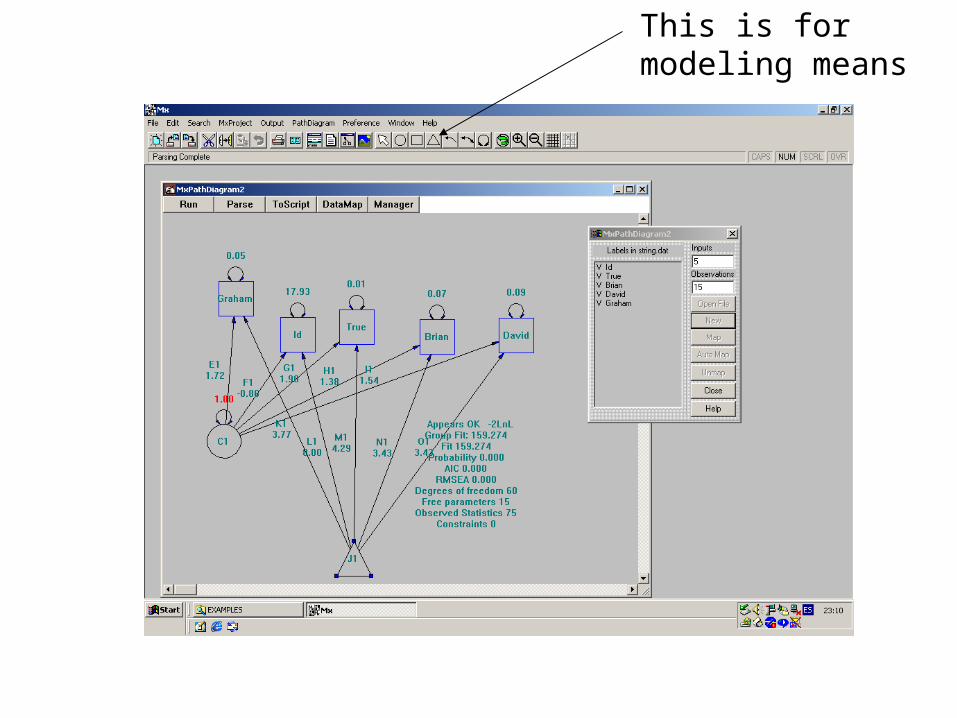
This is for modeling means
Analysis of Adoption data
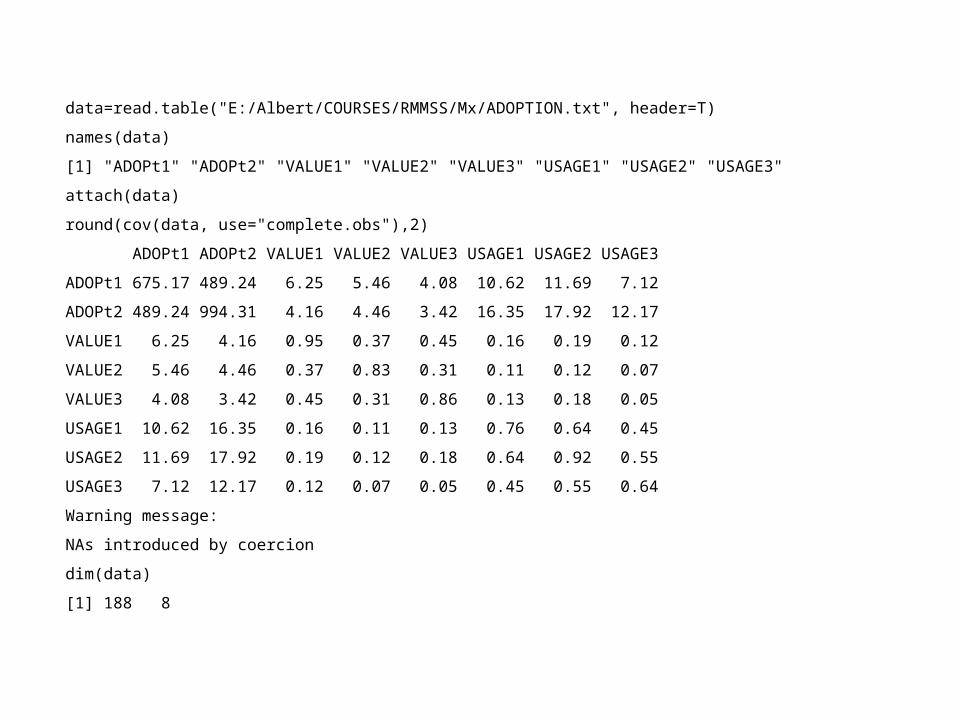
data=read.table("E:/Albert/COURSES/RMMSS/Mx/ADOPTION.txt", header=T)
names(data)
[1] "ADOPt1" "ADOPt2" "VALUE1" "VALUE2" "VALUE3" "USAGE1" "USAGE2" "USAGE3"
attach(data)
round(cov(data, use="complete.obs"),2)
ADOPt1 ADOPt2 VALUE1 VALUE2 VALUE3 USAGE1 USAGE2 USAGE3
ADOPt1 675.17 489.24 6.25 5.46 4.08 10.62 11.69 7.12
ADOPt2 489.24 994.31 4.16 4.46 3.42 16.35 17.92 12.17
VALUE1 6.25 4.16 0.95 0.37 0.45 0.16 0.19 0.12
VALUE2 5.46 4.46 0.37 0.83 0.31 0.11 0.12 0.07
VALUE3 4.08 3.42 0.45 0.31 0.86 0.13 0.18 0.05
USAGE1 10.62 16.35 0.16 0.11 0.13 0.76 0.64 0.45
USAGE2 11.69 17.92 0.19 0.12 0.18 0.64 0.92 0.55
USAGE3 7.12 12.17 0.12 0.07 0.05 0.45 0.55 0.64
Warning message:
NAs introduced by coercion
dim(data)
[1] 188 8
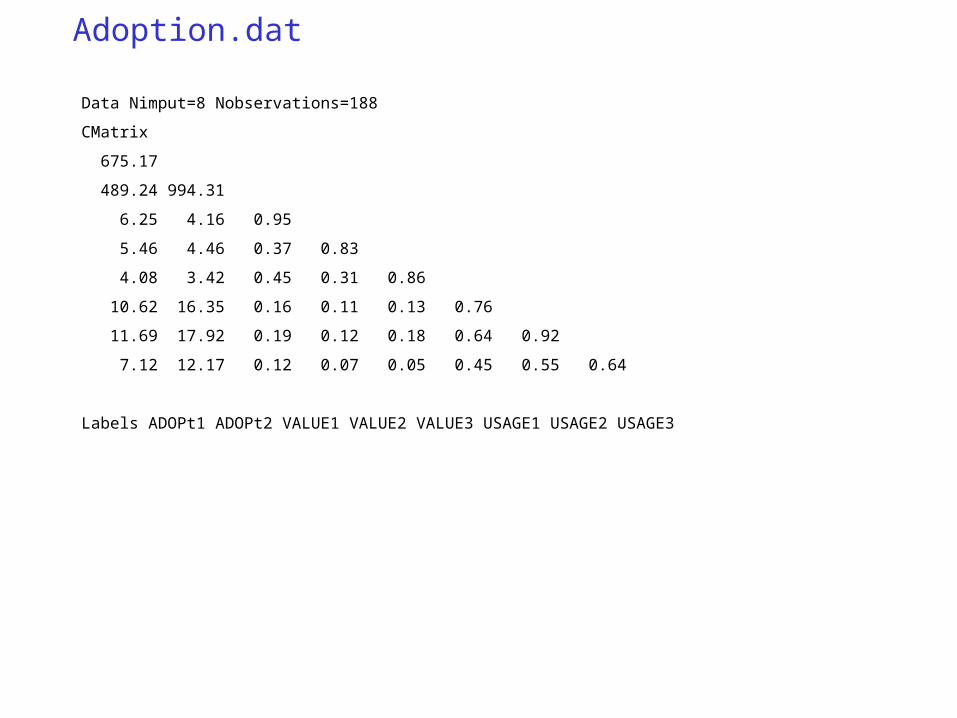
Data Nimput=8 Nobservations=188
CMatrix
675.17
489.24 994.31
6.25 4.16 0.95
5.46 4.46 0.37 0.83
4.08 3.42 0.45 0.31 0.86
10.62 16.35 0.16 0.11 0.13 0.76
11.69 17.92 0.19 0.12 0.18 0.64 0.92
7.12 12.17 0.12 0.07 0.05 0.45 0.55 0.64
Labels ADOPt1 ADOPt2 VALUE1 VALUE2 VALUE3 USAGE1 USAGE2 USAGE3
Adoption.dat
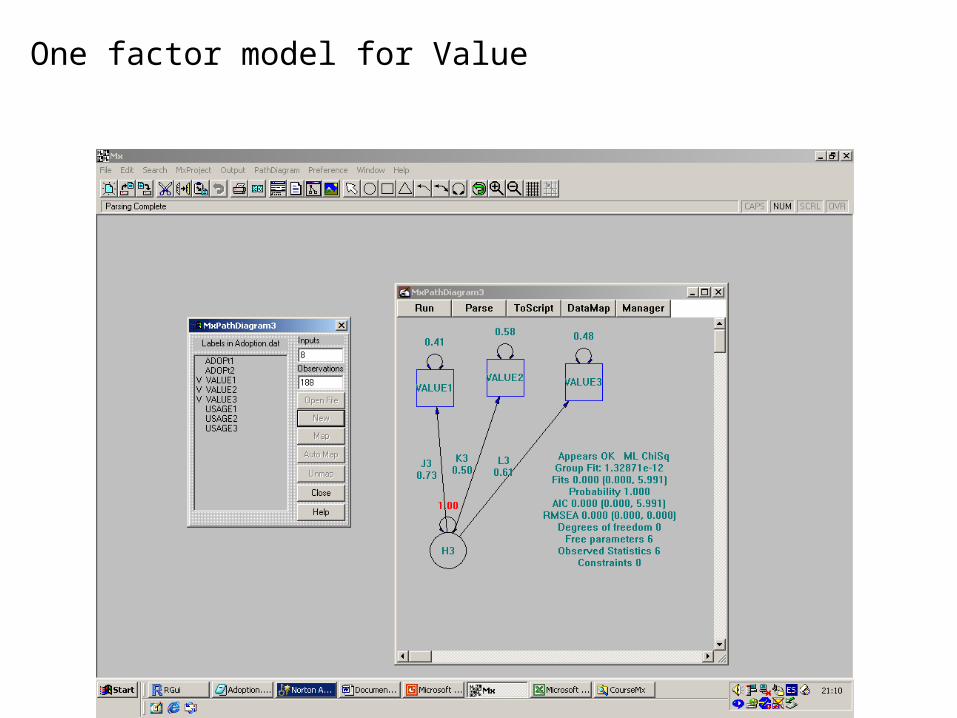
One factor model for Value
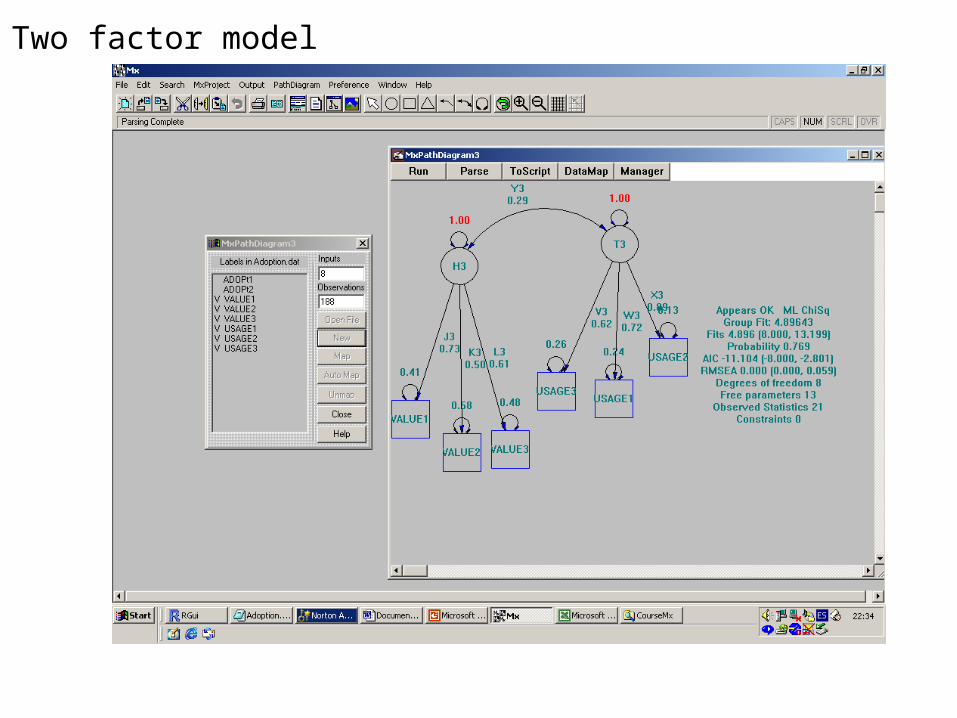
Two factor model
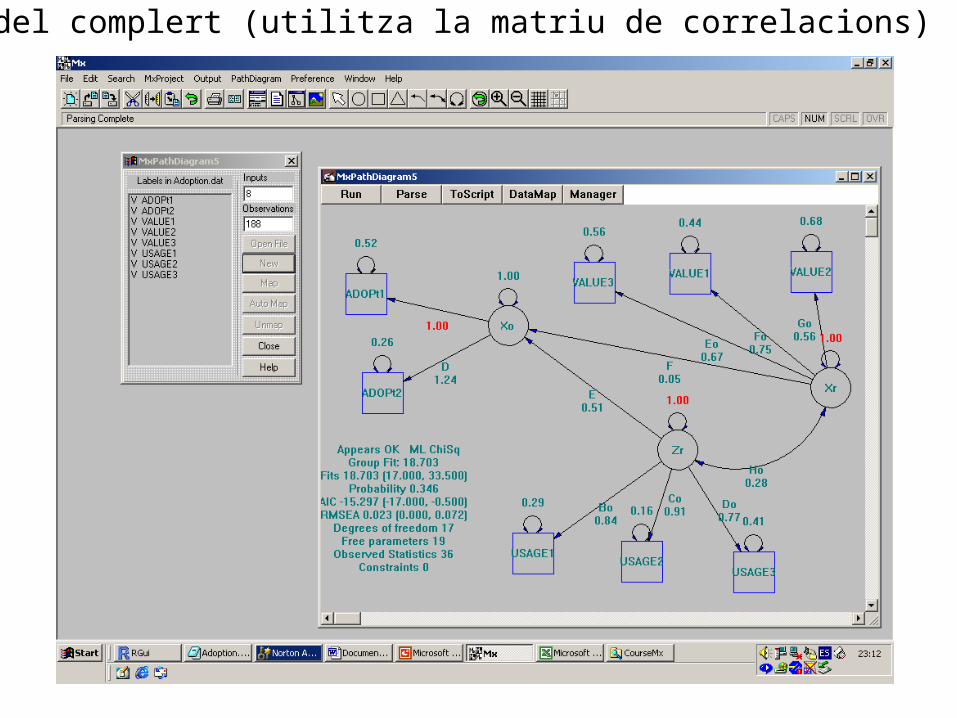
Model complert (utilitza la matriu de correlacions)
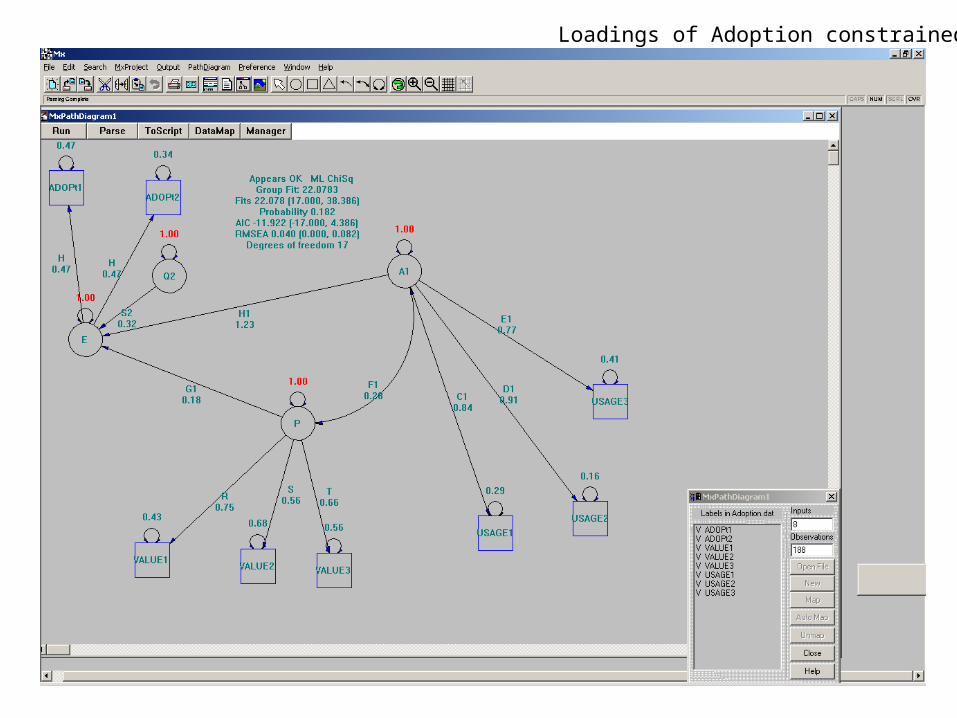
Loadings of Adoption constrained.
Loadings of Adoption constrained
Exercices
Lattin et al. pp. 383-385: 10.1 to 10.7, and specially 10.7

10.7 of p. 384 (Lettin et al. )
Impact of students’ attitude toward math and their evaluation. Students in the program were surveyed Twice about their attitude (once at the beginning of the fall semester and again at the beginning of the srping semester). The researcher has also access to the score of a graduate-level student attitude test from the program application.
The researcher used the following three questions to assess attitude toward math (each measured on a seven point semantic differntial scale). X1 Nervous-ConfidentX2 Capable-IneptX3 Angry-HappyXX1 to XX3, the same on time 2The researcher captured the student’s evaluation of the quantitative course with the following Three measures (all measured on a sevent point Likert scale from 7 = strongly agree to 1 = strongly disagree ) Y1 I will be able to use what I learnedY2 The subject matter of this course was not relevant to meY3 This was a great course
Tscore Apptitude Test Score (from the program application)
Research Question: Test the hypothesis that there is no effect of attitude toward math on student evaluations of the new quantitative course, controlling for the effect of student aptitude. What do you conclude ?.

data= read.table("E:/Albert/COURSES/RMMSS/MATH_ATTITUDElabels.txt", header=T)> attach(data)> names(data) [1] "ID" "X1" "X2" "X3" "XX1" "XX2" "XX3" "Y1" [9] "Y2" "Y3" "Tscore" pairs(data[,2:10])
dim(data)[1] 141 11 > round(cor(data[,2:11]),2) X1 X2 X3 XX1 XX2 XX3 Y1 Y2 Y3 TscoreX1 1.00 -0.65 0.61 0.86 -0.62 0.54 0.33 -0.20 0.28 0.15X2 -0.65 1.00 -0.56 -0.60 0.84 -0.49 -0.22 0.16 -0.18 -0.14X3 0.61 -0.56 1.00 0.59 -0.54 0.86 0.25 -0.17 0.28 0.04XX1 0.86 -0.60 0.59 1.00 -0.78 0.73 0.24 -0.17 0.26 0.08XX2 -0.62 0.84 -0.54 -0.78 1.00 -0.70 -0.18 0.15 -0.20 -0.12XX3 0.54 -0.49 0.86 0.73 -0.70 1.00 0.18 -0.14 0.25 0.03Y1 0.33 -0.22 0.25 0.24 -0.18 0.18 1.00 -0.58 0.62 0.29Y2 -0.20 0.16 -0.17 -0.17 0.15 -0.14 -0.58 1.00 -0.50 -0.15Y3 0.28 -0.18 0.28 0.26 -0.20 0.25 0.62 -0.50 1.00 0.19Tscore 0.15 -0.14 0.04 0.08 -0.12 0.03 0.29 -0.15 0.19 1.00 > round(cov(data[,2:11]),2) X1 X2 X3 XX1 XX2 XX3 Y1 Y2 Y3 TscoreX1 2.62 -1.67 1.60 2.47 -1.77 1.59 0.85 -0.47 0.66 12.53X2 -1.67 2.51 -1.43 -1.69 2.36 -1.42 -0.57 0.37 -0.42 -11.62X3 1.60 -1.43 2.64 1.69 -1.56 2.55 0.65 -0.40 0.66 3.72XX1 2.47 -1.69 1.69 3.16 -2.48 2.37 0.67 -0.43 0.67 7.71XX2 -1.77 2.36 -1.56 -2.48 3.16 -2.30 -0.50 0.38 -0.52 -11.77XX3 1.59 -1.42 2.55 2.37 -2.30 3.36 0.52 -0.38 0.68 2.89Y1 0.85 -0.57 0.65 0.67 -0.50 0.52 2.56 -1.36 1.44 24.25Y2 -0.47 0.37 -0.40 -0.43 0.38 -0.38 -1.36 2.10 -1.04 -11.59Y3 0.66 -0.42 0.66 0.67 -0.52 0.68 1.44 -1.04 2.09 14.44Tscore 12.53 -11.62 3.72 7.71 -11.77 2.89 24.25 -11.59 14.44 2808.07>>
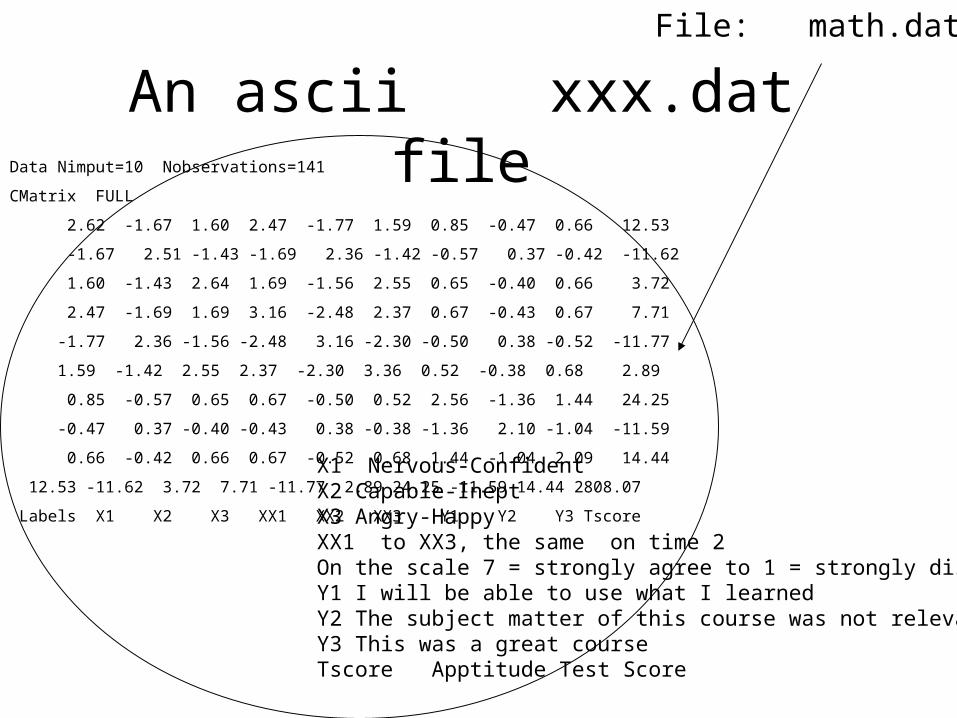
An ascii xxx.dat file Data Nimput=10 Nobservations=141
CMatrix FULL
2.62 -1.67 1.60 2.47 -1.77 1.59 0.85 -0.47 0.66 12.53
-1.67 2.51 -1.43 -1.69 2.36 -1.42 -0.57 0.37 -0.42 -11.62
1.60 -1.43 2.64 1.69 -1.56 2.55 0.65 -0.40 0.66 3.72
2.47 -1.69 1.69 3.16 -2.48 2.37 0.67 -0.43 0.67 7.71
-1.77 2.36 -1.56 -2.48 3.16 -2.30 -0.50 0.38 -0.52 -11.77
1.59 -1.42 2.55 2.37 -2.30 3.36 0.52 -0.38 0.68 2.89
0.85 -0.57 0.65 0.67 -0.50 0.52 2.56 -1.36 1.44 24.25
-0.47 0.37 -0.40 -0.43 0.38 -0.38 -1.36 2.10 -1.04 -11.59
0.66 -0.42 0.66 0.67 -0.52 0.68 1.44 -1.04 2.09 14.44
12.53 -11.62 3.72 7.71 -11.77 2.89 24.25 -11.59 14.44 2808.07
Labels X1 X2 X3 XX1 XX2 XX3 Y1 Y2 Y3 Tscore
File: math.dat
X1 Nervous-ConfidentX2 Capable-IneptX3 Angry-HappyXX1 to XX3, the same on time 2On the scale 7 = strongly agree to 1 = strongly disagree Y1 I will be able to use what I learnedY2 The subject matter of this course was not relevant to meY3 This was a great course Tscore Apptitude Test Score
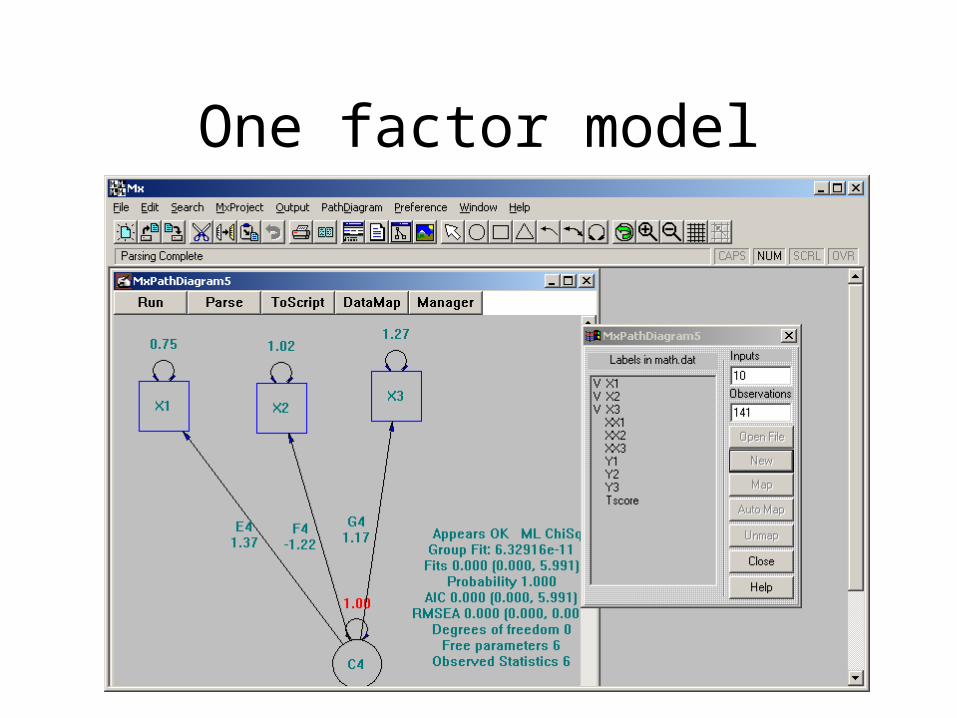
One factor model
The costumer Orientatin of Service Workers: Personality
Trait Effects on Self and Supervisor Performance Ratings
Tom J. Brown et al.
May 2000
(forthcoming, Journal of Marketing Research)

The items Measures Used in Analyses
Introversion (9-point, "never-always;" = .86) Conscientiousness (9-point, "never-always;" = .73)Feel bashful more than others. Precise.Quiet when with people. Organized.Shy. Sloppy. (R)
Orderly.Instability (9-point, "never-always;" = .88)Moody more than others. Openness (9-point, "never-always;" = .83)Temperamental. Frequently feel highly creative.Envious. Imaginative.Emotions go way up and down. Appreciate art.Testy more than others. Find novel solutions.
More original than others.
Agreeability (9-point, "never-always;" = .85) Activity (9-point, "never-always;" = .79)Tender hearted with others. Have a hard time keeping still.Sympathetic. Extremely active in my daily life.Kind to others. Have a hard time sitting around.
Customer Orientation (reliability for the linear composite = .92)Enjoyment Dimension (9-point, "strongly disagree-strongly agree;" = .88)I find it easy to smile at each of my customers.I enjoy remembering my customers' names.It comes naturally to have empathy for my customers.I enjoy responding quickly to my customers' requests.I get satisfaction from making my customers happy.I really enjoy serving my customers.
Needs Dimension (9-point, "strongly disagree-strongly agree;" = .87)I try to help customers achieve their goals.I achieve my own goals by satisfying customers.I get customers to talk about their service needs with me.I take a problem solving approach with my customers.I keep the best interests of the customer in mind.I am able to answer a customer's questions correctly.
Performance Evaluations (7-point, "among the worst in the company-among the best in the company")Overall quantity of work performed.Overall quality of work performed.(Identical scales used for self and supervisor performance evaluation)
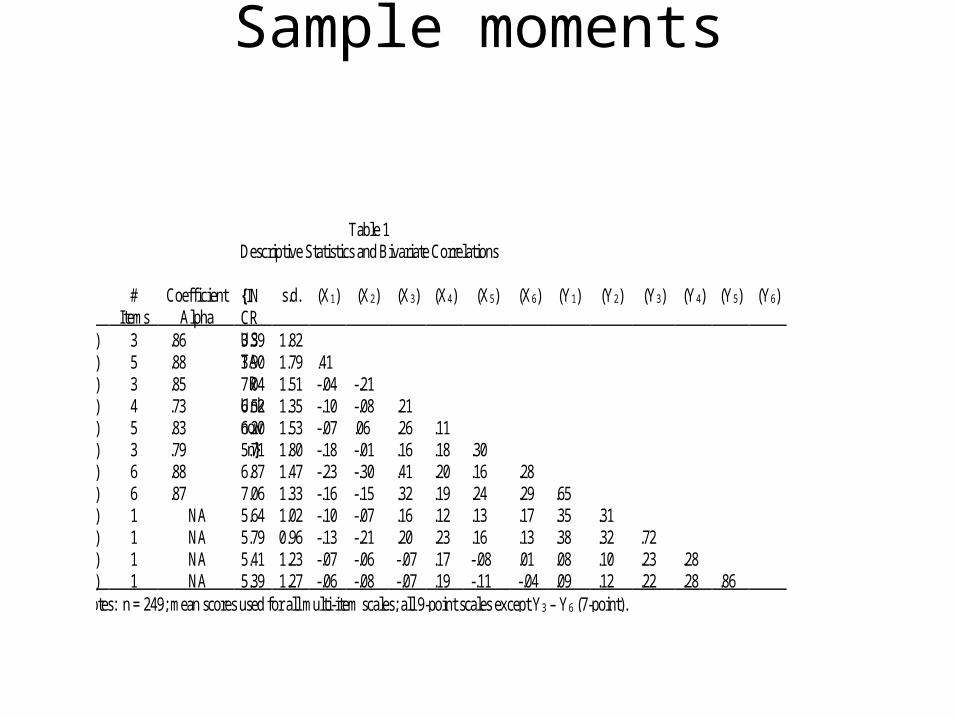
Sample moments
Table 1Descriptive Statistics and Bivariate Correlations
#Items
CoefficientAlpha
{INCRUSTA
RUnknown}
s.d. (X1) (X2) (X3) (X4) (X5) (X6) (Y1) (Y2) (Y3) (Y4) (Y5) (Y6)
) 3 .86 3.39 1.82) 5 .88 3.90 1.79 .41) 3 .85 7.04 1.51 -.04 -.21) 4 .73 6.52 1.35 -.10 -.08 .21) 5 .83 6.20 1.53 -.07 .06 .26 .11) 3 .79 5.71 1.80 -.18 -.01 .16 .18 .30) 6 .88 6.87 1.47 -.23 -.30 .41 .20 .16 .28) 6 .87 7.06 1.33 -.16 -.15 .32 .19 .24 .29 .65) 1 NA 5.64 1.02 -.10 -.07 .16 .12 .13 .17 .35 .31) 1 NA 5.79 0.96 -.13 -.21 .20 .23 .16 .13 .38 .32 .72) 1 NA 5.41 1.23 -.07 -.06 -.07 .17 -.08 .01 .08 .10 .23 .28) 1 NA 5.39 1.27 -.06 -.08 -.07 .19 -.11 -.04 .09 .12 .22 .28 .86
otes: n = 249; mean scores used for all multi-item scales; all 9-point scales except Y3 – Y6 (7-point).
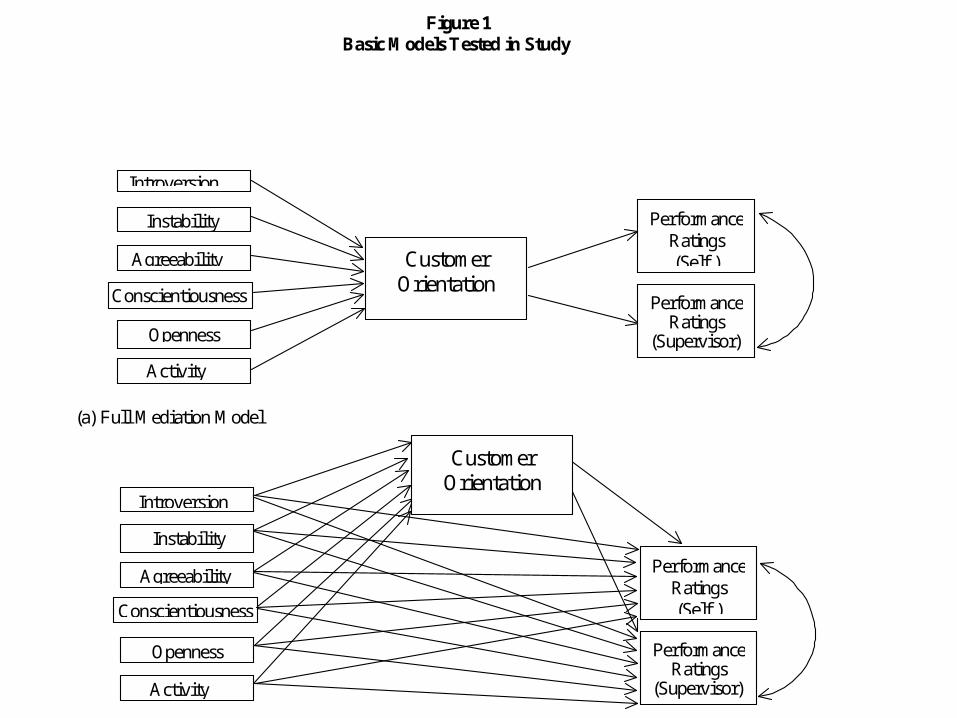
Figure 1Basic Models Tested in Study
Conscientiousness
(a) Full Mediation Model
Introversion
Instability
Agreeability
Openness
Activity
Introversion
Instability
Agreeability
Conscientiousness
Openness
Activity
(b) Partial Mediation Model
PerformanceRatings(Self )
PerformanceRatings
(Supervisor)
PerformanceRatings(Self )
PerformanceRatings
(Supervisor)
CustomerOrientation
CustomerOrientation