Using minitab instead of tables for z values probabilities etc
25
USING MINITAB INSTEAD OF TABLES Z VALUES, PROBABILITIES, ETC. B. Heard Not to be posted, shared or transmitted without my permission. Students may download one copy for their own personal use.
-
Upload
brent-heard -
Category
Education
-
view
1.164 -
download
2
Transcript of Using minitab instead of tables for z values probabilities etc
USING MINITAB INSTEAD OF TABLES
Z VALUES, PROBABILITIES, ETC.
B. Heard
Not to be posted, shared or transmitted without my permission. Students may download one copy for their own personal use.
USING MINITAB INSTEAD OF TABLESFirst, I will note that learning to use tables in a statistics class is important.
However, I will also note that if you have access to Minitab, it is much easier and much less stress on your eyes…
So let’s take a look at some basic questions and approach them with the table and Minitab to see if we get the same answers.

USING MINITAB INSTEAD OF TABLESQuestion: Find the area to the left (probability of being less than) for a z score of 1.35.
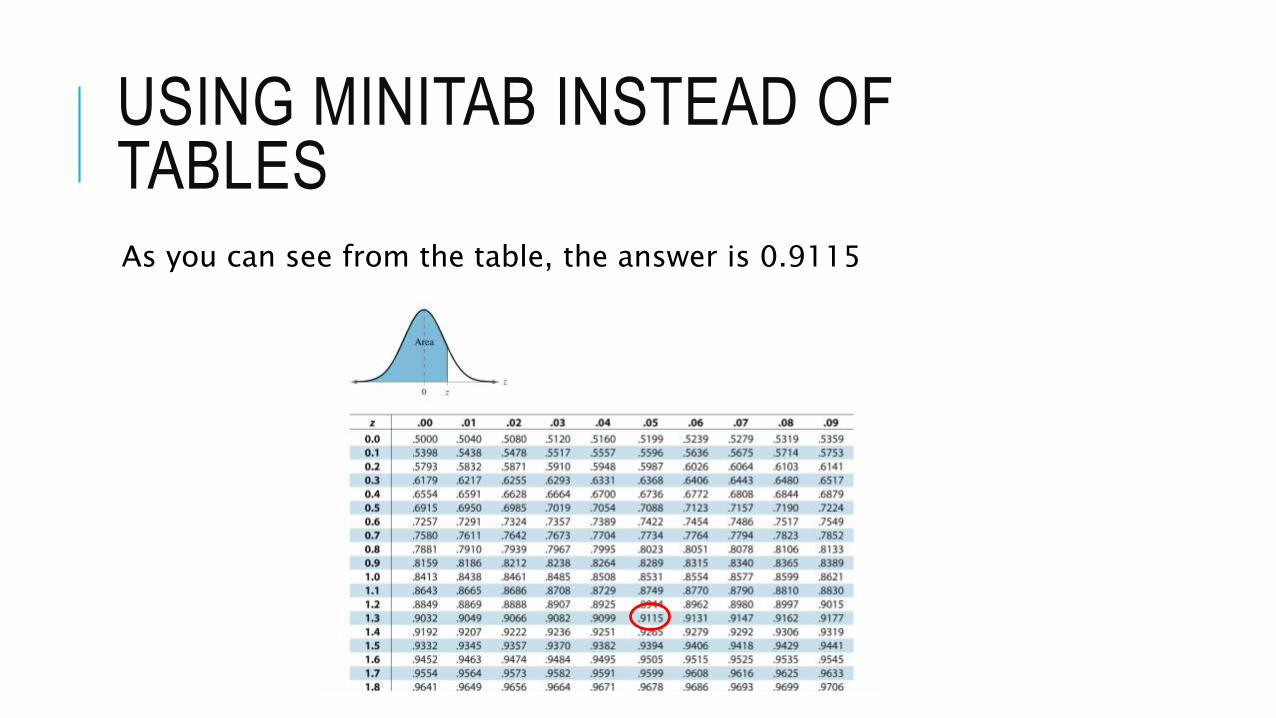
USING MINITAB INSTEAD OF TABLESAs you can see from the table, the answer is 0.9115
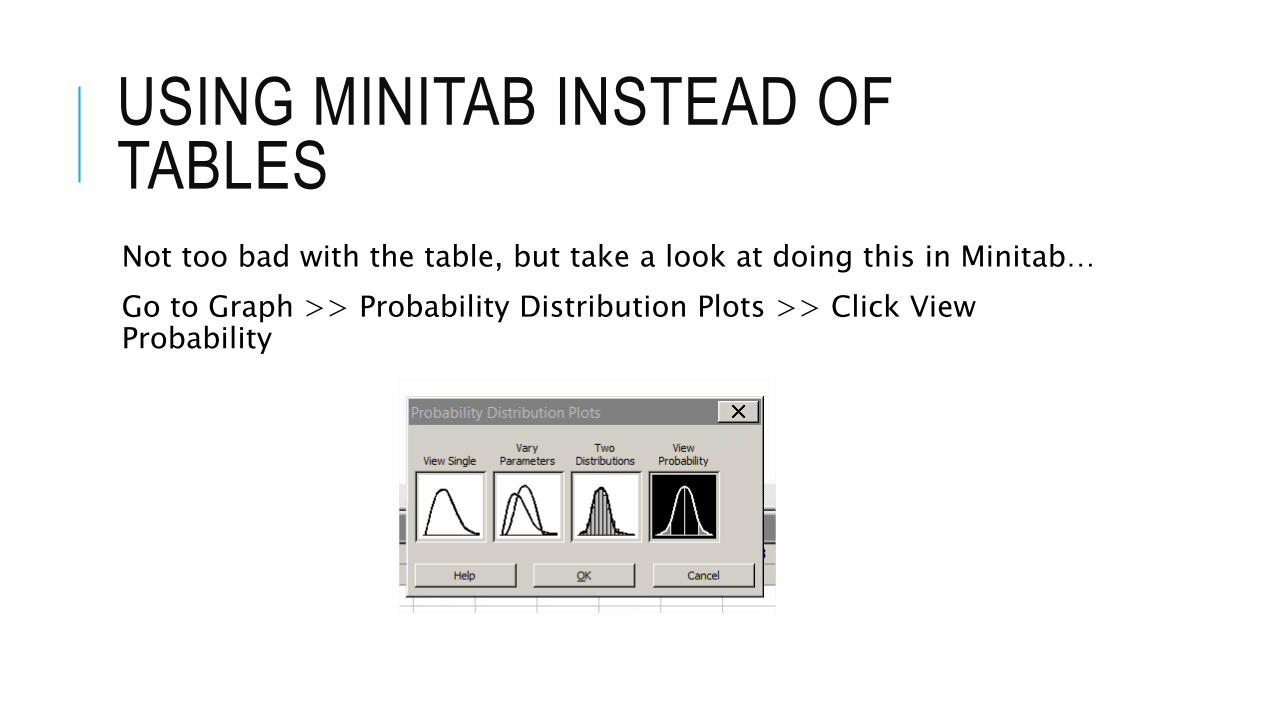
USING MINITAB INSTEAD OF TABLESNot too bad with the table, but take a look at doing this in Minitab…
Go to Graph >> Probability Distribution Plots >> Click View Probability
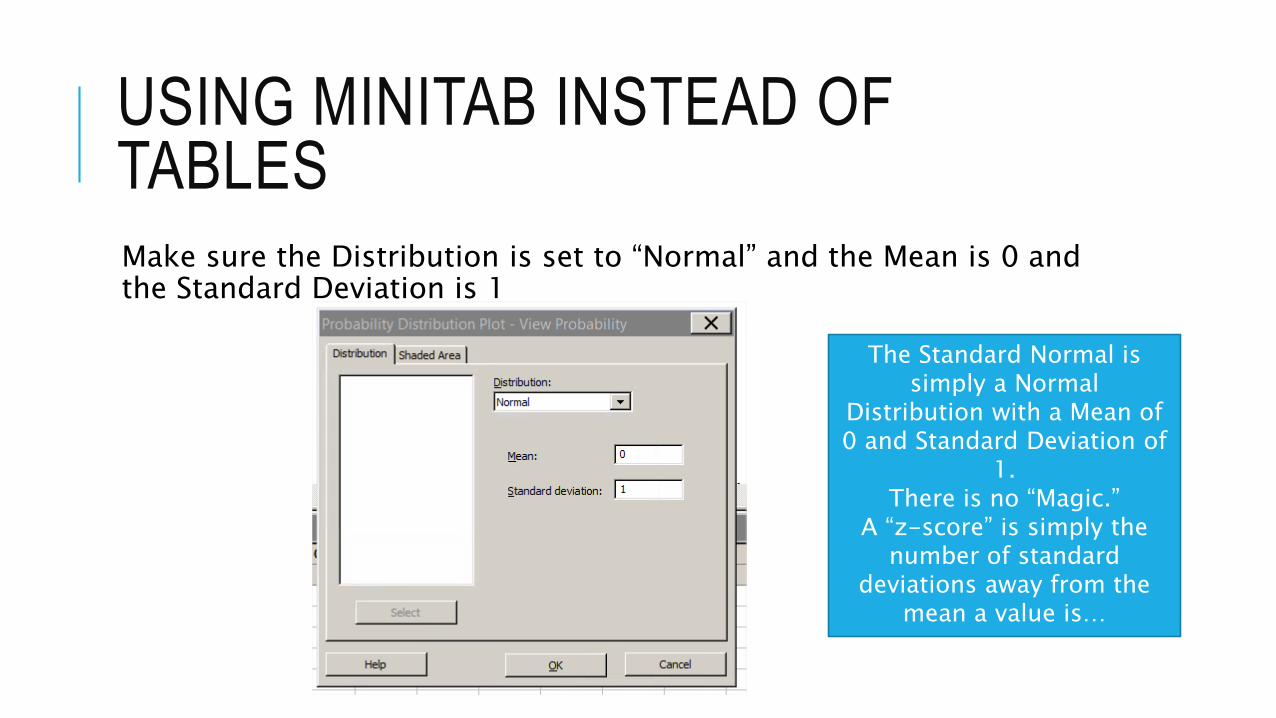
USING MINITAB INSTEAD OF TABLESMake sure the Distribution is set to “Normal” and the Mean is 0 and the Standard Deviation is 1
The Standard Normal is simply a Normal
Distribution with a Mean of 0 and Standard Deviation of
1.There is no “Magic.”
A “z-score” is simply the number of standard
deviations away from the mean a value is…
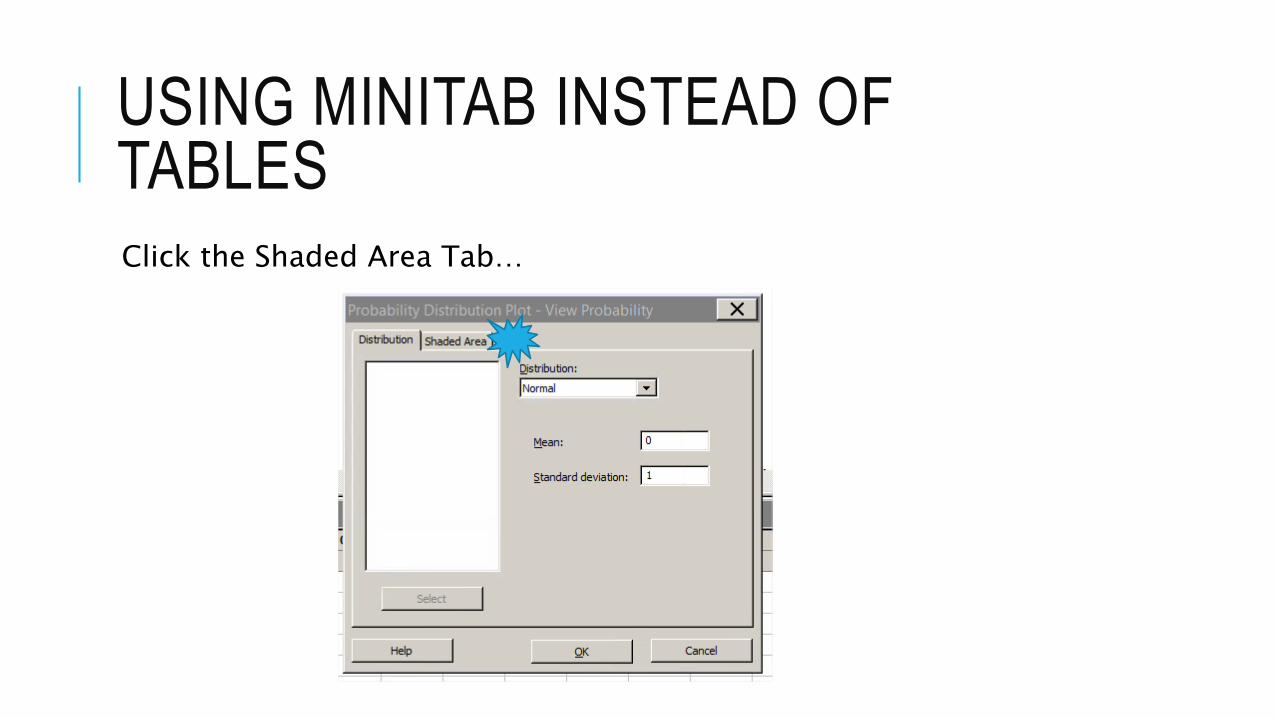
USING MINITAB INSTEAD OF TABLESClick the Shaded Area Tab…
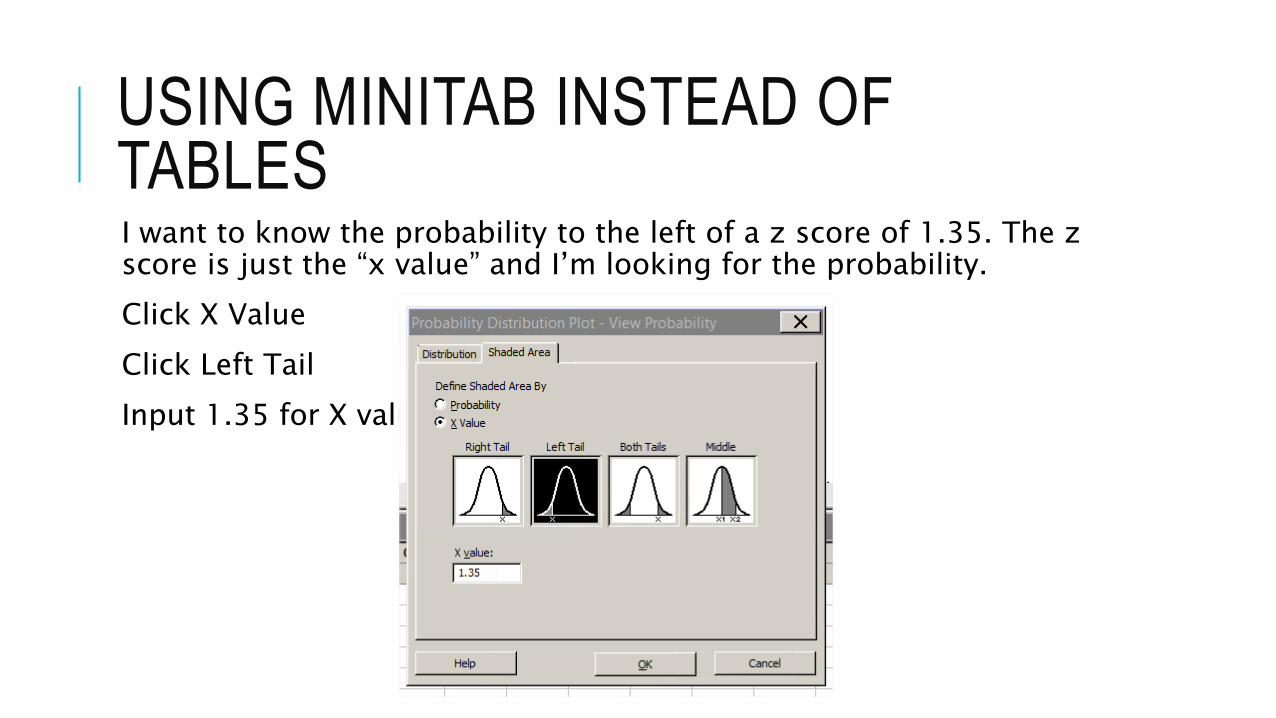
USING MINITAB INSTEAD OF TABLESI want to know the probability to the left of a z score of 1.35. The z score is just the “x value” and I’m looking for the probability.
Click X Value
Click Left Tail
Input 1.35 for X value
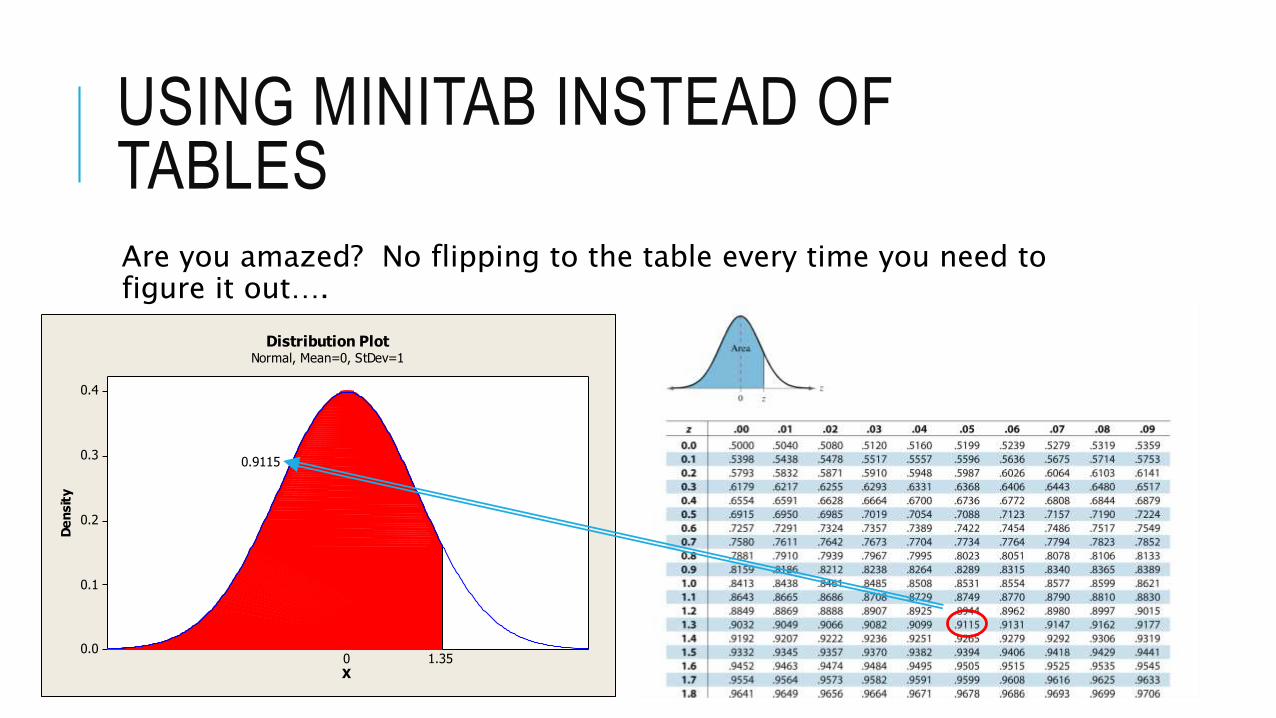
USING MINITAB INSTEAD OF TABLESAre you amazed? No flipping to the table every time you need to figure it out….
0.4
0.3
0.2
0.1
0.0
X
De
nsit
y
1.35
0.9115
0
Distribution PlotNormal, Mean=0, StDev=1
USING MINITAB INSTEAD OF TABLESQuestion: Find the area to the right (probability of being greater than) for a z score of -2.07.
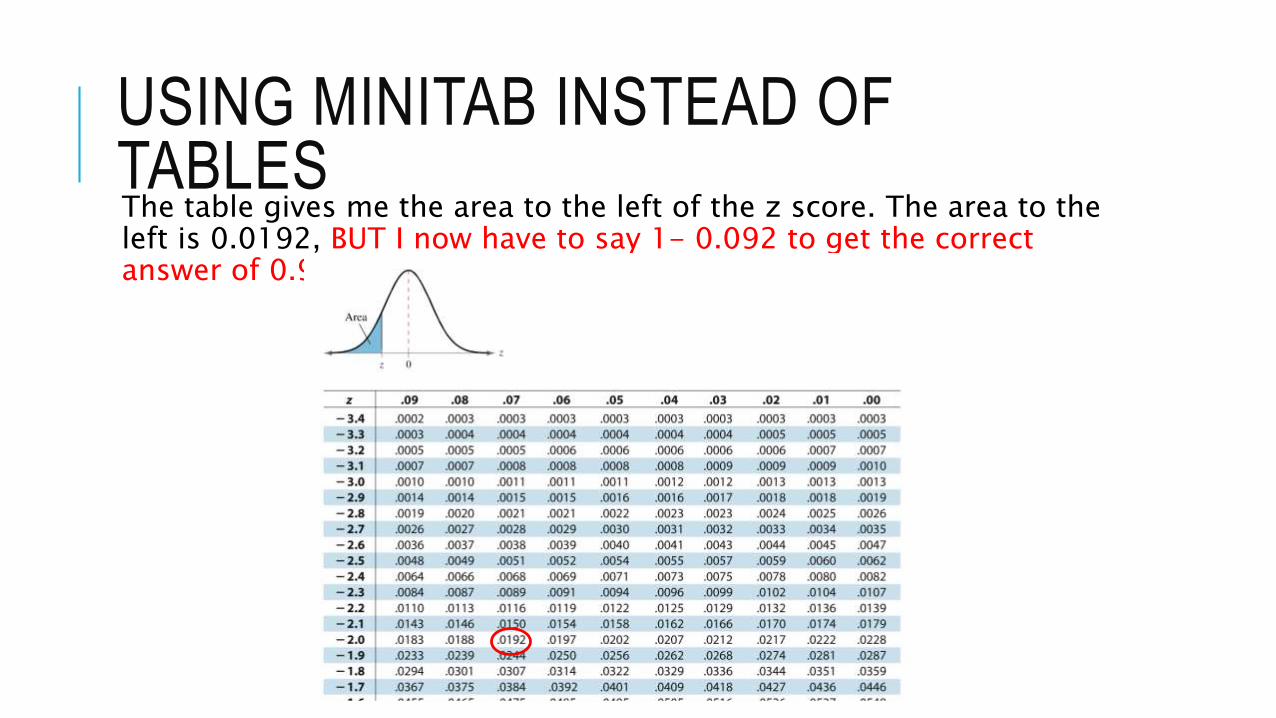
USING MINITAB INSTEAD OF TABLESThe table gives me the area to the left of the z score. The area to the left is 0.0192, BUT I now have to say 1- 0.092 to get the correct answer of 0.9808
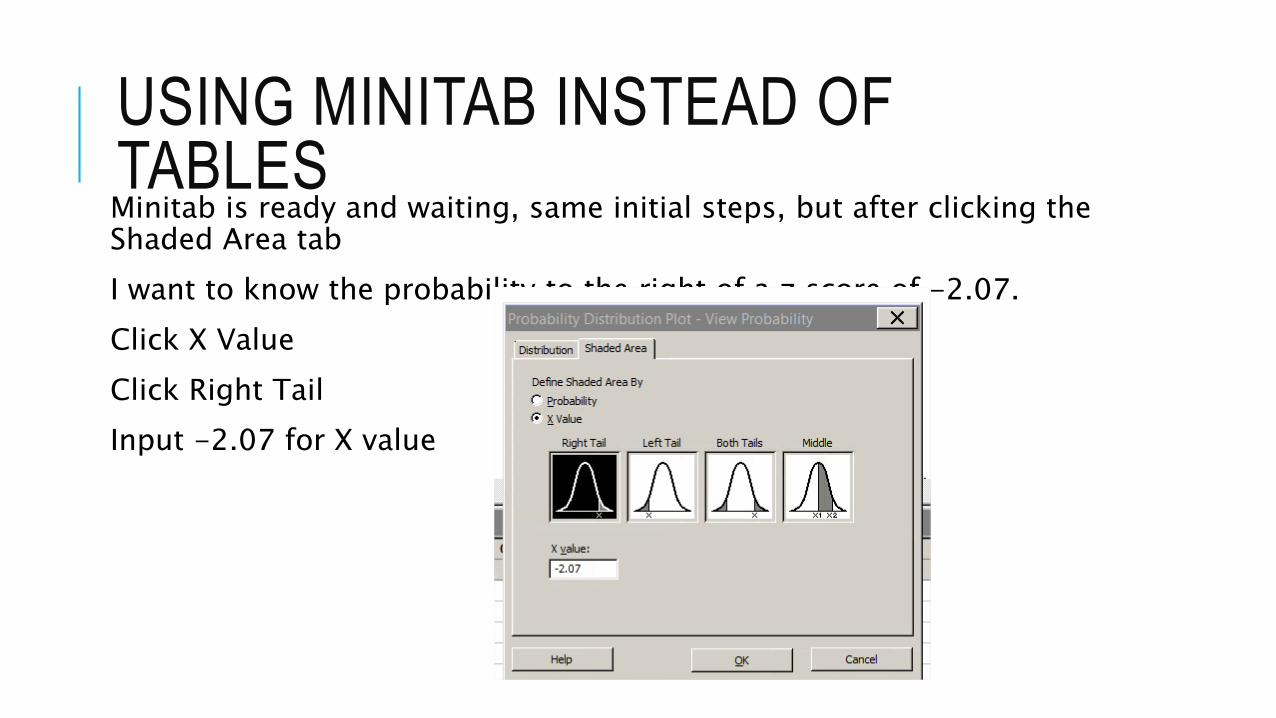
USING MINITAB INSTEAD OF TABLESMinitab is ready and waiting, same initial steps, but after clicking the Shaded Area tab
I want to know the probability to the right of a z score of -2.07.
Click X Value
Click Right Tail
Input -2.07 for X value
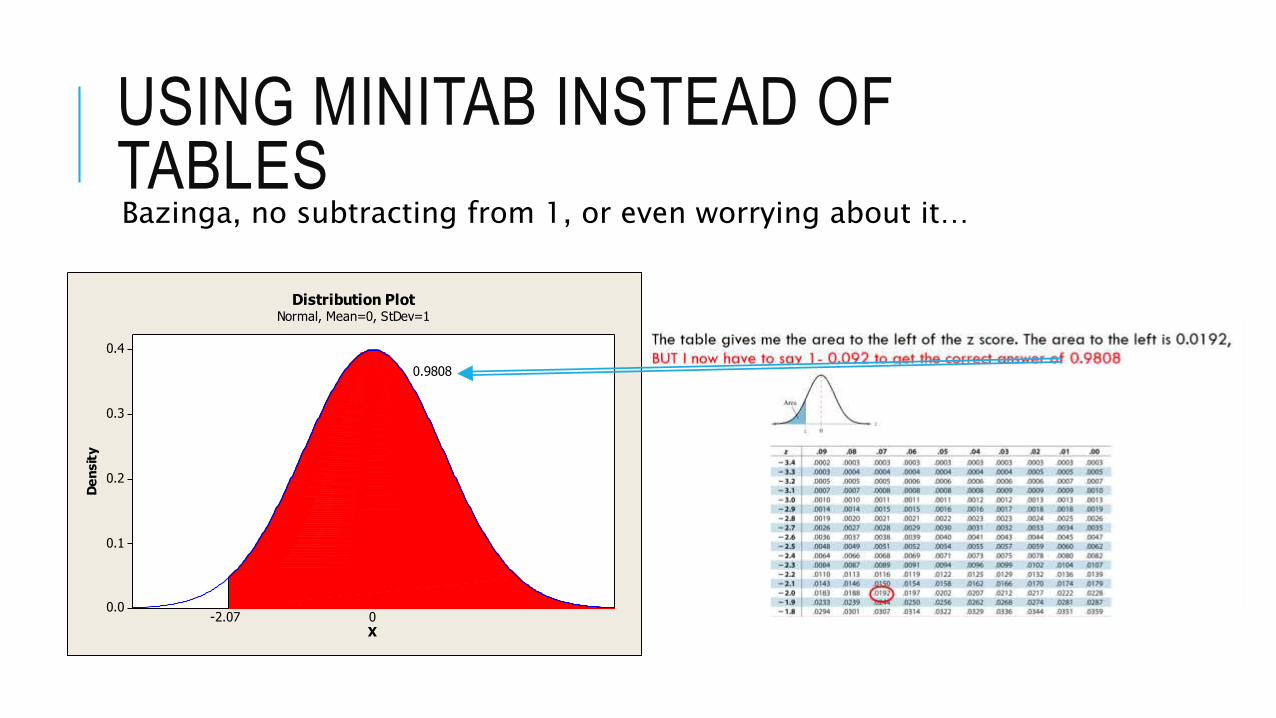
USING MINITAB INSTEAD OF TABLESBazinga, no subtracting from 1, or even worrying about it…
0.4
0.3
0.2
0.1
0.0
X
De
nsit
y
-2.07
0.9808
0
Distribution PlotNormal, Mean=0, StDev=1
USING MINITAB INSTEAD OF TABLESQuizzes are known to include questions like P(-0.31<z<1.38)…
With the tables, you have to find the probability values for both, subtract the largest from the smallest, etc. etc.
It works great, but leaves room for calculation errors…
USING MINITAB INSTEAD OF TABLES
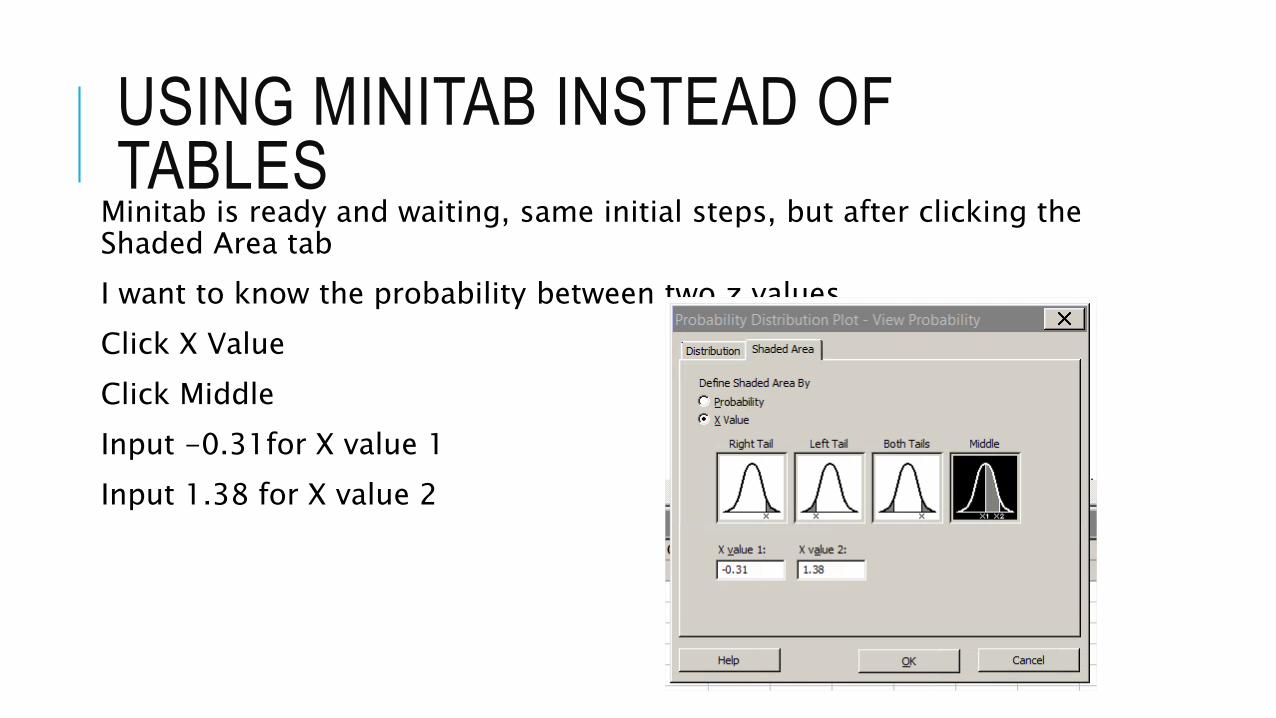
Minitab is ready and waiting, same initial steps, but after clicking the Shaded Area tab
I want to know the probability between two z values.
Click X Value
Click Middle
Input -0.31for X value 1
Input 1.38 for X value 2
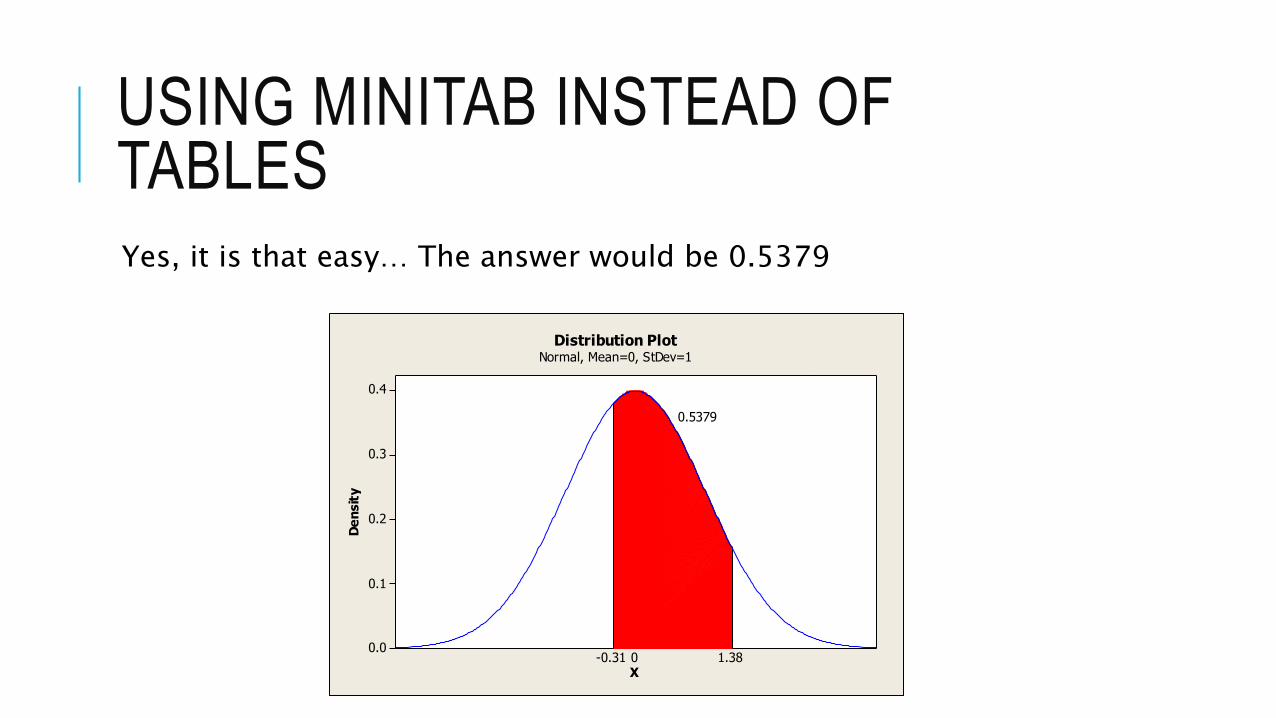
USING MINITAB INSTEAD OF TABLESYes, it is that easy… The answer would be 0.5379
0.4
0.3
0.2
0.1
0.0
X
De
nsit
y
-0.31
0.5379
1.380
Distribution PlotNormal, Mean=0, StDev=1
USING MINITAB INSTEAD OF TABLESThe other type question they can ask, is something like “Find the z value with a probability of 0.4483 to the left or a probability of 0.4483 for “less than z”
Same general approach, BUT after clicking the Shaded Area Tab
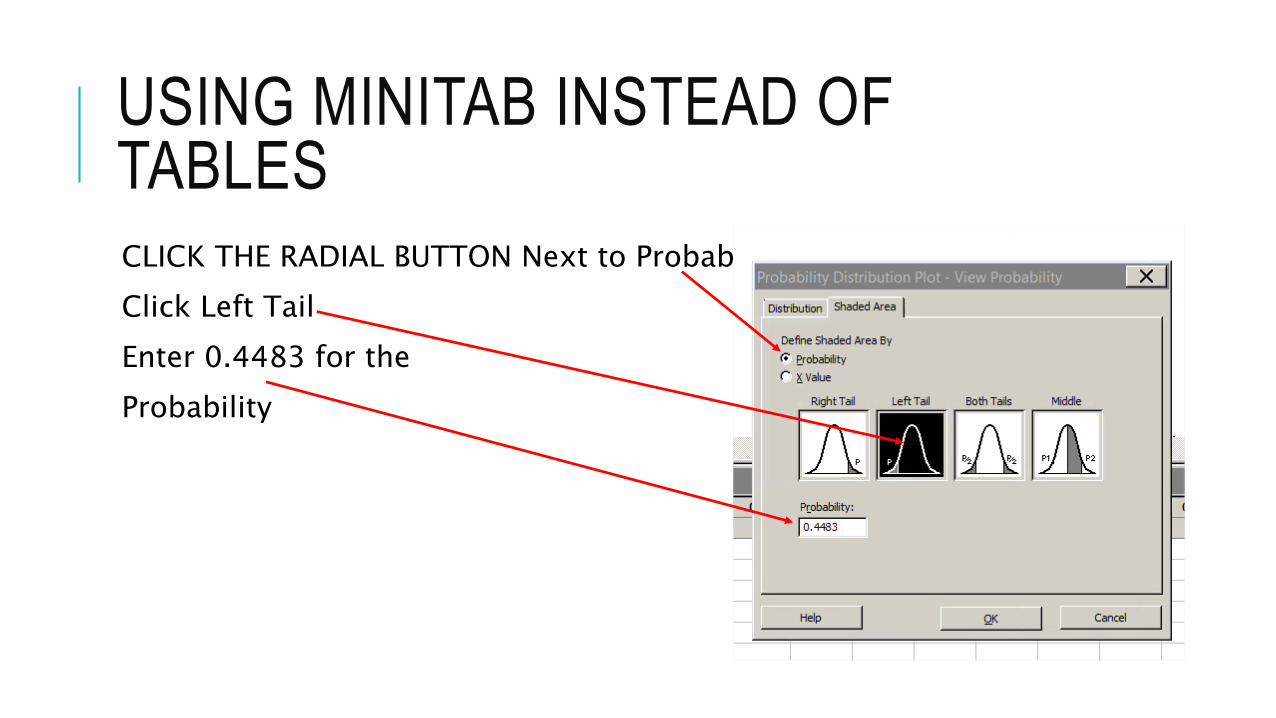
USING MINITAB INSTEAD OF TABLESCLICK THE RADIAL BUTTON Next to Probability
Click Left Tail
Enter 0.4483 for the
Probability
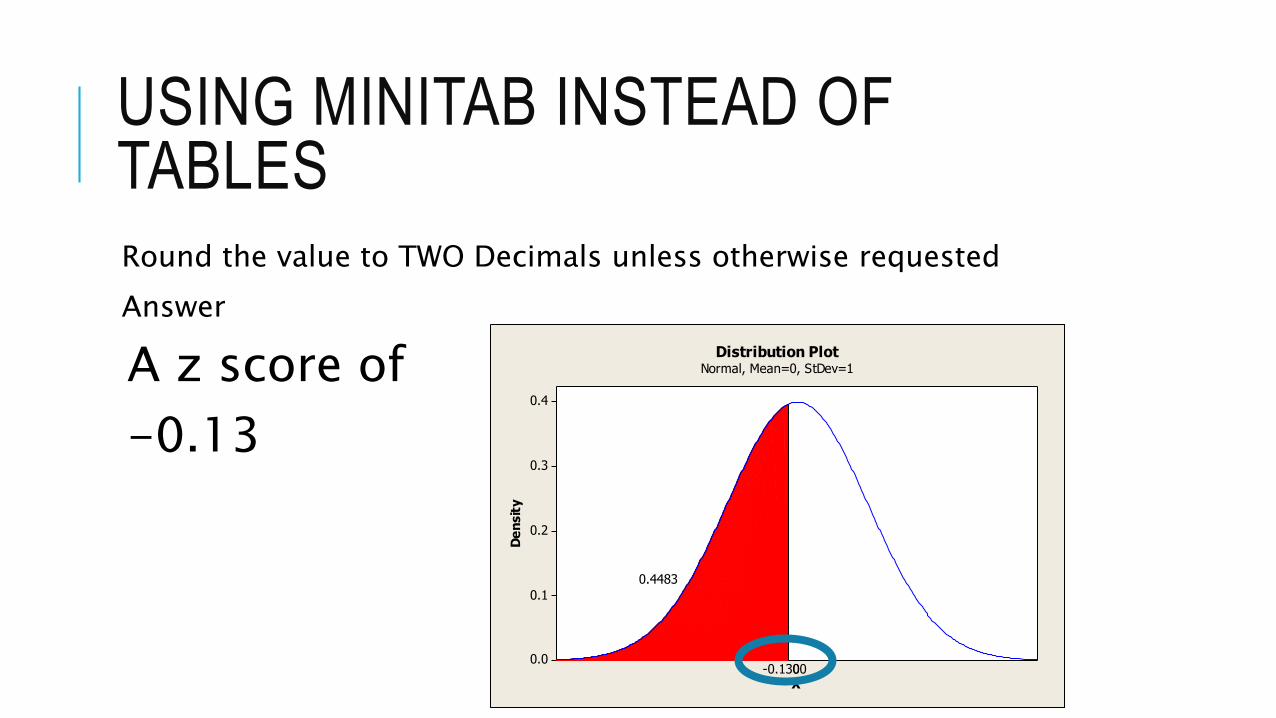
USING MINITAB INSTEAD OF TABLESRound the value to TWO Decimals unless otherwise requested
Answer
A z score of
-0.130.4
0.3
0.2
0.1
0.0
X
De
nsit
y
-0.1300
0.4483
0
Distribution PlotNormal, Mean=0, StDev=1
USING MINITAB INSTEAD OF TABLESYou can do the same thing for probabilities greater than using a Right Tail.
There is one other type of question that sometimes throws students and Minitab makes it incredibly easy…

USING MINITAB INSTEAD OF TABLESFind the values for +/- z where 75.4%% of the area is distributed symmetrically between the two values.
They may say word it, “Find +/- z, where 0.7540 = P(-z<x<z)
This one is incredibly easy.

USING MINITAB INSTEAD OF TABLESFind the values for +/- z where 75.4% of the area is distributed symmetrically between the two values.
They may say word it, “Find +/- z, where 0.7540 = P(-z<x<z)
Ask yourself how much area is in the tails? (1-0.7540 = 0.2460)
Ok, remember I have 0.2460 TOTAL AREA IN BOTH TAILS
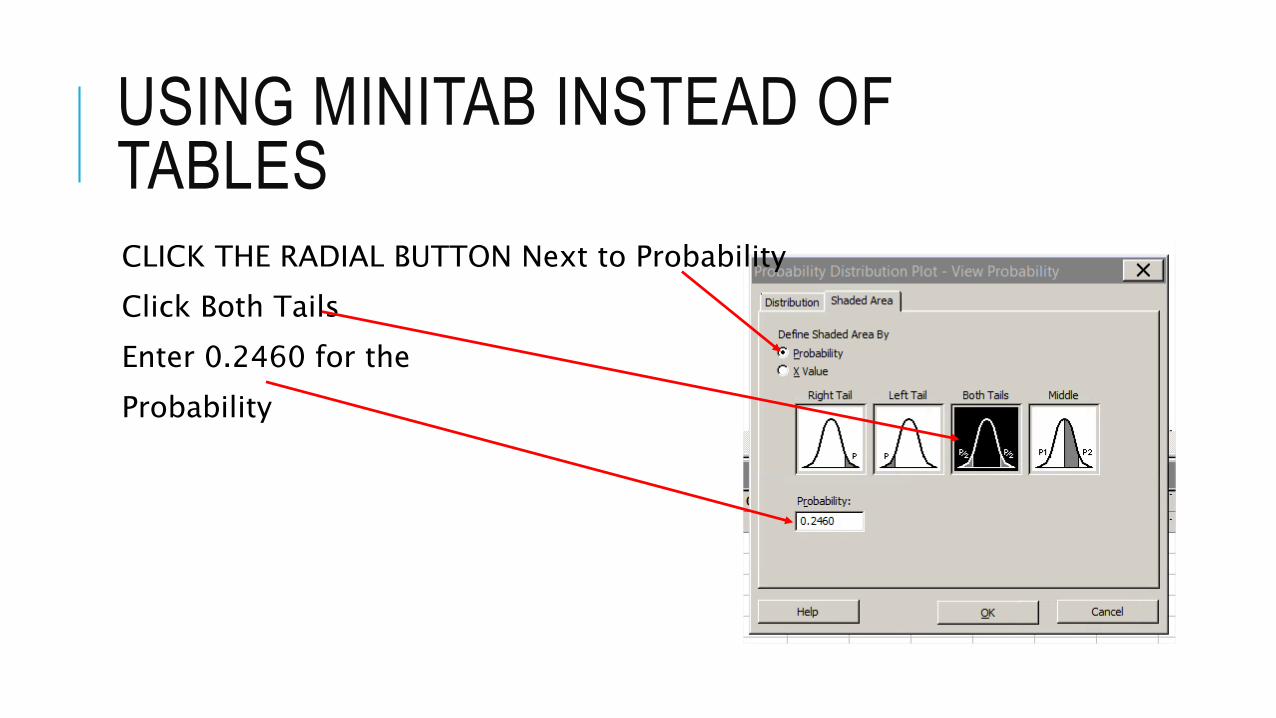
USING MINITAB INSTEAD OF TABLESCLICK THE RADIAL BUTTON Next to Probability
Click Both Tails
Enter 0.2460 for the
Probability

USING MINITAB INSTEAD OF TABLESWhat is my answer? -1.16 and 1.16
0.4
0.3
0.2
0.1
0.0
X
De
nsit
y
-1.160
0.123
1.160
0.123
0
Distribution PlotNormal, Mean=0, StDev=1
USING MINITAB INSTEAD OF TABLESJust read the questions carefully and PRACTICE, PRACTICE, PRACTICE
Want to thank me?
Help a child with math, spend time with your family, call your parents…
Or watch one of my performances and like it YouTube
https://www.youtube.com/watch?v=zEzomXq43g0
https://www.youtube.com/watch?v=x9vsoP8wLAM
https://www.youtube.com/watch?v=q4993u8ZRdY
https://www.youtube.com/watch?v=SbXeza5v4b0
Views and those “Thumbs Ups” help me