Using Markets to Control Invasive Species: Lionfish in the ...
23
Using Markets to Control Invasive Species: Lionfish in the US Virgin Islands Skyler Simnitt, Lisa House, and Sherry L. Larkin, University of Florida; Jennifer Sweeney Tookes, Georgia Southern University; Tracy Yandle, Emory University ABSTRACT Invasive lionfish are affecting reef ecosystems along the Gulf Coast and Caribbean. By establishing commercial fisheries and harvesting lionfish in mass, it may be possible to reduce their ecological footprint in the region. None- theless, there has been little research assessing the viability of a consumer market for lionfish meat. Using data collected in the US Virgin Islands (USVI), this study examines individuals’ willingness to participate in a hypothet- ical market for lionfish meat and their potential consumption levels. Consumer willingness to pay (WTP) for lion- fish meat is also estimated. Findings suggest that individuals’ market participation and consumption levels are correlated with concerns for food safety and the environment, and consumer WTP is compatible with dockside prices of other species of reef fish. These findings suggest that a latent demand structure for lionfish meat may already exist in the USVI and that the prospect of a commercial fishery is worth additional exploration. Key words: Consumer preferences, contingent valuation, double hurdle Poisson, invasive lionfish. JEL codes: C24, Q21, Q22. INTRODUCTION There is scientific consensus that Earth’s coral reefs are under environmental threat. According to a 2008 study by the Global Coral Reef Monitoring Network, an estimated 19% of Earth’s coral reef systems have been lost, with an additional 15% expected to disappear in the following 10–20 years (Wilkinson 2008). Marine resource scientists attribute these losses to several factors, including ris- ing sea temperatures, overfishing, and pollutants. Invasive species are another threat. Lionfish are causing environmental and economic damage throughout reef systems in the Atlantic and Carib- bean (Albins and Hixon 2008, 2013). A carnivorous species of fish native to the Indo-Pacific, lion- fish (Pterois volitans) have no natural predators along the Atlantic coast, Caribbean, and Gulf of Skyler Simnitt is a research economist, USDA Economic Research Service, 6501 Beacon Drive, Kansas City, MO 64133 USA (email: [email protected]). Lisa House is a professor and chair, University of Florida, Institute of Food and Agricultural Sciences, Food and Resource Economics Department, PO Box 110240, Gainesville, FL 32611 USA (email: lahouse@ufl.edu). Sherry L. Larkin is a professor, University of Florida, Institute of Food and Agricultural Sciences, Food and Resource Eco- nomics Department, PO Box 110240, Gainesville, FL 32611 USA (email: slarkin@ufl.edu). Jennifer Sweeney Tookes is an assistant professor, Georgia Southern University, Department of Sociology and Anthropology, PO Box 8051, Statesboro, GA 30460 USA (email: [email protected]). Tracy Yandle is an associate professor, Emory University, Department of Environmental Sciences, 400 Dowman Drive, Atlanta, GA 30322 USA (email: [email protected]). This project was funded by NOAA Saltonstall-Kennedy Grant No. NA15SNMF4270347 and by the Florida Agricultural Ex- periment Station via Multistate Project W3004, “Marketing, Trade, and Management of Aquaculture and Fishery Resources.” Findings, opinions, and errors are the responsibility of the authors, not the granting agencies. The findings and conclusions in this publication are those of the authors and should not be construed to represent any official USDA or US government determi- nation or policy. Received January 23, 2019; Accepted June 11, 2020; Published online September 10, 2020. http://dx.doi.org/10.1086/710254 Marine Resource Economics, volume 35, number 4. © 2020 MRE Foundation, Inc. All rights reserved. 0738-1360/2020/3504-0001$10.00
Transcript of Using Markets to Control Invasive Species: Lionfish in the ...

Using Markets to Control Invasive Species:Lionfish in the US Virgin Islands
Skyler Simnitt, Lisa House, and Sherry L. Larkin, University of Florida;
Jennifer Sweeney Tookes, Georgia Southern University; Tracy Yandle, Emory University
ABSTRACT
Invasive lionfish are affecting reef ecosystems along the Gulf Coast and Caribbean. By establishing commercial
fisheries andharvesting lionfish inmass, itmaybepossible to reduce their ecological footprint in the region. None-
theless, there has been little research assessing the viability of a consumer market for lionfish meat. Using data
collected in the US Virgin Islands (USVI), this study examines individuals’willingness to participate in a hypothet-
ical market for lionfish meat and their potential consumption levels. Consumer willingness to pay (WTP) for lion-
fish meat is also estimated. Findings suggest that individuals’ market participation and consumption levels are
correlated with concerns for food safety and the environment, and consumer WTP is compatible with dockside
prices of other species of reef fish. These findings suggest that a latent demand structure for lionfish meat may
already exist in the USVI and that the prospect of a commercial fishery is worth additional exploration.
Key words: Consumer preferences, contingent valuation, double hurdle Poisson, invasive lionfish.
JEL codes: C24, Q21, Q22.
INTRODUCTION
There is scientific consensus that Earth’s coral reefs are under environmental threat. According to a2008 study by the Global Coral Reef Monitoring Network, an estimated 19% of Earth’s coral reefsystems have been lost, with an additional 15% expected to disappear in the following 10–20 years(Wilkinson 2008). Marine resource scientists attribute these losses to several factors, including ris-ing sea temperatures, overfishing, and pollutants. Invasive species are another threat. Lionfish arecausing environmental and economic damage throughout reef systems in the Atlantic and Carib-bean (Albins and Hixon 2008, 2013). A carnivorous species of fish native to the Indo-Pacific, lion-fish (Pterois volitans) have no natural predators along the Atlantic coast, Caribbean, and Gulf of
Skyler Simnitt is a research economist, USDA Economic Research Service, 6501 Beacon Drive, Kansas City, MO 64133 USA(email: [email protected]). Lisa House is a professor and chair, University of Florida, Institute of Food and AgriculturalSciences, Food and Resource Economics Department, PO Box 110240, Gainesville, FL 32611 USA (email: [email protected]).Sherry L. Larkin is a professor, University of Florida, Institute of Food and Agricultural Sciences, Food and Resource Eco-nomics Department, PO Box 110240, Gainesville, FL 32611 USA (email: [email protected]). Jennifer Sweeney Tookes is anassistant professor, Georgia Southern University, Department of Sociology and Anthropology, PO Box 8051, Statesboro, GA 30460USA (email: [email protected]). Tracy Yandle is an associate professor, Emory University, Department of EnvironmentalSciences, 400 Dowman Drive, Atlanta, GA 30322 USA (email: [email protected]).
This project was funded by NOAA Saltonstall-Kennedy Grant No. NA15SNMF4270347 and by the Florida Agricultural Ex-periment Station via Multistate Project W3004, “Marketing, Trade, and Management of Aquaculture and Fishery Resources.”Findings, opinions, and errors are the responsibility of the authors, not the granting agencies. The findings and conclusions inthis publication are those of the authors and should not be construed to represent any official USDA or US government determi-nation or policy.
Received January 23, 2019; Accepted June 11, 2020; Published online September 10, 2020. http://dx.doi.org/10.1086/710254
Marine Resource Economics, volume 35, number 4. © 2020 MRE Foundation, Inc. All rights reserved.0738-1360/2020/3504-0001$10.00
320 | MARINE RESOURCE ECONOMICS | VOLUME 35 NUMBER 4 2020
Mexico, and thus nothing to keep their numbers from rapidly expanding and consuming other fishspecies (Huth, McEvoy, and Morgan 2018). Invasive lionfish are changing native marine habitatsby depleting the populations of herbivorous fish that otherwise keep the coral reefs frombeing over-run by seagrass and algae. Furthermore, invasive lionfish prey on commercially valuable reef speciessuch as grouper, snapper, and lobster that are essential to Caribbean fishing economies (Rocha et al.2015). An estimated 42 million people in the Gulf of Mexico and Caribbean coastal areas are directlydependent on coral reef systems for their food and livelihoods; thus if the lionfish invasion con-tinues, it is likely to bring substantial economic losses to the region (Waite 2011). Fishing derbiesand organized culling events have succeeded at temporarily reducing lionfish populations in limitedareas, but they are expensive, ad hoc, and have no documented long-term impact to date (Malpica-Cruz, Chaves and Cote 2016; Frazer et al. 2012).
One proposed solution to the lionfish problem is for people to consume them on a mass scale(Morris et al. 2011). If economically feasible, commercial lionfish fisheries could dramaticallyreduce the lionfish population and restore balance to the region’s native ecosystems. For a com-mercial lionfish fishery to be economically viable, however, there needs to be a sufficient andsustainable demand for lionfish meat. In addition, consumers’ willingness to pay (WTP) needsto exceed the fishery’s production costs to make it worthwhile to harvest lionfish and for there tobe enough quantity harvested to make an ecological difference. Few peer-reviewed studies ex-amining WTP for lionfish exist to date. Huth, McEvoy, and Morgan (2018) examined howthe price that consumers are willing to pay for lionfish meat is a combination of WTP for botha private and a public good by conducting a series of experimental auctions at a seafood festivalin Pensacola, Florida. The baseline WTP dollar value estimated for a three-ounce fillet was$6.28, which could be increased by as much as $1.66 (26%) through informing participantsof the severity of the environmental threat (Huth, McEvoy, and Morgan 2018).
In a presentation at the annual Gulf and Caribbean Fisheries Institute Conference, BethanyYoung, public relations and marketing assistant of Rainforest Seafood (Jamaica’s largest seafoodsupplier), reported that lionfish cost her supply company about $3.00 a fish, a price deemed highby Jamaican standards. Other presenters cited prices paid to suppliers ranging from $6.00 a poundto $16.00 a fish depending on the source (Bogdanoff, Akins, andMorris 2013).While these findingsprovide a glimpse of middle and end consumers’WTP in certain locations, they fail to provide thefigures necessary to make a market feasibility assessment for the US Virgin Islands (USVI).
Since 2016, Whole Foods Market Inc. has offered lionfish at select southeastern US locations.The company’s official blog includes a section describing lionfish and provides background onthe lionfish problem, as well as links to instructional videos on how to make culinary dishes withlionfish (Myers 2016). Whole Foods markets its lionfish as a “green” item, displaying whole fishon ice that can be filleted by their seafood department’s fishmongers. Whole lionfish sell atWhole Foods locations throughout the state of Florida for around $7.00 per pound (lb), withusable fillets accounting for approximately one-third of total weight.
The use of economic research methods to address the lionfish issue is not limited to WTP es-timates for lionfishmeat.Moonsammy, Buddo, and Seepersad (2011) used the contingent valuationmethod (CVM) to estimate the aggregate economic cost of invasive lionfish on Jamaica’s reef sys-tems by first calculating a mean estimate of individuals’WTP to protect the reef and then extrap-olating to the population level. They conclude that lionfish have resulted in a loss of $11 million ineconomic value to residents because of reduced marine biodiversity (Moonsammy, Buddo, andSeepersad 2011).

Consumer Demand for Invasive Lionfish | 321
The USVI were selected for this study because various economic, ecological, and culturalcharacteristics of the territory appear favorable to the establishment of a commercial fisheryfor lionfish. Lionfish lead mostly solitary lives as ambush predators and cannot be consistentlyharvested through scalable methods such as angling and netting, but rather are primarily har-vested through spearfishing by trained divers (Myers 2016). Recreational and commercialspearfishing are already widespread in the territory, and seafood features prominently in localcuisine (Goedeke et al. 2016; Stoffle et al. 2009; Crosson and Lia 2017). Given the abundanceof divers already frequenting the reefs in pursuit of commercially valuable species in the USVI,there exists a culture and infrastructure in place to support large-scale harvesting, should suffi-cient demand materialize. Perhaps more importantly, fishermen would benefit from the avail-ability of a new target species as stocks of other valuable reef fish species have declined in recentyears (Albins and Hixon 2013). To help assess the demand side of the market, this study seeks todetermine the WTP of potential consumers in different markets in the USVI.
Essential to assessing a latent demand structure for lionfish in the USVI is identifying theconditions and characteristics that contribute to consumers being willing to purchase lionfish,and the extent to which they will participate in the market. Just as consumers may not partic-ipate in certain markets (e.g., nonsmokers in the tobacco market or vegetarians in meat mar-kets), there is good reason to suspect that a portion of those who live in and frequent the USVIwill never participate in a market for lionfish meat. The factors that determine whether consum-ers would be willing to participate in a market for lionfish may be related first and foremost towhether they eat fish and, if so, whether they will consider eating lionfish. As lionfish is not yet apopular food item, we can assume that potential consumers have little idea of its palatability.Additionally, lionfish possess negatively perceived characteristics, including being a transmitterof ciguatera (a toxin harmful to humans present in many reef species) and possessing venomousspines (Robertson et al. 2014; McDermott 2017).
In this study, we apply nonlinear estimation techniques to two groups of potential consumersof lionfish meat, USVI residents and tourists. First, a double hurdle Poisson (DHP) model isestimated for the resident group. This allows for the identification of individual consumer pref-erences and characteristics that increase both the likelihood of participation in a market for lion-fish meat and the potential frequency of purchase. Second, a logit regression is applied to thetourist group to model the individual tourists’ likelihood of participating in a market for lionfishmeat; only the first hurdle is estimated for the tourist group as a small sample size and lack ofvariability in the data on consumption frequency prevented the estimation of the second hurdle.Another part of our analysis of latent market structures focuses on prices. The Turnbull lowerbound of consumer mean WTP is calculated for both the tourist and the resident groups and forboth restaurant entrées and lionfish meat fillets purchased from the dockside market for homepreparation. Consumer WTP is then estimated as a linear function of individual characteristicsand preferences through the application of maximum likelihood estimation to double-boundedcontingent valuation data. Results from our analyses are used to assess the viability of a newcommercial fishery for lionfish in the USVI.
DATA AND METHODS
The data for this research were collected via a survey of 308 tourists and residents on the islandof St. Croix in the USVI. Surveys of the resident population were collected during May 22–28,2016, while surveys of tourists were collected throughout the summer of 2016. Participants were

322 | MARINE RESOURCE ECONOMICS | VOLUME 35 NUMBER 4 2020
approached outside of every major grocery retail outlet (n p 10) on the island of St. Croix. Toensure representation by tourists, surveyors also canvassed three additional locations: the air-port, the Christiansted Pier, and the Frederiksted tourist district. To randomize the selectionof participants, surveyors were instructed to stand equal distance apart and then approach everythird adult that passed next to them. The first question asked was whether they were a residentof St. Croix in order to determine which questionnaire to use. Most questions were designed toextrapolate consumer preferences and attitudes, and were asked in the form of Likert scales.
One purpose of the survey was to assess public perceptions and knowledge of lionfish to serveas a baseline for future outreach programs. Therefore, following several questions about fish andseafood in general, participants were presented with a picture of a lionfish and asked if theyknew nothing, a little, somewhat, or a lot about lionfish (a four-point Likert scale). No additionalinformation was shared with regards to lionfish biology or their ecological impact on the region.If survey participants had individual questions about lionfish these were not answered by theresearcher until after the survey. Then the respondent was asked about their potential interestin eating lionfish using the same Likert scale before being presented with the following hypothet-ical market scenario:
Several companies are interested in developing a local market for locally caught lionfish,which currently isn’t sold in very large quantities because they are a new species in local wa-ters. In July, they will be buying lionfish from fishermen directly and bringing it to local mar-kets and to local restaurants. If the programwere in place now, and the price was reasonableto you, would you have bought this local fish to cook at home, from a restaurant, or neither?
This question was followed by six others: (1) how many times they would buy (during a monthfor residents and during their trip for tourists), (2) whether they would buy more fish or buy thislionfish instead of other species, (3) whether they would still buy given a price, and then (4) afollow-up with a different price (higher or lower) depending on their answer, (5) a Likert ques-tion on how sure they were that they would actually do what they just said (not at all, somewhat,or very sure), and regardless of their responses, (6) whether they thought the companies couldsell enough to be successful. Collectively, these questions allow an assessment of the share ofthe sample interested in the program, potential participation in the program, estimated fre-quency of purchase by venue (grocery stores and restaurants), responses to two bid levels, and asurety response to derive a more credible estimate of WTP.
Because of the difference in proposed consumption time frames, separate regression modelswere estimated for the tourist and resident groups during the market participation and con-sumption portions of the analysis. For each group, consumption frequencies were grouped intofive categories based on the distribution of responses: 0, 1, 2, 3, or at least 4 (figure 1). Thesevalues correspond to the number of times individual residents indicated that they would con-sume lionfish during a typical calendar month, or the number of times that tourists would con-sume lionfish during their trip. Because of the sparseness of the data, tourist consumption fre-quency was ultimately recoded to a dichotomous variable to simply indicate whether they wouldconsume lionfish at least once during their trip.
Greene (2018, 885) states that “the Poisson regression model is the fundamental starting pointfor the analysis of count data.” Our review of the empirical literature on count data models sug-gests that the Poisson and its variant regressions (zero-inflated Poisson, etc.) are the most

Figure 1. Monthly Calculated Frequency of Purchase by Venue and Respondent Type. Panel A shows results
for residents; panel B, for tourists.

324 | MARINE RESOURCE ECONOMICS | VOLUME 35 NUMBER 4 2020
commonly estimated count models (e.g., Greene 1994; Lambert 1992; Cameron and Trivedi 2013).Less prevalent, although also represented in this literature, are the negative binomial, ordereddiscrete, and geometric regression models (e.g., Gardner, Mulvey, and Shaw 1995; Kockelmanand Kweon 2002). Because the geometric and Poisson are nested within the negative binomial,comparison of these three models is straightforward (Mullahy 1986). In this research, we em-ploy a test for overdispersion as suggested by Cameron and Trivedi (1990) to determine betweenthe Poisson and the less restrictive negative binomial model.
Economists have long theorized that as rational individuals consume goods, each inadver-tently makes a series of decisions: (1) whether to consume at all, (2) how much to consume,and (3) how often. Whether this sequence of decisions is made simultaneously or in successionis still a matter of debate. Nonetheless, there is broad consensus that econometricians estimatingconsumption models from consumer survey data must control for these different decision stagesor otherwise suffer the fate of biased parameter estimates.
Numerous econometric methods have been proposed to control for the interplay of the de-cisions of whether to participate in a market and the quantity to consume. Cragg (1971, 829)introduced an extension of the “multiple probit analysis model” wherein the magnitude ofthe positively valued dependent variable is also dependent on different variables or parametersfrom when the dependent variable is zero. Mullahy (1986) was among the first to apply Cragg’sdouble hurdle approach to models with count data, introducing hurdle specifications for thePoisson and geometric models. We present the probability mass functions (PMFs) for the binaryand count portions of the hurdle model used in our application. Best recommended practicessuggest that one can model the participation decision in the DHP with a probit, logit, or com-plementary log-log link (clog-log) function (Greene 2012). While we also tested probit andcomplementary log-log link functions for the binary portion of the hurdle analysis, we ultimatelysettled on the logit. Estimated results were similar across these different link functions, and thelogit was deemed to be most consistent with the literature on market participation and to pro-vide for a more straightforward comparison with our binary analysis of the tourist group.
These PMFs of the binary and count portions of the hurdlemodel are depicted in equation sets 1and 2, respectively, where equation 1 represents the PMF for a logit model, and equation 2 depictsthe PMF of the zero truncated Poisson:
Pr Y p yð Þ pe–l1
1 1 e–l1, y p 0
1
1 1 e–l1, y p 1, 2, 3, :::
;
8>>><>>>:
(1)
Pr Y p yjy 1 0ð Þ ply2
el2 – 1� �
y !, y p 1, 2, 3 :::
0, otherwise
:
8>><>>: (2)
In these equations y is the discrete dependent variable, l1 is the parameter of a logit distributiongoverning the probability of observing a positive, and l2 is the parameter of a Poisson truncatedat zero. Equation set 3 depicts the unconditional PMF for y, wherein both the binary and the countportions of the model are combined:
Consumer Demand for Invasive Lionfish | 325
Pr Y p yð Þ p
e–l1
1 1 e–l1, y p 0
1
1 1 e–l1
� �ly2
el2 – 1� �
y !, y 1 0
:
8>>>>><>>>>>:
(3)
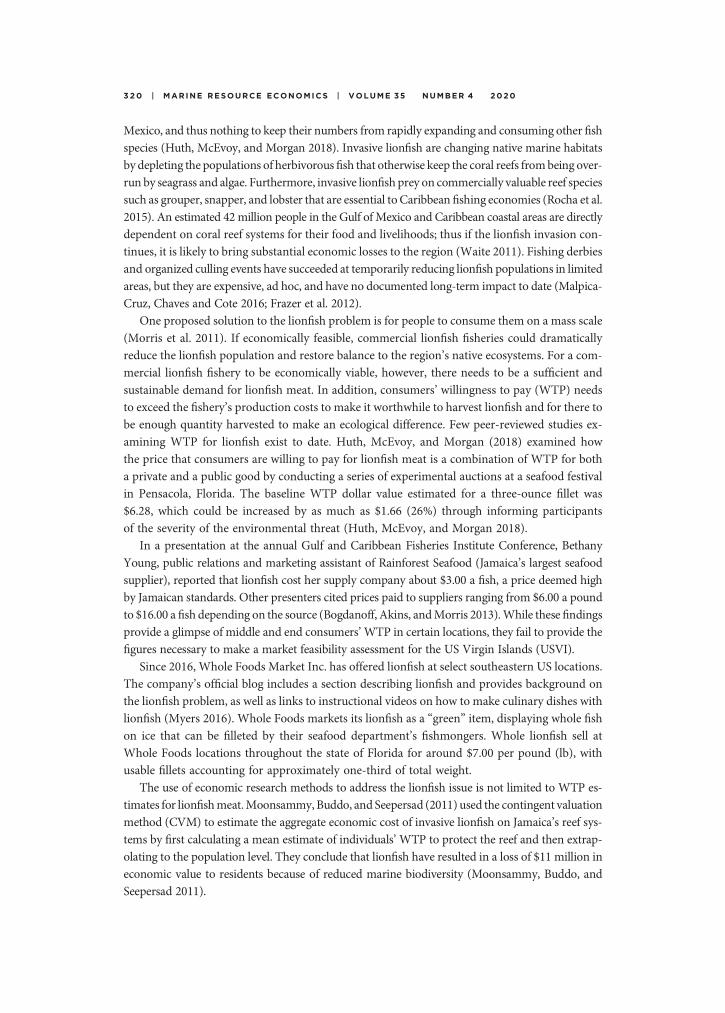
If we use the log link to model l1 and l2, this renders these parameters eXib1 and eXib2 , respectively.The log likelihood equation for the hurdle model can thus be expressed as the following:
ln L p lnYi∈Q0
e–eXib1
1 1 e–eXib1
!Yi∈Q1
1
1 1 e–eXib1
� �Yi∈Q1
eyiXib2
eeXib2
– 1� �
yi !
8<:
9=;, (4)
or
ln L p oi∈Q0
– eXib1 – oi∈Q0
ln 1 1 e–eXib1
� �– o
i∈Q1
ln 1 1 e–eXib1
� �( )
1 oi∈Q1
yiXib2 – oi∈Q1
ln e–eXib2
– 1� �
– oi∈Q1
ln yi !ð Þ( )
:
(5)
The first set of brackets corresponds to the binary portion of themodel (hurdle 1), while the secondset corresponds to the count portion (hurdle 2). As depicted, we assume that the decision to par-ticipate in the market (binary) is separate from the consumption quantity decision (count), thusthese two portions are independent. The same set of explanatory variables is included at both hur-dles, as indicated by repetition of the vector Xi (McDowell 2003; Zeileis, Kleiber, and Jackman2008). Although we do not expect the same effect of these variables across both stages of the model(e.g., seafood safety and income), their repetition permits comparison across the decision processand provides guidance in the development and targeting of education and outreach materials.
The DHP is preferred to the standard Poisson regression model if consumers do indeed gothrough a two-stage decision process. A good indication that market participants are distinctfrom nonparticipants in the sample is the presence of excess zeros. An examination of the re-ported consumption frequency of residents (figure 1) corroborates the notion that these datacontain an abundance of zeros.
One can compute the Vuong statistic to test for goodness of fit between two non-nestedmodels (e.g., the DHP with logit link, and the standard Poisson). Vuong z-statistics were com-puted to provide a comparison between the DHP and the standard Poisson regressions in boththe restaurant and home consumption models for the resident group. Statistically significantz-values of 2.46 and 1.93, respectively, provide evidence that the DHP fits the data better than thestandard Poisson in both the restaurant and home consumption models.
As described earlier, data were collected on consumer WTP using the standard double-bounded contingent valuationmethod, an estimation technique commonly used in environmen-tal economics where there is a lack of established markets to observe actual consumption at givenprice levels (Hanneman 1994). The technique has the surveyor propose a value (or “bid”) for thehypothetical good and record a yes or no response. In the double-bounded method, consideredstatistically superior to single-bounded, the surveyor follows up with a second bid value that is
(5)
326 | MARINE RESOURCE ECONOMICS | VOLUME 35 NUMBER 4 2020
either higher or lower than the initial bid depending on the participant’s first response. In thisanalysis, participants who indicated that they were “not at all” interested in eating lionfish wereexcluded as this group was also highly correlated with those who answered similarly on all ques-tions related to eating fish or seafood (i.e., non-seafood eaters); this comprised 32.5% of the sam-ple. As part of standard CVMmethodology, the remaining participants were under no obligationto accept either bid value and in fact a nonnegligible number rejected both bid values (i.e., 20% inthe home model and 12% in the restaurant model).
Bid values were framed as a per pound price in the case of lionfish for home consumptionand as a per entrée price in the case of restaurant consumption. Secondary bids differed fromthe initial bids (either higher or lower) by a factor of $2. All bid values were in 2016 US dollars.The starting bid values for restaurant consumption ranged from $16 to $25. These valuesspanned the price range of similar fish entrées offered at restaurants on the island at that time.The starting bid values for raw fillets ranged from $6 to $15. Given the estimated number ofinterviews that could be completed during the survey period, it was determined that only fourstarting bid values could be used. We were unable to test for any anchoring effect. Given that thisstudy is examining the willingness to participate in a market for a market good, and that initialprices were varied, we believe that the analysis conducted serves our purpose, which is primarilyto analyze latent consumer demand.
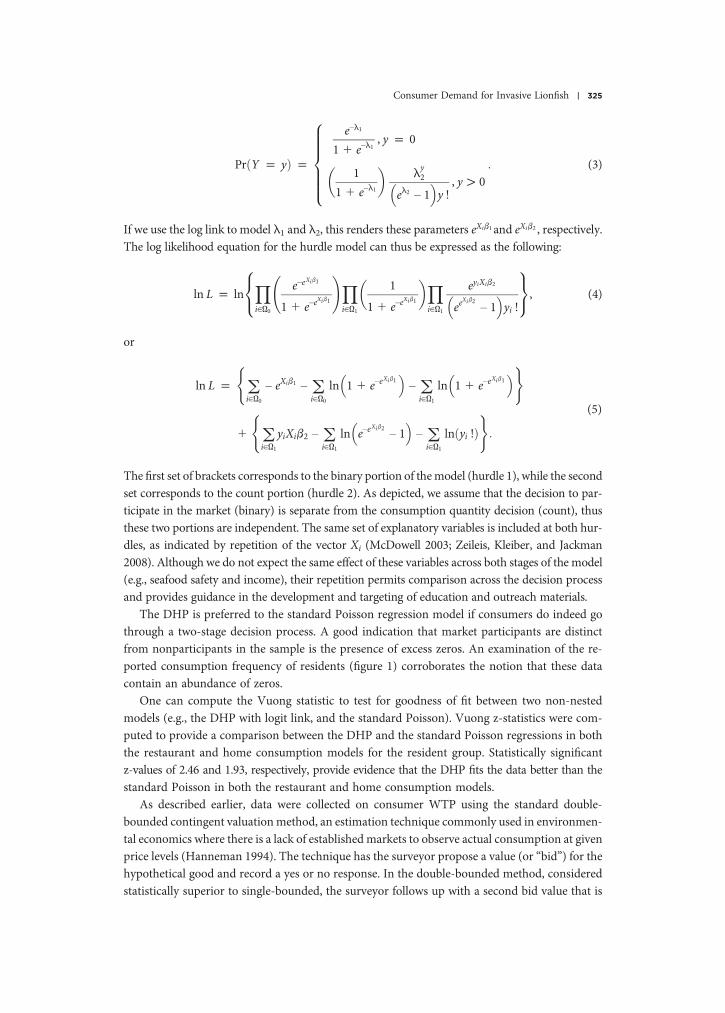
Average WTP can be calculated from CVM data using both parametric and nonparametricmethods. In this study, we calculate consumers’ mean WTP with the nonparametric Turnbulllower-bound method to obtain a conservative estimate of the price that suppliers can expect toreceive. The Turnbull (1976) method requires combining participants’ responses to the ques-tions on WTP at given prices.1
In addition to calculating mean WTP via the Turnbull method, we use the CVM data with aparametric approach to determine what factors are correlated with the stated WTP via maxi-mum likelihood as detailed by Hanneman, Loomis, and Kanninen (1991). This approach re-quires the assumption that an individual’s WTP is a linear function of the individual’s attributes,such that WTP takes the following functional form:
WTPi p Xib 1 εi, (6)
where Xi is a matrix of individual characteristics and εt is a stochastic error term. The b coeffi-cients derived through maximum likelihood estimation can be interpreted as explaining howeach control variable affects individual WTP. The associated log-likelihood function of thedouble-bounded CVM is as follows:
ln L p Σ Inni ln 1 – F X0i � br –
AL
r
� �� �1 Inyi ln F Xi0 � b
r–AL
r
� �– F X0
i � br –Ar
� �� ��
1 Iyni ln F X0i � br –
Ar
� �– F X 0
i � br –AH
r
� �� �1 Iyyi ln F X0
i � br –AH
r
� �� � �:
(7)
As this study posed two bids to each individual, yes (y) or no (n) responses fall into one of fourpossible categories: (1) no, no; (2) no, yes; (3) yes, no; and (4) yes, yes. These are represented by
1. For a comprehensive description of how to perform Turnbull’s estimation process, we recommend that the reader consultTurnbull’s original paper (1976) or see Haab and McConnell’s somewhat condensed version (1997).

Consumer Demand for Invasive Lionfish | 327
the symbols Inni , Inyi , Iyni , and Iyyi , respectively, as seen in equation 7. The symbol F denotes thecumulative distribution function of the standard normal. AL and AH represent the lower andhigher of the two bids offered, respectively, while A (without subscript) represents the initialbid value. X 0
i denotes a vector of explanatory variables, with b a corresponding vector of param-eters. Vector X0
i includes many of the same consumer preference and characteristics variablesincluded in the demand portion of the analysis. Willingness to pay for home consumptionwas calculated for the resident group alone. Tourists were excluded from this model becauseof relatively small sample size (n p 17 individuals) and lack of variation in bid values. Willing-ness to pay for restaurant consumption was estimated for the pooled sample of residents andtourists.
RESULTS
This section begins by summarizing statistics for the research sample, including demographicand preference variables used in the analyses. This discussion of summary statistics is followedby a subsection presenting results from the double hurdle Poisson and logit regression modelsused to estimate latent demand for lionfish meat. The section concludes with a discussion of thewillingness-to-pay estimates derived through Turnbull and maximum likelihood methods.
SUMMARY STATISTICS
Demographic characteristics such as gender, age, educational attainment, and income for theresident and tourist groups are displayed in table 1 alongside statistics for St. Croix from the2010 US Census. The sampled residents have a higher proportion of males with a higher edu-cation but lower household income than the population. The age profile is similar between theresident survey and census data. Overall, these differences do not appear to be at a level to com-promise findings. Not surprisingly, the tourists in the survey reported more education and ahigher household income than the local residents. The majority of survey participants (67%) re-side in the USVI; for comparison, during the month of the survey, the share of the adult pop-ulation that were residents was 75% (i.e., there were 12,851 adult tourists in June 2016, according
Table 1. Descriptive Statistics of USVI Census Data and Comparable Sample
Variable
Residents Tourists
Sample (%) Census (%) Sample (%)
GenderMale 51 46 52
EducationHigh school graduate 85 75 99College graduate 36 36 76
Income1 median 52 50 89
Age18–24 years 8 8 625–54 years 43 48 6855–64 years 23 18 171 65 years 26 25 9
Note: NA p not applicable. Median annual household income for USVIand US was $34,600 and $43,500, respectively.

328 | MARINE RESOURCE ECONOMICS | VOLUME 35 NUMBER 4 2020
to the Bureau of Economic Research, United States Virgin Islands, 2017, compared with 50,601 res-idents from the 2010 Census, of which 24% are minors on average). Ninety-two percent ofthe tourists in the sample were visiting from the US mainland, with the remainder coming fromPuerto Rico, another island in the USVI, or a foreign country.
Prior research demonstrates that consumers’ perceptions regarding the safety of fish and sea-food affects their consumption levels (Roheim, Kline, and Anderson 1996; Grunert 2005; Fonnerand Sylvia 2015; Aruga and Makamatsu 2018), thus the survey included several questions (19 intotal) designed to measure participants’ general levels of interest, knowledge, and concern abouttopics related to this study and questions related to the safety of eating lionfish in particular. Nearlyall of these questionswere framed in terms of a four-point Likert scale indicating their level of agree-ment with statements; responses were coded from 0 indicating “not at all,” 1 indicating they agreed“a little,” 2 indicating they “somewhat” agreed, to 3 indicating they agreed “a lot.” These questionsand results related to safety concerns are summarized in figure 2.Mann-WhitneyU tests were con-ducted on the data for each statement to detect statistically significant differences between themeanresponses of tourists and residents; results are indicated in the figures.
By design, one of these statements used to assess participants’ level of safety concern wasfalse: “Lionfish meat is poisonous.” Although this statement is inaccurate, as lionfish meat is ed-ible, we found that consumer responses are directly correlated with responses to the other safetyquestions and thus the statement appears to be a consistent indicator of individuals’ overall levelof concern about seafood safety.
Mean tourist and resident responses were statistically different for all of the questions regard-ing seafood safety. This difference is especially pronounced for the statements regarding ciguateraand fish poisoning, which is not surprising given that these issues in seafood are unique to coralreef systems (especially in the Caribbean Sea, Hawaii, and coastal Central America) such that theUS tourists, on average, are likely to be unfamiliar with these concerns. Tourists’mean Likert re-sponse to the statement that “people can get sick with fish poisoning from eating seafood likeamberjack or barracuda from the USVI” (0.80) is 1 point lower than that of residents. Similarly,the mean Likert value for tourists’ response to the statement that “people can get sick with cigua-tera from eating seafood like amberjack or barracuda from the USVI” (0.58) is 1.14 points lowerthan the average Likert value of residents (1.72). Additionally, tourists’ mean response to thestatement that “people can get sick with fish poisoning from eating lionfish” (0.41) is 0.65 pointslower than the residents’ mean response.
Figure 2 also displays participants’ mean Likert scales in response to statements indicatingtheir level of accurate knowledge about lionfish. The mean Likert responses were statistically dif-ferent for the resident and tourist groups in the case of the following: “Lionfish harm the marineenvironment” and “It is safe for people to eat lionfish.” In both instances the mean score of res-idents was higher than that of tourists, which is unsurprising given that residents live in commu-nities directly affected by lionfish.
A series of questions were included in the survey to capture individuals’ interest in seafood;per a factorial analysis, two of these variables are grouped under the category “interest in sea-food.” Participants’ mean responses disaggregated by tourists and residents are also displayedin figure 2. Statistically different mean responses occur between tourists and residents for bothof the following statements: “I am interested in eating lionfish” and “I am interested in tryingnew kinds of seafood.” Tourists’ mean response to the statement that “I am interested in tryingnew kinds of seafood” (2.29) indicates relatively strong agreement with the statement, while

Consumer Demand for Invasive Lionfish | 329
USVI residents’mean response (1.65) falls between the categories “agree a little” and “somewhatagree.”
Figure 2 further displays participants’ mean Likert scales in response to statements gaugingtheir levels of concern about the two topically unrelated issues of overfishing and mercury levelsin seafood. The mean resident and mean tourist responses are not statistically different for thesetwo statements, suggesting that all participants are on average “a little” to “somewhat” con-cerned about overfishing and mercury.
We expect participants’ Likert responses to many of the aforementioned statements to becorrelated with the probability of individual participation in a market for lionfish meat and sub-sequent consumption frequencies. Thus, while the inclusion of all variables makes intuitive
Figure 2. Mean Responses to Agreement with Statements by Category and Respondent Type. Agreement
ranges from 0 (not at all) to 3 (a lot). ***, **, and * indicate statistical significance of difference between respon-
dent types at the 1%, 5%, and 10% levels, respectively.

330 | MARINE RESOURCE ECONOMICS | VOLUME 35 NUMBER 4 2020
sense, data constraints must be considered. First, best recommended practices suggest having10–20 observations per parameter to be estimated in a regression model (Harrell 2001). Ourcomplete datasets contain 205 observations for the resident group and 103 observations forthe tourist group. Thus the inclusion of all 19 Likert response variables among the model regres-sors would use up too many degrees of freedom. Second, the Likert response variables (especiallyby category) will likely lead to multicollinearity in the regression model. As such, tests were per-formed to determine whether statistically significant correlation exists among the variables fall-ing within the following topical categories: knowledge about lionfish, concerns about the envi-ronment, safety concerns about eating fish and seafood, and interest in eating new fish andseafood.
Cronbach’s alpha scores calculated for variable groupings indicated a significant amount ofcorrelation only among the variables in the category “safety concerns” (score of 0.74). A factorialanalysis was conducted for all the remaining variables, and three additional statistically signif-icant groupings were identified; the hypothesis test that three variables are sufficient, where var-iables with loadings greater than 0.50 were combined, had a chi-square value of 53.27 (42 df,p-value 0.114). Variables were summed within each of the identified categories, creating four com-posite variables: “seafood safety concerns” (SAFETY), “knowledge about lionfish” (KNOWLEDGE),“interest in seafood” (INTEREST), and “level of worry” (WORRY).
There is a robust literature examining how individual characteristics and preferences, as wellas policies and education campaigns, affect environmental concern at both the micro and macrolevels (Buttel 1979; Dietz, Stern, and Guangnano 1998; Brulle, Carmichael, and Jenkins 2012),including those specific to seafood products (Nauman et al. 1995; Onozaka, Hansen, and Sorvig2014; Aruga and Makamatsu 2018). Relevant findings from this literature suggest that individ-uals’ concerns about environmental issues are largely contingent on personal and societal factorsthat can develop and change over time. Thus, for example, if the variable WORRY is correlatedwith individual willingness to consume lionfish, this suggests that efforts aimed at influencingsocietal attitudes towards overfishing and mercury in seafood could affect consumer demand.
Mean consumption frequencies and market participation rates for the resident and touristgroups are reported in table 2. Table 2 also includes summary statistics for several of the inde-pendent variables used in the analyses. The mean number of times that resident participants in-dicated they would purchase lionfish from a restaurant over a 30-day period was 0.41, whereasthe mean number of times they indicated they would purchase from a market for home prep-aration was 0.61. Although these values appear relatively small (less than 1), recall that they rep-resent per capita consumption calculated over all respondents, and not aggregate consumption.A majority of tourists indicated they would purchase lionfish at least once from a restaurant(74%) while on vacation in the USVI. A smaller percentage of tourists (16%) indicated theywould purchase for consumption at their place of lodging while on vacation.
RESIDENTS ’ DOUBLE HURDLE MODEL
To begin the econometric estimation of the models for residents, the Cameron Trivedi tests foroverdispersion were calculated and returned relatively small values of 1.35 and 1.11 for the res-taurant consumption and home consumption models, respectively. These statistics have limitingchi-square distributions with one degree of freedom; therefore, we failed to reject the null ofequidispersion and proceed with estimation of the double hurdle Poisson as opposed to a doublehurdle negative binomial or some other double hurdle variant of the geometric (Greene 2012).

Consumer Demand for Invasive Lionfish | 331
Marginal effects were calculated for each independent variable in the analysis. The effect wasaveraged over all individuals in the sample group. These effects are reported alongside the co-efficients in table 3.
Several variables were found to be significant predictors of resident participation in themarketfor home consumption (table 3, top right): safety concerns, knowledge about lionfish, interest inseafood, race (white), age, and being a college graduate. Two variables were found to be signifi-cant in the count portion of the model estimating frequency of home consumption (table 3, bot-tom right): interest in seafood and race (white).
The estimated marginal effect of seafood safety concerns on resident participation in a mar-ket for home consumption suggests that an increase of one standard deviation corresponds to adecrease in the probability of an individual purchasing raw lionfish by 12%. This finding is con-sistent with much of the literature on perceived risk and consumption of meat, poultry, and sea-food (Senhui, Flether, and Arbindra 2003; Shim and You 2015). Yeung and Morris (2001) foundthat as individuals’ level of perceived danger related to consuming a meat item increases, theyoften cope by reducing or eliminating consumption altogether.
The probability that a resident participates in a market for lionfish meat for home consump-tion increases with her knowledge about lionfish. A one standard deviation increase in a resi-dent’s level of knowledge corresponds to an increase in the probability of consuming lionfish
Table 2. Descriptive Statistics of Model Variables by Respondent Type
Residents (np205) Tourists (np103)
Variable Description Mean Std. Dev. Mean Std. Dev.
REST_PARTIC Respondent would order a lionfish entrée at arestaurant at least once during the month(0 p no, 1 p yes) 0.26 0.44 0.74 0.44
HOME_PARTIC Respondent would buy raw lionfish to cookat home at least once during the month(0 p no, 1 p yes) 0.34 0.48 0.16 0.36
REST_FREQ Frequency of restaurant entrées purchasedper month (range 0–4) 0.41 0.84 1.03 0.88
HOME_FREQ Frequency of raw liofsh purchases for homeper month (range 0–4) 0.61 1.07 0.23 0.63
SAFETY Concerns about eating seafood and lionfish(range 0–18) 8.10 4.27 3.88 3.71
KNOWLEDGE Agreement with accurate statements aboutlionfish (range 0–9) 4.16 2.99 3.29 3.27
INTEREST Level of interest in seafood (range 0–6) 2.44 1.93 3.69 1.66WORRY Concerns about mercury and overfishing
(range 0–6) 3.45 1.99 3.47 1.85WHITE Respondent identified their race as being
white (0 p no, 1 p yes) 0.21 0.41 0.67 0.47AGE Age of respondent in years (range 18–84) 51.60 16.63 44.59 14.32CHILDREN Number of children under 18 living in the
home (range 0–16) 0.77 1.63 0.48 0.86MALE Respondent was male (0 p no, 1 p yes) 0.51 0.50 0.52 0.50HIGH_EDU Respondent was a college graduate
(0 p no, 1 p yes) 0.36 0.48 0.76 0.43HIGH INC Household income was higher than median
(0 p no, 1 p yes) 0.52 0.50 0.89 0.31
Note: The 0 level of concern, knowledge, or interest is lowest. NA p not applicable.

332 | MARINE RESOURCE ECONOMICS | VOLUME 35 NUMBER 4 2020
in the home by 12%. This finding may imply that stakeholders can increase market participationthrough sharing accurate information to USVI residents about lionfish.
The marginal effect for interest in seafood suggests a positive relationship between interest ineating seafood and the probability of purchasing lionfish for consumption in the home. A onestandard deviation increase in a resident’s stated level of interest corresponds to an 18% increasein their probability of market participation.
According to these results, white residents have a 23% lower probability of participating in amarket for lionfish for in-home consumption than their nonwhite counterparts. This relation-ship between race and lionfish consumption is consistent with studies reporting that non-Hispanic white Americans tend to consume certain seafood items at lower quantities than theirblack and Hispanic counterparts (Cheng and Capps 1988; Jahns et al. 2014).
The marginal effect of age suggests that for every additional 10 years of age, the probability ofan individual consuming lionfish in the home increases by 10% (table 3, top right). This findingcan be interpreted to mean that younger individuals are less likely to participate in a market forlionfish destined for consumption in the home. This inverse relationship with age is consistentwith the notion that younger individuals may lack the culinary knowledge to prepare fish in thehome and may be less likely to cook in general.
Table 3. Estimation Results of the Double Hurdle Models for Residents by Venue
Restaurant Home
Variable Coeff.Std.Error M.E.
Std.Error Coeff.
Std.Error M.E.
Std.Error
Hurdle 1: Participationconstant 0.34 0.990 NA NA –2.14*** 0.605 NA NA
SAFETY –0.07 0.326 –0.02 0.071 –0.45** 0.205 –0.12** 0.058KNOWLEDGE 0.46 0.286 0.10* 0.060 0.43** 0.187 0.12** 0.052INTEREST 0.95*** 0.275 0.21*** 0.079 0.68*** 0.196 0.18*** 0.061WORRY –0.08 0.296 –0.02 0.063 0.02 0.164 0.01 0.044WHITE 0.53 0.582 0.11 0.128 –0.84** 0.377 –0.23** 0.107AGE (10 YRS) –0.30 0.181 –0.06* 0.004 0.36*** 0.104 0.10*** 0.003CHILDREN –0.39 0.247 –0.08 0.051 0.05 0.131 0.01 0.035MALE –0.95** 0.477 –0.21* 0.116 –0.01 0.313 0.00 0.084HIGH_EDU 0.21 0.475 0.05 0.106 –0.66* 0.356 –0.18* 0.105HIGH_INC 0.95* 0.523 0.21* 0.107 –0.30 0.394 –0.08 0.110
Hurdle 2: Consumptionfrequency constant –0.30 1.062 NA NA –0.72 0.691 NA NA
SAFETY 0.69* 0.396 0.14 0.090 –0.05 0.273 –0.01 0.065KNOWLEDGE 0.00 0.296 0.00 0.058 0.17 0.190 0.04 0.039INTEREST 0.59* 0.343 0.12 0.083 0.75*** 0.238 0.19*** 0.053WORRY –0.25 0.265 –0.05 0.050 0.03 0.171 0.01 0.042WHITE –0.98 0.603 –0.19 0.158 –0.71** 0.353 –0.17** 0.084AGE (10 YRS) 0.14 0.250 0.00 0.005 0.14 0.122 0.00 0.003CHILDREN –0.32 0.646 –0.06 0.111 0.01 0.104 0.00 0.026MALE –0.31 0.697 –0.06 0.139 –0.40 0.346 –0.10 0.088HIGH_EDU 0.06 0.535 0.01 0.105 0.51 0.327 0.13 0.096HIGH_INC –0.74 0.920 –0.14 0.218 –0.44 0.410 –0.11 0.105
Note: M.E. p marginal effect. NA p not applicable. ***, **, and * indicate statistical significance at the 1%,5%, and 10% levels, respectively.

Consumer Demand for Invasive Lionfish | 333
The marginal effect for higher education suggests that college graduates have an 18% lowerprobability of participating in a market for lionfish for in-home consumption. This finding sug-gests that lionfish for in-home consumption is more appealing to non–college graduates, andmay reveal different underlying preferences between less and more educated segments of thepopulation for preparing and cooking wild-caught reef fish in general.
The marginal effects of variables predicting consumption frequency can be interpreted as theunit increase in the average number of times consumed. As expected, interest in seafood is a pos-itive predictor of consumption frequency in the home, with the estimated marginal effect sug-gesting that a standard deviation increase in interest corresponds to an increase in the averagenumber of times that a resident consumes in the home by 0.19. Being white is also negatively cor-related with the frequency of individual home consumption. The estimated marginal effect sug-gests that on average white individuals in the consuming group will purchase lionfish 0.17 fewertimes than their nonwhite counterparts ceteris paribus.
Results from the DHP regression model for the restaurant resident group (table 3, top left)suggest that four variables are statistically significant predictors of market participation: interestin seafood, knowledge about lionfish, and high income are positively correlated with being a res-taurant consumer, while being a male and age are negative predictors of market participation.Two explanatory variables were also shown to be statistically correlated with consumption fre-quency in the normal count-generating portion of the DHP model for restaurant consumption(table 3, bottom left): interest in seafood and safety concerns. Although the coefficients werefound to be significant for these two variables, the corresponding marginal effects are not, lim-iting the interpretability of these results.
As in the previous model, knowledge is also a significant predictor of market participation inthe restaurant model. The estimated marginal effect of knowledge suggests that a standard de-viation increase in an individual’s level of knowledge corresponds to a 10% increase in theirprobability of participating the restaurant market.
Interest in seafood is also statistically significant and positively correlated with a resident pur-chasing a lionfish entrée at a restaurant. The marginal effect of interest in seafood suggests thatan increase in the interest variable by one standard deviation corresponds to an increase in theprobability of participating in the market by 21%.
Age is a negative predictor of market participation, with the marginal effect suggesting thateach additional 10 years of age corresponds to a 6% decrease in the probability of an individualpurchasing lionfish at a restaurant. This finding can be interpreted to mean that younger individ-uals are more likely to participate in a restaurant market for lionfish (by all accounts, an exoticmenu item) and is consistent with the psychology literature suggesting a negative correlation be-tween age and openness to new experiences (Costa et al. 1986).
Male residents have 21% lower probability of participating in a market for lionfish meat atrestaurants than their female counterparts. It is unclear from the analysis whether this differencereveals more about gender preferences regarding eating out at restaurants, consuming seafoodin general, or gender differences in attitudes towards exotic menu items.
If we consider a lionfish restaurant entrée as a normal good in economic terms, it is unsurpris-ing that we observe a positive relationship between income and participation in the market. Thisconforms to prevailing notions of income and willingness to eat out at restaurants as well as pur-chasing seafood items that are relatively expensive compared with other protein sources (Saad2017). Interpretation of the marginal effect for income suggests that residents from households

334 | MARINE RESOURCE ECONOMICS | VOLUME 35 NUMBER 4 2020
who earn above $34,600 have a 21% higher probability of participating in a restaurant market forlionfish than their lower-earning counterparts.
Although two of the explanatory variables in the count portion of the restaurant model werefound to be statistically significant, seafood safety concerns and interest in seafood, neither oftheir marginal effects is significant. As expected, interest in seafood is positively correlated withrestaurant consumption frequency; seafood safety concerns, however, defy expectation, beingpositively correlated with consumption frequency. This finding is counterintuitive assumingthat individuals who are especially concerned about the safety of seafood are likely to consumeat lower rates; however, it may reveal nuances in how potential consumers perceive risk relatedto how their seafood is sourced. Potential resident consumers of lionfish may feel that lionfish issafer to eat in restaurants compared with home or other venues, given the perception that res-taurants face more stringent safety regulations than open-air markets and other venues. Marketparticipants that are particularly concerned about seafood safety may therefore actually con-sume at higher rates in restaurant settings.
These results from the double hurdle Poisson models for the resident group, for both homeand restaurant consumption, conform to the underlying assumption that individuals undergo atwo-stage decision process when confronted with the opportunity to consume lionfish. First,they decide whether to participate in the market at all; second, if they are a consumer, they de-cide how much to consume. More specifically, these models indicate that knowledge about lion-fish, interest in seafood, and age are positively correlated with market participation. Seafoodsafety concerns are negatively correlated with being a consumer, in the case of home consump-tion. With regards to the count portion of the model, interest in seafood is also statistically sig-nificant and positively correlated with consumption frequency, while being white is negativelycorrelated with both market participation and consumption frequency of lionfish in the home
TOURIST PARTICIPATION MODEL
Results for the logit regression of tourist participation in the lionfish market suggest that safetyconcerns are a negative predictor of participation in the restaurant model for this new potentialgroup of consumers (table 4, left); the marginal effect suggests that an increase of one standard
Table 4. Estimation Results of Participation Models for Tourists by Venue
Restaurant Home
Variable Coeff. Std. Error M.E. Std. Error Coeff. Std. Error M.E. Std. Error
Participation constant 1.70 1.385 NA NA –2.37 1.466 NA NASAFETY –1.18*** 0.411 –0.13*** 0.045 –0.10 0.408 –0.01 0.046KNOWLEDGE 0.60 0.368 –0.07 0.041 –0.09 0.338 –0.01 0.038INTEREST 1.97*** 0.485 0.22*** 0.053 0.38 0.406 0.04 0.046WORRY –0.39 0.345 –0.04 0.038 0.19 0.359 0.02 0.040WHITE –0.89 0.733 0.10 0.087 –0.40 0.755 –0.05 0.090AGE (10 YRS) –0.03 0.026 0.00 0.003 0.46* 0.241 0.05* 0.003CHILDREN 0.84** 0.397 0.09** 0.044 –1.42 0.951 –0.16 1.067MALE –0.96 0.699 –0.10 0.070 –0.50 0.659 –0.06 0.075HIGH EDU –0.34 0.748 –0.04 0.080 –0.65 0.701 –0.08 0.091HIGH_INC –0.35 1.248 –0.04 0.130 –0.58 1.116 –0.07 0.152
Note: M.E. p marginal effect. NA p not applicable. ***, **, and * indicate statistical significance at the 1%,5%, and 10% levels, respectively.

Consumer Demand for Invasive Lionfish | 335
deviation in the variable seafood safety concerns corresponds to a decrease in the probabilityof a tourist consuming lionfish at a restaurant by 13%. In contrast, tourists that have an interestin eating new seafood are more likely to buy a restaurant entrée; a single standard deviation in-crease in interest corresponds to a 22% increase in probability of market participation (table 4,left).
The number of children in the home is also a positive predictor of tourist participation in arestaurant market for lionfish meat. For each additional child residing in the home, the proba-bility of an individual participating in the market increases by 9% ceteris paribus (table 4, left).The reason for this positive relationship between family size and restaurant consumption iscounterintuitive given that household budgets generally experience greater constraints with ad-ditional children in the home (Cheng and Capps 1988).
The variable age is the only statistically significant predictor of an individual tourist’s partic-ipation in a market for lionfish for home consumption. This finding is consistent with the as-sumption that preparation of finfish requires prerequisite knowledge that older individualsare more likely to have and is directionally consistent with the resident sample as discussed pre-viously. The accompanying marginal effect suggests that for each additional 10 years of age theprobability of a tourist buying lionfish to cook increases by 5% (table 4, right).
WILLINGNESS TO PAY
Results for the mean WTP calculation from using the Turnbull lower-bound method are shownin table 5. Residents’ estimated mean willingness to pay for lionfish for home consumption is$11.80/lb compared with $10.09/lb for tourists. Tourists’ estimated meanWTP for a lionfish en-trée at a restaurant is $22.83 compared with $17.70 for residents. This is to be expected giventhat tourists are overrepresented among the high-earning group and, as basic microeconomictheory dictates, WTP is positively correlated with income (Mankiw 2016). Both estimates ofmean WTP are within the price range of comparable finfish restaurant items in the territory, suchas mahi-mahi, groupers, and snappers, which lends support to the idea of market feasibility.
Residents’ mean WTP for lionfish destined for home preparation ($11.80/lb) exceeds that oftourists’ WTP by $1.70/lb, or 16.8% (table 5). Compared with residents, we expect that touristsare generally less interested in cooking and frequently lack access to kitchens during their vaca-tions in the USVI. While no data were collected on the type of cooking facilities tourists hadaccess to during their stay, one can assume that many stay-in hotels and other rented roomslacked these amenities. Furthermore, we assume that tourists lack the seafood-specific culinaryknowledge of their island resident counterparts, which means they have a higher opportunitycost of preparing a lionfish meal. Thus, it follows that despite tourists being overrepresentedin the higher-earning group, they are willing to spend less on raw lionfish than USVI residents.Regardless of this difference, both resident and tourist WTP for lionfish purchased fresh from a
Table 5. Turnbull Lower-Bound WTP Estimates by Venue and Respondent Type
Status Venue Mean WTP Var.
Resident Home (raw lionfish to cook at home) $11.80/lb 8.12Resident Restaurant entrée $17.70 6.33Tourist Home/place of lodging $10.09/lb 1.66Tourist Restaurant entrée $22.83 0.69
336 | MARINE RESOURCE ECONOMICS | VOLUME 35 NUMBER 4 2020
retail market are within the price range of similar reef fish species, according to a report by Kojis(2014).
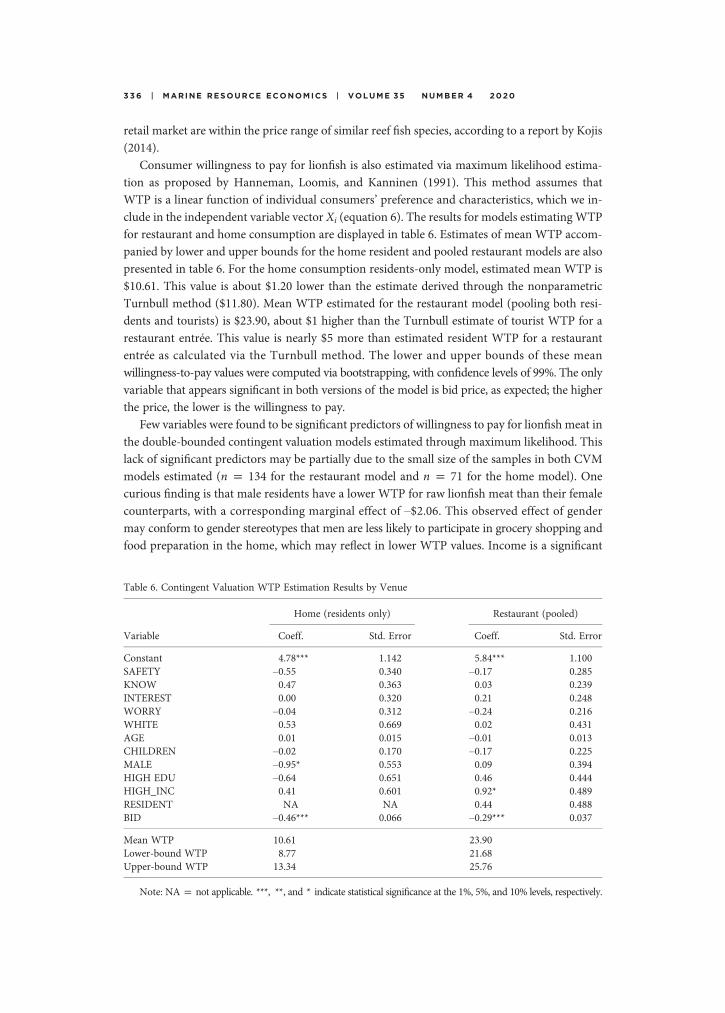
Consumer willingness to pay for lionfish is also estimated via maximum likelihood estima-tion as proposed by Hanneman, Loomis, and Kanninen (1991). This method assumes thatWTP is a linear function of individual consumers’ preference and characteristics, which we in-clude in the independent variable vector Xi (equation 6). The results for models estimating WTPfor restaurant and home consumption are displayed in table 6. Estimates of mean WTP accom-panied by lower and upper bounds for the home resident and pooled restaurant models are alsopresented in table 6. For the home consumption residents-only model, estimated mean WTP is$10.61. This value is about $1.20 lower than the estimate derived through the nonparametricTurnbull method ($11.80). Mean WTP estimated for the restaurant model (pooling both resi-dents and tourists) is $23.90, about $1 higher than the Turnbull estimate of tourist WTP for arestaurant entrée. This value is nearly $5 more than estimated resident WTP for a restaurantentrée as calculated via the Turnbull method. The lower and upper bounds of these meanwillingness-to-pay values were computed via bootstrapping, with confidence levels of 99%. The onlyvariable that appears significant in both versions of the model is bid price, as expected; the higherthe price, the lower is the willingness to pay.
Few variables were found to be significant predictors of willingness to pay for lionfish meat inthe double-bounded contingent valuation models estimated through maximum likelihood. Thislack of significant predictors may be partially due to the small size of the samples in both CVMmodels estimated (n p 134 for the restaurant model and n p 71 for the home model). Onecurious finding is that male residents have a lower WTP for raw lionfish meat than their femalecounterparts, with a corresponding marginal effect of –$2.06. This observed effect of gendermay conform to gender stereotypes that men are less likely to participate in grocery shopping andfood preparation in the home, which may reflect in lower WTP values. Income is a significant
Table 6. Contingent Valuation WTP Estimation Results by Venue
Variable
Home (residents only) Restaurant (pooled)
Coeff. Std. Error Coeff. Std. Error
Constant 4.78*** 1.142 5.84*** 1.100SAFETY –0.55 0.340 –0.17 0.285KNOW 0.47 0.363 0.03 0.239INTEREST 0.00 0.320 0.21 0.248WORRY –0.04 0.312 –0.24 0.216WHITE 0.53 0.669 0.02 0.431AGE 0.01 0.015 –0.01 0.013CHILDREN –0.02 0.170 –0.17 0.225MALE –0.95* 0.553 0.09 0.394HIGH EDU –0.64 0.651 0.46 0.444HIGH_INC 0.41 0.601 0.92* 0.489RESIDENT NA NA 0.44 0.488BID –0.46*** 0.066 –0.29*** 0.037
Mean WTP 10.61 23.90Lower-bound WTP 8.77 21.68Upper-bound WTP 13.34 25.76
Note: NAp not applicable. ***, **, and * indicate statistical significance at the 1%, 5%, and 10% levels, respectively.
Consumer Demand for Invasive Lionfish | 337
predictor of willingness to pay for lionfish in restaurant settings, with a marginal effect of $3.22.This finding suggests that individuals in the high-income group are willing to pay more for lion-fish as a restaurant entrée, suggesting that it is a normal good.
SUMMARY AND CONCLUSION
The underlying motivation of this research is to find a sustainable way to combat the prolifer-ation of invasive lionfish in the Caribbean region. If a market for lionfish meat in the USVI isfeasible, it would also be the most cost-effective means (from a policy perspective) of combattingthe spread and population growth of the species. This study focused on the demand side of apotential market for lionfish in the USVI. We analyzed survey data from potential end consum-ers (residents and tourists) on the island of St. Croix and modeled residents’ willingness to par-ticipate in a potential market for lionfish along with their potential consumption levels via adouble hurdle Poisson (DHP) regression model. Tourists’ willingness to participate in a poten-tial market for lionfish meat was modeled via a logit regression. Two separate DHP regressionswere performed in this analysis, one for restaurant consumption and another for home con-sumption. Similarly, restaurant consumption and home consumption were modeled for thetourist group with two separate logit regressions. We determined that individuals’ willingnessto participate in a market for lionfish (whether they are a resident or a tourist) is correlated witha number of individual preference and demographic characteristics. We likewise find that res-idents’ potential consumption frequencies are correlated with a number of control variables.Stakeholders hope to establish and maintain commercial fisheries for lionfish meat in the USVI.Such an endeavor, however, will be contingent on sufficient consumer demand for locallysourced lionfish as a seafood product. If sufficient demand exists, there is reason to believe thatsuch a fishery could reduce the population of lionfish to more manageable levels, allowing forthe restoration of native ecosystems and more abundant diversity of reef fish (for consumptionor for viewing).
Furthermore, estimates of mean consumer willingness to pay for lionfish meat both for homeconsumption and at restaurants are compatible with prices fisherman are willing to accept; thatis, they are higher than dockside prices of other targeted reef species (Kojis 2014). It is our hopethat increased education and outreach programs targeting residents and tourists in the USVI canincrease market participation and potential consumption levels. The WTP and consumption es-timates derived in this research provide evidence that a viable market for lionfish in the USVImay be an achievable goal. If so, a market for lionfish would create a positive externality for theUSVI, as benefits would extend beyond the suppliers and consumers directly participating in themarket. Such a market would suppress the population of lionfish without additional expenditureof public funds. Additionally, it would reduce the predation of human harvesters and lionfish onother native ecologically important species. This is critical because invasive lionfish are unlikelyto officially become a managed species, as such an action would require public expenditures onstock status determinations. Because of the species’ extraordinary rate of reproduction, we find itunlikely that future demand for lionfish in the USVI is ever going to exceed supply. Thus, evenwhile reducing their numbers to more manageable levels, commercial fisheries are unlikely tofully extirpate the species from the region, although complete elimination of the species wouldbe ideal for the ecosystem.
The most substantial findings from this analysis from a policy perspective are that accurateknowledge about lionfish and seafood safety concerns are both significant predictors of market
338 | MARINE RESOURCE ECONOMICS | VOLUME 35 NUMBER 4 2020
participation. As these variables are related to individuals’ level of knowledge, stakeholders maybe able to increase market participation through targeted education programs and outreach. Ma-terials oriented towards dispelling misinformation about the inherent risks of seafood consump-tion and informing about the lionfish problem may be beneficial in increasing the potential con-sumer base. Previous studies have shown that consumers’ food safety concerns can be influencedby media reports and public information (Cao et al. 2015; Zhou et al. 2016). Additionally, it hasbeen demonstrated that potential consumers are willing to pay more for seafood items that arecertified safe under regulated programs (Wessells and Anderson 1995), ecolabeled (Fonner andSylvia 2015), or locally sourced (Ropicki, Larkin, and Adams 2010). Thus, there exists an incen-tive for stakeholders to address potential consumers’ safety concerns about lionfish through tar-geted information and outreach campaigns.
The potential ecological contribution of a robust local market for lionfish in the USVI meritsfurther consideration. In an effort to encourage additional research and discussion on this issue,we conclude by proposing a rough estimate of the potential impact of a lionfish market on theinvasive fish’s population. Although we suspect the sample of St. Croix residents is fairly repre-sentative of grocery shoppers on the island, it is not statistically random, thus some skepticism iswarranted. Multiplying the percentage of St. Croix residents willing to buy lionfish per the surveydata by population estimates for the island, we estimate that monthly demand for lionfish meatamong residents may be as high as 38,400 pounds. Although we are less confident that the tour-ists sampled in this study are representative of all tourists on the island, we can similarly estimateaggregate demand for lionfish on the tourist side. Through multiplying mean consumption fre-quency for the tourist sample by the population of adult tourists on the island in June 2016, wederive the value 16,192 pounds of lionfish to be consumed by tourists.
As of 2016, there were 141 registered commercial fishers on the island of St. Croix, with an-other 119 commercial fishers licensed in St. Thomas and St. John (Kojis, Quinn, and Agar 2017).Based on the participatory observation of this study’s data collection team, the true number ofactive commercial fishers in the territory may be closer to 400. While these numbers of commer-cial fishers are below those required to meet all estimated consumer demand on the island ofSt. Croix, fishers can still make a significant ecological contribution by consistently harvestingthe species. Data from the geographically similar Cayman Islands suggest lionfish densities of233 to 650 fish per hectare (Frazer et al. 2012). With a total submerged area in the USVI territoryof 485 km squared up to 20 meters in depth, there is reason to believe that sufficient lionfish existto meet demand. Furthermore, research on the impact of culling efforts in the Cayman Islandsalso indicates that consistent removal of lionfish from targeted areas significantly reduces thepresence of the invasive species, albeit temporarily (Frazer et al. 2012). If a dedicated consumerbase were to be established in the USVI, then there is promise for a sustainable commercial fishery.
REFERENCES
Albins, M. A., and M. A. Hixon. 2008. “Invasive Indo-Pacific Lionfish Pterois volitans Reduce Recruitment
of Atlantic Coral-Reef Fishes.” Marine Ecology 367:233–38.
———. 2013. “Worst Case Scenario: Potential Long-Term Effects of Invasive Predatory Lionfish (Pterois
volitans) on Atlantic and Caribbean Coral-Reef Communities.” Environmental Biology of Fishes 96 (10–
11): 1151–57.
Aruga, K., and H. Makamatsu. 2018. “Consumer Perceptions toward Seafood Produced near the Fuku-
shima Nuclear Plant.” Marine Resource Economics 33 (4): 373–86.

Consumer Demand for Invasive Lionfish | 339
Bogdanoff, A. K., J. L. Akins, and J. A. Morris Jr. 2013. “Invasive Lionfish in the Marketplace: Challenges
and Opportunities.” Corpus Cristi: Gulf and Caribbean Fisheries Institute. 140–47.
Brulle, R. J., J. Carmichael, and J. C. Jenkins. 2012. “Shifting Public Opinion on Climate Change: An Em-
pirical Assessment of Factors Influencing Concern over Climate Change in the US, 2002–2010.” Climatic
Change 114 (2): 169–88.
Bureau of Economic Research, United States Virgin Islands. 2017. “USVI 2016 Tourism Indicator.” Annual
and December.
Buttel, F. H. 1979. “Age and Environmental Concern: A Multivariate Analysis.” Youth and Society 10 (3):
237–56.
Cameron, C., and P. K. Trivedi. 1990. “Regression-Based Tests for Overdispersion in the Poisson Models.”
Journal of Econometrics 46 (3): 347–64.
———. 2013. Regression Analysis of Count Data. New York: Cambridge University Press.
Cao, Y., D. R. Just, C. Turvey, and B. Wansink. 2015. “Existing Food Habits and Recent Choices Lead to
Disregard of Food Safety Announcements.” Canadian Journal of Agricultural Economics 63:491–
511.
Cheng, H.-T., and O. Capps Jr. 1988. “Demand Analysis of Fresh and Frozen Finfish and Shellfish in the
United States.” American Journal of Agricultural Economics 70 (3): 533–42.
Costa, P. T., Jr., R. R. McCrae, A. B. Zonderman, H. E. Barbano, B. Lebowitz, and D. M. Larson. 1986.
“Cross-Sectional Studies of Personality in a National Sample: 2. Stability in Neuroticism, Extraversion,
and Openness.” Psychology and Aging 1 (2): 144–49.
Cragg, J. G. 1971. “Some Statistical Models for Limited Dependant Variables with Application to the De-
mand for Durable Goods.” Econometrica 39 (5): 829–44.
Crosson, S., and H. Lia. 2017. “Integrating Commercial Fisheries Registration, Education, and Social Sci-
ence in the US Virgin Islands.” North American Journal of Fisheries Management 37:349–52.
Dietz, T., P. C. Stern, and G. A. Guangnano. 1998. “Social Structural and Social Psychological Bases of En-
vironmental Concern.” Environment and Behavior 30 (4): 450–71.
Fonner, R., and G. Sylvia. 2015. “Willingness to Pay for Multiple Seafood Labels in a Niche Market.”Marine
Resource Economics 30 (1): 51–70.
Frazer, T., C. A. Jacoby, M. A. Edwards, S. C. Barry, and C. M. Manfrino. 2012. “Coping with the Lion-
fish Invasion: Can Targeted Removals Yield Beneficial Effects?” Review in Fisheries Science 20 (4):
185–91.
Gardner, W., E. P. Mulvey, and E. C. Shaw. 1995. “Regression Analyses of Counts and Rates: Poisson,
Overdispersed Poisson, and Negative Binomial Models.” Psychological Bulletin 118 (3): 392–404.
Goedeke, T. L., A. Orthmeyer, J. C. Francis, M. K. Dillard, and M. Gorstein. 2016. Characterizing Partic-
ipation in Non-commercial Fishing and Other Shore-Based Recreational Activities on St. Croix, US Virgin
Islands. Silver Spring: NOAA National Centers for Coastal Ocean Science.
Greene, W. H. 1994. “Accounting for Excess Zeros and Sample Selection in Poisson and Negative Binomial
Regression Models.” Working Paper EC-94-10, Department of Economics, Stern School of Business.
———. 2012. LIMDEP Version 10 Econometric Modeling Guide. Plainview: Econometrics Software Inc.
———. 2018. Econometric Analysis. 8th ed. Upper Saddle River, NJ: New York University Press.
Grunert, K. G. 2005. “Food Quality and Safety: Consumer Perception and Demand.” European Review of
Agricultural Economics 32 (3): 369–91.
Haab, T. C., and K. E. McConnell. 1997. “ReferendumModels and Negative Willingness to Pay: Alternative
Solutions.” Journal of Environmental Economics and Management 32:251–70.
Hanneman, M. 1994. “Valuing the Environment through Contingent Valuation.” Journal of Economic Per-
spectives 8 (4): 19–43.
Hanneman, M., J. Loomis, and B. Kanninen. 1991. “Statistical Efficiency of Double Bounded Dichotomous
Choice Valuation.” American Journal of Agricultural Economics 73:1255–63.

340 | MARINE RESOURCE ECONOMICS | VOLUME 35 NUMBER 4 2020
Harrell, F. 2001. Regression Modeling Strategies. New York: Springer Science 1 Business Media.
Huth, W., D. M. McEvoy, and O. A. Morgan. 2018. “Controlling an Invasive Species through Consumption:
The Case of Lionfish as an Impure Public Good.” Ecological Economics 149:74–79.
Jahns, L., S. K. Raatz, L. Johnson, S. Kranz, J. T. Silverstein, and M. J. Picklo. 2014. “Intake of Seafood in
the US Varies by Age, Income, and Education Level but not by Race-Ethnicity.” Nutrients 6:6060–
75.
Kockelman, K. M., and Y.-J. Kweon. 2002. “Driver Injury Severity: An Application of Ordered Probit Mod-
els.” Accident Analysis and Prevention 34 (3): 313–21.
Kojis, B. L. 2014. “US Virgin Islands Fuel and Seafood Prices Pilot Assessment: This Dataset Contains Fuel
and Seafood Price Information for the USVI for 2012–2013 Time Period.” Southeast Fisheries Science
Center (SEFSC), Fairfax, VA.
Kojis, B. L., N. J. Quinn, and J. J. Agar. 2017. Census of Licensed Fishers of the US Virgin Islands (2016). Mi-
ami: US Department of Commerce / National Oceanic and Atmospheric Administration.
Lambert, D. 1992. “Zero-Inflated Poisson Regression with an Application to Defects in Manufacturing.”
Technometrics 34 (1): 1–14.
Malpica-Cruz, L., L. C. T. Chaves, and I. Cote. 2016. “Managing Marine Invasive Species through Public
Participation: Lionfish Derbies as a Case Study.” Marine Policy 74:158–64.
Mankiw, G. N. 2016. Essentials of Economics. 8th ed. Cengage Learning.
McDermott, A. 2017. “Invasive Lionfish Are Delicious—But Is It Safe to Eat Them?” https://oceana.org
/blog/invasive-lionfish-are-delicious-%E2%80%94-it-safe-eat-them-6.
McDowell, A. 2003. “From the Help Desk: Hurdle Models.” The Stata Journal 3 (2): 178–84.
Moonsammy, S., D. Buddo, and G. Seepersad. 2011. “Assessment of the Economic Impacts of the Lion
Fish” (Pterois volitans) Invasion in Jamaica.” GCFI 64–13.
Morris, J. A., Jr., A. Thomas, A. L. Ryne, N. Breen, L. Akins, and B. Nash. 2011. “Nutritional Properties of
the Invasive Lionfish: A Delicious and Nutritious Approach for Controlling the Invasion.” Aquaculture,
Aquarium, Conservation and Legislation: International Journal of the Bioflux Society 4 (1): 21–26.
Mullahy, J. 1986. “Specification and Testing of Some Modified Count Data Models.” Journal of Economics
33:341–65.
Myers, M. 2016. “Get to Know Lionfish.” https://www.wholefoodsmarket.com/blog/get-know-lionfish-0.
Nauman, F. A., C. M. Gempesaw, R. J. Bacon, and A. Manalo. 1995. “Consumer Choice for Fresh Fish: Factors
Affecting Purchase Decisions.” Marine Resource Economics 10 (2): 117–42.
Onozaka, Y., H. Hansen, and A. Sorvig. 2014. “Consumer Product Perceptions and Salmon Consumption
Frequency: The Role of Heterogeneity Based on Food Lifestyle Segments.” Marine Resource Economics
29 (4): 351–74.
Robertson, A., A. C. Garcia, H. A. Flores Quintana, T. B. Smith, B. F. Castillo II, K. Reale-Munrow, J. A.
Gulli, et al. 2014. “Invasive Lionfish (Pterois volitans): A Potential Human Health Threat for Ciguatera
Fish Poisoning in Tropical Waters.” Marine Drugs 12 (1): 88–97.
Rocha, L. A., C. R. Rocha, C. C. Baldwin, L. A. Weigt, and M. McField. 2015. “Invasive Lionfish Preying on
Critically Endangered Reef Fish.” Coral Reefs 34 (3): 803–06.
Roheim, C., J. Kline, and J. G. Anderson. 1996. “Seafood Safety Perceptions and Their Effects on Antici-
pated Consumption under Varying Information Treatments.” Agricultural and Resource Economics Re-
view 25:12–21.
Ropicki, A., S. Larkin, and C. M. Adams. 2010. “Seafood Substitution and Mislabeling: WTP for a Locally
Caught Grouper Labeling Program in Florida.” Marine Resource Economics 25 (1): 77–92.
Saad, L. 2017. “Americans’ Dining-Out Frequency Little Changed from 2008.” Gallup News, January 11,
2017.
Senhui, H., S. M. Flether, and R. Arbindra. 2003. “Identifying Factors Influencing Beef, Poultry, and Seafood
Consumption.” Journal of Food Distribution Research 34 (1): 1–6.

Consumer Demand for Invasive Lionfish | 341
Shim, M., and M. You. 2015. “Cognitive and Affective Risk Perceptions toward Food Safety Outbreaks:
Mediating the Relation between News Use and Food Consumption Intention.” Asian Journal of Com-
munication 25 (1): 48–64.
Stoffle, B., J. R. Waters, S. Abbott-Jamieson, S. Kelley, D. Grasso, J. Freibaum, S. Koestner, et al. 2009.
“Can an Island be a Fishing Community: An Examination of St. Croix and its Fisheries.” NOAA Tech-
nical Memorandum NMFS-SEFSC-593, National Oceanic and Atmospheric Administration, National
Marine Fisheries Service, Miami, FL.
Turnbull, B. W. 1976. “The Empirical Distribution Function with Arbitrarily Grouped, Censored and
Truncated Data.” Journal of the Royal Statistical Society 38 (3): 290–95.
Waite, R. 2011. “Lionfish Invasion Threatens Coral Reefs in the Atlantic and Caribbean.” https://www.wri
.org/blog/2011/08/lionfish-invasion-threatens-coral-reefs-atlantic-and-caribbean.
Wessells, C. R., and J. G. Anderson. 1995. “Consumer Willingness to Pay for Seafood Safety Assurances.”
Journal of Consumer Affairs 29 (1): 85–107.
Wilkinson, C. 2008. “Executive Summary.” In Status of Coral Reefs of World: 2008. Townsville, Australia:
Global Coral Reef Monitoring Network and Reef and Rainforest Research Centre.
Yeung, R. M. W., and Joe Morris. 2001. “Food Safety Risk: Consumer Perception and Purchase Behaviour.”
British Food Journal 103 (3): 170–87.
Zeileis, A., C. Kleiber, and S. Jackman. 2008. “Regression Models for Count Data in R.” Journal of Sta-
tistical Software 27 (8).
Zhou, L., C. G. Turey, W. Hu, and Y. Ruiyao. 2016. “Fear and Trust: How Risk Perceptions of Avian In-
fluenza Affect Chinese Consumers’ Demand for Chicken.” China Economic Review 40:91–104.