marketing in the driver's seat: using analytics to create customer value
Upload
john-whitmer-eddCategory
view
245download
0
Using Learning Analytics to Create Our ‘Preferred Future’ Vision, Proof Points & Trends
John Whitmer, [email protected]
@johncwhitmer
Online Learning Consortium CollaborateFebruary 24, 2015

Quick bio
15 years managing academic technology at public higher ed institutions (R1, 4-year, CC’s)
• Always multi-campus projects, innovative uses of academic technologies
• Driving interest: what’s the impact of these projects? Most recently: California State University, Chancellor’s Office, Academic Technology Services
Doctorate in Education from UC Davis (2013) with Learning Analytics study on Hybrid, Large Enrollment course
Active academic research practice (San Diego State Learning Analytics, MOOC Research Initiative, Udacity SJSU Study…)

Quick poll
A Unfamiliar; Never heard of it
Somewhat familiar; I’ve seen a reference or two
Very familiar; I follow the literature and/or use it in my practice
Expert; I’m very knowledgeable and actively contributing to the field
How familiar are you with learning analytics?
B
C
D

My Driving Questions
How do we really know academic technologies are improving student learning?(post-hoc)
How can we improve the design/build/assess cycle for academic technology innovation?(design research)

1. Defining Learning Analytics
2 .What we’re learning from research
3. Looking to the future
4. Immediate applications (time permitting)
Outline

1. Defining Learning Analytics

200MB of data emissions annually
Economist. (2010, 11/4/2010). Augmented business: Smart systems will disrupt lots of industries, and perhaps the entire economy. The Economist.

Logged into course within 24 hours
Interacts frequently in discussion boards
Failed first exam
Hasn’t taken college-level math
No declared major

What is learning analytics?
Learning and Knowledge Analytics Conference, 2011
“ ...measurement, collection,
analysis and reporting of data about
learners and their contexts,
for purposes of understanding
and optimizing learning
and the environments
in which it occurs.”

Strong interest by faculty & students
From Eden Dahlstrom, D. Christopher Brooks, and Jacqueline Bichsel. The Current Ecosystem of Learning Management Systems in Higher Education: Student, Faculty, and IT Perspectives. Research report. Louisville, CO: ECAR, September 2014. Available from http://www.educause.edu/ecar.

2. What we’re learning from research

Learning analytics pilot study for Introduction to Religious Studies
Redesigned to hybrid delivery through Academy eLearning
Enrollment: 373 students (54% increase on largest section)
Highest LMS (Vista) usage entire campus Fall 2010 (>250k hits)
Bimodal outcomes:
• 10% increased SLO mastery
• 7% & 11% increase in DWF
Why? Can’t tell with aggregated reporting data
54 F’s

Student retention: Grades vs. LMS logins
Course: “Introduction to Religious Studies” CSU Chico, Fall 2013 (n=373)

At-risk students: “Over-working gap”

Activities by Pell and grade
Grade / Pell-Eligible
A B+ C C-
0K
5K
10K
15K
20K
25K
30K
35K
Measure Names
Admin
Assess
Engage
Content
Not Pell-Eligible
Pell-Eligible
Not Pell-Eligible
Pell-Eligible
Not Pell-Eligible
Pell-Eligible
Not Pell-Eligible
Pell-Eligible
Extra effortIn content-related activities

Learning analytics triggers & interventions proof of concept study
President-level initiative
Goals: (1) find accurate learning analytics triggers; (2) create effective interventions
Multiple academic technology “triggers” (e.g., LMS access, Grade, Online Homework/Quiz, Clicker use)
Conducted Spring 2014, Fall 2015 (3 courses, 7 sections)

Frequency of interventions (Spring 2014)
# Students Receiving >0 Interventions: PSY: 177 (84%) STAT: 165 (70%)
14%
19%
11%
17%
10%
6%5%
6%
2% 1%3% 2%
30%
17%
13%12%
7%
6% 6%
3%
4%
1%2%
4%
0%
5%
10%
15%
20%
25%
30%
35%
0 1 2 3 4 5 6 7 8 9 10 >10
Stu
de
nts
Interventions
PSY
STAT

Fall 2014 Multimedia Interventions

Poll question
A Not significant
<10%, significant .05 level
20%, significant .01 level
30%, significant .01 level
Did triggers predict achievement? What level significance? How much variation in student grade was explained?
B
C
D
E 50%+, significant .001 level

Poll question
A Not significant
<10%, significant .05 level
20%, significant .01 level
30%, significant .01 level
Did triggers predict achievement? What level significance? How much variation in student grade was explained?
B
C
D
E 50%+, significant .001 level

Statistics
Learning analytics triggers vs. final course pointsSpring 2014: 4 sections, 2 courses, 882 students
Psychology
p<0.0001; r2=0.4828 p<0.0001; r2=0.6558

Fall 2014 results: Almost identical5 Sections, 3 Courses, N=1,220 students
p<0.00001; r2=0.4836
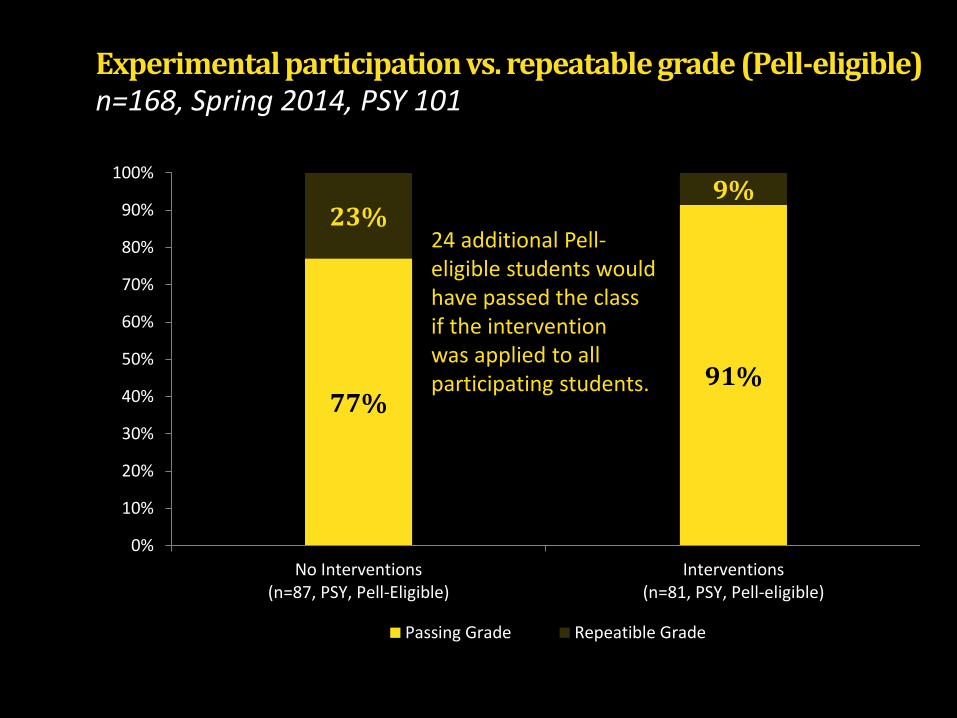
77%91%
23%9%
0%
10%
20%
30%
40%
50%
60%
70%
80%
90%
100%
No Interventions(n=87, PSY, Pell-Eligible)
Interventions(n=81, PSY, Pell-eligible)
Passing Grade Repeatible Grade
24 additional Pell-eligible students would have passed the class if the intervention was applied to all participating students.
Experimental participation vs. repeatable grade (Pell-eligible) n=168, Spring 2014, PSY 101

Summary findings previous LMS analytics studies
Institution-Wide Analysis with Only LMS Data
Course-Specific with Only LMS Data
Course-Specific with LMS Data & Other Sources
% G
rad
e E
xp
lain
ed
#
60%
50%
40%
30%
20%
10%
0%
25%
4%
51%
0%
33% 31%
57%
35%
(Whitmer, 2013a)
(Campbell 2007a)
(Campbell 2007b)
(Jayaprakash, Lauria 2014)
(Macfadyenand Dawson
2010)
(Morris, Finnegan et al.
2005)
Whitmer & Dodge (2015)
Whitmer (2013b)
HybridCourse Format:
Hybrid, online
Online

3. Looking to the future

Factors affecting growth of learning analytics
Enabler
Constraint
WidespreadRare
New education models
Resources ($$$, talent)
Data governance (privacy, security, ownership)
Clear goals and linked actions
Data valued in academic decisions
Tools/systems for data co-mingling and analysis
Academic technology adoption
Low data quality (fidelity with meaningful learning)
Difficulty of data preparation
Not invented here syndrome

Call to action (from a May 2012 Keynote Presentation @ San Diego State U)
You’re not behind the curve, this is a rapidly emerging area that we can (should) lead...
Metrics reporting is the foundation for analytics
Start with what you have! Don’t wait for student characteristics and detailed database information; LMS data can provide significant insights
If there’s any ed tech software folks in the audience, please help us with better reporting!