USING KEY CONCEPTUAL IDEAS - ERIC · USING KEY CONCEPTUAL IDEAS TO IMPROVE TEACHER USE OF FORMATIVE...
35
CRESST REPORT 794 Terry P. Vendlinski Julia Phelan USING KEY CONCEPTUAL IDEAS TO IMPROVE TEACHER USE OF FORMATIVE ASSESSMENT DATA MAY, 2011 The National Center for Research on Evaluation, Standards, and Student Testing Graduate School of Education & Information Sciences UCLA | University of California, Los Angeles
Transcript of USING KEY CONCEPTUAL IDEAS - ERIC · USING KEY CONCEPTUAL IDEAS TO IMPROVE TEACHER USE OF FORMATIVE...

CRESST REPORT 794
Terry P. Vendlinski
Julia Phelan USING KEY CONCEPTUAL IDEAS
TO IMPROVE TEACHER USE OF
FORMATIVE ASSESSMENT
DATA
MAY, 2011
The National Center for Research on Evaluation, Standards, and Student Testing
Graduate School of Education & Information Sciences UCLA | University of California, Los Angeles

Using Key Conceptual Ideas to Improve Teacher Use of Formative Assessment Data
CRESST Report 794
Terry P. Vendlinski and Julia Phelan CRESST/University of California, Los Angeles
May, 2011
National Center for Research on Evaluation, Standards, and Student Testing (CRESST) Center for the Study of Evaluation (CSE)
Graduate School of Education & Information Studies University of California, Los Angeles
300 Charles E. Young Drive North GSE&IS Bldg., Box 951522
Los Angeles, CA 90095-1522 (310) 206-1532

Copyright © 2011 The Regents of the University of California. The work reported herein was sponsored by the US Department of Education (IES Grant Number R305A050004). The findings and opinions expressed in this report are those of the authors and do not necessarily reflect the positions or policies of the US Department of Education. To cite from this report, please use the following as your APA reference: Vendlinski, T.P., & Phelan, J. (2011). Using key conceptual ideas to improve teacher use of formative assessment data. (CRESST Report 794). Los Angeles, CA: University of California, National Center for Research on Evaluation, Standards, and Student Testing (CRESST).
iii
TABLE OF CONTENTS
Abstract ..................................................................................................................................1 Introduction ............................................................................................................................1
Improving the Way Mathematics Is Taught ......................................................................2 Creating Professional Development to Improve Teaching ................................................2 Measuring the Short-Term Effects of Professional Development .....................................3
Methods .................................................................................................................................4 Teacher Knowledge Maps .................................................................................................6
Results ....................................................................................................................................8 Overall Results ...................................................................................................................9 Results by Grade Level ....................................................................................................12
References ............................................................................................................................21 Appendix ..............................................................................................................................27
1
USING KEY CONCEPTUAL IDEAS TO IMPROVE TEACHER USE OF
FORMATIVE ASSESSMENT DATA
Terry P. Vendlinski and Julia Phelan CRESST/University of California, Los Angeles
Abstract
Making the transition from arithmetic to mathematics, especially algebra, is critical to future academic and economic success, yet many students find this transition difficult and success in algebra elusive. This paper reports on the outcomes achieved from a three year course of professional development, POWERSOURCE©, that helped teachers apply key foundational concepts and formative assessment to math content studied in the 6th, 7th, and 8th grade. The POWERSOURCE© project associated with the professional development reported here found significant gains from students’ pretests to students’ posttests. Our findings suggest that these gains were associated with changes in teacher thinking and that such change may be easier for more experienced math teachers in earlier rather than later middle school grades.
Introduction
Making the transition from arithmetic to mathematics, especially algebra, is critical to
future academic and economic success (Rech & Harrington, 2000); yet, many students find
this transition difficult and success in algebra elusive (Ball, 2003; Helfand, 2006; Kollars,
2008; Meehan & Huntsman, 2004; Rubin, 2007; Silver, Saunders, & Zarate, 2008). In part,
this difficulty seems to stem from the fact that many teachers of mathematics seldom build
on students’ prior pre-conceptions, understanding, intuition, or innate problem solving
strategies (Donovan & Bransford, 2005). Instead teachers often present math as a set of rules,
procedures, and facts to be memorized (Bransford, Brown, & Cocking, 1999); present
mathematics in a seemingly random or disorganized manner; and lastly, divorce procedural
knowledge from what the processes or results mean (Fuson, Kalchman, & Bransford, 2005).
Unfortunately, many teachers do not seem prepared to organize and teach from such a
conceptual vantage point and do not know where to find help to do so (Kieran, 2003). This
paper reports on the outcomes achieved from a three year course of professional development
that tried to help teachers apply key foundational concepts and formative assessment to
content studied in the 6th, 7th and 8th grades. We first discuss the basis for the intervention as
found in the expert-novice and cognitive science literature. Then we discuss how the
professional development literature suggests to best structure professional development and
2
how teacher change that is associated with professional development might be directly, rather
than obliquely, measured.
Improving the Way Mathematics Is Taught
Research in expert versus novice learning as well as learning research in cognitive
science suggests how we might improve the way mathematics is taught. Research that spans
as far back as deGroot (1965),continuing through Chi and her colleagues (Chi, Bassok,
Lewis, Reimann, & Glaser, 1989; Chi & Slotta, 1993),and into the present (Fuson et al.,
2005; Kaput, 2004; VanLehn, Siler, Murray, Yamauchi, & Baggett, 2003), hints at the
importance of helping teachers present a more “expert-like” conceptualization of domains
such as mathematics. In contrast to the piecemeal, context-bound knowledge that novice
learners possess, expert knowledge has a relational structure—organized around important,
abstract ideas within a given domain (Chi, Feltovich, & Glaser, 1981).
Cognitive studies also suggest that the understanding of a parsimonious set of key
organizing principles leads to more flexible and generalizable knowledge use, improves
problem solving, makes it easier to understand and master new facts and procedures, and
enables transfer (e.g., Rakes, Valentine, McGatha, & Ronau, 2010; Greer, 2003; Carpenter,
Fennema, Levi, Franke, & Empson, 2000). Research in the field suggests that, in
mathematics especially, subsequent knowledge builds on and helps students abstract the
more concrete procedures and concepts developed in arithmetic (Gersten, Chard, Jayanthi,
Baker, Morphy, & Flojo, 2008; Donovan & Pellegrino, 2004).
This suggests to us that helping teachers organize the mathematics domain around key
foundational algebraic concepts, especially concepts already understood by students, might
encourage more expert-like conceptions in both teachers and students and thereby improve
both teacher pedagogy and student success in algebra and in mathematics as a whole.
Creating Professional Development to Improve Teaching
The expert-novice and cognitive science literature, along with our own experience,
suggests that one way to improve mathematics instruction and success with algebra in the
United States may be to provide professional development (PD) aimed at increasing the
ability of teachers to “help students build and consolidate prerequisite competencies,
understand new concepts in depth, and organize both concepts and competencies in a
network of knowledge” (Donovan & Bransford, 2005, pp.232).
Overwhelmingly, the body of knowledge on effective PD suggests that quality
professional development should focus on: 1) developing the content knowledge of teachers,

3
especially in the content they will actually be teaching; 2) developing a community of
teacher-learners that can, among other things, actively share teaching strategies and plan for
classroom integration of these strategies; and 3) allowing teachers to examine student work
and to explore how student thinking (both accurate and inaccurate student conceptions)
develops (Desimone & Ueno, 2006; Fishman, Besta, & Talb, 2003; Garet, Desimone,
Birman, & Yoon, 2001; Ingvarson & Beavis, 2005; Seago, 2004; Sparks, 2000; Stigler &
Hiebert, 1999). That said, however, as Guskey (2002) points out, “change is a gradual and
difficult process for teachers” (p. 386).
Measuring the Short-Term Effects of Professional Development
Since teacher expertise is an important predictor of student achievement (Darling-
Hammond, 2007), some have argued that student achievement would be an appropriate
measure of change in teacher quality and in teacher beliefs (Hanushek, 2002), and ultimately
would be an appropriate measure of the effectiveness of professional development. The fact
that such improvements may occur gradually, may be hard to detect on large-scale
summative tests, and my be mediated by a number of intervening events suggests a more
proximal measure of teacher change is required to determine the short-term effects of
professional development efforts.
Our conceptualization of what makes an effective teacher has important implications
for how we improve and assess teacher quality. Assessments of teacher knowledge have
proven difficult (Tittle, 2006), although not impossible to develop (Hill & Ball, 2004). As
Tittle (2006) points out, “assessment methods [in studies of teacher learning and
development] are evolving from work within the expert / novice paradigm … and using
analyses of content…” (p. 956). With this in mind, researchers at the National Center for
Research on Evaluation, Standards, and Student Testing (CRESST) have built on the work of
Leinhardt and Ball and their colleagues (see Ball, Lubienshi, & Mewborn, 2001; Leinhardt &
Greeno, 1984; Leinhardt & Smith, 1985) to develop a means to measure teacher ability to
conceptualize foundational ideas and to use information from formative assessment to plan or
modify instruction (Chung et al., 2006; Heritage, Kim, Vendlinski, & Herman, 2009).
Our hypothesis is that if teachers could be helped to understand and teach concepts
from the position of expertise and analyze student work from this perspective, teacher quality
would improve. We believe that professional development that focuses on the key ideas of
mathematics will deepen both teacher and student understanding of these ideas as well as the
concepts that build upon them, and will allow learners to build the ideas necessary to form
solid foundations for the application of mathematics both in and out of school. We also

4
realize, however, that instruction organized in this manner will require that teachers learn to
reorganize and teach fundamental concepts in more expert-like ways. Because many teachers
are taught in a system that stresses procedure rather than conceptual understanding (e.g., they
tend to organize instruction around textbooks, which oftentimes present material in a
procedural way and may provide little guidance in regards to how to change their teaching)
(Kieran, 2003), such change may be difficult (Ai, 2002).
Based on this hypothesis, we developed a program of professional development
designed to help teachers conceptualize mathematics instruction around key foundational
ideas, and improve their ability to effectively use formative assessment data in 6th, 7th and 8th
grade math classrooms. Both the formative assessments and professional development were
designed around a collection of big ideas developed by content experts and math educators
(Niemi, Vallone, & Vendlinski, 2006); the formative assessments were designed to elicit
student thinking and misconceptions about those big ideas. The program of professional
development described in this study supports a larger formative assessment effort as part of a
US Department of Education sponsored study called POWERSOURCE©.
Methods
We used the knowledge map of Leinhardt, as refined by Chung and colleagues (Chung
et al., 2006; Leinhardt & Smith, 1985), to measure teacher content organization. We used
these maps as pre-post measures at the start of professional development and again at end of
each year of professional development in order to test our hypotheses and to measure the
effects of the teachers’ efforts. These combined measures were designed to assess how each
teacher organized a limited part of the domain of algebra and how the teachers connected
problems and the concepts necessary to solve those problems.
Approximately 230 public school teachers, from seven school districts in Southern
California and Arizona participated in various phases of this three year study. The teachers
taught 6th, 7th or 8th grade mathematics and were randomly divided into treatment or control
conditions. Randomization was done either between school (all teachers from a school were
either treatment or control) or within school (some of the teachers in a school were randomly
selected to receive the treatment while the remainder were placed in the control group). The
within school design was favored unless districts mandated the use of a between school
design. Subject teachers were assigned to one of the two conditions in approximately equal
numbers.
Each treatment teacher in this study received approximately 9 hours of professional
development in small groups (usually between 5 and 20 teachers) each year. These sessions

5
were conducted largely outside of school hours at the district office or at one of the school
sites within each district. For the most part, the initial four hours of professional development
each year was almost always done prior to the beginning of the academic year. Three 90
minute follow-up sessions with the teachers were conducted in after school settings with the
teachers at approximately two-and-a-half month intervals during the remainder of the school
year.
In the first year of professional development, the first session focused on conceptual
organization of key mathematical concepts and how these concepts appeared in various
forms in the appropriate grade level content of the teachers attending the professional
development. During the first 45 minutes of each of the follow-up sessions, teachers and
researchers discussed student work (from the teachers’ students) on the formative
assessments associated with a particular foundational concept, possible misconceptions
identified by those assessments, and possible instructional interventions to correct those
misconceptions given the key concepts. The last 45 minutes of each session focused on
another single key concept and its application— how that concept would be developed from
its nascent form into abstract concepts in algebra as well as how the concept could be
appropriately taught and applied to the specific subject matter of each grade. To aid teachers
with their upcoming instruction on each foundational concept, teachers were given an
instructional handbook during the latter part of each session. The professional development
integrated this instructional handbook (pedagogical content) with the conceptual
development of each of the big ideas (content knowledge).
During the second and third year of professional development, teachers participated in
four 90 minute professional development sessions. In each of these sessions, the teachers
were grouped into dyads; they worked to develop a two day plan to teach each of the four
POWERSOURCE© lessons. The teachers were presented with examples of their students’
work and the work of other teachers’ students from the previous year. Based on this work
and their prior experience teaching each lesson, the teachers discussed student
misconceptions and the effectiveness of various teaching strategies intended to eliminate
those misconceptions; they also went over sample problems that could be used to elicit
misconceptions. The teachers then worked to develop their upcoming lesson and shared this
with the larger group. Sixth grade teachers in the third year followed the same course of
professional development as they had in Year 2, but the professional development meetings
were moderated by district personnel rather than researchers.
We began our professional development efforts with 6th grade teachers in Year 1; we
conducted professional development for 6th and 7th grade teachers in Year 2; and finally we

6
offered 6th, 7th, and 8th grade teachers professional development in Year 3. Consequently,
most 6th grade teachers received three years of professional development, most 7th grade
teachers received two years of professional development, and 8th grade teachers received one
year of professional development. This phased-in approach allowed us to explore the effects
of dosage (one to three years of professional development) and leveraged the matriculation of
the student population from 6th to 7th and then from 7th to 8th grade. Furthermore, teachers
were able to teach students who had been exposed to the POWERSOURCE© intervention in
previous grades. District policy and resource limitations prevented us from varying the
treatment dosage by grade for teachers (i.e. one-, two-, and three-year course of professional
development for each of the grade levels) or for students.
After each professional development session, the teachers returned to their classrooms
and instructed their students on the applicable key concepts for two class periods of
approximately 40 minutes each. Following the initial presentation of a concept to their
students, teachers were encouraged to continue to use each concept in other instructional
units they developed during the year.
In addition to these treatment groups, we created various control groups which were
intended to receive equal amounts of other types of professional development. The control
teachers received one of three professional development interventions. The first control (in
one district) received the usual district professional development; the second control group
(in one district) received instruction in determining the technical quality of district
benchmark assessments using a data reporting and analysis tool; and the final control (in four
districts) received instruction in student self-efficacy and motivation. Aside from the first
control, researchers on the project were able to control the amount of time each teacher
participated in these professional development programs and were able to ensure the content
was rigorous but did not overlap with POWERSOURCE©.
All teachers in the treatment and control groups created a knowledge map prior to any
professional development. At the end of each school year, after the completion of treatment
and control professional development activities for that school year, teachers again
completed the same type of knowledge map.
Teacher Knowledge Maps
To evaluate the maps created by the teachers, each knowledge map was compared to an
expert knowledge map created by the researchers conducting professional development. This
“expert map” was created by combining the individual maps that those researchers created in
isolation from one another and from the teachers. The individual expert maps were identical

7
on more than 98 percent of the relationships and concepts; the researchers met to resolve
remaining differences in the map prior to its use as the “expert” standard.
The agreement between each teacher map and the expert map was analyzed for
similarity by counting the number of exact matches between teacher and expert propositions.
In this case, a match between teacher and expert required that two identical concepts be
connected using an identical link. For example, additive inverse (a concept) is a property of
(link) arithmetic (a concept). In the exact match comparison, the “direction” of the link was
also specified. For the example just given, “Additive inverse is a property of addition” would
be scored as a match, but “A property of addition is an additive inverse” would not be scored
as a match. In addition to this strictest scoring—we also analyzed the maps without
considering the direction of the connection, without the link label, or without either the link
label or the direction. In this latter case, the analysis was focused on whether two concepts
that were connected by the experts were connected together in any way by the teachers. As
noted elsewhere, more relaxed scoring schemes allowed too much noise into our analysis and
were not useful for our purposes in the present study (Vendlinski, Hemberg, Mundy, Baker,
Herman, Phelan, J., et. al., 2009). The directions for completing the knowledge map, as well
as the complete list of concepts and links is provided in the Appendix.
To complete the task, the teachers were also asked to connect various problems to the
concept map they had created. Specifically, the teachers were asked to link a problem with a
concept if that concept was necessary to solve the particular problem. Finally, the teachers
were asked to label each problem-concept link with a “2” if knowing the concept alone was
sufficient to solve the problem and with a “1” if knowing the concept was necessary, but
insufficient on its own to solve the problem. One might, for example, be able to solve the
problem 12 ÷ 4 by understanding only the concept of division; yet, understanding only
division, while necessary, would alone be insufficient to find the mean of three numbers.
For the problem-concept part of the mapping task, we analyzed the data in two ways.
First, the teacher maps were compared with the experts and rated for exact matches (link and
label). Second, the teacher maps were compared with the expert map for any connection
(regardless of label) between a problem and concept. As was the case with the concept maps,
only first scoring method proved sufficiently concise to be useful (Vendlinski, Hemberg,
Mundy, Baker, Herman, Phelan, J., et. al., 2009).
Generally, the 6th grade teachers joined the study in the first year, the 7th grade teachers
in the second year, and the 8th grade teachers in third and final year of professional
development. Teachers who taught multiple grades and teachers who were assigned to teach

8
different grades between years were allowed to move to different grade level cohorts to
accommodate requests from teachers and districts. Given, however, that teachers only
generated one knowledge map before professional development, these teachers were only
included in the cohort that reflected their first year in the study. Moreover, for the analysis
reported here, we only considered teachers who remained with their cohort throughout the
course of the study.
The comparisons were evaluated using an independent samples t-test to make point-in-
time comparisons. We used paired samples t-tests to determine the significance of changes
within groups (pre- to post-) and ANCOVA analysis to determine the significance of overall
change between groups when controlling for teacher conceptual organization and problem–
concept linking ability prior to professional development.
Results
The longitudinal nature of this study allowed us to investigate the changes in the
teachers’ organization of data as well as their ability to connect problems and the concepts
necessary to solve those problems over time. The number of teachers’ concept-based
knowledge maps, available for use in each year of the study, is provided in Table 1:
Table 1
Number of Conceptual Knowledge Maps Used for Analysis by Year and Grade Taught
Grade level
Pretest fall
2007
Posttest spring 2008
Pretest fall
2008
Posttest spring 2009
Pretest fall
2009
Posttest spring 2010
6th
Treatment 47 40 40 40
Control 30 26 26 26
7th
Treatment 30 22 11
Control 18 18 16
8th
Treatment 10 9
Control 9 10
Table 2 displays the number of teachers’ problem–concept maps used in each year of
the study.

9
Table 2
Number of Problem–Concept Link Maps Used for Analysis by Year and Grade Taught
Grade level
Pretest fall
2007
Posttest spring 2008
Pretest fall
2008
Posttest spring 2009
Pretest fall
2009
Posttest spring 2010
6th
Treatment 47 35 40 40
Control 30 24 26 26
7th
Treatment 30 22 11
Control 19 18 16
8th
Treatment 10 9
Control 9 10
In order to tease out the ability of teachers at the start of the study and at various time
points during the study, we performed a series of analyses. First, we compared the treatment
and control groups using an independent samples t-test. Next, we wanted to see how teachers
in the treatment group changed as they received increasing amounts of professional
development. These changes were analyzed using paired sample t-tests. Finally, to determine
the significance of differences attributable to our professional development, we analyzed
changes between the teachers starting abilities and their abilities after various amounts of
professional development between treatment and control groups by using an Analysis of
Covariance (ANCOVA) test. We first performed these analyses on the teachers in a group
regardless of grade, and then on each of the grade level cohorts of teachers.
Overall Results
As revealed in Table 3, an independent samples t-test, suggests that the treatment
teachers as a whole (that is not grouped by grade) begin significantly lower than the control
teachers on organizing concepts prior to professional development; yet, after one year there
were no significant differences. Similar analysis for the group of teachers who have
completed maps before and after two years of professional development suggests that the
treatment and control groups are, again, not significantly different. It should be noted that at
the end of the first year several teachers, especially those in the control sample, did not
complete conceptual knowledge maps; hence, the results after one year of professional
development must be interpreted cautiously due to sample size variation.

10
Table 3
Independent Samples T-Test of Conceptual Knowledge Maps Pre Test and Post After Years 1 and 2
Type of map N M SD df t p
PreMap
Treatment 27 0.41 1.047 52.37 1.891 0.064*
Control 33 1.12 1.833 52.37 1.891 0.064*
PostMap 1
Treatment 25 1.08 1.656 49.00 -0.385 0.702
Control 26 0.92 1.230 49.00 -0.385 0.702
PostMap 2
Treatment 27 0.96 1.506 58.00 1.066 0.291
Control 33 1.45 1.970 58.00 1.066 0.291
*p < .1
Based on these results, we analyzed the significance of the pre- to posttest change that
the treatment teachers made after both one and two years of professional development. While
the changes after just one year were not significant (t = 1.455, df = 67, p = .150), the growth
was marginally significant after two years. Table 4 shows the results of these analyses. The
treatment teachers who had at least two years of professional development (i.e. the 6th and 7th
grade treatment teachers) were better able to organize the mathematical concepts of interest
after this professional development than they were previously. There were no significant pre-
to post- changes in the control group.
Table 4
Paired Samples T-Test of Conceptual Knowledge Maps Pre to Post After Year 2 (Treatment Group)
Type of map N M SD df t p
PreMap 27 0.41 1.047 26 2.018 0.053*
PostMap 2 27 0.96 1.506 26 2.018 0.053*
*p < .1
We used the same approach to analyze the data about teachers’ growth in the ability to
link problems to concepts required to solve those problems. Unlike the conceptual
organization tasks, the treatment teachers were not significantly different from the teachers in
the control group in their abilities to accomplish this problem linking task at the outset. The
two groups did, however, differ significantly after two years (see Table 5). Yet, in this case,

11
the difference seems attributable to the fact that the treatment teachers actually lost ground in
their ability to connect problems and concepts in expert-like ways.
Table 5
Independent Samples T-Test of Problem–Conceptual Links Pre Test and Post After Year 2
Type of map N M SD df t p
PreMap
Treatment 27 4.70 4.121 58.000 0.372 0.711
Control 33 5.06 3.307 58.000 0.372 0.711
PostMap 2
Treatment 27 3.74 3.108 54.812 1.874 0.066*
Control 33 5.70 4.915 54.812 1.874 0.066*
*p < .1
As before, we analyzed these changes in the ability of the treatment teachers to connect
problems with the concepts necessary to solve those problems after two years of professional
development by using a paired samples t-test. This analysis suggests that the changes in the
treatment teachers between a time prior to professional development and after two years of
professional development were not significantly changed (t = -1.101, df = 26, p = .281).
Finally, in order to account for group differences in the knowledge maps prior to
professional development, we conducted an ANCOVA analysis to determine if the type of
professional development the teachers received produced significant between group
differences. There were no significant between group changes in the teachers’ abilities to
conceptually organize concepts after one or after two years of professional development.
Similarly, there were no significant between group differences when considering the
teachers’ abilities to link concepts and problems after one year of professional development.
As suggested previously, however, the treatment teachers did seem to regress in their ability
to link problems and concepts, compared to the control group, after two years of professional
development. Our ANCOVA analysis (see Table 6) suggests this is a marginally significant
change between groups.
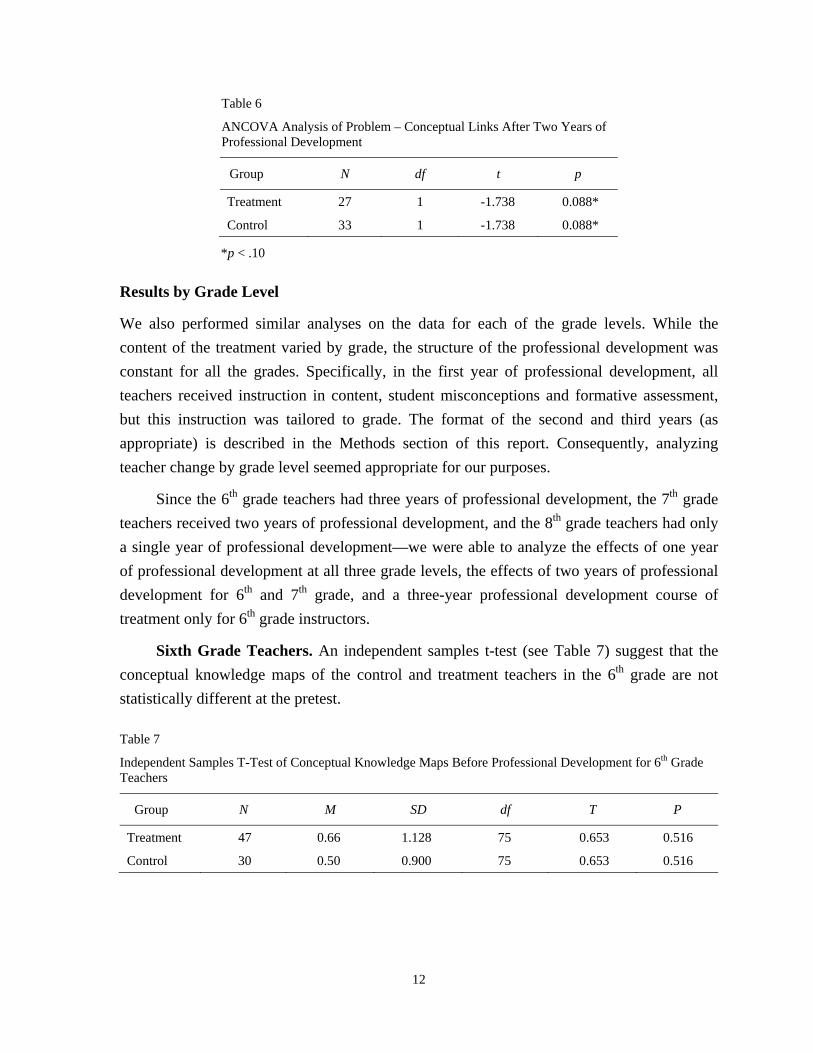
12
Table 6
ANCOVA Analysis of Problem – Conceptual Links After Two Years of Professional Development
Group N df t p
Treatment 27 1 -1.738 0.088*
Control 33 1 -1.738 0.088*
*p < .10
Results by Grade Level
We also performed similar analyses on the data for each of the grade levels. While the
content of the treatment varied by grade, the structure of the professional development was
constant for all the grades. Specifically, in the first year of professional development, all
teachers received instruction in content, student misconceptions and formative assessment,
but this instruction was tailored to grade. The format of the second and third years (as
appropriate) is described in the Methods section of this report. Consequently, analyzing
teacher change by grade level seemed appropriate for our purposes.
Since the 6th grade teachers had three years of professional development, the 7th grade
teachers received two years of professional development, and the 8th grade teachers had only
a single year of professional development—we were able to analyze the effects of one year
of professional development at all three grade levels, the effects of two years of professional
development for 6th and 7th grade, and a three-year professional development course of
treatment only for 6th grade instructors.
Sixth Grade Teachers. An independent samples t-test (see Table 7) suggest that the
conceptual knowledge maps of the control and treatment teachers in the 6th grade are not
statistically different at the pretest.
Table 7
Independent Samples T-Test of Conceptual Knowledge Maps Before Professional Development for 6th Grade Teachers
Group N M SD df T P
Treatment 47 0.66 1.128 75 0.653 0.516
Control 30 0.50 0.900 75 0.653 0.516

13
As revealed in Table 8, after the first year of professional development (approximately
nine hours), the 6th grade teachers in the treatment group were significantly different from
their peers in the 6th grade control group (based on a second independent samples t-test).
Table 8
Independent Samples T-Test of Conceptual Knowledge Maps Pre Test and Post After Year 1for 6th Grade Teachers
Group N M SD df T p
Treatment 40 0.88 1.017 64 1.940 0.057*
Control 26 0.42 0.758 64 1.940 0.057
*p < .1
At pretest, the control and treatment teachers also showed marginally significant
differences in their ability to attach given problems to the concepts they thought were
required to solve those problems. This is presented in Table 9:
Table 9
Independent Samples T-Test of Problem–Concept Links at Pre Test for 6th Grade Teachers
Group N M SD df t p
Treatment 47 4.91 3.781 75 1.705 0.092*
Control 30 3.60 2.343 75 1.705 0.092*
*p < .1
After a year of professional development, however, the teachers’ means were no longer
significantly different from one another. Table 10 shows that it seems as though the ability of
both groups of teachers, to link specific problems and concepts, may have decreased after
their first year of professional development; though, this decrease in the treatment group was
larger than the decrease noted in the control group.
Table 10
Independent Samples T-Test of Problem–Concept Links After Year 1 for 6th Grade Teachers
Group N M SD df t p
Treatment 35 4.14 2.614 57 0.97 0.368
Control 24 3.46 3.162 57 0.97 0.368
14
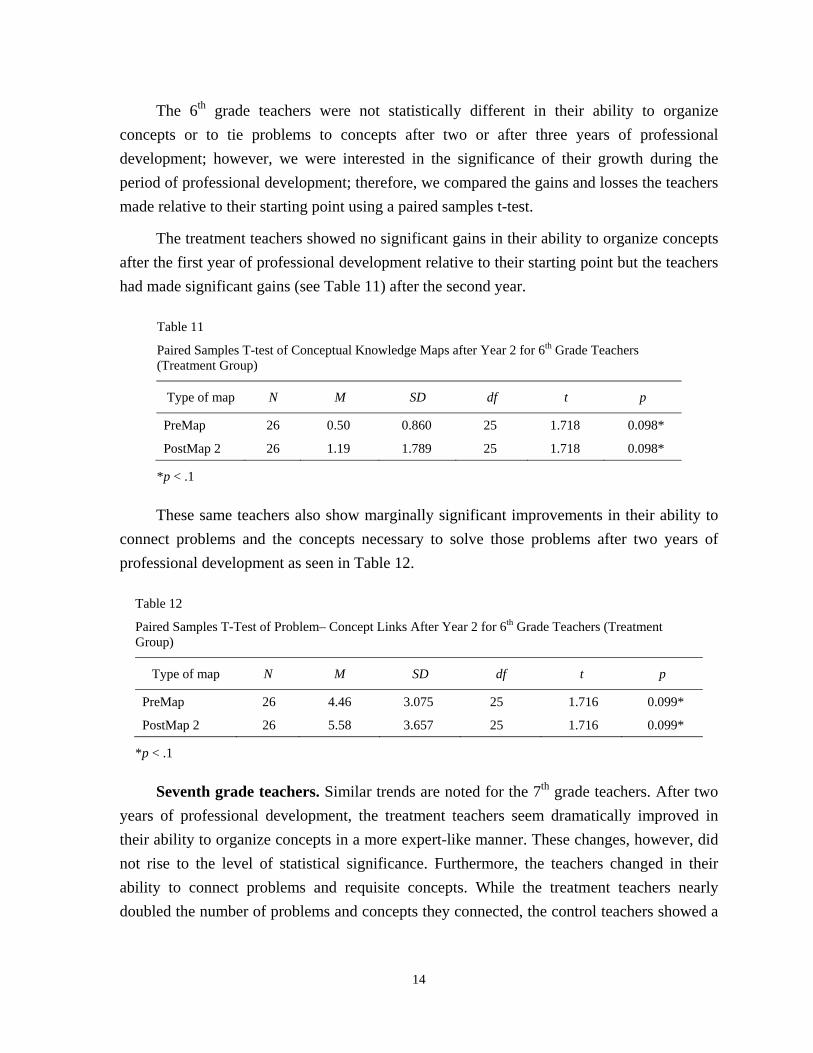
The 6th grade teachers were not statistically different in their ability to organize
concepts or to tie problems to concepts after two or after three years of professional
development; however, we were interested in the significance of their growth during the
period of professional development; therefore, we compared the gains and losses the teachers
made relative to their starting point using a paired samples t-test.
The treatment teachers showed no significant gains in their ability to organize concepts
after the first year of professional development relative to their starting point but the teachers
had made significant gains (see Table 11) after the second year.
Table 11
Paired Samples T-test of Conceptual Knowledge Maps after Year 2 for 6th Grade Teachers (Treatment Group)
Type of map N M SD df t p
PreMap 26 0.50 0.860 25 1.718 0.098*
PostMap 2 26 1.19 1.789 25 1.718 0.098*
*p < .1
These same teachers also show marginally significant improvements in their ability to
connect problems and the concepts necessary to solve those problems after two years of
professional development as seen in Table 12.
Table 12
Paired Samples T-Test of Problem– Concept Links After Year 2 for 6th Grade Teachers (Treatment Group)
Type of map N M SD df t p
PreMap 26 4.46 3.075 25 1.716 0.099*
PostMap 2 26 5.58 3.657 25 1.716 0.099*
*p < .1
Seventh grade teachers. Similar trends are noted for the 7th grade teachers. After two
years of professional development, the treatment teachers seem dramatically improved in
their ability to organize concepts in a more expert-like manner. These changes, however, did
not rise to the level of statistical significance. Furthermore, the teachers changed in their
ability to connect problems and requisite concepts. While the treatment teachers nearly
doubled the number of problems and concepts they connected, the control teachers showed a

15
significant decrease in their ability to make such connections. The change in the treatment
teachers does not meet statistical significance. This is presented in Table 13:
Table 13
Paired Samples T-Test of Conceptual Knowledge Maps After Year 2 for 7th Grade Teachers
Type of map N M SD df t p
Pre Map
Treatment 6 4.17 2.483 5 1.221 0.277
PostMap 2
Treatment 6 8.17 7.139 5 1.221 0.277
Pre Map
Control 12 7.83 5.306 11 -1.993 0.072*
PostMap 2
Control 12 4.33 4.376 11 -1.993 0.072*
*p < .1
Eighth grade teachers. Like teachers in the lower two grades, the 8th grade teachers
did not show significant changes in their ability to organize data after the first year. Table 14
reveals that unlike their counterparts in the lower grades, the 8th grade teachers in the
treatment group show a significant decrease in their ability to connect problems to concepts
after one year of professional development.
Table 14
Paired Samples T-Test of Problem–Concept Links After Year 1 for 8th Grade Teachers (Treatment Group)
Type of map N M SD df t p
PreMap 9 6.89 6.194 8 -2.388 0.044**
PostMap 1 9 3.00 3.808 8 -2.388 0.044**
**p < .05
As before, we also conducted grade level ANCOVA analyses on each of the groups between
each of the years in order to account for group differences in the knowledge maps prior to
professional development. As expected, after one year of professional development, 6th grade
teachers in the treatment group perform marginally significantly better in their ability to
organize concepts compared to 6th grade teachers in the control group, when controlling for
their ability prior to professional development. These effects are shown in Table 15:
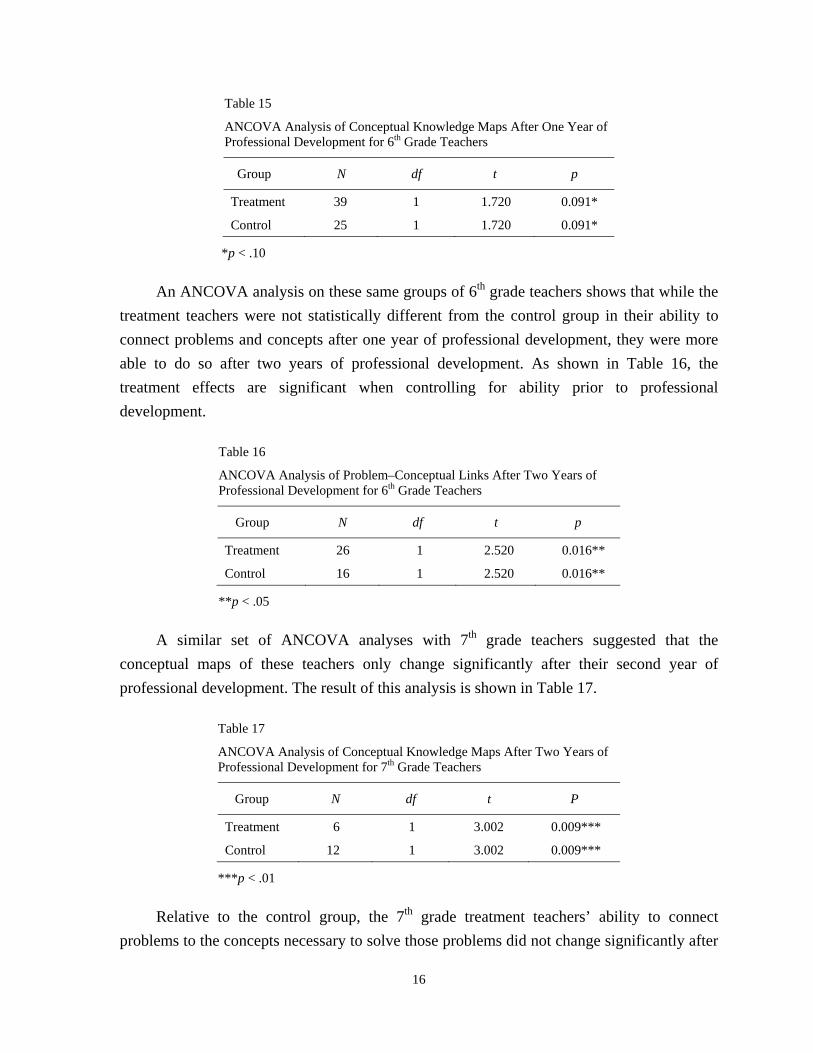
16
Table 15
ANCOVA Analysis of Conceptual Knowledge Maps After One Year of Professional Development for 6th Grade Teachers
Group N df t p
Treatment 39 1 1.720 0.091*
Control 25 1 1.720 0.091*
*p < .10
An ANCOVA analysis on these same groups of 6th grade teachers shows that while the
treatment teachers were not statistically different from the control group in their ability to
connect problems and concepts after one year of professional development, they were more
able to do so after two years of professional development. As shown in Table 16, the
treatment effects are significant when controlling for ability prior to professional
development.
Table 16
ANCOVA Analysis of Problem–Conceptual Links After Two Years of Professional Development for 6th Grade Teachers
Group N df t p
Treatment 26 1 2.520 0.016**
Control 16 1 2.520 0.016**
**p < .05
A similar set of ANCOVA analyses with 7th grade teachers suggested that the
conceptual maps of these teachers only change significantly after their second year of
professional development. The result of this analysis is shown in Table 17.
Table 17
ANCOVA Analysis of Conceptual Knowledge Maps After Two Years of Professional Development for 7th Grade Teachers
Group N df t P
Treatment 6 1 3.002 0.009***
Control 12 1 3.002 0.009***
***p < .01
Relative to the control group, the 7th grade treatment teachers’ ability to connect
problems to the concepts necessary to solve those problems did not change significantly after

17
one or after two years of professional development once ability prior to professional
development was controlled. Similarly, relative to the control, neither the 8th grade treatment
teachers’ ability to organize concepts nor their ability to connect problems to the concepts
necessary to solve those problems changed significantly over one year of professional
development after controlling for initial ability.
Teacher experience and credentials. To place these findings in context, we analyzed
the math teaching experience of the teachers in the 6th and 7th grades. In addition, we
analyzed the scope of the credential possessed by the teachers in each group. In particular,
we wondered whether the 6th grade treatment teachers had less teaching experience and were
more likely to hold multi-subject credentials compared to their peers in the 7th grade
treatment group.
Contrary to our expectations, comparing all 6th grade teachers in the study to all 7th
grade teachers in the study, we found that the 6th grade teachers had significantly more
experience teaching math in general (t = 3.787, df = 177.957, p < .001), and in middle school
in particular (t = 2.967, df = 176.102, p = .003). The 6th grade teachers were also significantly
more likely to have single subject credentials (t = 2.743, df = 180.849, p = .007).
Based on the significant findings reported above, we also compared the 6th and 7th
grade treatment teachers who had complete first year data sets in order to identify significant
differences in the experience and credentials of this more restrictive sample. The only
significant difference between these 6th and 7th grade teachers was that, once again, the 6th
grade teachers had significantly more experience teaching math than their 7th grade
counterparts (t = 2.152, df = 54, p = 0.036). Although 6th grade teachers also had more
experience teaching middle school math, and were also more likely to have a single subject
credential in math, these differences were no longer significant.
Conclusions
Our results suggest that professional development, which focuses on organizing
conceptual understanding around key foundational ideas, does seem to produce more
“expert-like” conceptualizations of a domain in the minds of teachers. We saw this change
both in the way teachers organize their content knowledge and how they connect problems
with the concepts necessary to solve these problems. These changes, however, are not always
apparent at first blush and the abilities to accomplish each of the two tasks seem to develop at
different rates. We suspect that this is a function of both the grade level of the teachers and
the type of professional development the teachers received during a specific year.
18
Overall, while the treatment teachers in 6th and 7th grades do seem to make significant
gains in their ability to organize concepts relative to their starting point prior to professional
development, we saw no significant gains in the treatment teachers’ ability, as a whole, to
organize concepts in more expert-like ways after one or two years of professional
development (when we consider their starting point relative to the control group but do not
consider grade). While we do see significant changes in the ability of the treatment teachers,
relative to the control group, to connect problems and concepts, these changes actually
represent decreases in this ability relative to the teachers’ starting point prior to professional
development. In fact, our analysis suggests that both the treatment and control groups are less
able to perform this task after two years, if grade is not considered.
The outcomes are very different when we separate the groups by grade level taught;
this becomes very important considering the teachers in various grades were exposed to
different amounts of professional development by design. The 6th grade teachers in the
treatment group seemed to make significant gains the most quickly on organizing
mathematical concepts. After one year of professional development, the 6th grade treatment
teachers were better able to organize concepts than were their peers in the control group after
pre-professional development ability was controlled for. After two years of professional
development, these teachers were also more able to connect problems with the concepts
necessary to solve those problems, relative to the control and after ability prior to
professional development were controlled for. Since professional development first focused
on foundational concepts, student misconceptions, and formative assessments, it seems
entirely logical that the teachers’ conceptual organization would change. Moreover, given
that the teachers’ second year of professional development focused more on using
foundational concepts, student misconceptions, and assessment data to design instruction,
increases in the teachers’ ability to connect concepts with problems of the type useful for
instruction seems well aligned with our findings.
The 7th grade findings were less aligned with our expectations. As with the 6th grade
teachers, after their first year of professional development, we expected 7th grade teachers to
make significant gains in their ability to organize concepts in more expert-like ways. We also
expected these teachers to be more adept in their ability to connect concepts and problems
after the second year of professional development. Like the 6th grade teachers, the 7th grade
treatment teachers did make significant gains in their ability to organize concepts relative to
their peers in the control group. Unlike the 6th grade teachers, however, these gains were only
evident after two years of professional development.

19
The differences between the 6th and 7th grade outcomes were somewhat surprising in
that both groups received professional development designed to address conceptual
organization in the first year of the study. Here, the experience of the subjects in this study is
enlightening. In the treatment groups, the 6th grade teachers had significantly more
experience teaching mathematics than their 7th grade counterparts. While we might have
suspected that experience would make teachers reticent to change, it seems that more
experience is associated with an ability to conceptually reorganize one’s thinking about a
topic more quickly. Although the 7th grade teachers eventually did reorganize their
conceptual maps, it took these teachers two years of both thinking about key conceptual
concepts and designing instruction around these concepts, student misconceptions and
analyzing student work to do so. This same trend seems evident in the 8th grade teachers, a
group more similar to the 7th grade teachers in terms of credentials and experience teaching
math. However, since the 8th grade teachers only had a single year of professional
development, these similarities cannot be confirmed.
Unlike recent studies of the effectiveness of mathematics professional development
(e.g. Randel, Beesley, Apthorp, Clark, Wang, Cicchinelli, & Williams (2011) which found no
significant gains in student achievement, the POWERSOURCE© project associated with the
professional development reported here did find significant gains from students’ pretests to
students’ posttests (Phelan, Choi, and Vendlinski, 2011). Our findings suggest that these
gains in student achievement are associated with the changes in teacher thinking. This
association is important because it seems as teachers change the way they think about
organizing a domain of knowledge, they may be better able to effect changes in student
learning. Specifically, our findings suggest that student achievement is positively correlated
with the way teachers organize their thinking around key conceptual ideas and use materials
that are also organized in that same way. We are currently investigating this link between
teacher change and student achievement.
While Guskey (2002) notes that “change is a gradual and difficult process for teachers”
(p. 386), our research suggests that changing teachers’ conceptual organization is possible,
and such change may be easier for more experienced math teachers in earlier rather than later
middle school grades.


21
References
Ai, X. (2002). District mathematics plan evaluation: 2001-2002 Evaluation report. Los Angeles, CA: Los Angeles Unified School District.
American Educational Research Association. (2006). Do the math: Cognitive demand makes a difference. Retrieved from http://www.aera.net/uploadedFiles/Journals_and_Publications/Research_Points/RP_Fall06.pdf
Ball, D. L. (2003). Mathematical proficiency for all students. Santa Monica, CA: RAND.
Ball, D. L., Lubienshi, S. T., & Mewborn, D. S. (2001). Research on teaching mathematics: The unsolved problem of teachers’ mathematical knowledge. In V. Richardson (Ed.), Handbook of Research on Teaching (4th ed., pp. 433-456). Washington, D.C.: The American Educational Research Association.
Berkner, L., & Chavez, L. (1997). Access to postsecondary education for the 1992 high school graduates (NCES 98-105). Retrieved from http://nces.ed.gov/pubsearch/pubsinfo.asp?pubid=98105
Black, P., Harrison, C., Lee, C., Marshall, B., & Wiliam, D. (2003). Assessment for learning: Putting it into practice. Buckingham, UK: Open University Press.
Black, P., & Wiliam, D. (2004). The formative purpose: assessment must first promote learning. In M. Wilson (Ed.), Towards coherence between classroom assessment and accountability, 2 (pp. 20-50). Chicago, IL: University of Chicago Press.
Black, P., & William, D. (1998). Inside the black box: Raising standards through classroom assessment. Phi Delta Kappan, 80(2), 139-148.
Bowie, L. (2009, February). State edges past New York. The Baltimore Sun. Retrieved from http://www.baltimoresun.com/news/education/k12/bal-te.md.ap05feb05,0,4601402.story
Carpenter, T. P., Fennema, E. E., Levi, L., Franke, M. L., & Empson, S. B. (2000). Children's mathematics: Cognitively guided instruction: A guide for workshop leaders. Washington, DC: The National Council of Teachers of Mathematics, Inc.
Chi, M. T. H., Bassok, M., Lewis, M. W., Reimann, P., & Glaser, R. (1989). Self-explanation: How students study and use examples in learning to solve problems. Cognitive Science, 13, 145-182.
Chi, M. T. H., & Roscoe, R. D. (2002). The processes and challenges of conceptual change. In M. Limon & L. Mason (Eds.), Reconsidering conceptual change: Issues in theory and practice (pp. 3-27). Netherlands: Kluwer Academic Publishers.
Chi, M. T. H., & Slotta, J. D. (1993). The ontological coherence of intuitive physics. Cognition and Instruction, 10, 249-260.
Choi, K. C., Phelan, J., Niemi, D. N., & Vendlinski, T. P. (2009). The effects of POWERSOURCE © on student performance. Los Angeles: UCLA / CRESST.
22
Chung, G. K. W. K., Baker, E. L., Brill, D. G., Sinha, R., Saadat, F., & Bewley, W. L. (2006). Automated assessment of domain knowledge with online knowledge mapping (CRESST Tech. Rep. No. 692). Los Angeles: University of California, National Center for Research on Evaluation, Standards, and Student Testing (CRESST).
Darling-Hammond, L. (2000). Teacher quality and student achievement: A review of state policy evidence. Education Policy Analysis Archives, 8(1), 1-44.
deGroot, A. D. (1965). Thought and choice in chess. The Hague, Netherlands: Mouton and Co. Publishers.
Desimone, L. M., & Ueno, K. (2006). Are teachers who need sustained, content-focused professional development getting it? Educational Administration Quarterly, 42(2), 179 -215.
Donovan, M. S., & Bransford, J. D. (Eds.). (2005). How students learn: History, mathematics, and science in the classroom. Washington, D.C.: The National Academy Press.
Fishman, B. J., Besta, S., & Talb, R. T. (2003). Linking teacher and student learning to improve professional development in systemic reform. Teaching and Teacher Education, 19, 643-658.
Fuson, K. C., Kalchman, M., & Bransford, J. D. (2005). Mathematical Understanding: An introduction. In M. S. Donovan & J. D. Bransford (Eds.), How students learn: History, mathematics, and science in the classroom. Washington, D.C.: The National Academy Press.
Garet, M. S., Desimone, L., Birman, B. F., & Yoon, K. S. (2001). What makes professional development effective? American Educational Research Journal, 38(4), 915-945.
Guskey, T. R. (2002). Professional development and teacher change. Teachers and Teaching: Theory and Practice, 8(3/4), 381-391.
Hanushek, E. A. (2002). Teacher quality. In L. T. Izumi & W. M. Evers (Eds.), Teacher Quality (pp. 1-12): Hoover Institution Press.
Helfand, D. (2006, January 30). A formula for failure in LA schools. Los Angeles Times, pp. A1, A14-15.
Heritage, M., Kim, J., Vendlinski, T. & Herman, J.L. (2009). From evidence to action: A seamless process in formative assessment? Educational Measurement: Issues and Practice, 28(3), 24-31.
Heritage, M., & Vendlinski, T. (2006). Measuring teachers' mathematical knowledge(CRESST Tech. Rep. No. 696). Los Angeles: University of California, National Center for Research on Evaluation, Standards and Student Testing (CRESST).
Herman, R., Dawson, P., Dee, T., Greene, J., Maynard, R., Redding, S., et al. (2008). Turning around chronically low-performing schools: A practice guide (No. NCEE#2008-4020). Washington, DC: Institute of Education Sciences, U.S. Department of Education.

23
Hill, H. C., & Ball, D. L. (2004). Learning mathematics for teaching: Results from California's mathematics professional development institutes. Journal for Research in Mathematics Education, 35(5), 330-351.
Ingvarson, L., & Beavis, A. (2005). Factors affecting the impact of professional development programs on teachers' knowledge, practice, student outcomes and efficacy. Education Policy Analysis Archives, 13(10), 1-28.
Jacobson, L. (2008). California board mandates Algebra 1 for all 8th graders: Governor lauds change, but state schools chief sees resources lacking. Retrieved from http://www.edweek.org/login.html?source=http://www.edweek.org/ew/articles/2008/07/16/43algebra.h27.html&destination=http://www.edweek.org/ew/articles/2008/07/16/43algebra.h27.html&levelId=2100
Kester, L., Kirschner, P. A., & vanMerriënboer, J. G. (2005). Timing of information presentation in learning statistics. Instructional Science, 32, 233-252.
Kieran, C. (2003). The learning and teaching of school algebra. In D. A. Grouws (Ed.), Handbook on Research on Mathematics Teaching and Learning (pp. 390 - 419). Reston, VA: National Council of Teachers of Mathematics.
Kilpatrick, J., Swafford, J., & Findell, B. (Eds.). (2001). Adding + it up: Helping children learn mathematics. Washington, D.C.: National Academy Press.
Kollars, D. (2008, May 12). Despite high school algebra focus, more students need remedial college math. Sacramento Bee, pp. A1.
Kushman, J., Hanita, M., and Raphael, J. (2011). An experimental study of the project CRISS reading program on grade 9 reading achievement in rural high schools. (NCEE 2010-4007). Washington, DC: National Center for Education Evaluation and Regional Assistance, Institute of Education Sciences, U.S. Department of Education.
Leinhardt, G., & Greeno, J. G. (1984). The cognitive skill of mathematics teaching. Journal of Educational Psychology, 78(2), 75-95.
Leinhardt, G., & Smith, D. A. (1985). Expertise in mathematics instruction: Subject matter knowledge. Journal of Educational Psychology, 77(3), 247-271.
Ma, L. (1999). Knowing and teaching elementary mathematics. Mahwah, NJ: Earlbaum.
Marzano, R. J. (2006). Classroom assessment and grading that work. Alexandria, VA: Association for Supervision and Curriculum Development.
Meehan, K., & Huntsman, H. (2004). Pathways through algebra project: Improving student success rates in elementary algebra. Retrieved from http://72.14.205.104/search?q=cache:z55AbRizN_AJ:www.ijournal.us/issue_09/ij_issue09_09_MeehanAndHuntsman_01.html+%22algebra%22+%26+success&hl=en&ct=clnk&cd=11&gl=us
Nathan, M., Koedinger, K., & Martha, W. (2001, April). The expert blindspot: When content knowledge and pedagogical content knowledge collide. Paper presented at the annual American Educational Research Association conference, Seattle, WA.

24
National Mathematics Advisory Panel. (2008). Foundations for success: The final report of the National Mathematics Advisory Panel. Washington, DC: U.S. Department of Education.
Niemi, D., Vallone, J., & Vendlinski, T. (2006). The power of big ideas in mathematics education: Development and pilot testing of POWERSOURCE assessments (CRESST Tech. Rep. No. 697). Los Angeles: University of California, National Center for Research on Evaluation, Standards, and Student Testing (CRESST).
Novak, J. D., Mintzes, J. J., & Wandersee, J. H. (2000). Learning, teaching, and assessment: A human constructivist perspective. In J. J. Mintzes, J. H. Wandersee & J. D. Novak (Eds.), Assessing science understanding (pp. 1-13). New York, NY: Academic Press.
Phelan, J. A., Choi, K., & Vendlinski, T. P. (2011, April). The effects of a formative assessment intervention on student understanding of basic mathematics principles. Poster presented at the annual American Educational Research Association conference, New Orleans, LA.
Phelan, J. A., Kang, T., Niemi, D. N., Vendlinski, T. P., & Choi, K. (2009). Some aspects of the technical quality of formative assessments in middle school mathematics. (CRESST Report 750). Los Angeles: University of California, National Center for Research on Evaluation, Standards, and Student Testing (CRESST).
Randel, B., Beesley, A. D., Apthorp, H., Clark, T.F., Wang, X., Cicchinelli, L. F., & Williams, J. M. (2011). Classroom assessment for student learning: The impact on elementary school mathematics in the Central Region. (NCEE 2011-4005). Washington, DC: National Center for Education Evaluation and Regional Assistance, Institute of Education Sciences, U.S. Department of Education.
Rech, J., & Harrington, J. (2000). Algebra as a gatekeeper: A descriptive study at an urban university. Journal of African American Studies, 4(4), 63-71.
Rittle-Johnson, B., & Alibali, M. W. (1999). Conceptual and procedural knowledge of mathematics: Does one lead to the other?. Journal of Educational Psychology, 91(1), 175-189.
Rockoff, J. E. (2004). The impact of individual teachers on student achievement: Evidence from panel data. AEA Papers and Proceedings, 94(2), 247-252.
Rubin, J. (2007, July 11). Locke High's weary teachers face a hard multiple-choice test. Los Angeles Times. Retrieved from http://articles.latimes.com/2007/jul/11/local/me-lockehigh11
Saxe, G. B., Gearhart, M., & Seltzer, M. (1999). Relations between classroom practices and student learning in the domain of fractions. Cognition and Instruction, 17, 1 - 24.
Seago, N. (2004). Using video as an object of inquiry for mathematics teaching and learning. In Using video in teacher education: Advances in research on teaching, 10, (pp. 259 - 286). Orlando, FL: Elsevier.
Shulman, L. S. (1986). Those who understand: Knowledge growth in teaching. Educational Researcher, 15, 4-14.
25
Siegler, R. S. (2003). Implications of cognitive science research for mathematics education. In J. Kilpatrick, W. B. Martin & D. E. Schifter (Eds.), A research companion to principles and standards for school mathematics (pp. 219 - 233). Reston, VA: National Council of Teachers of Mathematics.
Silver, D., Saunders, M., & Zarate, E. (2008). What factors predict high school graduation in the Los Angeles Unified School district? Santa Barbara, CA: UC Santa Barbara.
Sparks, D. H. (2000). A national plan for improving professional development. Oxford, OH: National Staff Development Council.
Sternberg, R. J., Forsythe, G. B., Hedlund, J., Horvath, J. A., Wagner, R. K., Williams, W. M., et al. (2000). Practical intelligence in everyday life. New York, NY: Cambridge University Press.
Stigler, J. W., & Hiebert, J. (1999). The teaching gap: Best ideas from the world's teachers for improving education in the classroom. New York, NY: Free Press.
Sturino, G. (2002). Teaching and textbooks: The case of grade 9 mathematics. Retrieved from http://www.oise.utoronto.ca/field-centres/TVC/RossReports/vol7no2.htm
Szydlik, J. E., Szydlik, S. D., & Benson, S. R. (2003). Exploring changes in pre-service elementary teachers’ mathematical beliefs. Journal of Mathematics Teacher Education, 6(3), 253-279.
Tittle, C. K. (2006). Assessment of teacher learning and development. In P. Alexander & P. Winne (Eds.), Handbook of Educational Psychology (pp. 953-980). Mahwah, N.J.: Lawrence Erlbaum Associates.
VanLehn, K., Siler, S., Murray, C., Yamauchi, T., & Baggett, W. (2003). Why do only some events cause learning during human tutoring? Cognition and Instruction, 21(3), 209-249.
Vendlinski, T. P. (2009, April). The importance of intention and order: teaching for conceptual understanding using handheld technology. Paper presented at the annual American Educational Research Association conference, San Diego, CA.
Vendlinski, T.P., Hemberg, B.C., Mundy, C., Baker, E.L., Herman, J.L. Phelan, J., et. al. (2009). Designing professional development around key principles and formative assessments to improve teachers’ knowledge to teach mathematics. Meeting of the Society for Research on Educational Effectiveness. Crystal City, VA.
Wiliam, D. (2006). Does assessment hinder learning? Retrieved from http://www.uk.etseurope.org/home-corpo-uk/news-home/?print=1&news=136&view= detail&no_cache=1
Wiliam, D., & Thompson, M. (2007). Integrating assessment with instruction: What will it take to make it work? In C. A. Dwyer (Ed.), The future of assessment: Shaping teaching and learning. Mahwah, N.J.: Lawrence Erlbaum Associates.
Zevenbergen, R. (2005). Primary preservice teachers’ understandings of volume: The impact of course and practicum experiences. Mathematics Education Research Journal, 17(1), 3-23.


27
Appendix


29
Knowledge Mapping Task
Part 1: Concept Map
Create concept map about mathematics.
Connect the concept labels (labels with concepts in black rectangles) to each other with the link labels (labels with black arrows and linking terms).
The link label indicates how the concepts are related, and the arrow indicates the direction the thought is read.
For example:
Here, “Plants” and “Oxygen” are the concepts and “produce” is the link. The thought is read as
Plants --> produce--> Oxygen.
If you run out of the preprinted link labels, use a blank arrow label and write in a link label using only the list provided.
Please limit yourself to 15 minutes of work on Part 1
Part 2: Problem Map
Connect mathematics problems to the concepts in the knowledge map based on what concepts are relevant to solve the problem correctly.
Use the blue arrow labels to connect the problems (labels with blue borders) to the concepts and rate the relevancy of the connections by writing either a 1 or a 2 in the blue box, using the following scale:
1 = necessary, but not sufficient (you need to know this concept, but it is not enough to solve the problem correctly)
2 = necessary and sufficient (if you know this concept, you can solve the problem correctly)
oxygen plants produce
sample concept map

30
Please limit yourself to 15 minutes of work on Part 2
Knowledge Mapping Task Concepts and Links for Part 1
For your reference, here are the concepts and links to be used when creating your mathematics concept map.
Concepts Links Additive Identity applies to Additive Inverse can represent Additive Property of Equality is a Arithmetic Operations Obeys Comparing Values property of Distributive Property Shows Equation type of Equivalence used to Evaluation Uses Expression Factoring Fractions Multiplicative Identity Multiplicative Inverse Multiplicative Property of Equality Number Order of Operations Problem Solving Properties of Arithmetic/Algebra Proportions Rational Numbers Ratios Simplifying Transformations

31
Problems Associated with the Knowledge Mapping Task
Solve for the unknown.
28)4(35 xx
40
The perimeter of a square is equal to 4s where s is the length of one side. Find the perimeter of the square with a side = 7 ft.
544
Add the following fractions:
2
4
3
2 521
Solve for the unknown.
401715 c
2
Find the length of a side of the triangle if the perimeter is equal to 40, and the other two sides are:
a = 15 b = 17
402
Evaluate the expression when y = 2:
3y
5
Solve for the unknown.
1652 xx
901
The two triangles are similar. What is the length of side AB?
Evaluate the expression x 3 when x = 5.
140
Solve for the unknown.
34 b
91
The perimeter of the triangle is equal to the sum of the lengths of its sides: a + b + c Find the perimeter of the triangle if the sides are: a = 8 b = 15 c = 17 22
Evaluate the expression when x = 4:
3)4( x
90
Solve for the unknown.
5 x 2 19
512
Write the fraction as a decimal: 3
8
20
Evaluate the expression when y = 2:
8y
50
Solve for the unknown.
713 x
4
Determine which fraction is larger:
1
5 or
1
3 300
Solve for the unknown.
33
4x 6
904
Find the volume of a cube with a side = 4.
242
Solve for the unknown.
1
5
15
411
Evaluate:
2)( xxf
2x 53
1

![Conceptual Design of Future Undersea Unmanned Vehicle (UUV ... · the state-of-the-art technology developments [9], it is possible to perceive conceptual design ideas for future MCM](https://static.fdocuments.in/doc/165x107/5f39764c53e8c863294073e7/conceptual-design-of-future-undersea-unmanned-vehicle-uuv-the-state-of-the-art.jpg)