Using Investment & Lease Analysis To Sell or Lease · PDF file · 2016-09-20Using...
12
National Association of REALTORS ® 2009 REALTORS ® Conference and Expo San Diego, California Using Investment & Lease Analysis To Sell or Lease Properties Neil Osborne Sunday, November 15 9:00am-10:15am
Transcript of Using Investment & Lease Analysis To Sell or Lease · PDF file · 2016-09-20Using...

National Association of REALTORS®
2009 REALTORS® Conference and ExpoSan Diego, California
Using Investment & Lease Analysis To Sell or Lease
PropertiesNeil Osborne
Sunday, November 15 9:00am-10:15am

1
How to use Investment Analysis Techniques to Sell or Lease properties during these challenging times
Neil Osborne Investit Software Inc. 604-988-9964 www.investitpro.com
To obtain a more extensive handout and other educational materials visit www.investitsoftware.com
Cap Rate Review
Cap Rate = Net Operating Income x 100Sale Price
Assumptions: 1. Property is never sold. Why would you buy at a 4.50% Cap rate and borrow at 6.50%
2. The Net Operating is constant and goes on forever
Year 1 $120,000 Year 2 $120,000 Year 3 $120,000 forever
Market Value = Net Operating Income = $120,000 = $1,500,000 Cap Rate 8%
The Sale Price is very sensitive to the Cap Rate and Rent
A small change in the “Cap Rate” or “Rent” creates a large change in value.
If the Cap Rate goes from 8% to 9% the value of the property drops by 1/8 or 12.5%.
Rent Example: 50 Unit building, rent increase $50 per Unit per Mo. Cap Rate 8.50%
Increase in value = 50 Units x $50 x 12 = $352,941 8.50%
Issues with using Cap Rates to determine the Property Values
The “Cap Rate” is just the tip of the iceberg
Example: The impact of “urgent major repairs” on the Sale Price and the Cap Rate
Sale Price: $3,200,000Net Operating Income: $275,000 per year
“Apparent Cap Rate” = $275,000 x100 = 8.59% $3,200,000
BUT… the buyer deducted $425,000 because the roof had to be replaced, the elevator has to be upgraded and to satisfy a City work order to upgrade to current fire standards
Sale Price based on a “Normal” building = $3,200,000 + $425,000 = $3,625,000
“True Cap Rate” = $275,000 x100 = 7.59% versus an “Apparent Cap Rate” of 8.59% which is a 12% difference $3,625,000

2
Impact of the timing of the lease renewals on cash flows on the value of the property
In conclusion, using a Cap Rate to determine the value of an income property is a very simple approach fraught with difficulties.
A more realistic approach is long term investment analysis or “Discounted Cash Flow” analysis which projects the cash flow over time and takes into account the “Time Vale of Money”
Introduction to Real Estate Investment Analysis and Discounted Cash Flow Analysis.
You have a choice to invest in property A and B. Each property will generate the following annual cash flows. Which one would provide you with the best overall financial return?
Year Property A Property B0 $<1,000,000> <$1,200,000>1. 81,000 58,000 2. 83,000 60,0003. 84,000 61,0004. 87,000 67,0005. 87,000 68,0006. 89,000 69,0007. <10,000> 70,0008. 90,000 112,0009. 92,000 115,00010. 93,000 117,00011. 96,000 119,00012 1,950,000 2,500,000
Internal Rate of Return (IRR) 11.62% 10.88%
The Internal Rate of Return is the Annual Compounding Return on Investment. Why is it called the Internal Rate of Return (IRR)?Because of the reinvestment assumptions. Excess funs are reinvested at the IRR rate. Losses are borrowed at the IRR rate
”Think Compound Interest
An Investor has $300,000 to invest. They can;
a) invest $300,000 in a building and achieve an Internal Rate of Return (IRR) of 9.00% or;
b) loan $300,000 as a second mortgage at an Interest Rate of 9.00%
From a financial perspective the financial returns are the same. When evaluating alternate investments always balance “Risk” and “Reward”
Always balance the financial return against the risk Which is more risky?
1. Buying a building with a down payment of $300,000 2. Loan $300,000 as second mortgage
3
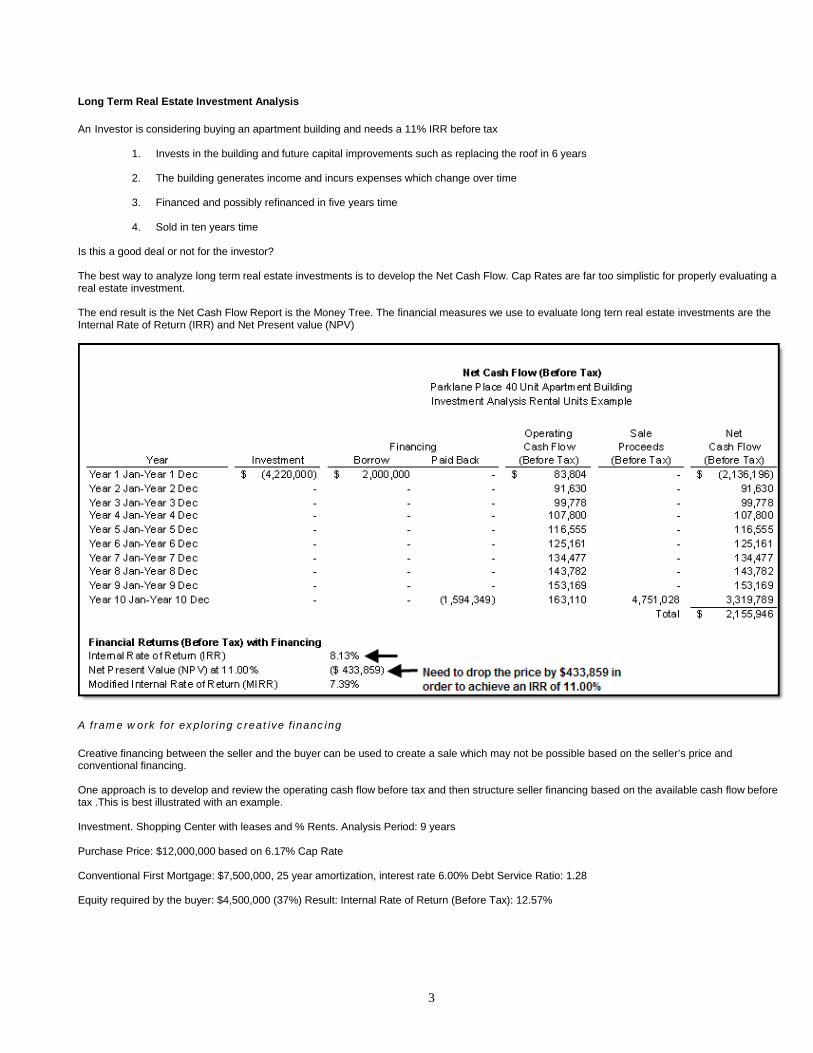
Long Term Real Estate Investment Analysis
An Investor is considering buying an apartment building and needs a 11% IRR before tax
1. Invests in the building and future capital improvements such as replacing the roof in 6 years
2. The building generates income and incurs expenses which change over time
3. Financed and possibly refinanced in five years time
4. Sold in ten years time
Is this a good deal or not for the investor?
The best way to analyze long term real estate investments is to develop the Net Cash Flow. Cap Rates are far too simplistic for properly evaluating a real estate investment.
The end result is the Net Cash Flow Report is the Money Tree. The financial measures we use to evaluate long tern real estate investments are the Internal Rate of Return (IRR) and Net Present value (NPV)
A frame work for exploring creative financing
Creative financing between the seller and the buyer can be used to create a sale which may not be possible based on the seller’s price and conventional financing.
One approach is to develop and review the operating cash flow before tax and then structure seller financing based on the available cash flow before tax .This is best illustrated with an example.
Investment. Shopping Center with leases and % Rents. Analysis Period: 9 years
Purchase Price: $12,000,000 based on 6.17% Cap Rate
Conventional First Mortgage: $7,500,000, 25 year amortization, interest rate 6.00% Debt Service Ratio: 1.28
Equity required by the buyer: $4,500,000 (37%) Result: Internal Rate of Return (Before Tax): 12.57%

4
Exploring Creative Financing with the seller based on the operating cash flow before tax
1. Change the term of the first mortgage from 10 years to 5 years i.e., pay off the first mortgage at the end of 5 years
2. Create seller financing as follows;$1,480,000 second mortgage Interest Rate: 9.00% Term: 5 yearsFixed payment;
Year 1 $6,000 per mo Year 2 $9,000 per mo Year 3 $11,000 per month Year 4 $13,000 per mo Year 5 $15,000
3. Year 6 January. Refinance with a conventional first mortgage $10,000,000 Interest Rate: 6.50% 25 year amortization DSR: 1.25Use the refinancing to pay off; First Mortgage
Investor pockets $143,600 Mortgage $6,744,906Seller Financing $3,111,49
Result using creative financing; Investor’s equity changes from $4,500,000 (37.50%) to $2,000,000 (25.00%)The Investor’s Internal Rate of Return (IRR) changes from 12.57% to 16.75% before tax a 33% increase
Cash Flow after the creative financing
Cash flow before the creative financing

5
Lease Comparison Analysis
When comparing leases you calculate the total costs each year and then use a Discount Rate to calculate the Net Present Value (NPV) and the Net Effective Rent
Note: You cannot calculate the Internal Rate of Return (IRR) because there is no investment.
Example:A tenant is considering two different spaces and has established the following annual costs taking in to account the base rent, additional rent, free rent and parking costs.Which is the best proposal from a financial perspective? Using a 10.00% Discount Rate
Net Effective Rent = Net Present Value No. of Years x Area
Year Space A Space B
4,000 Sq Ft 4,000 Sq Ft
1 $120,000 $115,000
2 130,000 122,000
3 142,000 131,000
4 145,000 135,000
5 148,000 140,000
6 150,000 172,000
7 152,000 176,000
8 154,000 178,000
9 157,000 182,000
10 163,000 185,000
NPV at 10% $878,089 $901,884
Net Effective Rent at 10%
$878,089
10 yrs x 4,000 Sq Ft
$21.95 per Sq Ft per Yr$1.83 per Sq Ft per Mo
$901,884
10 yrs x 4,000 Sq Ft
$22.55 per Sq Ft per Yr$1.88 per Sq Ft per Mo
From a Tenant’s perspective Space A has the lowest Net Present Value (NPV) and is the best deal from a financial perspective
6
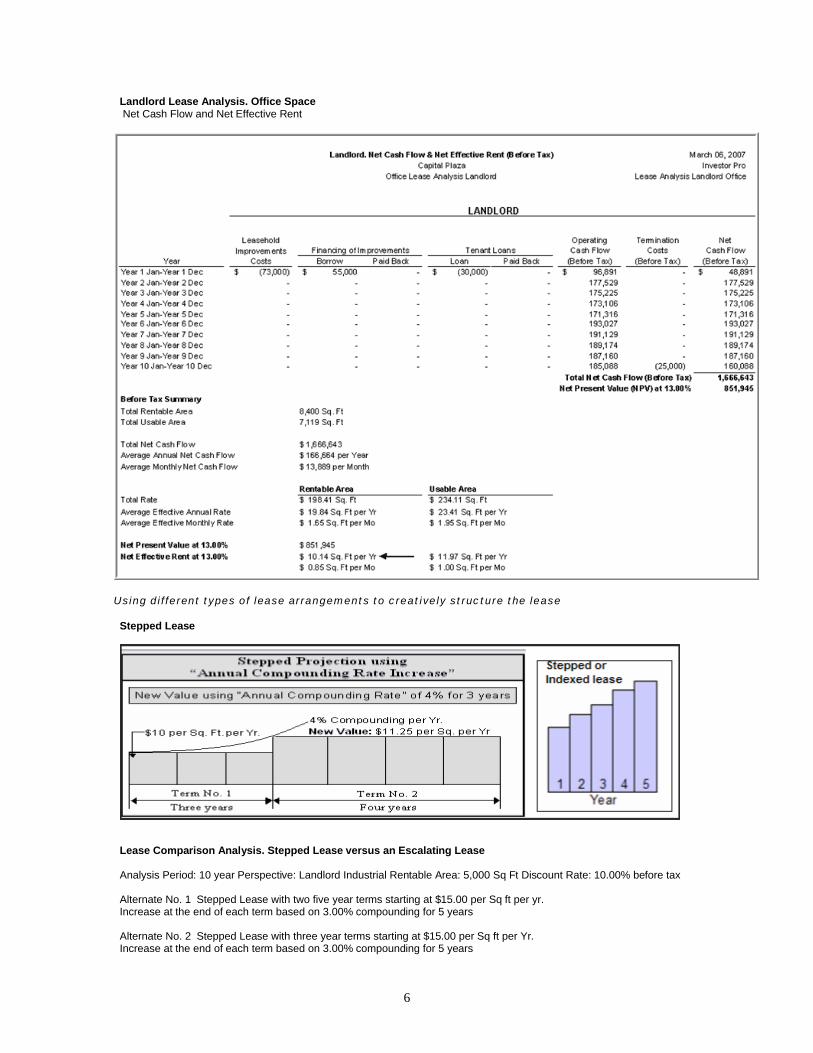
Landlord Lease Analysis. Office SpaceNet Cash Flow and Net Effective Rent
Using different types of lease arrangements to creatively structure the lease
Stepped Lease
Lease Comparison Analysis. Stepped Lease versus an Escalating Lease
Analysis Period: 10 year Perspective: Landlord Industrial Rentable Area: 5,000 Sq Ft Discount Rate: 10.00% before tax
Alternate No. 1 Stepped Lease with two five year terms starting at $15.00 per Sq ft per yr.Increase at the end of each term based on 3.00% compounding for 5 years
Alternate No. 2 Stepped Lease with three year terms starting at $15.00 per Sq ft per Yr.Increase at the end of each term based on 3.00% compounding for 5 years

7
Alternate No. 3Escalating Lease starting at $15.00 per Sq ft per yr.Annual increase: 0.75% each year uniform increase or $1.126 per year increaseResult
Buy v Lease analysisIs a special application of investment analysis.
The approach is to develop the Net Cash Flow for buying and then deduct the Net Cash Flow for leasing to create the Buy v Lease Cash Flow Difference .Note: Buy versus Lease should be done after tax
Buying compared to Leasing provides an Internal Rate of Return (IRR) of 10.57% after tax
.

8
Sale Lease Back. Case study
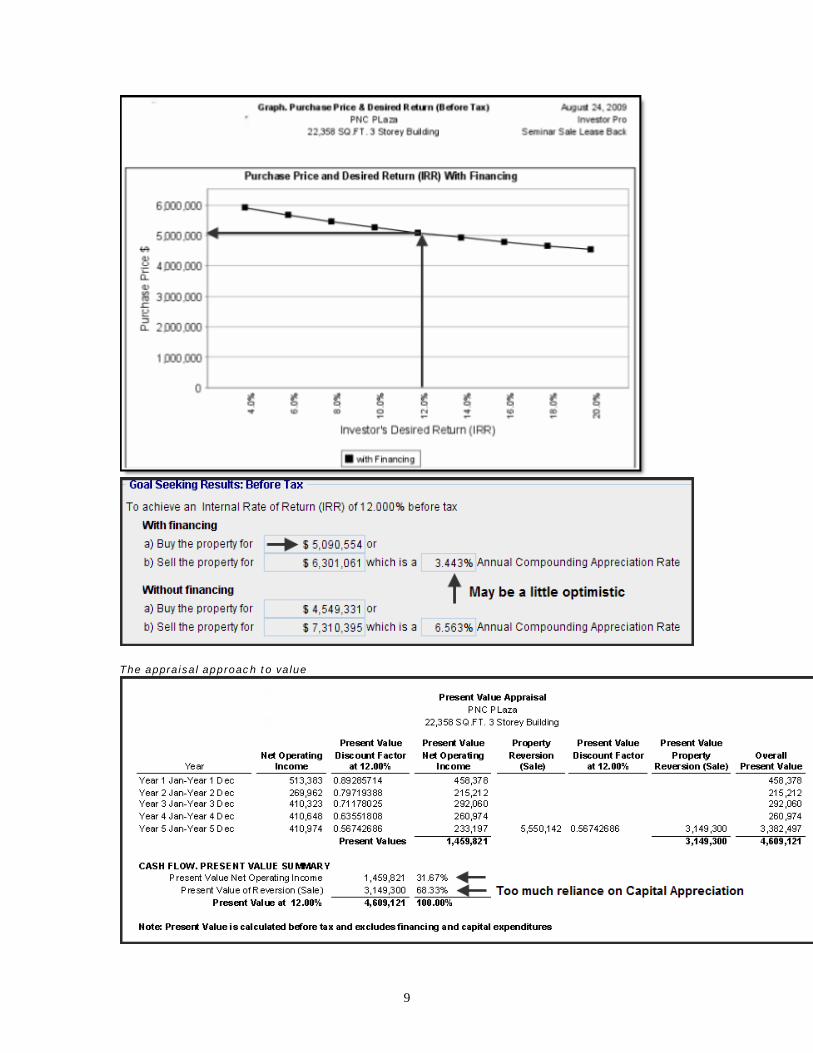
An investment company is looking at a Sale Lease Back of an office building. Their Desired Return (IRR) is 12.00% before tax based on a five year analysis.
You have been asked to evaluate the investment and make a presentation and recommendations to the Investment committee. The owner is asking $5,300,000 and the acquisition costs are $20,000Financing: $3,000,000 at 7.00% 25 year amortization
Revenue. The twist.The owner will lease back at above market rents for 18 months at $22.50 per Sq. Ft per Yr (nnn). Then vacate.
You predict the following after the current owner moves at the end of 18 months It will take 3 months lease up. There will be no income during this period Base Rent: New Tenant: Starts Year 2 Oct Term 1: 5 years $18.00 per Sq. Ft per Yr (nnn). Free Rent: First two monthsSale: Based on a 7.00% Cap Rate using the Net Operating Income for the year following the sale (Year 11)
Questions to be answered
1. Based on the above information, what is the Return (IRR) before tax? Answer 9.77%
2. How much should the investor pay to get the Desired Return (IRR) of 12.00% before tax? Ans: $5,090,000
3. Based on the price that provides the 12.00% IRR before tax, how much a year does the initial investment have to increase and is this realistic? Answer 3.44% May be realistic
4. Can the financing be increased? If so, how does it affect the financial returns? Yes
5. What should the presentation package include?
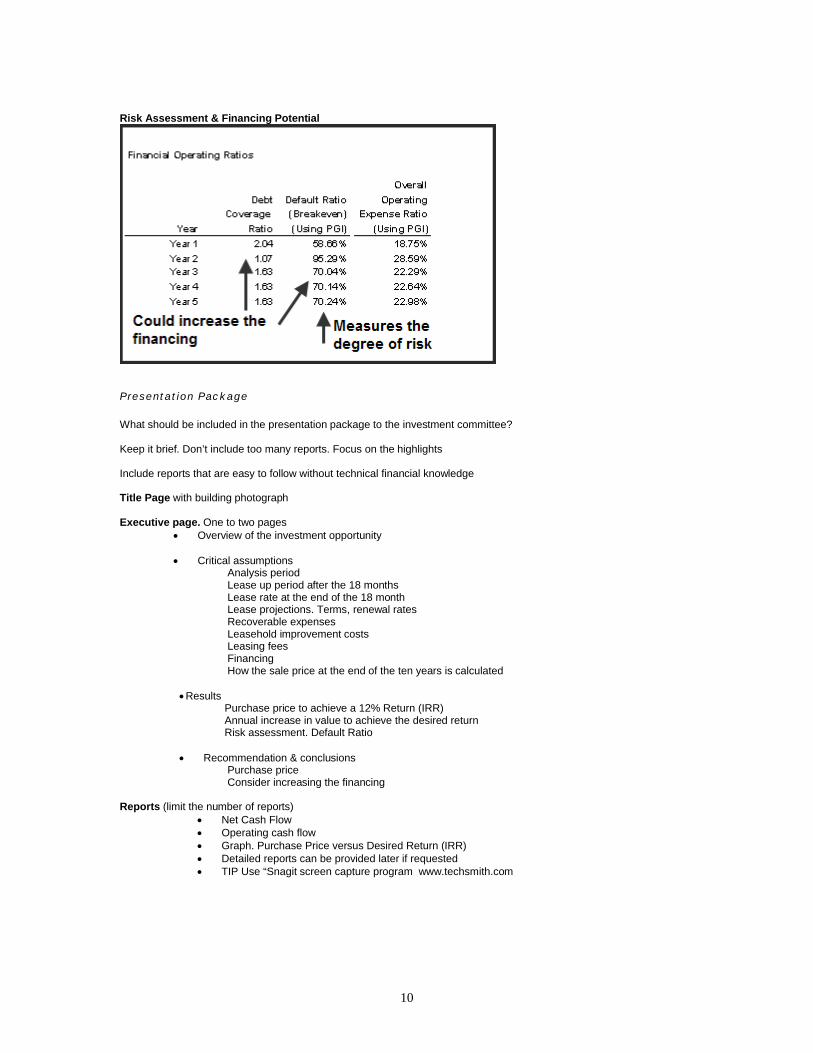
Risk AssessmentDebt Coverage Ratio: Shows how much the cash flow exceeds the mortgage paymentsDefault Ratio (Breakeven Point): What % of the building has to be rented to breakeven?Yearly Operating Cash Flow report
Financing Potential. Debt Coverage Ratio: Generally around 1.25 but depends on the lender and the riskDefault Ratio (Breakeven Point) If less than 85% may be an opportunity to increase the first mortgageLoan to Value Ratio: 75% (Today 65%)
9
The appraisal approach to value
10
Risk Assessment & Financing Potential
Presentation Package
What should be included in the presentation package to the investment committee?
Keep it brief. Don’t include too many reports. Focus on the highlights
Include reports that are easy to follow without technical financial knowledge
Title Page with building photograph
Executive page. One to two pages Overview of the investment opportunity
Critical assumptionsAnalysis periodLease up period after the 18 monthsLease rate at the end of the 18 monthLease projections. Terms, renewal ratesRecoverable expensesLeasehold improvement costsLeasing feesFinancingHow the sale price at the end of the ten years is calculated
ResultsPurchase price to achieve a 12% Return (IRR)Annual increase in value to achieve the desired returnRisk assessment. Default Ratio
Recommendation & conclusionsPurchase priceConsider increasing the financing
Reports (limit the number of reports) Net Cash Flow Operating cash flow Graph. Purchase Price versus Desired Return (IRR) Detailed reports can be provided later if requested TIP Use “Snagit screen capture program www.techsmith.com

NOTES
__________________________________________________________________________
__________________________________________________________________________
__________________________________________________________________________
__________________________________________________________________________
__________________________________________________________________________
__________________________________________________________________________
__________________________________________________________________________
__________________________________________________________________________
__________________________________________________________________________
__________________________________________________________________________
__________________________________________________________________________
__________________________________________________________________________
__________________________________________________________________________
__________________________________________________________________________
__________________________________________________________________________
__________________________________________________________________________
__________________________________________________________________________
__________________________________________________________________________
__________________________________________________________________________
__________________________________________________________________________
__________________________________________________________________________
__________________________________________________________________________