
USING HANDS-ON ACTIVITIES TO LEARN ABOUT LINEAR …
143
USING HANDS-ON ACTIVITIES TO LEARN ABOUT LINEAR FUNCTIONS ____________ A Project Presented to the Faculty of California State University, Chico ____________ In Partial Fulfillment of the Requirements for the Degree Master of Science in Mathematics Education ____________ by Chris G. Dell Spring 2011
Transcript of USING HANDS-ON ACTIVITIES TO LEARN ABOUT LINEAR …

USING HANDS-ON ACTIVITIES TO LEARN ABOUT
LINEAR FUNCTIONS
____________
A Project
Presented
to the Faculty of
California State University, Chico
____________
In Partial Fulfillment
of the Requirements for the Degree
Master of Science
in
Mathematics Education
____________
by
Chris G. Dell
Spring 2011
USING HANDS-ON ACTIVITIES TO LEARN ABOUT
LINEAR FUNCTIONS
A Project
by
Chris G. Dell
Spring 2011
APPROVED BY THE DEAN OF GRADUATE STUDIES AND VICE PROVOST FOR RESEARCH:
Katie Milo, Ed.D.
APPROVED BY THE GRADUATE ADVISORY COMMITTEE:
_________________________________ LaDawn Haws, Ph.D., Chair
_________________________________ Christopher Yakes, Ph.D.
_________________________________ Neil Schwertman, Ph.D.

iii
TABLE OF CONTENTS
PAGE
List of Figures............................................................................................................. v Abstract....................................................................................................................... vi
CHAPTER I. Introduction .............................................................................................. 1
Purpose of the Project................................................................... 2 Scope (Description) of the Project ............................................... 4 Significance of the Project............................................................ 5 Limitations of the Project ............................................................. 6 Definition of Terms ...................................................................... 7
II. Review of Related Literature.................................................................... 9
Significance of Functions to Learning Algebra............................ 9 Students’ Difficulties with the Concept of Functions .................. 11 Suggested Curriculum Design from the Literature ...................... 13 Conclusion.................................................................................... 14
III. Methodology............................................................................................. 15
IV. Results ...................................................................................................... 20
Conclusion.................................................................................... 32
References .................................................................................................................. 33
Appendices A. Concept Chart ........................................................................................... 37 B. Linear Functions Test ............................................................................... 39 C. Linear Functions Test with Results Data.................................................. 47 D. Student Survey.......................................................................................... 57

iv
CHAPTER PAGE
E. Teacher Survey......................................................................................... 59 F. Student Survey Comments ....................................................................... 61 G. Five Hands-on Algebra Lessons............................................................... 64

v
LIST OF FIGURES
FIGURE PAGE 1. Question #3 Results Comparison.............................................................. 22 2. Question #1 Results Comparison.............................................................. 23 3. Question #11 Results Comparison............................................................ 24 4. Question #6 Results Comparison.............................................................. 25 5. Question #19 Graph .................................................................................. 25 6. Question #19 Results Comparison............................................................ 26 7. Predictable Patterns Survey Results ......................................................... 27 8. The Tower of Tumblers Survey Results ................................................... 28 9. Intercepts in Real Life Survey Results ..................................................... 28 10. All Tied Up in Knots Survey Results ....................................................... 29 11. Can Barbie Survive the Bungee Survey Results....................................... 29 12. Overall Survey Results for All Five Activities......................................... 30

vi
ABSTRACT
USING HANDS-ON ACTIVITIES TO LEARN ABOUT
LINEAR FUNCTIONS
by
Chris G. Dell
Master of Science in Mathematics Education
California State University, Chico
Spring 2011
There is a need for lessons that combine rigor and relevance. During the first
few years I taught at Enterprise High School, we created of a new course, “Hands-on
Algebra 1,” for those students with low academic scores in mathematics. The goal of
this class was to increase student confidence and develop a deeper understanding of the
concepts at the students’ pace by presenting Algebra in a concrete manner. My project
was to develop and evaluate five hands-on lessons about linear functions for this course.
These lessons used an approach to allow students the opportunity to engage in
mathematical reasoning and problem solving. Each of the lessons was embedded in the
units about linear functions. The lessons are based on parts of six California Algebra 1
standards (6.0, 8.0, 9.0, 15.0, 17.0 and 18.0), which focus on linear functions and
function notation. Each lesson contains a lesson plan outlining the goals, the objectives
vii
and the California Algebra 1 Mathematics content standard(s) being taught, notes to the
teacher, a timeline, detailed directions, assessment instruments, a list of required
manipulatives and appropriate rubrics. The project will be helpful to other teachers who
are looking for curriculum resources that have standard-based concrete activities and
examples. Prior to the start of the first of three units on linear functions, the teachers
involved in the evaluation of the project administered a linear functions assessment. The
same assessment was administered again at the end of the third of three units on linear
functions. Another analysis involving a student survey and a teacher survey based on
interval variables was administered at the end of each hands-on activity. The results of
the assessment tools and the hands-on algebra lessons are included in the project.

1
CHAPTER I
INTRODUCTION
From the very first classroom, mathematics educators have been trying to find
the best way to help students learn. No single method has been elected as the ultimate
pedagogical technique. To name a few methods, there is the traditional passive
approach: teaching math with students seated in rows while the instructor is at the board
giving a lecture about the content and how to do the math, then assigning a plethora of
similar practice problems for the student to work on independently. Students normally
categorize this as a painful but effective process of learning mathematical rules and
procedures. Stanford professor, Jo Boaler, makes it clear in her book, What’s Math Got to
Do with It, students taught with the traditional passive approach “do not engage in sense
making, reasoning, or thought” (2008, p. 41). There is the discovery approach that allows
students the opportunity to collect information and use teacher provided tools in order to
create the knowledge. This method has led to peer teaching and is commonly known as
group work. The discovery approach is hands-on, practical and concrete motivating
students by giving them real world scenarios where math is used and is important. The
fact that math educators have tried so many ways to reach students is proof that they are
passionate about their job, and are trying to find that one method that can be elected as
the ultimate pedagogy.

2
Pedagogy is not the only current high priority topic. The selection of courses
to be taught in high schools is also being discussed and debated by math educators. To
increase accountability of schools and to establish a minimum student performance level,
the California Department of Education established mathematics content standards for
grades K – 12 in 1997. In 2003, they began administering the California Standards Tests
(CST), and established Algebra 1 as a graduation requirement. The expectation of the
state is all students will be enrolled in Algebra 1 or higher in grade 9. If a student is in a
course lower than Algebra 1, such as Algebra 1A, pre-Algebra or Basic Math, the
school’s API (Academic Performance Index) will suffer.
The changes to state requirements have caused secondary schools to limit
their course offerings in mathematics. I am a mathematics teacher and I have had the
opportunity to connect with other teachers throughout the state. It was becoming more
and more apparent that high schools were eliminating all courses lower than Algebra 1.
My school did just that. My goal was to create a course that could reach the student who
struggled with Algebra concepts while simultaneously teaching them all the CA Algebra
content standards. My project was to develop and evaluate five hands-on lessons about
linear functions for this course. These lessons used the discovery approach to allow
students the opportunity to engage in mathematical reasoning and problem solving.
Purpose of the Project
There is a need for lessons that combine rigor and relevance. Teachers are
inundated with standards from both the state and national board of educators. The
achievement of students is measured and used in the Academic Performance Index (API)
3
to rate schools. Therefore, large demands have been placed on the teachers to ensure all
student score well on the CSTs. The standards were probably designed to raise academic
achievement, but instead have resulted in teachers who “teach to the tests” and use a
more traditional passive approach. The traditional passive approach works for some of
the students, but not all the students are engaged and motivated, which leads to low class
performance. I am idealistically trying to find a way to reach all students.
During the first few years I taught at Enterprise High School, classes such as
Prep Math (content aligned to the CA standards grade 6 & 7), Algebra 1A and Algebra
1B (CA Algebra 1 standards taught over a two-year period) were eliminated. It was
apparent the state was “raising the bar” with math education and EHS was willing to take
the challenge. The objective was that all of the students in grade 9 should be exposed to,
and gain an understanding of the Algebra 1 standards. We were also aware that not all
students learn the same way and not all students have a history of success with learning
mathematics. Therefore, we created of a new course, “Hands-on Algebra 1”, for those
students with low academic scores in mathematics. This course had a “hands-on” or
discovery approach to teaching California Algebra 1 Standards in an attempt to better
reach all students.
The students who were directed to this course had a history of low academic
success in mathematics and were likely to have a lack of self-confidence in their ability
as math students. One of the goals of this class was to increase student confidence by
presenting Algebra 1 concepts in a concrete manner. Also, because the class filled two
consecutive class periods (110 minutes), the teacher was able develop a deeper
understanding of the concepts at the students’ pace. This time frame was conducive to

4
scaffolding the material and allowed teachers to give students the individual attention that
many of them needed.
Creating the Hands-on Algebra class accomplished two things:
1) Better served the low-performing students’ needs
2) Avoided the negative affect to the school’s API
Scope (Description) of the Project
Hands-on Algebra 1 was a new course to EHS, so the mathematics department
created the structure and organized the curriculum. I was given the role of lead teacher to
facilitate the development of the curriculum. Each teacher was given the task of
organizing a unit of Algebra 1 instruction using the current textbook and supplementing it
with a collection of projects and labs. The projects and labs were designed to either
concretely introduce the algebra standards or to support them and show the real-world
application of the standards. I developed units of instruction focused on linear functions.
This project contains five lessons that are either hands-on activity-based or
project-based. (Lessons are included in Appendix G.) Each of the lessons was embedded
in the units about linear functions. The lessons are based on parts of six Algebra 1
standards (6.0, 8.0, 9.0, 15.0, 17.0 and 18.0), which focus on linear functions and
function notation.
Each lesson contains:
A lesson plan outlining the goals, the objectives and the California Algebra 1
Mathematics content standard(s) being taught, notes to the teacher, a timeline, detailed
directions, assessment instruments, and appropriate rubrics

5
All required handouts in both paper and digital form
All required transparencies
A list of required manipulatives and/or the manipulatives themselves
The recipients of the above materials were eight teachers who were required
to teach the Hands-on Algebra class, to approximately 180 students enrolled in the
classes.
Significance of the Project
“Algebra curriculum should be centered on the concept of the function”
(Chambers, 1994). The activities, projects and labs are interlaced throughout the unit to
introduce or emphasize the characteristics of linear functions. Low performing students
need to explore algebra in a way that is different from the usual practice of just
memorizing rules and procedures (Kieran, 1989). The exploratory components of the unit
will also serve as a “hook” to learning Algebra.
The significance of this project is that it will determine if hands-on lessons are
an effective way to teach students about linear functions. Based on the analysis of student
achievement of the objectives established for each activity, the teachers of EHS can
appropriately change or remove activities for the following school year. My research is
focused only on the units about linear functions.
If the hands-on approach is successful, similar activities can be included in
other units in the course. The project will be helpful to other teachers who are looking for
curriculum resources that have standard-based concrete activities and examples. The

6
Message from the State Board of Education and the State Superintendent of Public
Instruction (Larsen & Eastin, 2001), states:
Standards describe what to teach not how to teach it. Standards-based education maintains California’s tradition of respect for local control of schools. To help students achieve at high levels, local school officials and teachers – with the full support of cooperation of families, businesses, and community partners – are encouraged to take these standards and design the specific curricular and instructional strategies that best deliver the content to their students. (p. 2)
There are many types of activities that could be used to teach linear functions.
It was my goal to find or create, then implement and evaluate hands-on activities, labs
and projects in the linear functions unit.
Limitations of the Project
One of the limitations to the project was that EHS is the only test site. This
study could not be accurately generalized to other schools. The other limitation was the
variance among the teachers involved in this study. Even with the same material, teachers
have different styles and attitudes that could affect the students’ understanding of the
concepts.
However, even with the above limitations to this study I anticipated positive
results, based on Thompson’s observation. Concrete representations of algebra increase
student understanding and motivate students to learn the concepts being addressed by the
activity (Thompson, 1998).

7
Definition of Terms
Academic Performance Index (API)
A measurement of academic performance and progress of individual schools
in California. It is one of the main components of the Public Schools Accountability Act
passed by the California legislature in 1999. API scores ranges from 200 to 1000.
California State Standards in Algebra 1 Targeting Linear Functions
Standard 6.0: Students graph a linear equation and compute the x- and y-
intercepts (e.g., graph 2x + 6y = 4). They are also able to sketch the region defined by
linear inequality (e.g., they sketch the region defined by 2x + 6y < 4).
Standard 8.0: Students understand the concepts of parallel lines and
perpendicular lines and how those slopes are related. Students are able to find the
equation of a line perpendicular to a given line that passes through a given point.
Standard 9.0: Students solve a system of two linear equations in two variables
algebraically and are able to interpret the answer graphically. Students are able to solve a
system of two linear inequalities in two variables and to sketch the solution sets.
Standard 15.0: Students apply algebraic techniques to solve rate problems,
work problems, and percent mixture problems.
Standard 17.0: Students determine the domain of independent variables and
the range of dependent variables defined by a graph, a set of ordered pairs, or a symbolic
expression.
Standard 18.0: Students determine whether a relation defined by a graph, a set
of ordered pairs, or a symbolic expression is a function and justify the conclusion.

8
California Standards Test (CST)
An annual test designed to determine students' progress toward achieving
California's state-adopted academic content standards in English–language arts (ELA),
mathematics, science, and history–social science.
Hands-on Algebra 1
A course designed for students with low achievement scores in mathematics.
The course covers the CA Algebra 1 content standards using activities, labs and teacher
directed lessons. The class is designed to meet daily for 110 minutes.
9
CHAPTER II
REVIEW OF RELATED LITERATURE
My goal in reviewing the literature to was to answer the following questions.
1. Why are functions important?
2. What kind of problems do students have?
3. Are there hands-on activity based curricula focused on functions?
Significance of Functions to Learning
Algebra
When a student asks a teacher why learning algebra is an important part of
their educational journey, the most common response is that learning algebra increases
the student’s problem solving skills, gives them the ability to make symbolic
representations and improves their logical reasoning skills. A function is a rule that
assigns to each element of a set A a unique element of a set B (where B may or may not
equal A). The function is a key component within each of those skills, but plays the
largest role in strengthening students’ reasoning skills (Kriegler, 1999). The study of
patterns (sequences) can be used as the foundation for exploring functional relationships
and creates an environment for inductive reasoning.
According to the California Education Round Table (1997), high school
graduates should be able to represent functions numerically, symbolically, graphically,
and verbally. Students should also be able to recognize characteristics of a function in its

10
different representations, transfer information about a function from one representation to
another, and apply their knowledge of functions to help understand the world around
them.
Understanding functions is crucial to learning algebra. Roger Day explains the
significance of the concept of function to mathematics:
Functional relationships offer fertile ground for making mathematical connections. As a unifying idea in mathematics, the function concept helps students connect different mathematical ideas and procedures. Functional relationships also provide connections to other content areas and a perspective from which to view real-world phenomena. (1995, p. 54)
Using functions as the unifying theme in mathematics and specifically in the
learning of algebra gives the students an important connection to prior knowledge.
Most textbooks introduce algebra by solving an equation for an unknown
using an algorithmic approach. From the idea of solving for the unknown, other algebraic
concepts are constructed using more rules and algorithms. This memorization approach to
learning algebra proves to be faulty when students are asked to justify or explain their
solutions (Confrey, 1998). Focusing on the development of a function or equation in
order to find the unknown gives students an opportunity to learn from the relationships
between quantities. This function-based approach to the instruction of algebra helps
students see algebra in the world around them (Chazan, 2000).
The significance of function-based approach is that students are not focusing
on the algebraic manipulations, but rather on finding the function. However, the concept
of function has proven to have difficult components that cause students to struggle. In the
following section those difficulties will be explored.
11
Students’ Difficulties with the Concept of Functions
In order to create an effective unit of algebra with the focus being the concept
of functions, we need to consider which concepts will be difficult for students. There are
many aspects of functions that students might find challenging. Sheryl Stump of Ball
State University has spent time researching student and teacher understanding of the
concept of slope and its connection to real-life applications.
Research has documented difficulties that students have with the concept of slope. There are misconceptions associated with the calculation of slope and with the interpretation of linear functions and their graphs. Students also have difficulty relating graphs to linear equations and to the notion of rate of change. They have difficulty considering slope as a ratio and connecting the ratio to a physical model. (1999, p. 126)
Also, the vocabulary and notation used with functions is new and can be
confusing. One of the best ways to verify that students understand notation is to describe
functions using common everyday language. For example, the words input and output in
place of domain and range can give the student a better approach to grasping the concept
of the function (Pierce, Wright & Roland, 1997). There are two common ways to
represent functions. Writing f(a) = b is called f(x) or f( ) notation; f:a b, called the
arrow or mapping notation (Usiskin, Peressini, Marchisotto, & Stanley, 2003). When
students use the f(x) notation, they often perceive the ( ) as an indicator to multiply.
Another problem area for students is classifying relations as functions or non-
functions (Markovits, Eylon, & Bruckheimer, 1988). If a student sees a relation
represented as a graph, he/she is able to successfully use the vertical line test to determine
if it is a function or not. However, this geometric understanding does not always transfer

12
to algebraic understanding. But it is clear that the introductory stages of learning about
functions should involve graphical representation before algebraic representation.
Students often have difficulties classifying specific types of functions
(Markovits et al., 1988). A common misconception is that all functions are linear.
Showing students the variety of types of functions and explaining why they are functions
can be overwhelming for students. Examples of particular functions with which students
struggle are the constant function and piecewise-defined functions. The most commonly
taught functions in the beginning algebra are linear, quadratics, cubics and exponentials.
Once students see both the algebraic and graphical representation of each function, it is
easier to compare and contrast characteristics.
Lastly, a teacher’s understanding and knowledge of the concept directly affect
student understanding (Nathan & Koedinger, 2000). Unfortunately, most teachers cannot
explain how to apply algebra in the world around them. If teachers do not have a
conceptual understanding of algebra, can we expect students to obtain such an
understanding (Chazan, 2000)? Using a hands-on curriculum design requires that
teachers be trained in how to facilitate the lessons. It cannot be expected that a teacher
will be able to use a lesson without proper guidance and examples to learn from.
The difficulties described above must be addressed if a new algebra unit is to
be effective. The next section details suggested curriculum from the literature that deals
with them.
13
Suggested Curriculum Design from the Literature
A single individual did not discover functions, nor were they discovered at a
particular time. Rather, the concept has evolved over a period of several centuries.
Function notation was introduced during the 18th century. Leonhard Euler was the man to
introduce the notation of f(x) for a function of a variable quantity x. Some of the other
mathematicians who helped develop the concept of function were Johann Bernoulli,
d’Alembert, Fourier, and Dirichlet (Usiskin et al., 2003).
Teaching functions using pattern-based problems requires the student to use
manipulatives to discover and extend patterns. Once the pattern can be articulated in
words, student must define the pattern using function notation. Some common titles of
this type of problem are Toothpick Squares, Towering Numbers, Paper Folding, Painted
Cubes, Matchstick Rectangles, Triangles, Arithmagons Extensions, etc. (Driscoll, 1999).
Another source of pattern-based problems comes from Virginia Polytechnic Institute and
State University (n.d.). Some of these problems are Slicing Cheese, Bunny in a Field,
Building a Staircase, Pascal’s Triangle, etc. Using the idea of a function machine to
model how the input value produced an output value is an effective way to help students
understand the algebraic form of a function (Pierce et al., 1997).
Lastly, the curriculum gives attention to graphing functions. Analyzing the
graphical representation of functions is fundamental to understanding the characteristics
of functions (Saunders & DeBlassio, 1988). Solid understanding of graphs will help
address some of the difficulties students have with functions.

14
Conclusion
From the literature I read, it is apparent that the concept of functions is central
to the learning of algebra. Since students have a hard time understanding the concept,
they would benefit from a concrete approach to learning about functions. Many math
educators have created materials to teach functions from a hands-on discovery approach.
A survey of curriculum reveals that many useful activities already exist for teaching the
concept of functions in an algebra course. These activities and an awareness of the
problems that students face when learning about linear functions became the starting
point of my project.
15
CHAPTER III
METHODOLOGY
To replace our classes that were not at the grade 9 state expectations, eight
math teachers collaborated to create the Hands-on Algebra 1 course. Each teacher used
the same warm-ups, activities, labs, homework assignments and assessments for each
unit. The curriculum is designed to be presented during two consecutive 55 minutes class
periods. It was our goal to cover at least 90% of the California State Standards for
Algebra 1.
For this project, I created five hands-on activities that were embedded in the
three units focused on linear functions and based on the California State Standards 6.0,
8.0, 9.0, 15.0, 17.0 and 18.0 for Algebra 1. The eight teachers taught a total of nine
sections. The average class size was approximately 20 students. Altogether
approximately 180 students were enrolled in this course. All the above-mentioned
teachers used the five activities from my project. Only five teachers (including me) were
involved in evaluating the project.
The lessons I used for the project were based on the ideas or similar lessons I
had previously seen in workshops, in collaboration with colleagues or from the reviewed
literature. I used All Tied Up in Knots, Can Barbie Survive the Bungee, and The Tower of
Tumblers as culminating activities at the end of each of the three linear functions units.
Predictable Patterns and Intercepts in Real Life were used in the middle of a unit to re-

16
enforce the concrete applications of the algebra. I created a list of all the activities I had
seen or read about that involved the linear functions standards. Then, for each of the
lessons, I named the specific concepts and state standards that the activity addressed.
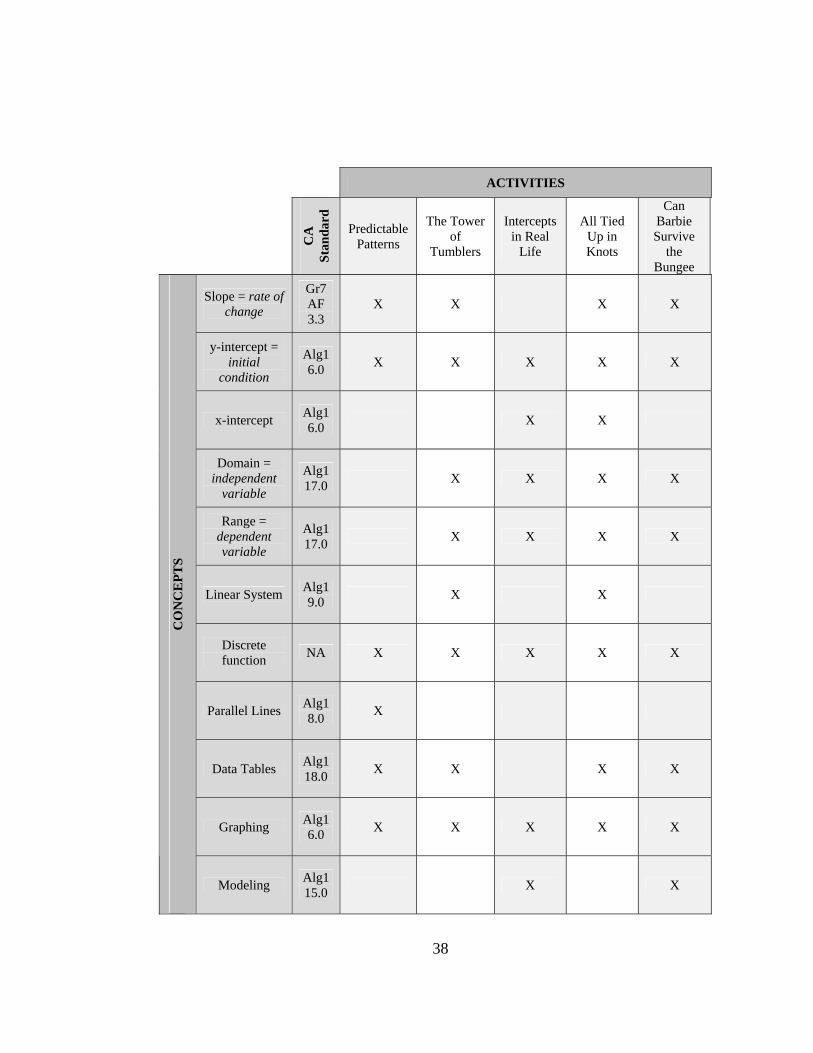
From the list, I was able to determine the five activities that best fit my project. I have
included the concept chart for the five lessons used in the project (see Appendix A).
Every lesson includes a section titled “Teacher Notes” which contains the
goal, objectives, California state standards, the multiple intelligence reference, lesson
time period, materials provided and needed list, assessment reference, extension idea(s),
directions for implementation, and a closure idea. Every lesson also included a warm-up
(with solutions), the activity (if applicable), a student worksheet, a solution guide to the
activity and a quiz with its solutions. The full layout of each lesson is included in
Appendix G. Each lesson was created using Microsoft Word so that after the lesson had
been field tested, it could be edited to fit an individual teaching style. I asked each teacher
not to make changes to the lessons until after completing the project.
Before the curriculum was used in the classrooms, I conducted an in-service
training for the teachers. I wanted to ensure that all the teachers involved in presenting
the material were confident about their process of instruction. I showed the teachers how
to teach and guide the activities, in order to eliminate some of the possible teaching
differences that could skew the results of the study. The objective for each activity was
explained in order to help the teachers guide their students through the purpose of each
activity.
Vocabulary, objectives and standards were presented to the students before
the activities or labs. A graphic organizer, familiar to the students because of its use in
17
prior units, was used to present the vocabulary. Students were informed of the California
state standards for Algebra 1 that were addressed in each activity. This was intended to
help students see how the activities fit in the framework of the Algebra 1 content. Most
importantly, the objectives for the activities were clearly presented to all students.
Knowing the objectives helped the students focus on what was to be learned and later
assessed.
Prior to the start of the first of three units on linear functions, the teachers
involved in the evaluation of the project administered a linear functions assessment
(Appendix B). This assessment focused on the concepts of the CA Algebra 1 standards
6.0, 8.0, 9.0, 15.0, 17.0, and 18.0. It consists of twenty multiple-choice questions, each
designed to assess a learning objective, a state standard or a combination of both. In order
to deter students from guessing, every question has a choice that reads, “I don’t know.”
The teachers involved in the project evaluation encouraged their students to answer f if
they did not know the correct answer and avoid random guessing. The same assessment
was administered again at the end of the third of three units on linear functions.
The assessments were administered by each participating teacher, then given
to me to correct and aggregate the data. The pretest and posttest data were compiled into
a Microsoft Excel spreadsheet. The student names were coded using their initials, their
teacher’s initials and the class period number. Pretest and posttest results were paired.
Student responses to individual items were recorded as well as their total scores. The
pretest and posttest results will be discussed in the following chapter.
The control group for this project was made up of students enrolled in Algebra
1 during the year before the hands-on lessons were implemented. The textbook and

18
pacing of the Algebra 1 classes for the students in the control group were similar to the
Hands-on Algebra 1 classes. The students in the control group were not taught the CA
standards using the hands-on activities presented in this project. The control students
were also given both the pretest and posttest found in Appendix B. The results were
collected and aggregated similarly to the process done with the treatment group.
Another analysis involving a student survey (Appendix D) and a teacher
survey (Appendix E) based on interval variables was administered at the end of each
hands-on activity. This questionnaire had a structured response format with answer
choices of “strongly agree, agree, disagree, strongly disagree and undecided.” Both
questionnaires ask questions about how students enjoyed the activity, the difficulty level,
the value, the fairness of the activity, attentiveness of the students, the clarity of
directions and whether it is an activity that could be recommended for others to use. The
teacher specific questionnaire includes questions pertaining to the connections to the
California standards and multiple learning style accommodations. Every student and
teacher was asked to give honest feedback. In order to allow individuals to express
thoughts or concerns that were not addressed in the interval response questions, one open
response question was included at the end of each survey asking for comments and
suggestions.
In the next chapter, the results from the pretest and posttest for both the
control and treatment groups will be discussed. The statistical tests used on the data
include a paired t-test by group to determine if student post knowledge is greater than
pre-knowledge, and an independent t-test for control group versus treatment group
difference. Individual analyses of the responses to key questions from pretest to posttest

19
were considered. Lastly, the survey responses to each activity were addressed and
analyzed.

20
CHAPTER IV
RESULTS
When I began this project, I wanted to discover if the hands-on activities
embedded in the Algebra 1 curriculum increased student understanding of Algebra. The
results and data collected from the pretest and posttest, along with the activity surveys
strongly suggest they do.
I used a paired t-test by group to determine if student post knowledge is
greater than pre-knowledge of linear functions, and an independent t-test for the control
group difference versus the treatment group difference. The test results and individual
item analysis of each key question will be discussed. Lastly, the analysis of the student
and teacher surveys will by presented.
For the control group, the average difference was approximately 4.4 points on
the 20-point assessment (1 point for each question). For the treatment group, the average
difference was approximately 6.4 points. The paired-t analysis produced a 95%
confidence interval for the increase of approximately 3.7 to 5.1 points from the pretest to
the posttest for the control group. The data collected from the treatment group has a 95%
confidence interval of approximately 5.4 points to 7.4 points from the pretest to posttest.
An independent t-test was done to determine if the increase in scores for the
treatment group was significantly different than the increase for the control group. The
results of that test determined with 99.96% confidence that the treatment group had a
21
greater increase in pretest to posttest scores, on average, than the control group. The 95%
confidence interval for this test was 0.8 to 3.2 points. The statistical significance of these
tests supports the conclusion that the hands-on lessons were more effective than the
traditional teaching style.
I went further to study some of the key individual questions asked on the
pretest/posttest. The full item analysis of each question is included in Appendix C. Look
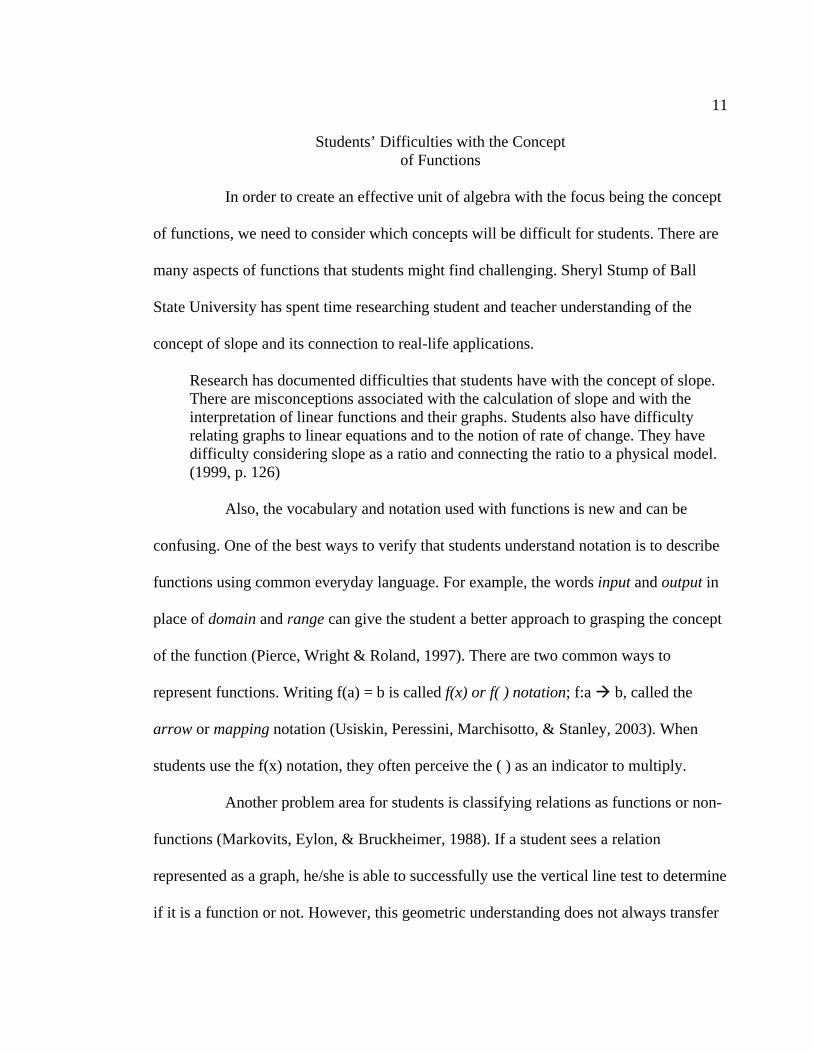
closely at the result of question three of the assessment since each of the five lessons
addressed the initial condition of the problem as the y-intercept of the linear function.
The question asks:
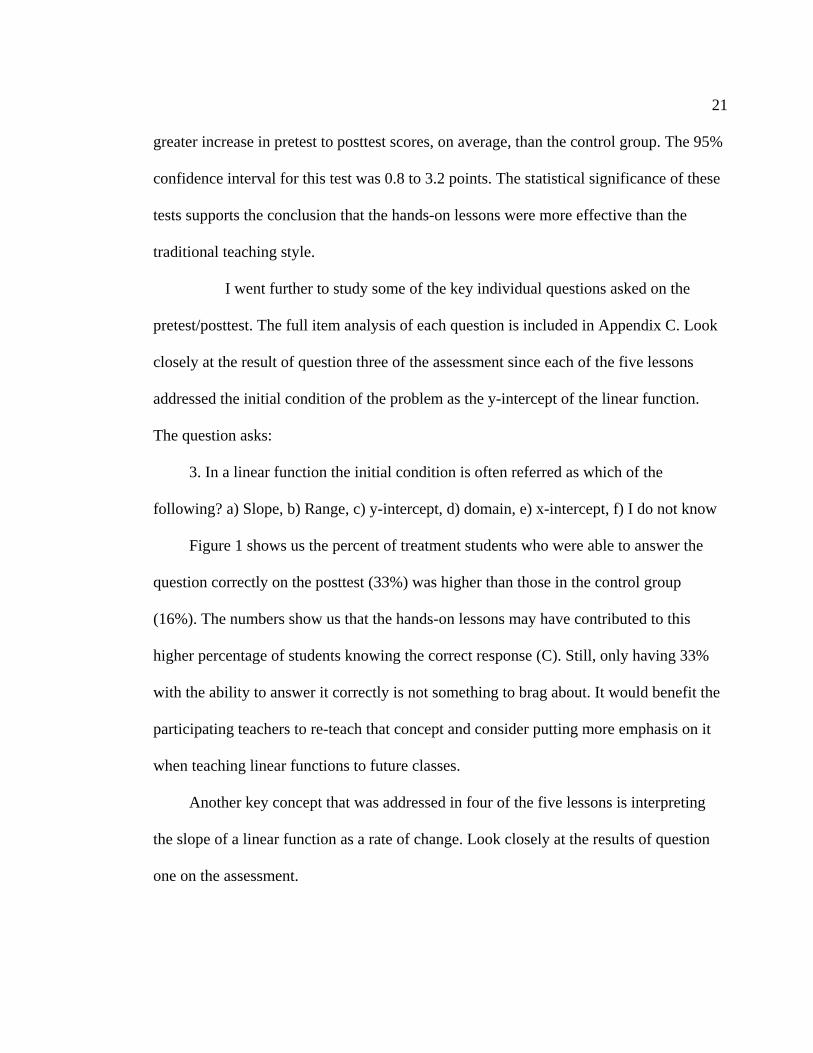
3. In a linear function the initial condition is often referred as which of the
following? a) Slope, b) Range, c) y-intercept, d) domain, e) x-intercept, f) I do not know
Figure 1 shows us the percent of treatment students who were able to answer the
question correctly on the posttest (33%) was higher than those in the control group
(16%). The numbers show us that the hands-on lessons may have contributed to this
higher percentage of students knowing the correct response (C). Still, only having 33%
with the ability to answer it correctly is not something to brag about. It would benefit the
participating teachers to re-teach that concept and consider putting more emphasis on it
when teaching linear functions to future classes.
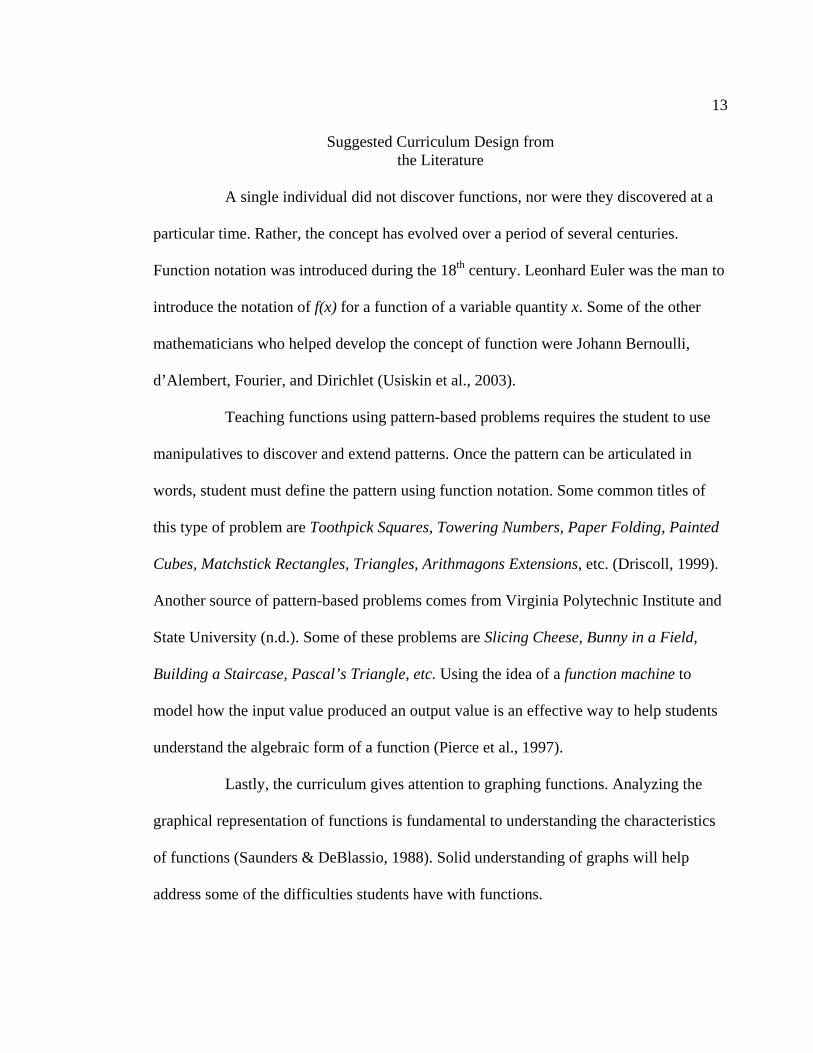
Another key concept that was addressed in four of the five lessons is interpreting
the slope of a linear function as a rate of change. Look closely at the results of question
one on the assessment.
22
Figure 1. Question #3 results comparison.
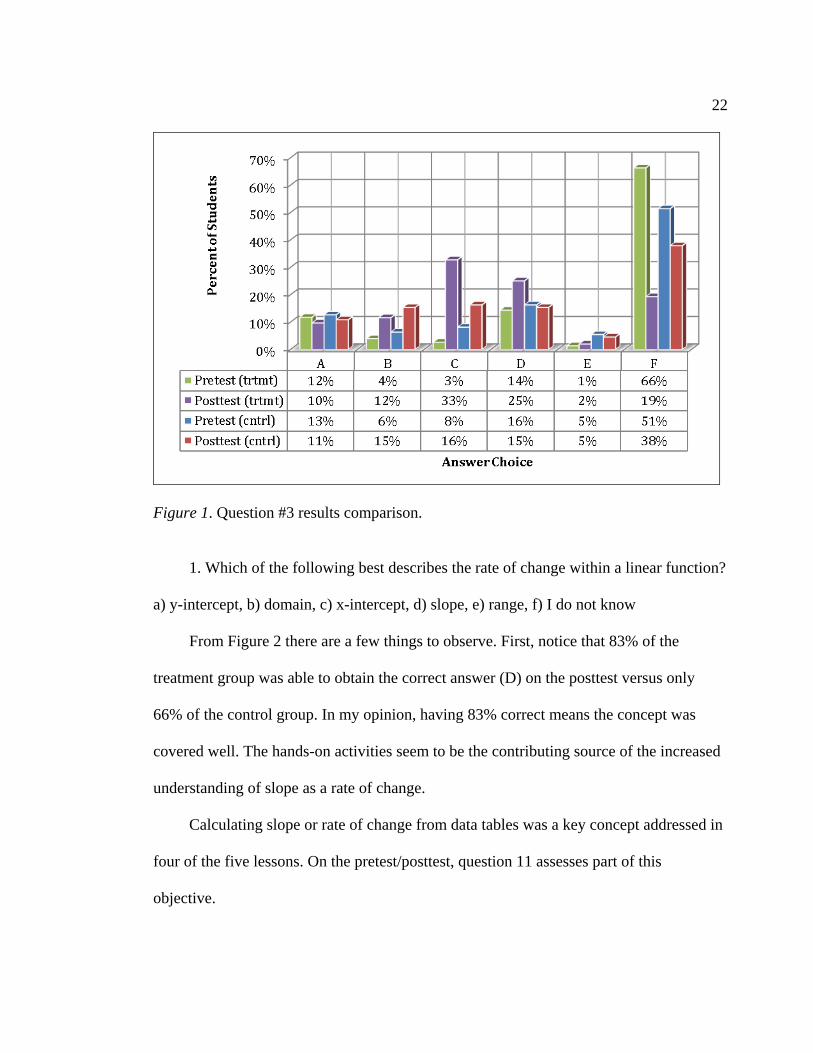
1. Which of the following best describes the rate of change within a linear function?
a) y-intercept, b) domain, c) x-intercept, d) slope, e) range, f) I do not know
From Figure 2 there are a few things to observe. First, notice that 83% of the
treatment group was able to obtain the correct answer (D) on the posttest versus only
66% of the control group. In my opinion, having 83% correct means the concept was
covered well. The hands-on activities seem to be the contributing source of the increased
understanding of slope as a rate of change.
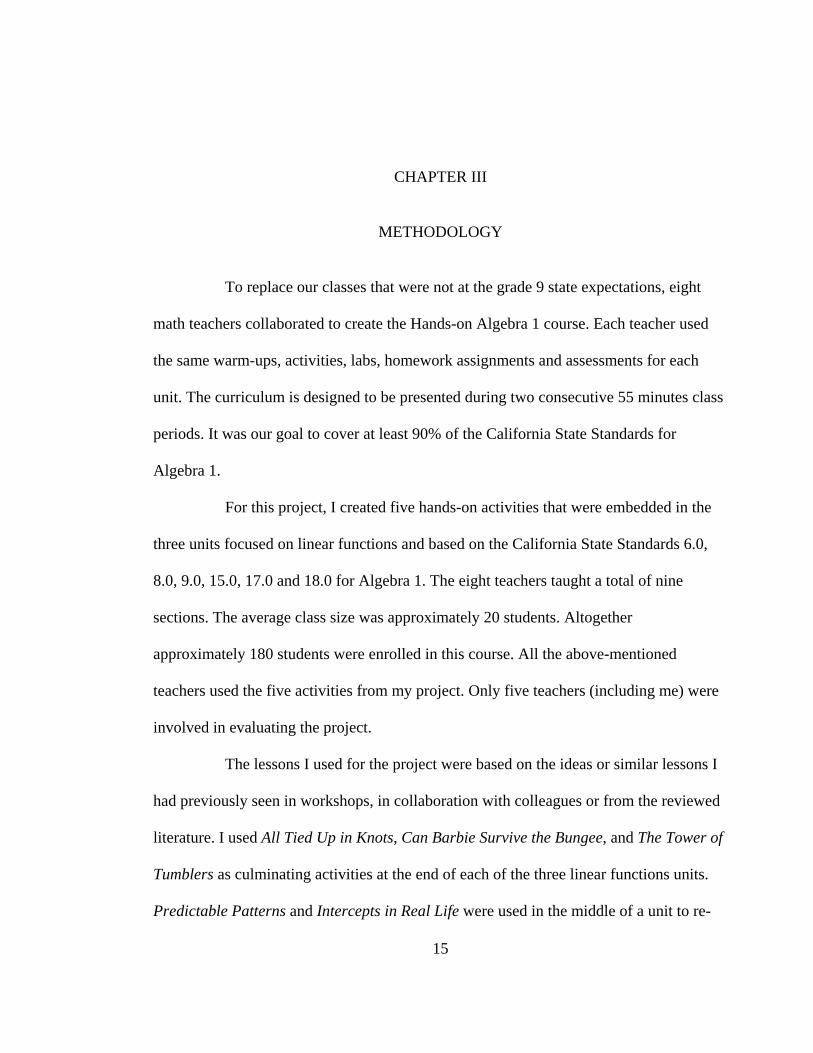
Calculating slope or rate of change from data tables was a key concept addressed in
four of the five lessons. On the pretest/posttest, question 11 assesses part of this
objective.

23
Figure 2. Question #1 results comparison.
11. Determine the slope of the linear function represented by the following table-of-
values:
n: 0 1 2 3 4
f(n): 4 7 10 13 16
a. 0
b. 1
c. 2
d. 3
e. 1/3
f. I do not know

24
The percentage of students in the treatment group that answered correctly increased
from 31% on the pretest to 50% on the posttest, an increase of 19%. For the control group
it was an increase of 16%. This data (Figure 3) does not support the use of hands-on
Figure 3. Question #11 results comparison. lessons particularly. The purpose of highlighting this question is to point out that in both
the control and treatment groups, the concept of “slope” was not mastered. Notice that the
second most common answer for both groups was E, the reciprocal of the correct answer.
Something I would consider to study further is why 10% of the treatment group answered
B.
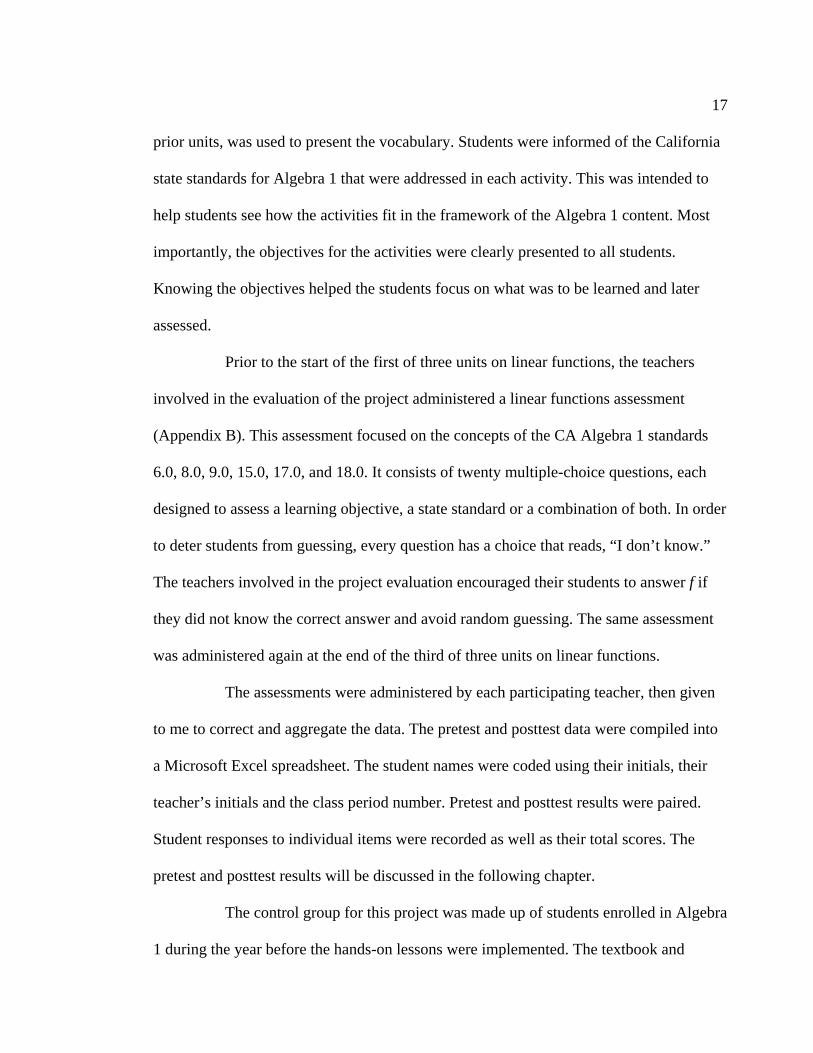
The last key concept that was assessed is the graphical representation of linear
functions. All five lessons addressed this concept in some manner. There are a couple of
questions from the pretest/posttest to highlight that assess this concept).
25
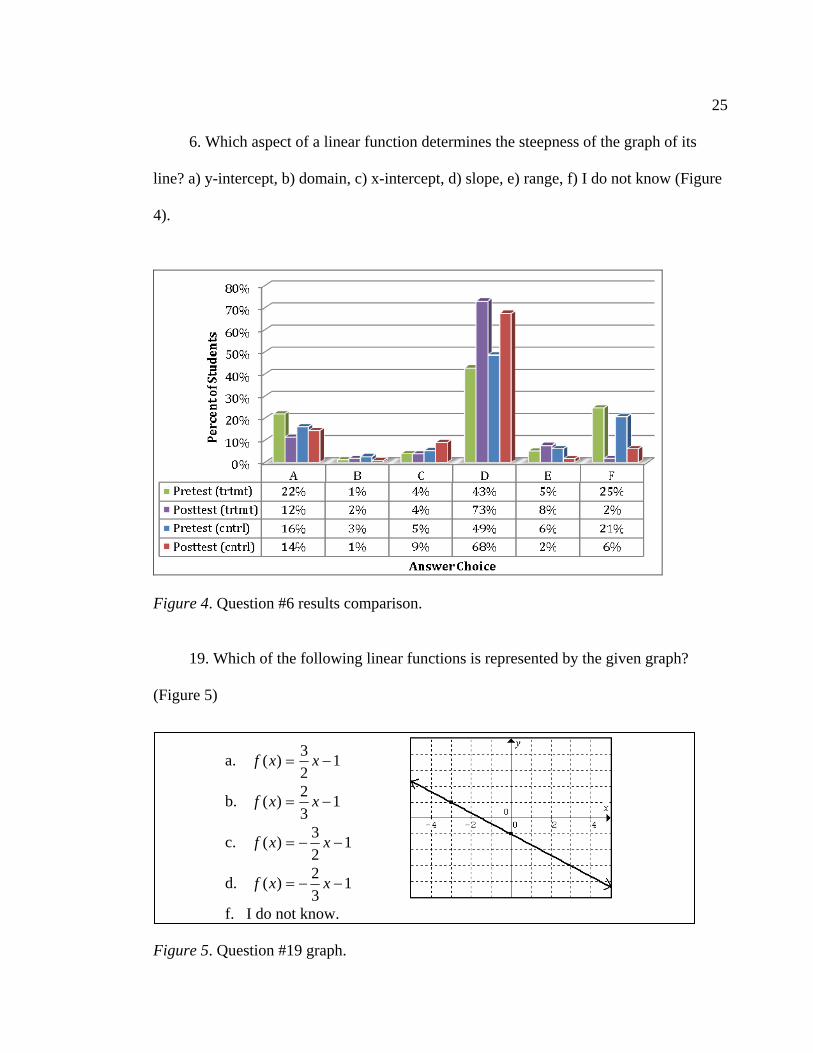
6. Which aspect of a linear function determines the steepness of the graph of its
line? a) y-intercept, b) domain, c) x-intercept, d) slope, e) range, f) I do not know (Figure
4).
Figure 4. Question #6 results comparison.
19. Which of the following linear functions is represented by the given graph?
(Figure 5)
a. 12
3)( xxf
b. 13
2)( xxf
c. 12
3)( xxf
d. 13
2)( xxf
f. I do not know. Figure 5. Question #19 graph.

26
From Figure 6, we see that the percentage of students in the treatment group
that answered correctly increased from 43% on the pretest to 73% on the posttest, an
Figure 6. Question #19 results comparison. increase of 30%. For the control group it was an increase of 19%. From Figure 6, the
increase in percentage of students in the treatment group that answered correctly went
from 18% on the pretest to 69% on the posttest, an increase of 51%. For the control group
it was an increase of 32%. This data strongly supports the idea that using hands-on
lessons increases student learning about the graphical representation of linear functions. It
is necessary to state that in both questions, neither the control nor the treatment group
achieved a sufficient percentage of students at a proficiency level. In either case, it would
be necessary for the teachers to re-teach and review the concept.

27
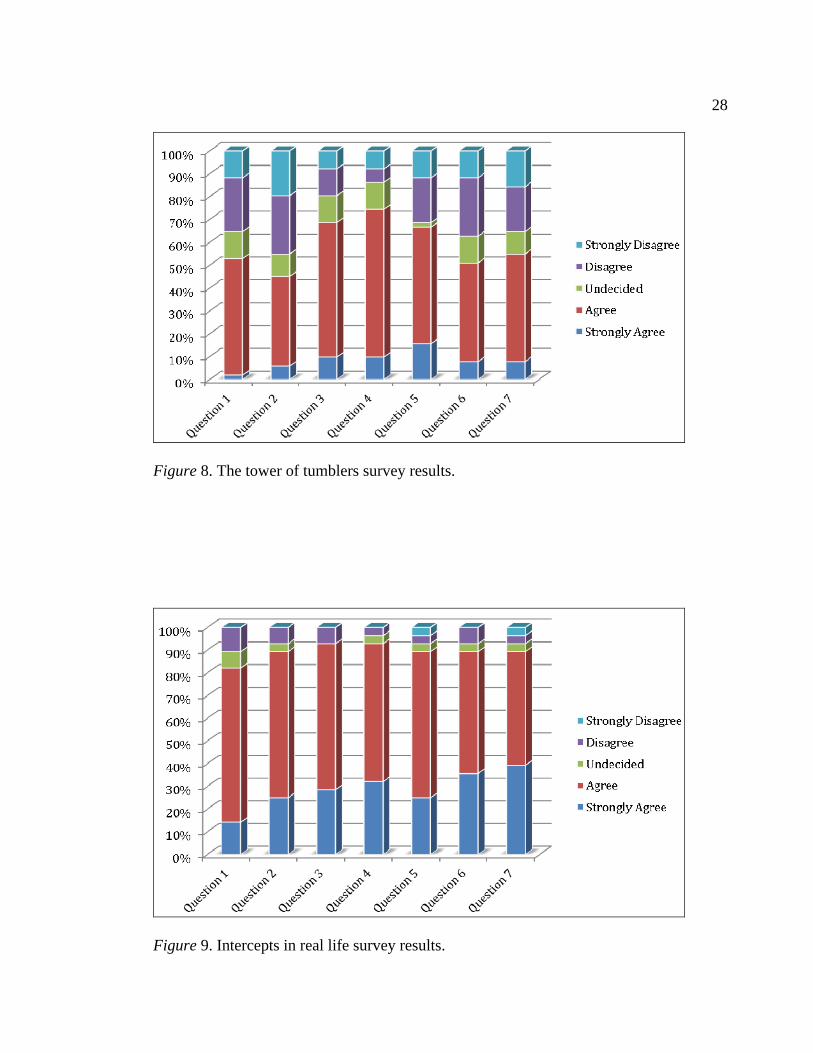
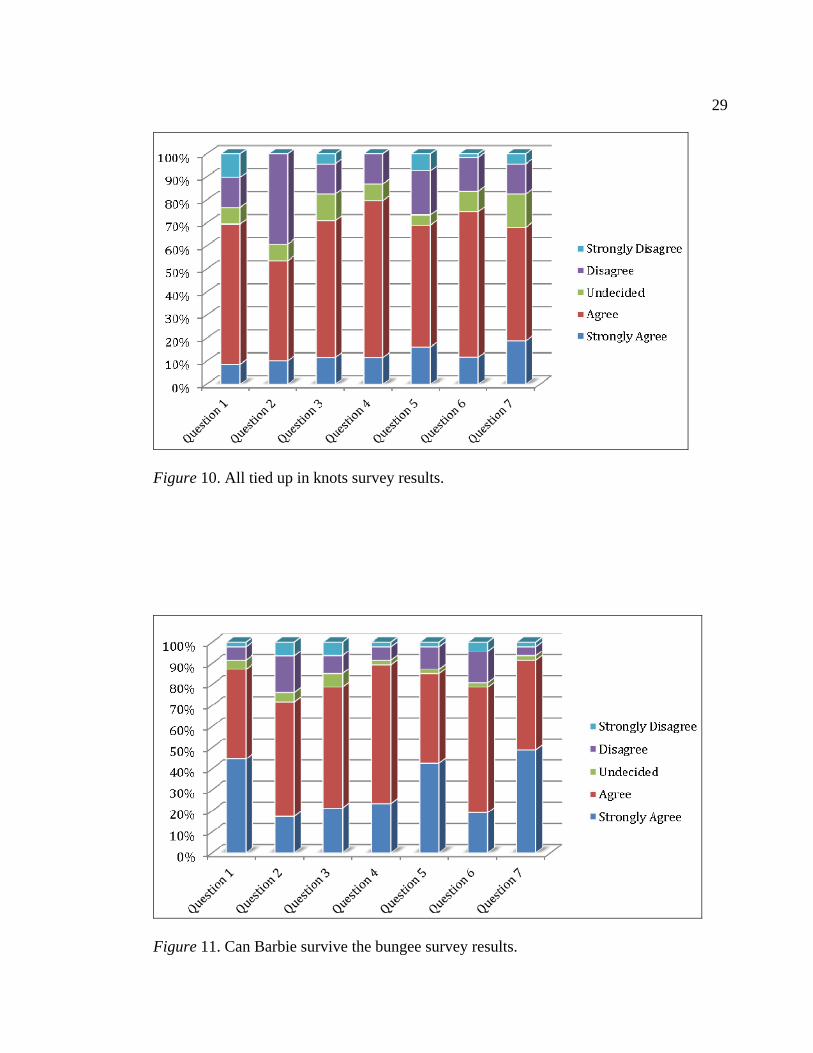
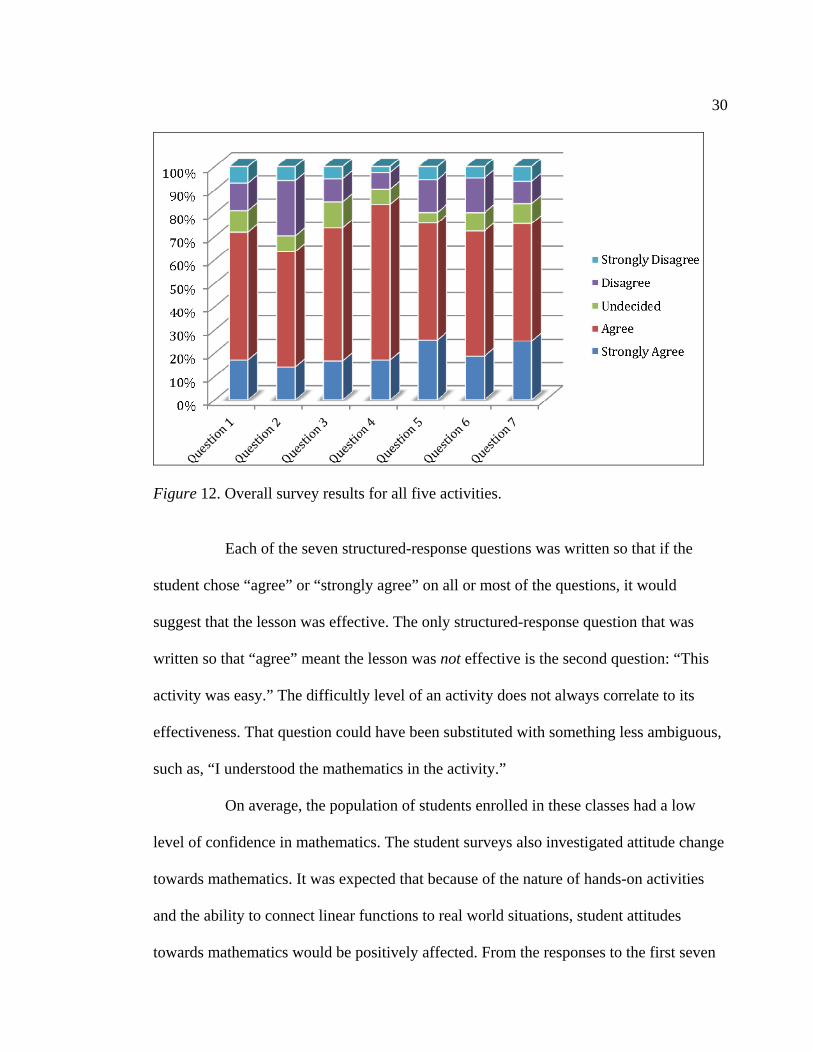
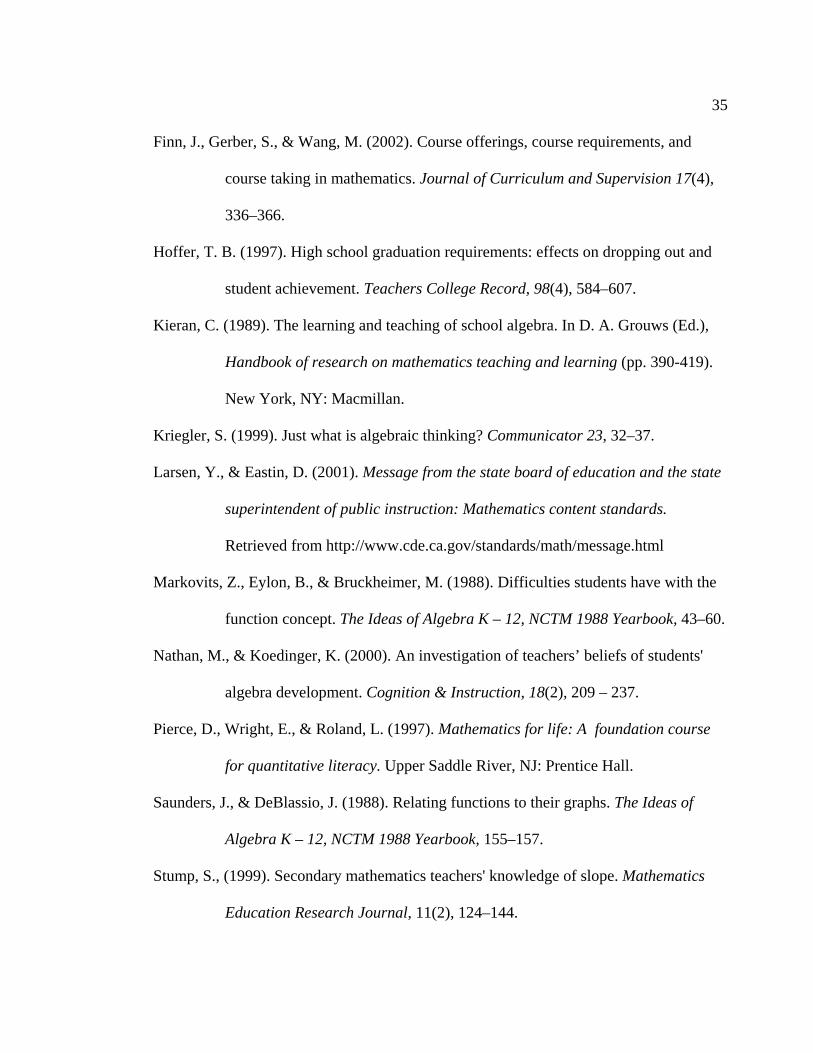
Figures 7-11 show the percentage of students who responded to each option of
the first seven survey questions. Figure 12 pulls the responses from all five activities.
Figure 7. Predictable Patterns survey results.
The first seven survey questions:
1. This activity was enjoyable.
2. This activity was easy.
3. This activity was valuable.
4. This activity was fair.
5. This activity kept my attention.
6. The directions were clear and easy to follow.
7. I would recommend using this activity to other teachers of Algebra 1 students.
28
Figure 8. The tower of tumblers survey results.
Figure 9. Intercepts in real life survey results.
29
Figure 10. All tied up in knots survey results.
Figure 11. Can Barbie survive the bungee survey results.
30
Figure 12. Overall survey results for all five activities.
Each of the seven structured-response questions was written so that if the
student chose “agree” or “strongly agree” on all or most of the questions, it would
suggest that the lesson was effective. The only structured-response question that was
written so that “agree” meant the lesson was not effective is the second question: “This
activity was easy.” The difficultly level of an activity does not always correlate to its
effectiveness. That question could have been substituted with something less ambiguous,
such as, “I understood the mathematics in the activity.”
On average, the population of students enrolled in these classes had a low
level of confidence in mathematics. The student surveys also investigated attitude change
towards mathematics. It was expected that because of the nature of hands-on activities
and the ability to connect linear functions to real world situations, student attitudes
towards mathematics would be positively affected. From the responses to the first seven

31
questions and the comments (see Appendix F) made in question eight, it appears that the
attitudes toward math were positively affected for some of the students.
Consider question one: “This activity was enjoyable.” For the Predictable
Patterns activity a total of 74% of the students either agreed or strongly agreed with this
statement. For the Tower of Tumblers, Intercepts in Real Life, All Tied Up in Knots and
Can Barbie Survive the Bungee, the percents of agreement are 53, 82, 70 and 88
respectively. Most students enjoyed the lessons except for the Tower of Tumblers
activity.
When a student recommends that a math lesson should be used in other
classes filled with their peers, that lesson must be good. That is why I want to highlight
that the percentage of students who answered either “agree” or “strongly agree” to
question 7: “I would recommend using this activity to other teachers of Algebra1
students.” Results from the greatest to least support are as follows: the Can Barbie
Survive the Bungee activity with 92%, the Intercepts in Real Life activity with 89%, the
Predictable Patterns activity with 82%, the All Tied Up in Knots activity with 68%, and
the Tower of Tumblers activity 55%.
It would also be important to analyze the result of question 6: “The directions
were clear and easy to follow.” Each of the lessons had an element of student exploration
and problem solving. Therefore, the lesson cannot be considered effective if it was
unclear or hard to follow. The survey results show, from the greatest to least, the
percentage “agree” plus “strongly agree” to question six are as follows: the Intercepts in
Real Life activity with 90%, the Can Barbie Survive the Bungee activity with 79%, the

32
Predictable Patterns activity with 75%, the All Tied Up in Knots activity with 75%, and
the Tower of Tumblers activity 51%.
The Tower of Tumblers activity was less popular than all the other activities. It
also received the most negative comments (see Appendix F). It is apparent the activity
needs to be re-worked. The two activities that received the most positive feedback were
the Can Barbie Survive the Bungee activity and the Intercepts in Real Life activities.
They both had the highest “agree” plus “strongly agree” percentages from questions one,
six and seven. They also had the most positive comments (see Appendix F). I would
recommend these two activities for use in any Algebra 1 course.
Conclusion
My project was to determine if using hands-on activities improve students’
performance, understanding and ability to achieve success in Algebra 1. I hypothesized
that hands-on activities could also improve students’ attitude towards algebra and
mathematics in general while creating a better climate for learning algebra. My
recommendation to all Algebra 1 teachers is be aware of the need for a curriculum that is
rigorous and relevant within their Algebra 1 program. Using hands-on lessons that are
standards-based with concrete examples can make a significant difference in student
attitude and learning.

REFERENCES

34
REFERENCES
Boaler, J. (2008). What’s math got to do with it? How parents and teachers can help
children learn to love their least favorite subject. New York, NY: Penguin
Books.
California Department of Education. (2000). Mathematics framework for California
public schools (Revised ed.). Sacramento, CA: Author.
California Education Round Table. (1997). Mathematics standards for California high
school graduates. Sacramento, CA: Author.
Chambers, D. L. (1994). The right algebra for all. Educational Leadership, 51(6), 85.
Chazan, D. (2000). Beyond formulas in mathematics and teaching: Dynamics or the high
school algebra classroom. New York, NY: Teachers College Press.
Confrey, J. (1998). What do we know about K-14 students’ learning of algebra? In The
nature and role of algebra in K-14 curriculum: Proceedings of National
Symposium (pp. 37-40). Proceedings of a National Symposium, May 27 and
28, 1997. Washington, D.C.: National Academy of Sciences.
Day, R. P. (1995). Using functions to make mathematical connections. In P. A. House &
F. Coxford (Eds.), Connecting mathematics across the curriculum (pp. 54–
64). Reston, VA: National Council of Teachers of Mathematics.
Driscoll, M. (1999). Fostering algebraic thinking: a guide for teachers, grades 6 – 10.
Portsmouth, NH, Heinemann.
35
Finn, J., Gerber, S., & Wang, M. (2002). Course offerings, course requirements, and
course taking in mathematics. Journal of Curriculum and Supervision 17(4),
336–366.
Hoffer, T. B. (1997). High school graduation requirements: effects on dropping out and
student achievement. Teachers College Record, 98(4), 584–607.
Kieran, C. (1989). The learning and teaching of school algebra. In D. A. Grouws (Ed.),
Handbook of research on mathematics teaching and learning (pp. 390-419).
New York, NY: Macmillan.
Kriegler, S. (1999). Just what is algebraic thinking? Communicator 23, 32–37.
Larsen, Y., & Eastin, D. (2001). Message from the state board of education and the state
superintendent of public instruction: Mathematics content standards.
Retrieved from http://www.cde.ca.gov/standards/math/message.html
Markovits, Z., Eylon, B., & Bruckheimer, M. (1988). Difficulties students have with the
function concept. The Ideas of Algebra K – 12, NCTM 1988 Yearbook, 43–60.
Nathan, M., & Koedinger, K. (2000). An investigation of teachers’ beliefs of students'
algebra development. Cognition & Instruction, 18(2), 209 – 237.
Pierce, D., Wright, E., & Roland, L. (1997). Mathematics for life: A foundation course
for quantitative literacy. Upper Saddle River, NJ: Prentice Hall.
Saunders, J., & DeBlassio, J. (1988). Relating functions to their graphs. The Ideas of
Algebra K – 12, NCTM 1988 Yearbook, 155–157.
Stump, S., (1999). Secondary mathematics teachers' knowledge of slope. Mathematics
Education Research Journal, 11(2), 124–144.

36
Thompson, F. (1998). Hands-on algebra! Ready-to-use games & activities for grades 7-
12. , West Nyack, NY: The Center for Applied Research in Education.
Usiskin, Z., Peressini, A., Marchisotto, E., & Stanley, D. (2003). Mathematics for high
school teachers: An advanced perspective. Upper Saddle River, NJ: Prentice
Hall.
Virginia Polytechnic Institute and State University. (n.d.). Math connects: Patterns –
functions – algebra. Retrieved from
www.math.vt.edu/courses/mathconnect/assignments/Math_Connects_Workbo
ook.pdf

APPENDIX A
38
ACTIVITIES
CA
S
tan
dard
Predictable Patterns
The Tower of
Tumblers
Intercepts in Real
Life
All Tied Up in Knots
Can Barbie Survive
the Bungee
Slope = rate of change
Gr7 AF 3.3
X X X X
y-intercept = initial
condition
Alg1 6.0
X X X X X
x-intercept Alg1 6.0
X X
Domain = independent
variable
Alg1 17.0
X X X X
Range = dependent variable
Alg1 17.0
X X X X
Linear System Alg1 9.0
X X
Discrete function
NA X X X X X
Parallel Lines Alg1 8.0
X
Data Tables Alg1 18.0
X X X X
Graphing Alg1 6.0
X X X X X
CO
NC
EP
TS
Modeling Alg1 15.0
X X

APPENDIX B

40
LINEAR FUNCTIONS TEST NAME: ___________________
TEACHER: ___________________ DATE: ________ PERIOD: ___
Directions: Your responses to this test will be used in a scientific study. Please answer seriously, and do not just guess. If you do not know the answer to a question, choose option f.
1. Which of the following best describes the rate of change within a linear function?
a. y-intercept b. domain c. x-intercept d. slope e. range f. I do not know.
2. Which of the following best describes the following model? “When Troy adds 5 marbles to the beaker containing water, the water level is now at 120 mL. When Cathy adds 9 more marbles to the beaker, the level reaches 210 mL.”
a. A continuous function b. A discrete function f. I do not know.
3. In a linear function the initial condition is often referred as which of the following?
a. slope b. range c. y-intercept d. domain e. x-intercept f. I do not know.
41
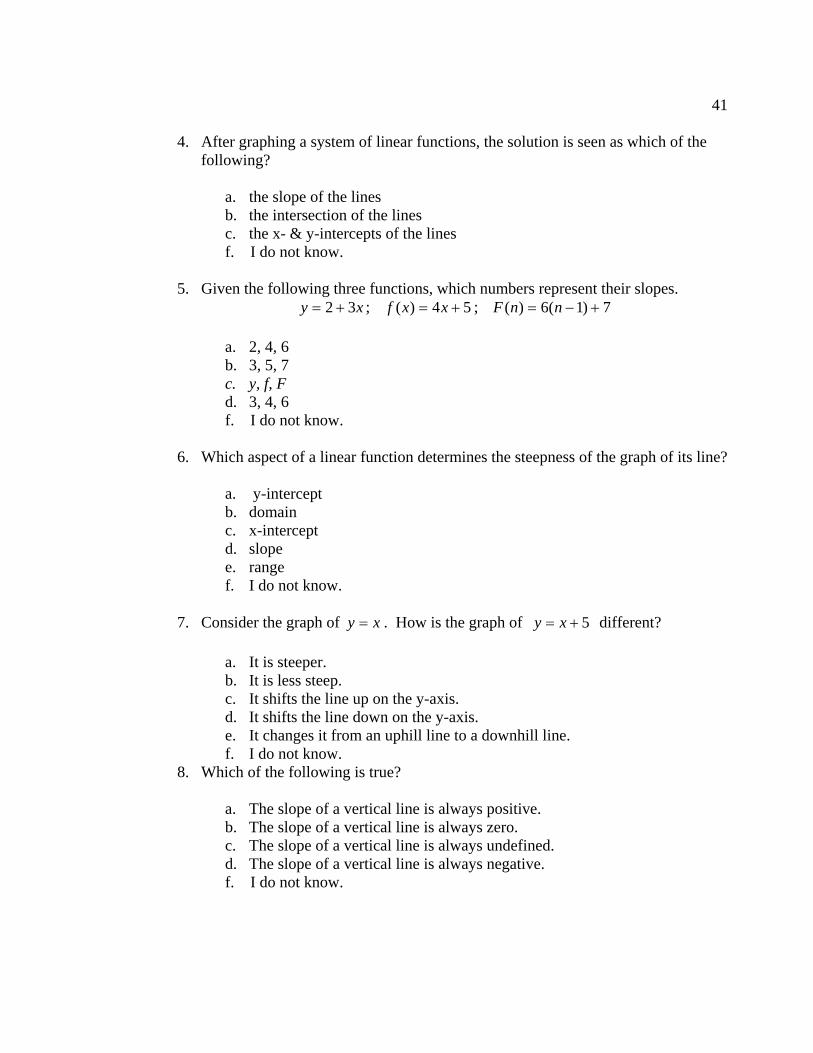
4. After graphing a system of linear functions, the solution is seen as which of the following?
a. the slope of the lines b. the intersection of the lines c. the x- & y-intercepts of the lines f. I do not know.
5. Given the following three functions, which numbers represent their slopes. xy 32 ; 54)( xxf ; 7)1(6)( nnF
a. 2, 4, 6 b. 3, 5, 7 c. y, f, F d. 3, 4, 6 f. I do not know.
6. Which aspect of a linear function determines the steepness of the graph of its line?
a. y-intercept b. domain c. x-intercept d. slope e. range f. I do not know.
7. Consider the graph of xy . How is the graph of 5 xy different?
a. It is steeper. b. It is less steep. c. It shifts the line up on the y-axis. d. It shifts the line down on the y-axis. e. It changes it from an uphill line to a downhill line. f. I do not know.
8. Which of the following is true?
a. The slope of a vertical line is always positive. b. The slope of a vertical line is always zero. c. The slope of a vertical line is always undefined. d. The slope of a vertical line is always negative. f. I do not know.

42
9. What is the y-intercept of the line 5 3 12x y ?
a. 0,5
b. 0,12
c. 0,3
d. 0,4
f. I do not know.
10. Which of the following ordered pairs is the x-intercept on the line 5 2 20x y ?
a. 10,0
b. 0, 10
c. 4,0
d. 0,4
f. I do not know.
11. Determine the slope of the linear function represented by the following table-of-
values.
a. 0 b. 1 c. 2 d. 3
e. 13
f. I do not know. 12. Which of the following is the solution to the system of
equations:
4 143
x yy x
a. 2,6
b. 2, 6
c. 4, 14
d. 4,3
f. I do not know.
n 0 1 2 3 4 f(n) 4 7 10 13 16

43
13. The x-values of the linear function, 45)( xxf , are also known as the function’s:
a. range b. independent values c. slope d. dependent values f. I do not know.
14. Which of the following lines is parallel to 6 2 8x y ?
a. 3 1y x
b. 14
3y x
c. 3 9y x
d. 18
3y x
f. I do not know.
15. Which of the following best describes the following graph?
a. A continuous function b. A discrete function f. I do not know.

44
16. Which of the following does not represent the slope (m) of a linear function?
a. rate of change
b. runrise
c. 12
12
xxyy
d. yinchangexinchange
e. xy
f. I do not know.
17. Find the slope of the line passing through the points 2, 3 4,5and . (Use the
graph, if necessary.)
a. 3
4
b. 3
4
c. 4
3
d. 4
3
f. I do not know.
45
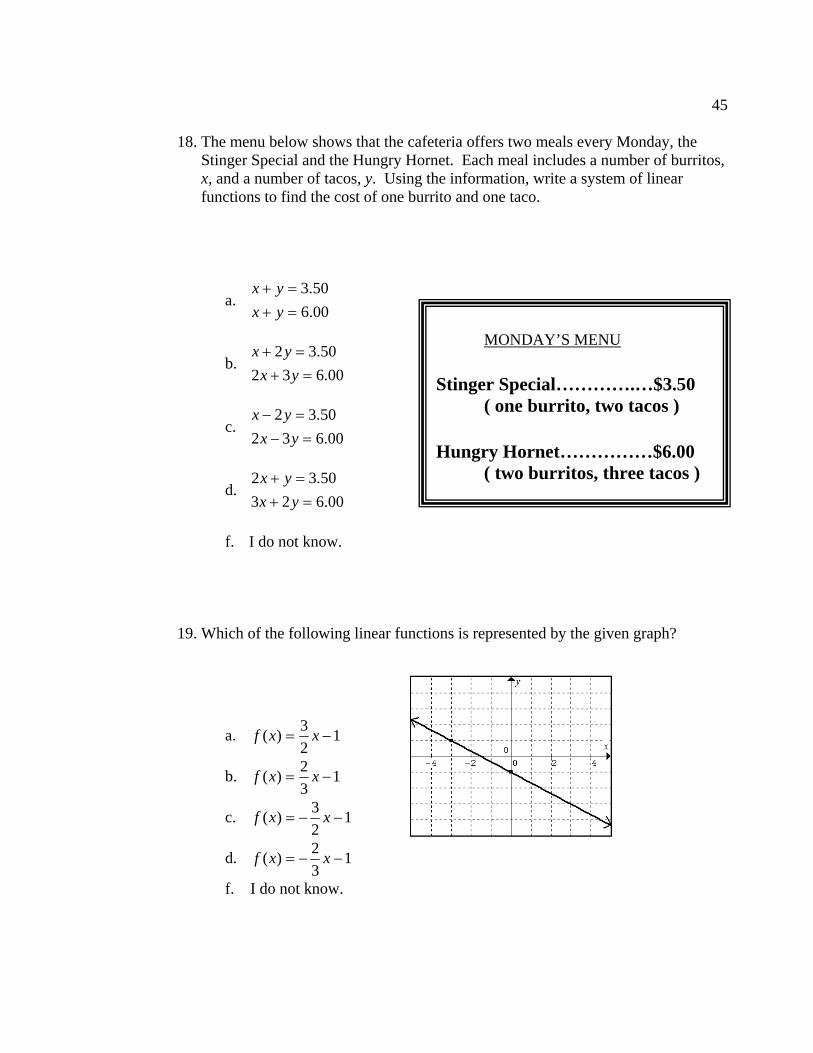
18. The menu below shows that the cafeteria offers two meals every Monday, the Stinger Special and the Hungry Hornet. Each meal includes a number of burritos, x, and a number of tacos, y. Using the information, write a system of linear functions to find the cost of one burrito and one taco.
a. 00.6
50.3
yxyx
b. 00.632
50.32
yxyx
c. 00.632
50.32
yxyx
d. 00.623
50.32
yxyx
f. I do not know.
19. Which of the following linear functions is represented by the given graph?
a. 12
3)( xxf
b. 13
2)( xxf
c. 12
3)( xxf
d. 13
2)( xxf
f. I do not know.
MONDAY’S MENU
Stinger Special………….…$3.50 ( one burrito, two tacos )
Hungry Hornet……………$6.00 ( two burritos, three tacos )

46
20. Which of the following linear functions does the given table represent?
a. 5 xy b. 92 xy c. 3 xy d. 32 xy f. I do not know.
x –4 –2 0 1 3 y 11 7 3 1 –3

APPENDIX C

48
LINEAR FUNCTIONS TEST WITH RESULTS DATA Directions: Your responses to this test will be used in a scientific study. Please answer seriously, and do not just guess. If you do not know the answer to a question, choose option f.
1. Which of the following best describes the rate of change within a linear function?
a. y-intercept b. domain c. x-intercept d. slope e. range f. I do not know.
2. Which of the following best describes the following model? “When Troy adds 5 marbles to the beaker containing water, the water level is now at 120 mL. When Cathy adds 9 more marbles to the beaker, the level reaches 210 mL.”
a. A continuous function b. A discrete function f. I do not know.
Control Pretest
Control Posttest
Treatment Pretest
Treatment Posttest
A 7% 5% 4% 10% B 6% 5% 5% 4% C 4% 3% 4% 0% D 32% 66% 35% 83% E 7% 12% 14% 2% F 44% 10% 38% 2%
Control Pretest
Control Posttest
Treatment Pretest
Treatment Posttest
A 60% 60% 53% 50% B 16% 25% 18% 50% F 22% 60% 27% 50%

49
3. In a linear function the initial condition is often referred as which of the following?
a. slope b. range c. y-intercept d. domain e. x-intercept f. I do not know.
4. After graphing a system of linear functions, the solution is seen as which of the following?
a. the slope of the lines b. the intersection of the lines c. the x- & y-intercepts of the lines f. I do not know.
5. Given the following three functions, which numbers represent their slopes. xy 32 ; 54)( xxf ; 7)1(6)( nnF
a. 2, 4, 6 b. 3, 5, 7 c. y, f, F d. 3, 4, 6 f. I do not know.
Control Pretest
Control Posttest
Treatment Pretest
Treatment Posttest
A 13% 11% 12% 10% B 6% 15% 4% 12% C 8% 16% 3% 33% D 16% 15% 14% 25% E 5% 5% 1% 2% F 51% 38% 66% 19%
Control Pretest
Control Posttest
Treatment Pretest
Treatment Posttest
A 20% 19% 26% 17% B 11% 45% 14% 54% C 41% 28% 21% 29% F 28% 7% 39% 0%
Control Pretest
Control Posttest
Treatment Pretest
Treatment Posttest
A 10% 15% 1% 8% B 7% 11% 4% 2% C 11% 4% 18% 2% D 24% 57% 25% 88% F 48% 13% 52% 0%

50
6. Which aspect of a linear function determines the steepness of the graph of its line?
a. y-intercept b. domain c. x-intercept d. slope e. range f. I do not know.
7. Consider the graph of xy . How is the graph of 5 xy different?
a. It is steeper. b. It is less steep. c. It shifts the line up on the y-axis. d. It shifts the line down on the y-axis. e. It changes it from an uphill line to a downhill line. f. I do not know.
8. Which of the following is true?
a. The slope of a vertical line is always positive. b. The slope of a vertical line is always zero. c. The slope of a vertical line is always undefined. d. The slope of a vertical line is always negative. f. I do not know.
Control Pretest
Control Posttest
Treatment Pretest
Treatment Posttest
A 16% 14% 22% 12% B 3% 1% 1% 2% C 5% 9% 4% 4% D 49% 68% 43% 73% E 6% 2% 5% 8% F 21% 6% 25% 2%
Control Pretest
Control Posttest
Treatment Pretest
Treatment Posttest
A 23% 23% 33% 27% B 7% 9% 8% 6% C 23% 49% 23% 62% D 5% 5% 1% 6% E 8% 6% 0% 0% F 34% 8% 35% 0%
Control Pretest
Control Posttest
Treatment Pretest
Treatment Posttest
A 12% 5% 9% 8% B 19% 17% 9% 27% C 30% 70% 32% 58% D 5% 2% 10% 4% F 35% 6% 39% 4%

51
9. What is the y-intercept of the line 5 3 12x y ?
a. 0,5
b. 0,12
c. 0,3
d. 0,4
f. I do not know.
10. Which of the following ordered pairs is the x-intercept on the line 5 2 20x y ?
a. 10,0
b. 0, 10
c. 4,0
d. 0,4
f. I do not know.
11. Determine the slope of the linear function represented by the following table-of-values.
a. 0 b. 1 c. 2 d. 3
e. 13
f. I do not know.
n 0 1 2 3 4 f(n) 4 7 10 13 16
Control Pretest
Control Posttest
Treatment Pretest
Treatment Posttest
A 5% 2% 0% 0% B 8% 15% 4% 2% C 24% 16% 27% 19% D 25% 57% 30% 79% F 37% 10% 39% 0%
Control Pretest
Control Posttest
Treatment Pretest
Treatment Posttest
A 5% 15% 5% 20%B 15% 14% 5% 16%C 26% 36% 25% 53%D 8% 9% 4% 4%F 45% 24% 61% 8%
Control Pretest
Control Posttest
Treatment Pretest
Treatment Posttest
A 5% 5% 1% 0% B 6% 4% 0% 10% C 12% 8% 1% 2% D 16% 32% 31% 50% E 8% 23% 10% 27% F 53% 29% 56% 12%

52
12. Which of the following is the solution to the system of
equations:
4 143
x yy x
a. 2,6
b. 2, 6
c. 4, 14
d. 4,3
f. I do not know.
13. The x-values of the linear function, 45)( xxf , are also known as the function’s:
a. range b. independent values c. slope d. dependent values f. I do not know.
Control Pretest
Control Posttest
Treatment Pretest
Treatment Posttest
A 9% 7% 8% 8% B 23% 58% 26% 75% C 9% 3% 3% 4% D 12% 11% 4% 10% F 48% 21% 60% 4%
Control Pretest
Control Posttest
Treatment Pretest
Treatment Posttest
A 10% 9% 7% 15% B 17% 21% 11% 25% C 16% 33% 4% 25% D 13% 17% 14% 31% F 44% 20% 64% 4%

53
14. Which of the following lines is parallel to 6 2 8x y ?
a. 3 1y x
b. 14
3y x
c. 3 9y x
d. 18
3y x
f. I do not know.
15. Which of the following best describes the following graph?
a. A continuous function b. A discrete function f. I do not know.
Control Pretest
Control Posttest
Treatment Pretest
Treatment Posttest
A 12% 18% 6% 21% B 14% 31% 12% 13% C 10% 22% 4% 56% D 3% 11% 6% 6% F 60% 18% 71% 2%
Control Pretest
Control Posttest
Treatment Pretest
Treatment Posttest
A 62% 56% 64% 65% B 22% 40% 18% 29% F 14% 4% 17% 6%

54
16. Which of the following does not represent the slope (m) of a linear function?
a. rate of change
b. runrise
c. 12
12
xxyy
d. yinchangexinchange
e. xy
f. I do not know.
17. Find the slope of the line passing through the points 2, 3 4,5and . (Use the
graph, if necessary.)
a. 3
4
b. 3
4
c. 4
3
d. 4
3
f. I do not know.
Control Pretest
Control Posttest
Treatment Pretest
Treatment Posttest
A 13% 42% 8% 21% B 9% 8% 9% 4% C 12% 8% 5% 19% D 13% 15% 8% 29% E 17% 20% 16% 25% F 37% 6% 55% 2%
Control Pretest
Control Posttest
Treatment Pretest
Treatment Posttest
A 6% 5% 9% 6% B 17% 22% 9% 23% C 12% 7% 10% 10% D 11% 47% 19% 50% F 53% 19% 52% 12%
55
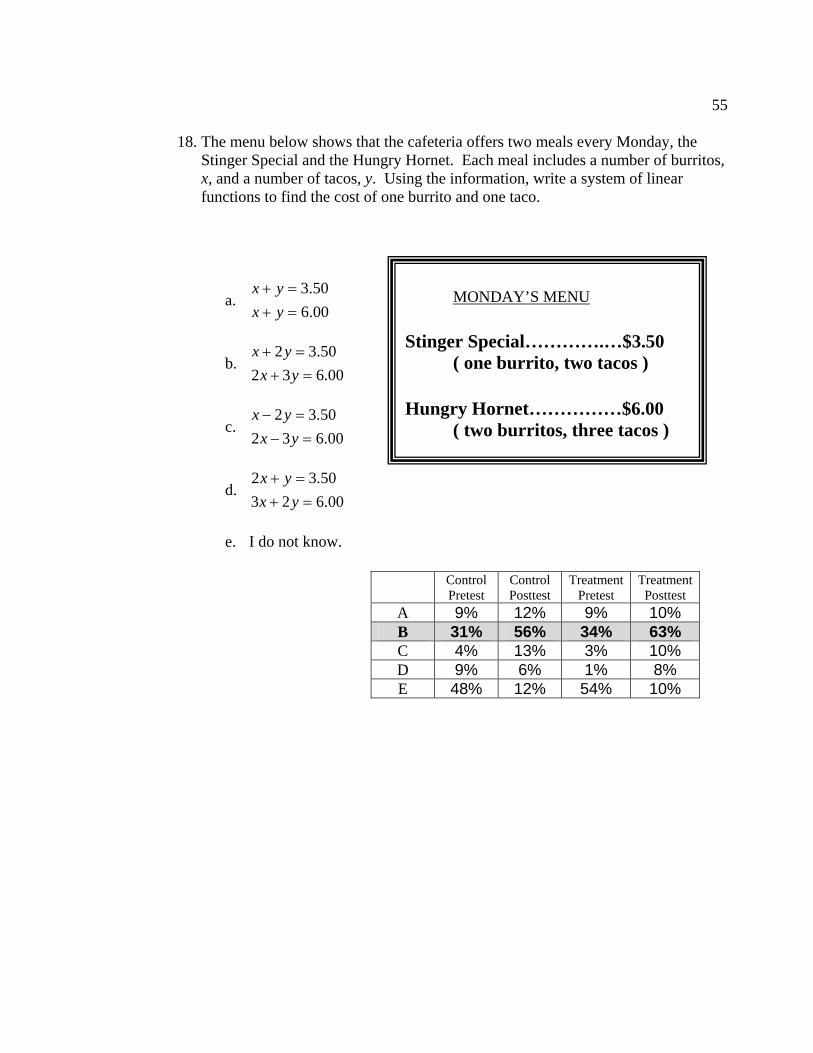
18. The menu below shows that the cafeteria offers two meals every Monday, the Stinger Special and the Hungry Hornet. Each meal includes a number of burritos, x, and a number of tacos, y. Using the information, write a system of linear functions to find the cost of one burrito and one taco.
a. 00.6
50.3
yxyx
b. 00.632
50.32
yxyx
c. 00.632
50.32
yxyx
d. 00.623
50.32
yxyx
e. I do not know.
MONDAY’S MENU
Stinger Special………….…$3.50 ( one burrito, two tacos )
Hungry Hornet……………$6.00 ( two burritos, three tacos )
Control Pretest
Control Posttest
Treatment Pretest
Treatment Posttest
A 9% 12% 9% 10% B 31% 56% 34% 63% C 4% 13% 3% 10% D 9% 6% 1% 8% E 48% 12% 54% 10%

56
19. Which of the following linear functions is represented by the given graph?
a. 12
3)( xxf
b. 13
2)( xxf
c. 12
3)( xxf
d. 13
2)( xxf
f. I do not know.
20. Which of the following linear functions does the given table represent?
a. 5 xy b. 92 xy c. 3 xy d. 32 xy f. I do not know.
x –4 –2 0 1 3 y 11 7 3 1 –3
Control Pretest
Control Posttest
Treatment Pretests
Treatment Posttest
A 8% 11% 5% 4% B 6% 22% 8% 13% C 11% 14% 5% 10% D 10% 42% 18% 69% F 65% 10% 64% 4%
Control Pretest
Control Posttest
Treatment Pretest
Treatment Posttest
A 7% 5% 5% 6% B 10% 15% 15% 12% C 5% 11% 11% 6% D 18% 31% 31% 60% F 59% 38% 38% 17%

APPENDIX D
58
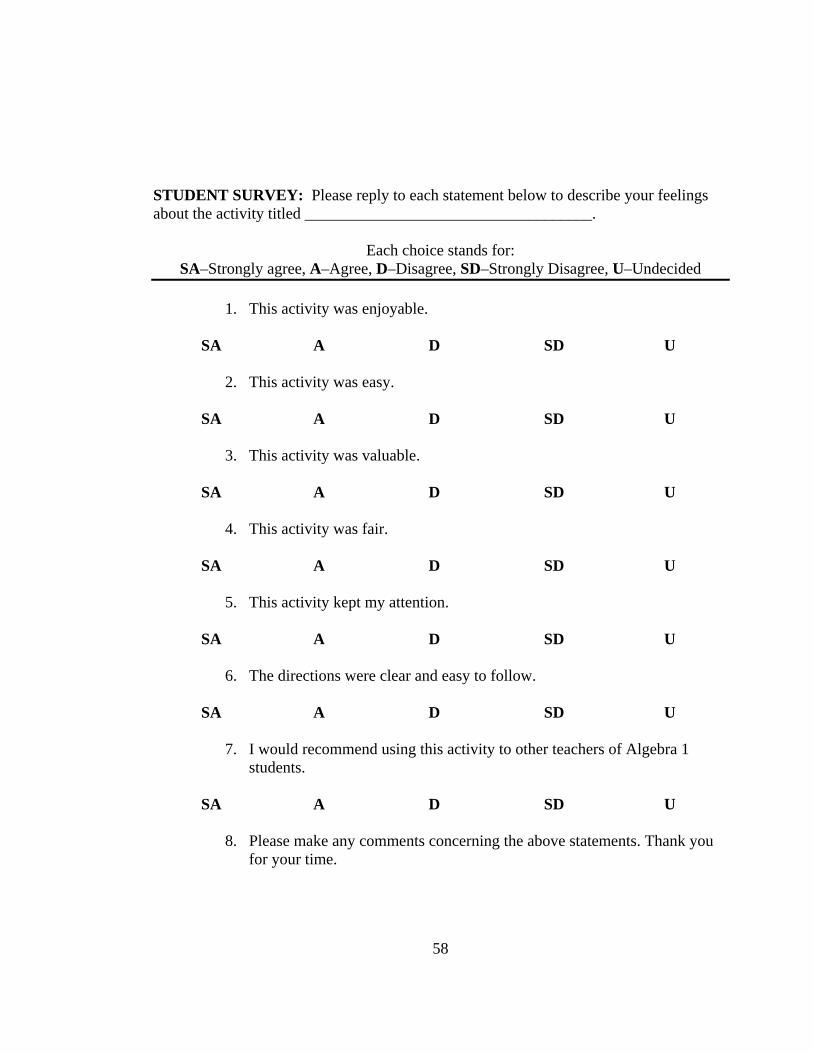
STUDENT SURVEY: Please reply to each statement below to describe your feelings about the activity titled ____________________________________.
Each choice stands for: SA–Strongly agree, A–Agree, D–Disagree, SD–Strongly Disagree, U–Undecided
1. This activity was enjoyable.
SA A D SD U
2. This activity was easy.
SA A D SD U
3. This activity was valuable.
SA A D SD U
4. This activity was fair.
SA A D SD U
5. This activity kept my attention.
SA A D SD U
6. The directions were clear and easy to follow.
SA A D SD U
7. I would recommend using this activity to other teachers of Algebra 1 students.
SA A D SD U
8. Please make any comments concerning the above statements. Thank you
for your time.

APPENDIX E

60
TEACHER SURVEY: Please reply to each statement below to describe your feelings about activity titled ___________________________________________________.
Each choice stands for: SA–Strongly agree, A–Agree, D–Disagree, SD–Strongly Disagree, U–Undecided
1. I feel this activity is connected to the California Content Standards listed in the introduction to the activity. SA A D SD U
2. I feel this activity has reasonable objectives for the students.
SA A D SD U
3. I feel this activity is more engaging that other lessons I have used to teach the same topic/standard. SA A D SD U
4. I would recommend using this activity to other teachers of algebra students. SA A D SD U
5. I feel students have more knowledge of the concepts covered because of this activity. SA A D SD U
6. The directions were clear and easy to follow. SA A D SD U
7. The activity addresses various learning styles. SA A D SD U
8. I feel this activity engages and motivates students. SA A D SD U
9. Please make any comments concerning the above statements. (Use the back of this survey, if necessary.) Thank you for your time.

APPENDIX F

62
STUDENT SURVEY COMMENTS
Pre
dic
tab
le P
atte
rns
It was ok overall. Fun, Fun Start off with linear equations first and then harder ones. I liked it, it helped me understand tables. There wasn't any concerns, it was fun. It was a little confusing at first but Mr. R showed us how and made it easy. I couldn't figure out the last two. I think it could be harder. Instructions were kind of useless. Explain how to do it better. (Give an example) This activity was enjoyable and it was something new for us to do something fun
and easy. I thought it needed an example. The activity confused me a bit. The last two pages were hard. Work in partners more? I felt that this activity was easy but fun to learn about and capable of I knew this
chapter pretty well before we did it so it was very easy.. The wording was confusing at the beginning but then I caught on. We should do more partner activities. Once you got it, it was easy.
Th
e T
ower
of
Tu
mb
lers
The directions were clear and easy to follow. I didn't enjoy it. To me, math is never enjoyable. Make the lab easier. I didn't like it. It would have been easy but for some reason I didn't quite understand it.
All
Tie
d U
p in
Kn
ots
It was fun and easy to follow. This was too easy. It was difficult to understand but different. I think it was definitely easy and clear to understand when verbally explained.
Before doing the assignment, maybe we should go over the problems as a class. Some of the written questions confused me but it was clarified as we went
through it. I didn't really know what was going on.
63
Inte
rcep
ts in
Rea
l Lif
e
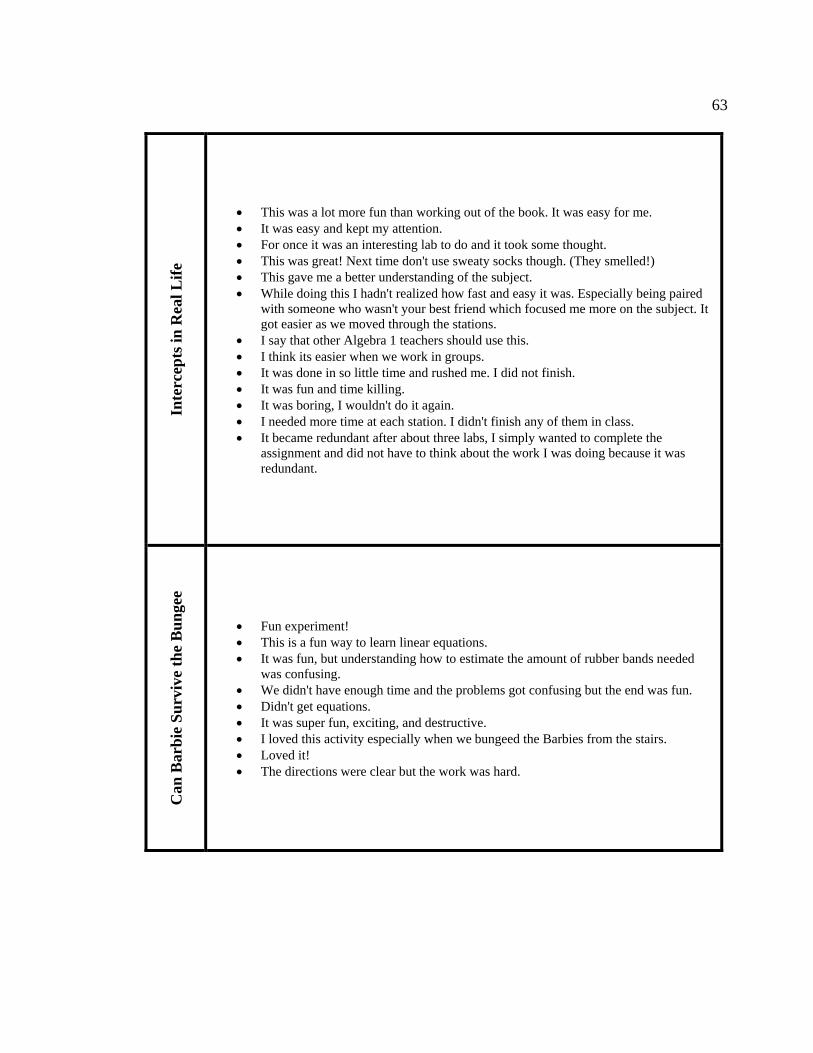
This was a lot more fun than working out of the book. It was easy for me. It was easy and kept my attention. For once it was an interesting lab to do and it took some thought. This was great! Next time don't use sweaty socks though. (They smelled!) This gave me a better understanding of the subject. While doing this I hadn't realized how fast and easy it was. Especially being paired
with someone who wasn't your best friend which focused me more on the subject. It got easier as we moved through the stations.
I say that other Algebra 1 teachers should use this. I think its easier when we work in groups. It was done in so little time and rushed me. I did not finish. It was fun and time killing. It was boring, I wouldn't do it again. I needed more time at each station. I didn't finish any of them in class. It became redundant after about three labs, I simply wanted to complete the
assignment and did not have to think about the work I was doing because it was redundant.
Can
Bar
bie
Su
rviv
e th
e B
un
gee
Fun experiment! This is a fun way to learn linear equations. It was fun, but understanding how to estimate the amount of rubber bands needed
was confusing. We didn't have enough time and the problems got confusing but the end was fun. Didn't get equations. It was super fun, exciting, and destructive. I loved this activity especially when we bungeed the Barbies from the stairs. Loved it! The directions were clear but the work was hard.

APPENDIX G

65
1
Goal: Students will understand the concepts of rate of change initial
condition from the study of patterns Objectives: Students will be able to:
1. Graph a set of discrete data on a coordinate plane. 2. Derive a linear or non-linear equation from a set of data. 3. Determine if a function from a set of data is linear or non-
linear.
California Content Standards in Algebra 1: 6.0 Students graph a linear equation. California Content Standards in Grade 7: 3.0 Students graph and interpret linear and some nonlinear Functions. Multiple Intelligence(s): Bodily/Kinesthetic, Visual/Spatial, Interpersonal and
Mathematical/Logical Lesson Length: One 50-minute class period. Materials:
Either individual copies of the warm-up or an overhead transparency copy.
Choose 6 – 10 of the linear function pattern (pages 5 – 14) as well as 2 – 4 of the non-linear function patterns (pages 15 – 18). Make copies for each individual student or have the students work in pairs.
Individual copies of the post activity Quiz.
Optional: Each graph could be done with color pencils
to visually enhance of the activity. Assessment: Classwork, Homework and Quiz. References: The Pattern and Function Connection, Fulton and Lombard. Extensions: Students could create their own Predictable Patterns using
different shapes, then exchange them with a partner to solve and complete in class.
Attachments: Warm-up and KEY (pages 3 & 4), the pattern worksheets (pages
5 – 18), homework (pages 19 – 22), the answer KEY (page 23), the quiz and answer KEY (pages 24 – 26)
Teacher Notes – “Predictable Patterns“

66
2
Directions:
1. Start the student individually with the warm-up (page 3). {5 – 10 min}
2. Have student volunteers complete the warm-up problems on the board and check for understanding. {5 min}
3. Explain the goals of the day, and then have students either work individually or in pairs.
4. Give them approximately 25 – 30 minutes to compete. 5. Have student compare answers and check for understanding
with their peers. {5 min}
Closure:
1. Discuss the new concepts of rate of change, initial condition and their graphical relationships. Also discrete functions and linear versus non-linear functions.
2. Discuss the challenges and successes of this activity 3. Assign the homework due tomorrow. 4. Inform them of the possibility of a Quiz in the future.
Ideas adapted from The Pattern and Function Connection by Teacher to Teacher Press

67
4
Using the following domain {-2, -1, 0, 1, 2, 3, } to create a table of values, then write the range for each of the functions. 1. g(x) = 4x – 1
x -2 -1 0 1 2 3 G(x) –9 –5 –1 3 7 11
Range = { –9, –5, –1, 3, 7, 11}
2. y = –x + 5
x -2 -1 0 1 2 3 y 7 6 5 4 3 2
Range = { 2, 3, 4, 5, 6, 7}
3. v(t) = 3t2 – 4
t –2 –1 0 1 2 3 v(t) 8 –1 –4 –1 8 23
Range = { –4, –1, 8, 23}
4. A(r) = – r + 3
r -2 -1 0 1 2 3 A(r) 4 3.5 3 2.5 2 1.5
Range = { , 2, , 3, , 4}
“Predictable Patterns“ – Warm-up KEY
68
5
1
2
3
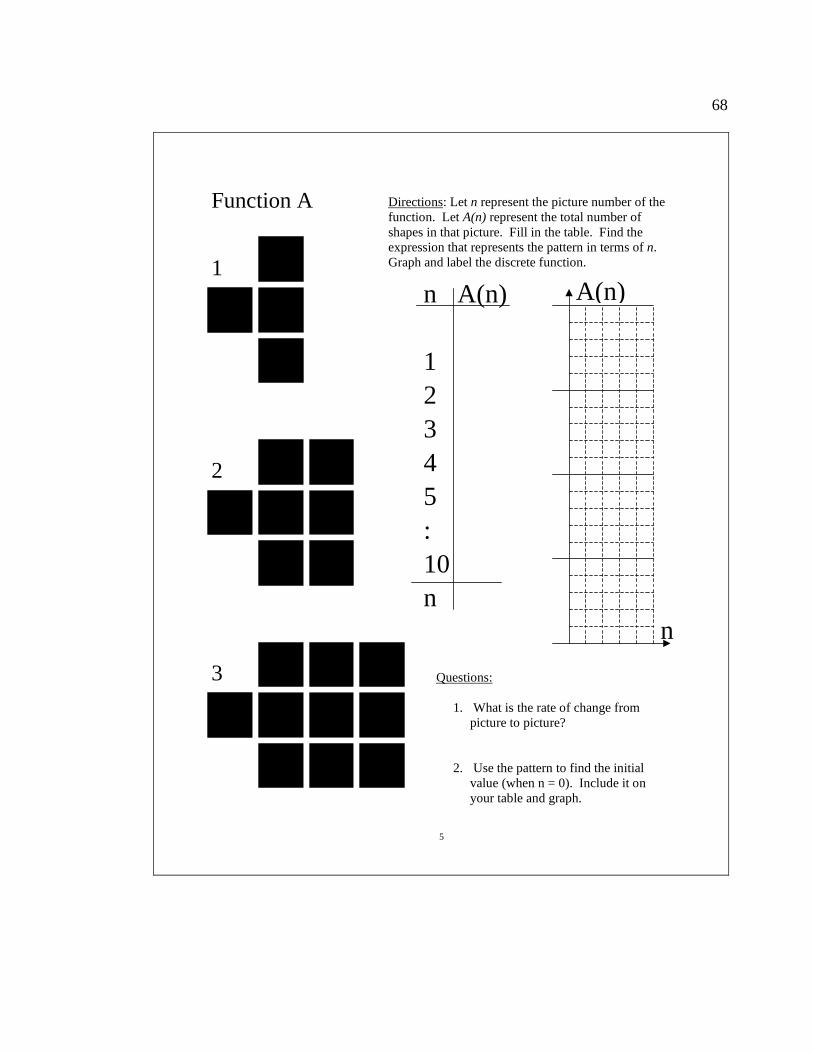
Function A Directions: Let n represent the picture number of the function. Let A(n) represent the total number of shapes in that picture. Fill in the table. Find the expression that represents the pattern in terms of n. Graph and label the discrete function.
n
A(n) n A(n) 1 2 3 4 5 : 10 n
Questions:
1. What is the rate of change from picture to picture?
2. Use the pattern to find the initial value (when n = 0). Include it on your table and graph.

69
6
1
2
3
Function B Directions: Let n represent the picture number of the function. Let B(n) represent the total number of shapes in that picture. Fill in the table. Find the expression that represents the pattern in terms of n. Graph and label the discrete function.
n
B(n) n B(n) 1 2 3 4 5 : 10 n
Questions:
1. What is the rate of change from picture to picture?
2. Use the pattern to find the initial value (when n = 0). Include it on your table and graph.
70
7
1
2
3
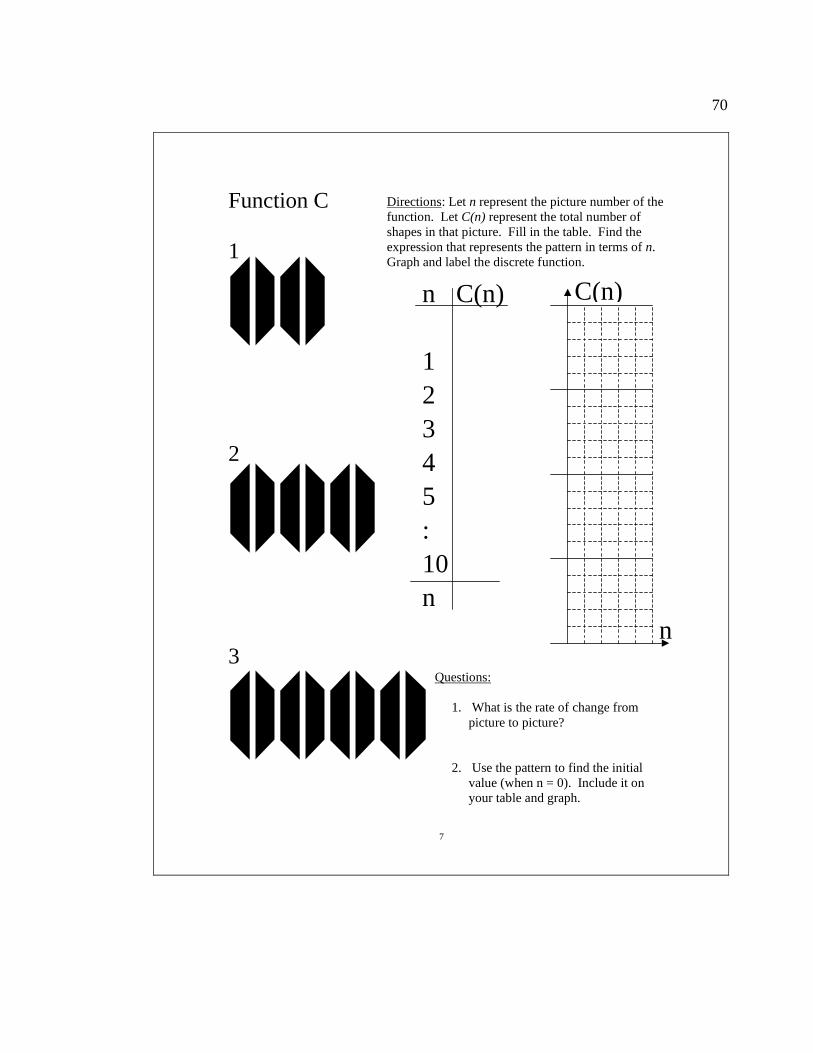
Function C Directions: Let n represent the picture number of the function. Let C(n) represent the total number of shapes in that picture. Fill in the table. Find the expression that represents the pattern in terms of n. Graph and label the discrete function.
n
C(n) n C(n) 1 2 3 4 5 : 10 n
Questions:
1. What is the rate of change from picture to picture?
2. Use the pattern to find the initial value (when n = 0). Include it on your table and graph.
71
8
1
2
3
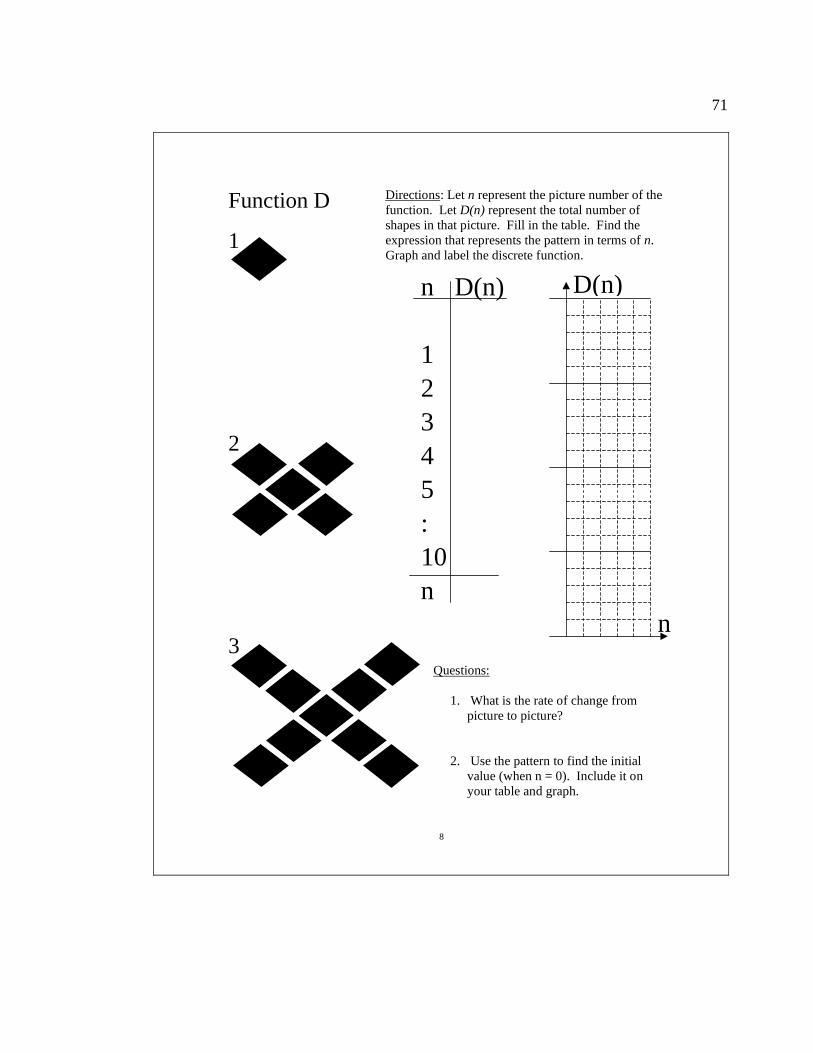
Function D Directions: Let n represent the picture number of the function. Let D(n) represent the total number of shapes in that picture. Fill in the table. Find the expression that represents the pattern in terms of n. Graph and label the discrete function.
n
D(n) n D(n) 1 2 3 4 5 : 10 n
Questions:
1. What is the rate of change from picture to picture?
2. Use the pattern to find the initial value (when n = 0). Include it on your table and graph.

72
9
1
2
3
Function G Directions: Let n represent the picture number of the function. Let G(n) represent the total number of shapes in that picture. Fill in the table. Find the expression that represents the pattern in terms of n. Graph and label the discrete function.
n
G(n) n G(n) 1 2 3 4 5 : 10 n
Questions:
1. What is the rate of change from picture to picture?
2. Use the pattern to find the initial value (when n = 0). Include it on your table and graph.
73
10
1
2
3
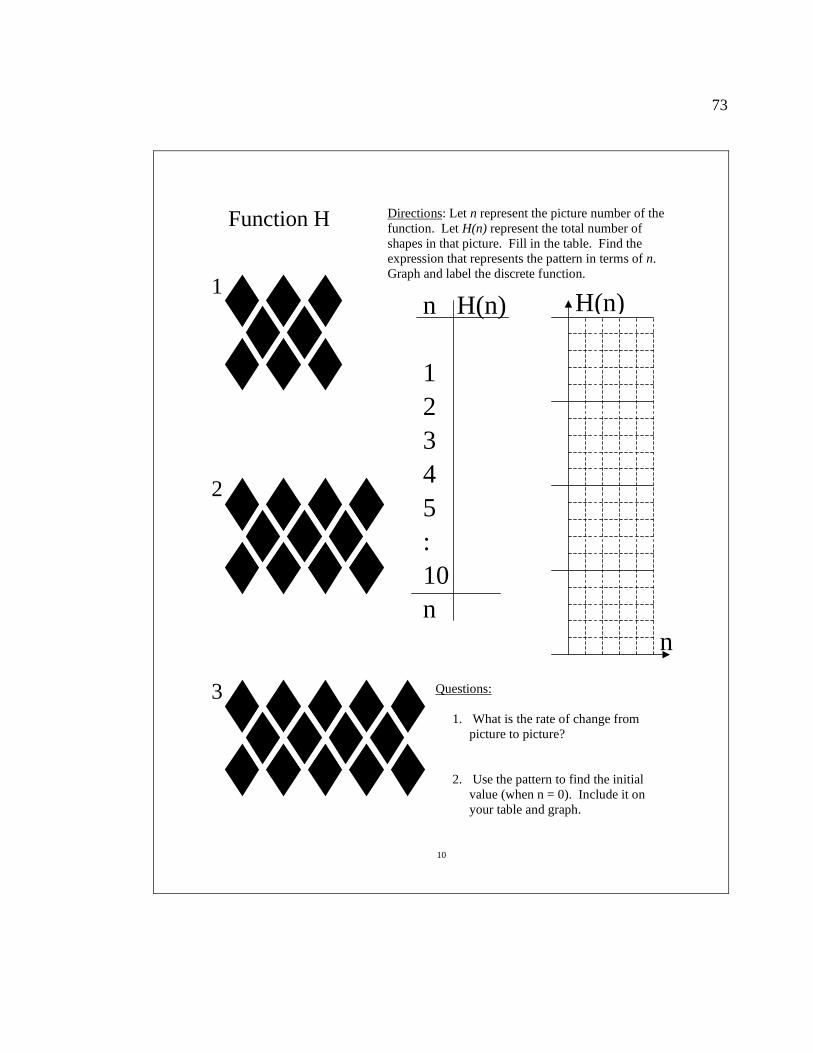
Function H Directions: Let n represent the picture number of the function. Let H(n) represent the total number of shapes in that picture. Fill in the table. Find the expression that represents the pattern in terms of n. Graph and label the discrete function.
n
H(n) n H(n) 1 2 3 4 5 : 10 n
Questions:
1. What is the rate of change from picture to picture?
2. Use the pattern to find the initial value (when n = 0). Include it on your table and graph.
74
11
1
2
3
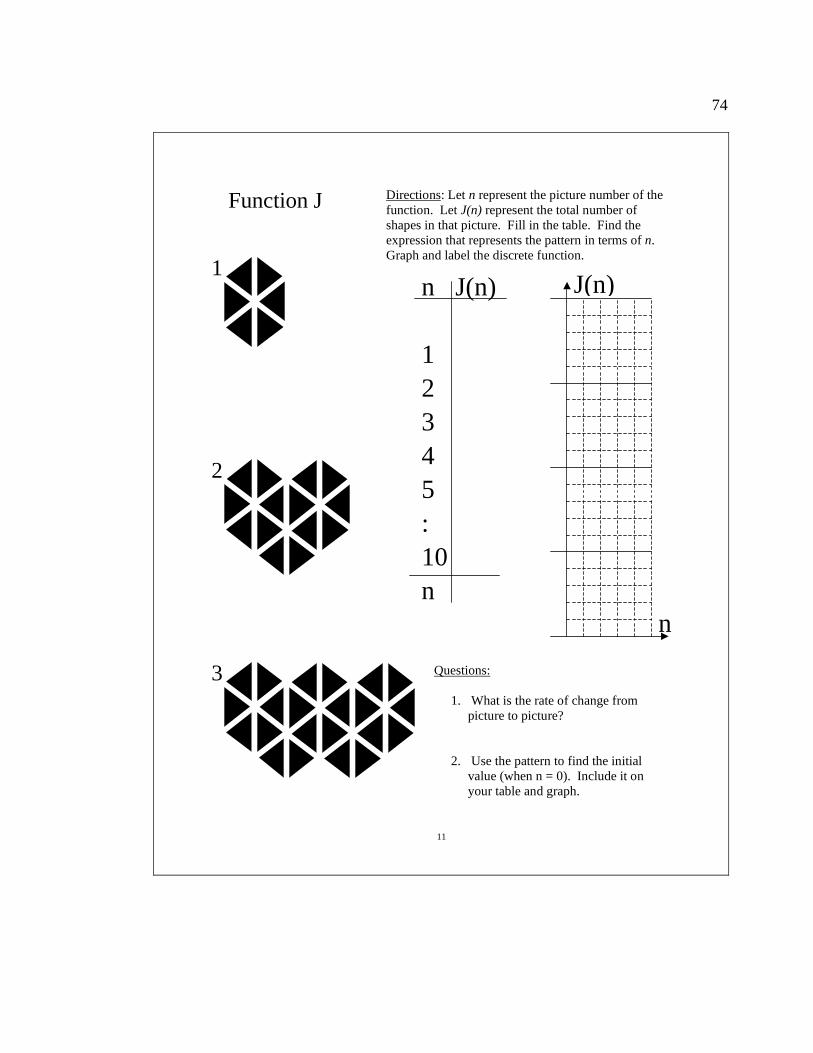
Function J Directions: Let n represent the picture number of the function. Let J(n) represent the total number of shapes in that picture. Fill in the table. Find the expression that represents the pattern in terms of n. Graph and label the discrete function.
n
J(n) n J(n) 1 2 3 4 5 : 10 n
Questions:
1. What is the rate of change from picture to picture?
2. Use the pattern to find the initial value (when n = 0). Include it on your table and graph.

75
12
1
2
3
Function K Directions: Let n represent the picture number of the function. Let K(n) represent the total number of shapes in that picture. Fill in the table. Find the expression that represents the pattern in terms of n. Graph and label the discrete function.
n
K(n) n K(n) 1 2 3 4 5 : 10 n
Questions:
1. What is the rate of change from picture to picture?
2. Use the pattern to find the initial value (when n = 0). Include it on your table and graph.
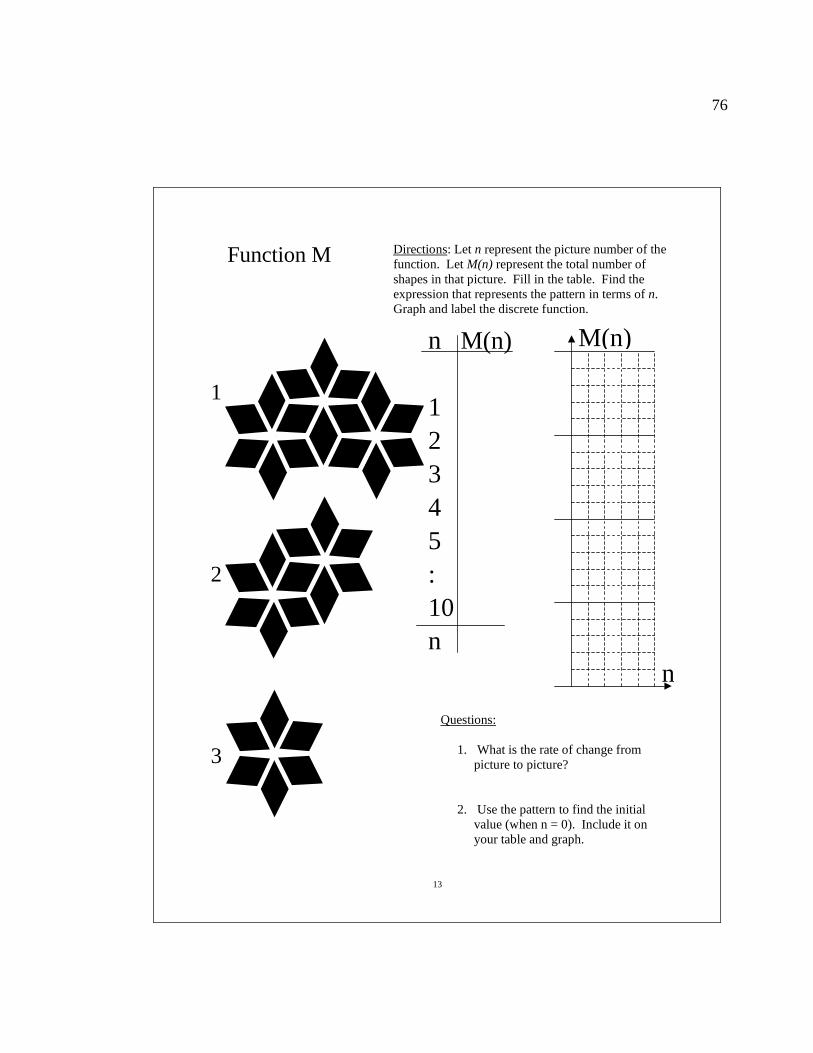
76
13
2
1
3
Function M Directions: Let n represent the picture number of the function. Let M(n) represent the total number of shapes in that picture. Fill in the table. Find the expression that represents the pattern in terms of n. Graph and label the discrete function.
n
M(n) n M(n) 1 2 3 4 5 : 10 n
Questions:
1. What is the rate of change from picture to picture?
2. Use the pattern to find the initial value (when n = 0). Include it on your table and graph.
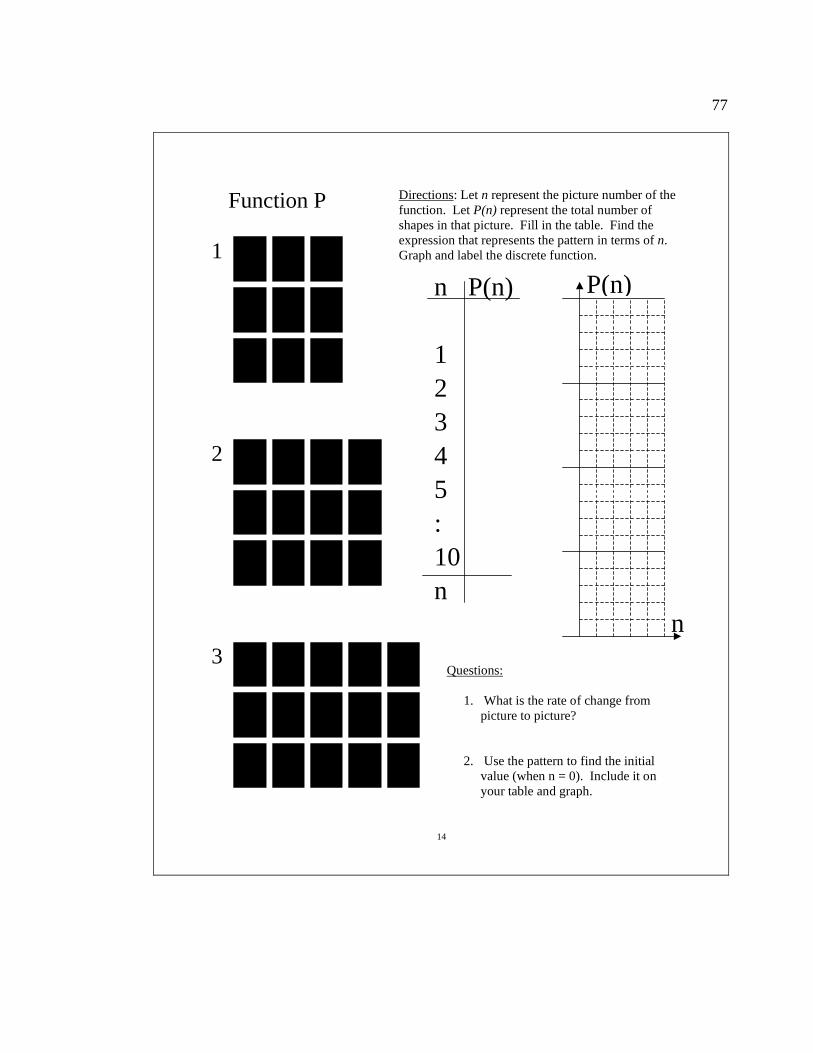
77
14
1
2
3
Function P Directions: Let n represent the picture number of the function. Let P(n) represent the total number of shapes in that picture. Fill in the table. Find the expression that represents the pattern in terms of n. Graph and label the discrete function.
n
P(n) n P(n) 1 2 3 4 5 : 10 n
Questions:
1. What is the rate of change from picture to picture?
2. Use the pattern to find the initial value (when n = 0). Include it on your table and graph.
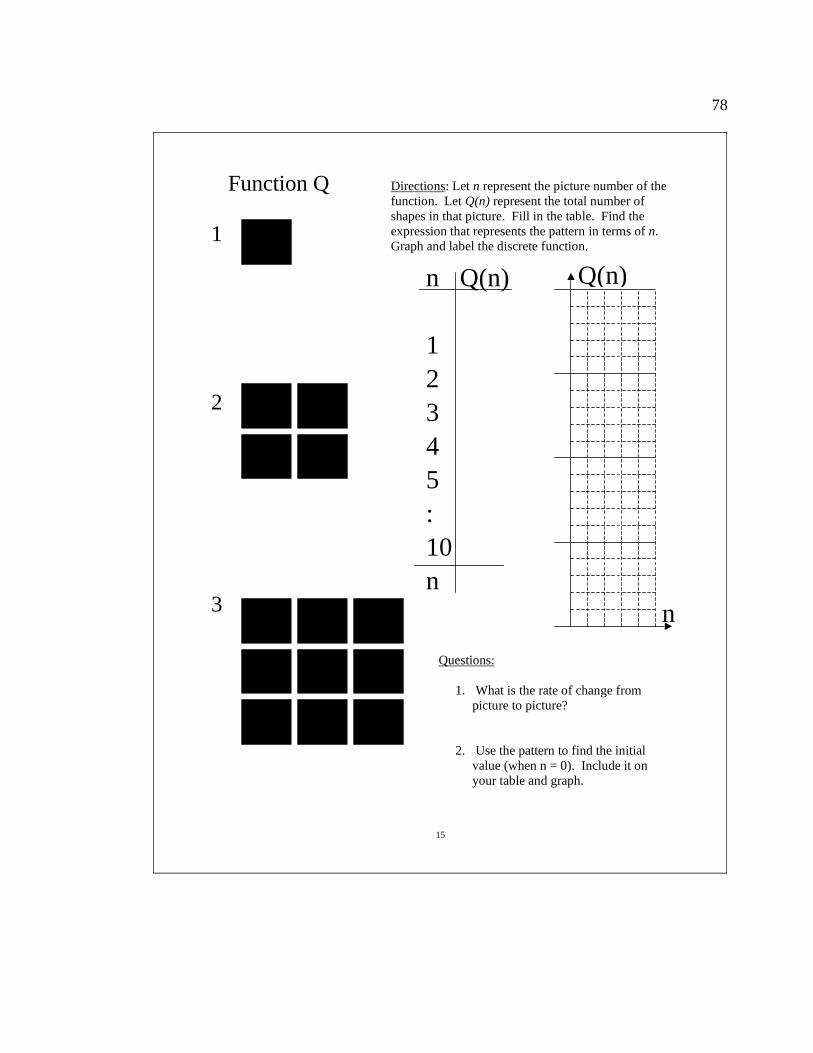
78
15
1
2
3
Function Q Directions: Let n represent the picture number of the function. Let Q(n) represent the total number of shapes in that picture. Fill in the table. Find the expression that represents the pattern in terms of n. Graph and label the discrete function.
n
Q(n) n Q(n) 1 2 3 4 5 : 10 n
Questions:
1. What is the rate of change from picture to picture?
2. Use the pattern to find the initial value (when n = 0). Include it on your table and graph.

79
16
1
2
3
Function R Directions: Let n represent the picture number of the function. Let R(n) represent the total number of shapes in that picture. Fill in the table. Find the expression that represents the pattern in terms of n. Graph and label the discrete function.
n
R(n) n R(n) 1 2 3 4 5 : 10 n
Questions:
1. What is the rate of change from picture to picture?
2. Use the pattern to find the initial value (when n = 0). Include it on your table and graph.
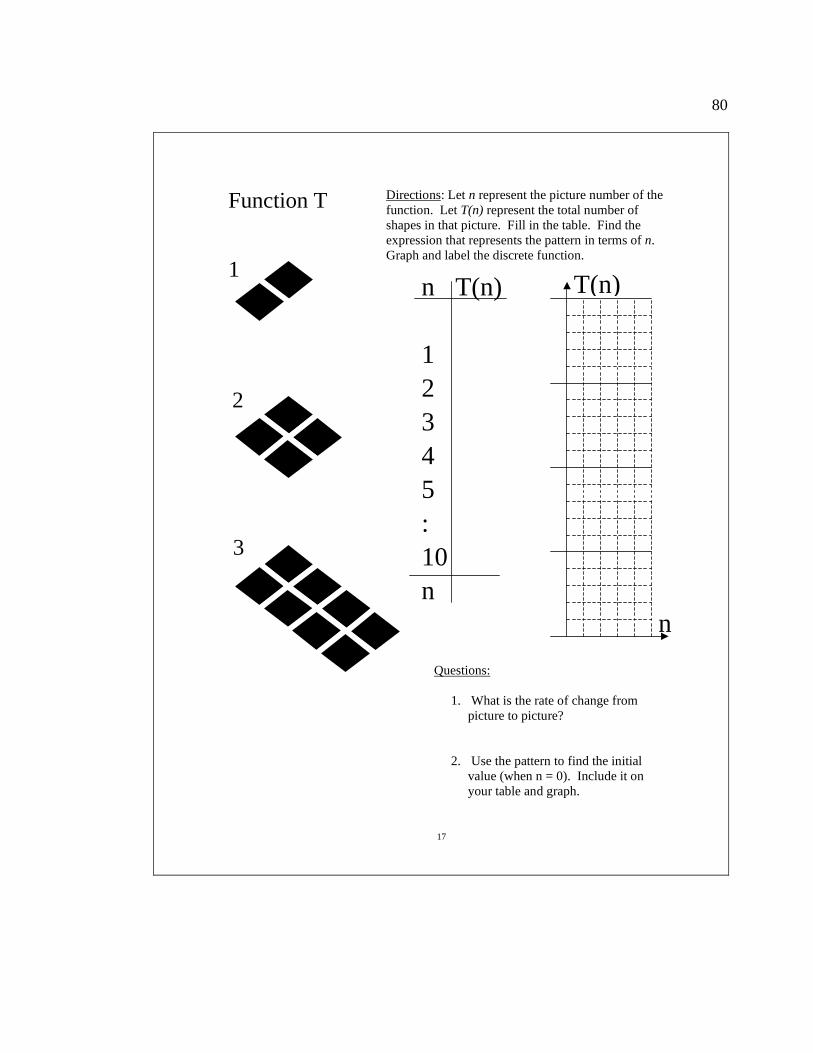
80
17
1
2
3
Function T Directions: Let n represent the picture number of the function. Let T(n) represent the total number of shapes in that picture. Fill in the table. Find the expression that represents the pattern in terms of n. Graph and label the discrete function.
n
T(n) n T(n) 1 2 3 4 5 : 10 n
Questions:
1. What is the rate of change from picture to picture?
2. Use the pattern to find the initial value (when n = 0). Include it on your table and graph.
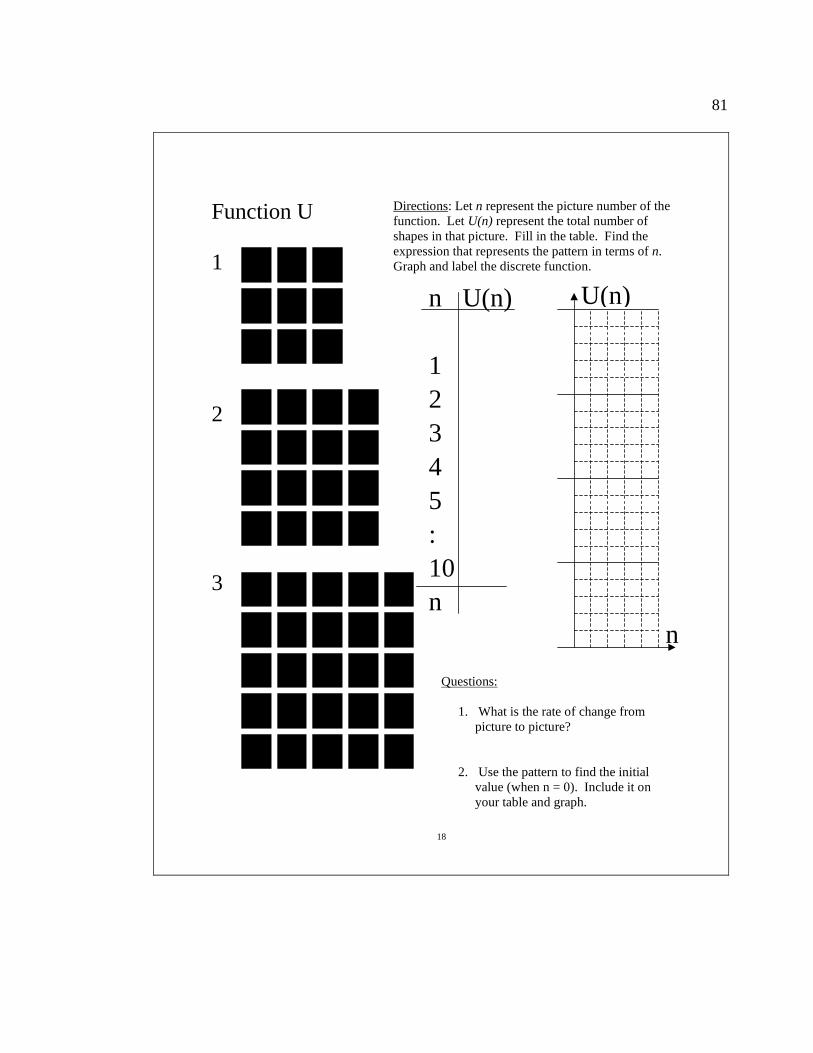
81
18
1
2
3
Function U Directions: Let n represent the picture number of the function. Let U(n) represent the total number of shapes in that picture. Fill in the table. Find the expression that represents the pattern in terms of n. Graph and label the discrete function.
n
U(n) n U(n) 1 2 3 4 5 : 10 n
Questions:
1. What is the rate of change from picture to picture?
2. Use the pattern to find the initial value (when n = 0). Include it on your table and graph.

82
19
1
2
3
Function E Directions: Let n represent the picture number of the function. Let E(n) represent the total number of shapes in that picture. Fill in the table. Find the expression that represents the pattern in terms of n. Graph and label the discrete function.
n
E(n) n E(n) 1 2 3 4 5 : 10 n
Questions:
1. What is the rate of change from picture to picture?
2. Use the pattern to find the initial value (when n = 0). Include it on your table and graph.
“Predictable Patterns“ - Homework
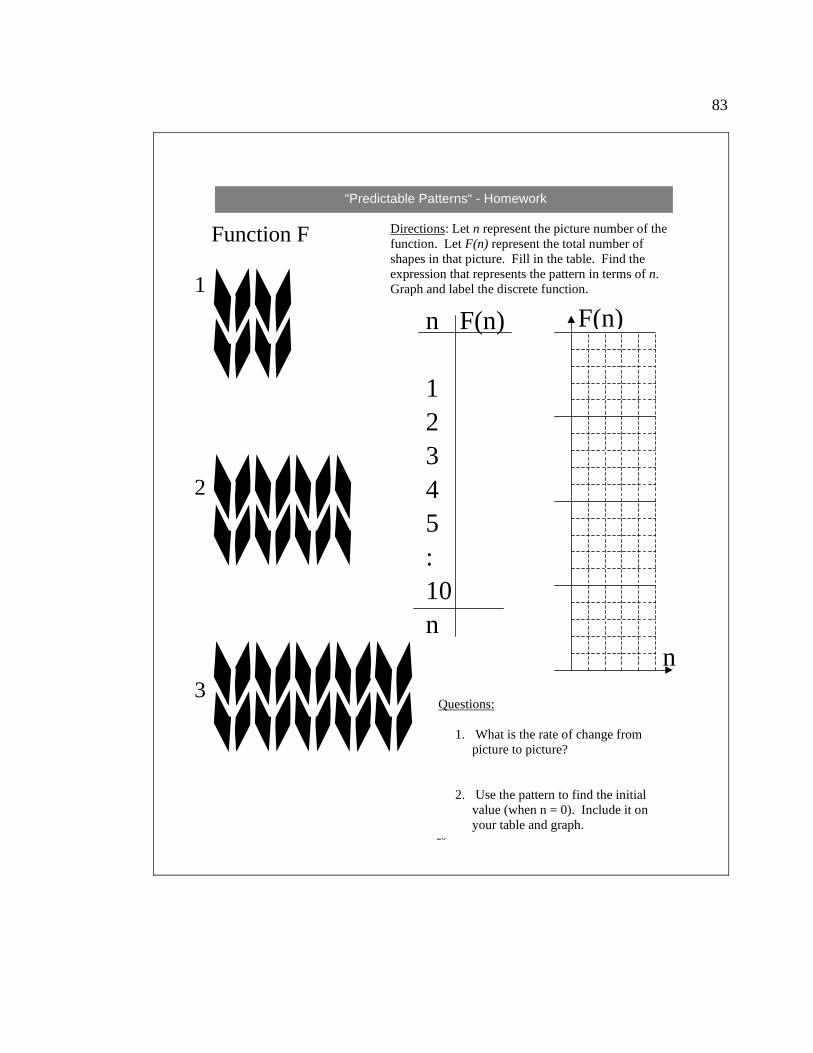
83
20
1
2
3
Function F Directions: Let n represent the picture number of the function. Let F(n) represent the total number of shapes in that picture. Fill in the table. Find the expression that represents the pattern in terms of n. Graph and label the discrete function.
n
F(n) n F(n) 1 2 3 4 5 : 10 n
Questions:
1. What is the rate of change from picture to picture?
2. Use the pattern to find the initial value (when n = 0). Include it on your table and graph.
“Predictable Patterns“ - Homework

84
21
1
2
3
Function L Directions: Let n represent the picture number of the function. Let L(n) represent the total number of shapes in that picture. Fill in the table. Find the expression that represents the pattern in terms of n. Graph and label the discrete function.
n
L(n) n L(n) 1 2 3 4 5 : 10 n
Questions:
1. What is the rate of change from picture to picture?
2. Use the pattern to find the initial value (when n = 0). Include it on your table and graph.
“Predictable Patterns“ - Homework

85
22
1
2
3
Function W
“Predictable Patterns“ - Homework
Directions: Let n represent the picture number of the function. Let W(n) represent the total number of shapes in that picture. Using the given expression that represents the pattern in terms of n, draw a possible picture for n = 1, 2 & 3. Then fill in the table. Also, graph and label the discrete function.
n
W(n) n W(n)
1 2 3 4 5 : 10 n 2n – 1
Questions:
1. What is the rate of change from picture to picture?
2. Use the pattern to find the initial value (when n = 0). Include it on your table and graph.
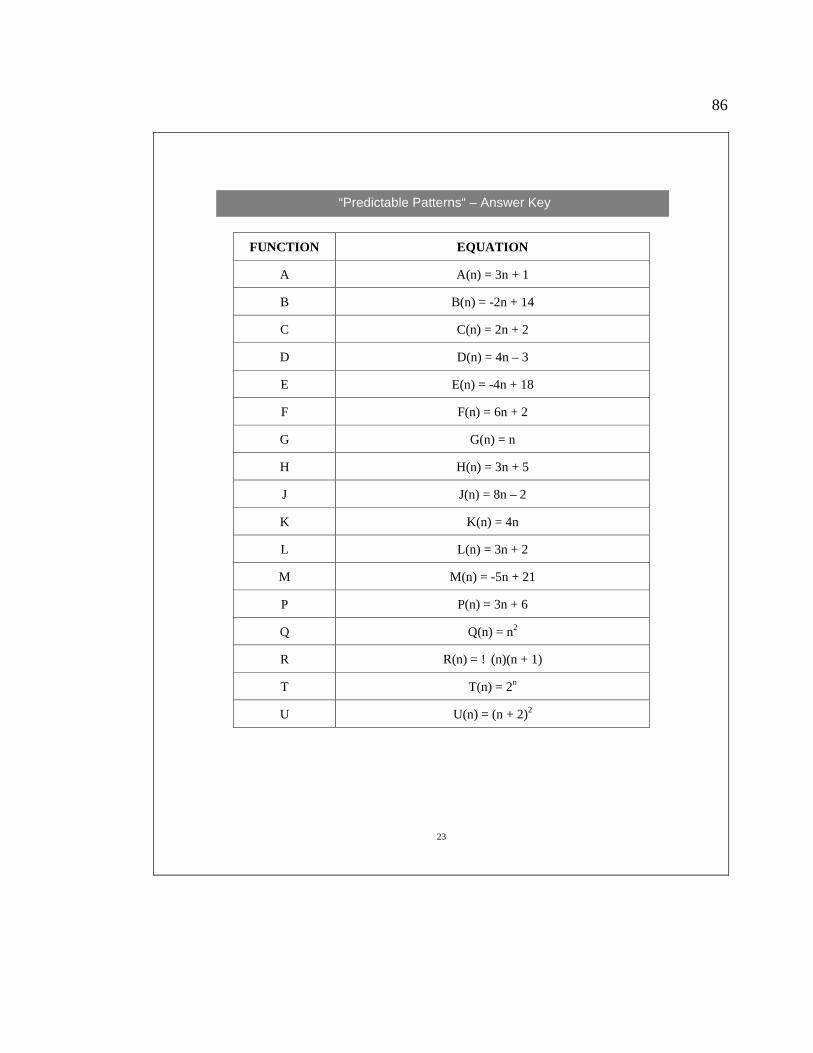
86
23
FUNCTION EQUATION
A A(n) = 3n + 1
B B(n) = -2n + 14
C C(n) = 2n + 2
D D(n) = 4n – 3
E E(n) = -4n + 18
F F(n) = 6n + 2
G G(n) = n
H H(n) = 3n + 5
J J(n) = 8n – 2
K K(n) = 4n
L L(n) = 3n + 2
M M(n) = -5n + 21
P P(n) = 3n + 6
Q Q(n) = n2
R R(n) = ! (n)(n + 1)
T T(n) = 2n
U U(n) = (n + 2)2
“Predictable Patterns“ – Answer Key
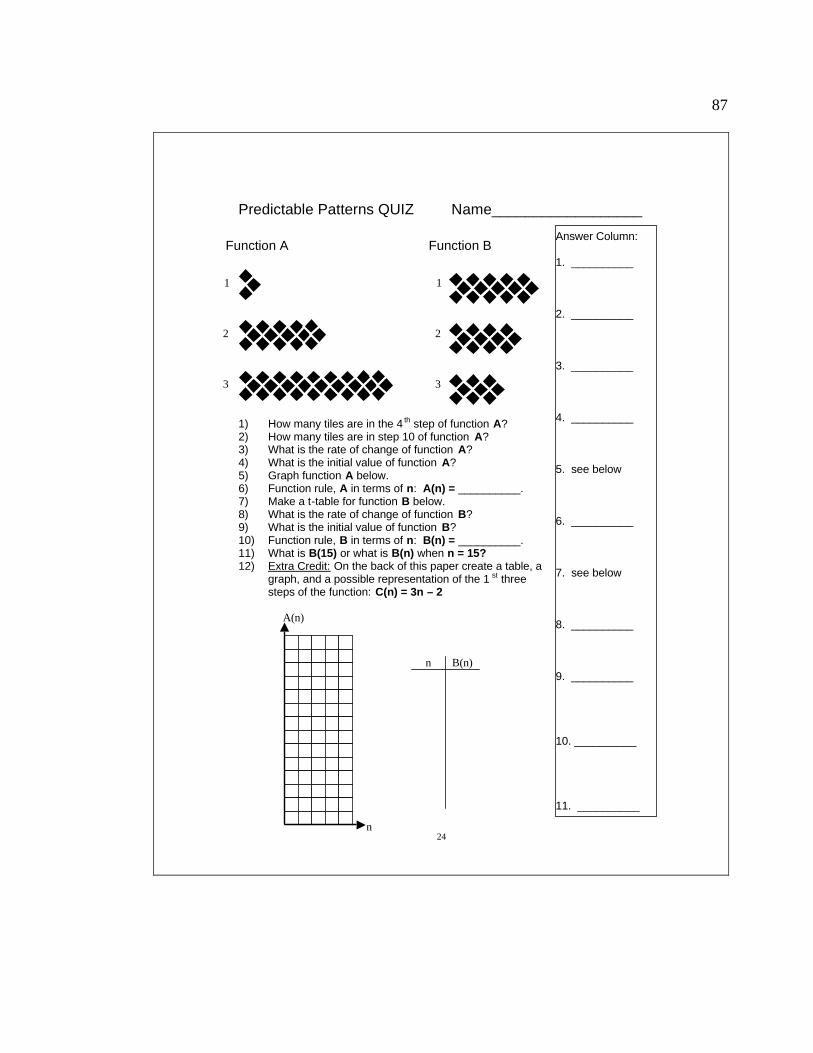
87
24
Predictable Patterns QUIZ Name__________________
1) How many tiles are in the 4 th step of function A? 2) How many tiles are in step 10 of function A? 3) What is the rate of change of function A? 4) What is the initial value of function A? 5) Graph function A below. 6) Function rule, A in terms of n: A(n) = __________. 7) Make a t-table for function B below. 8) What is the rate of change of function B? 9) What is the initial value of function B? 10) Function rule, B in terms of n: B(n) = __________. 11) What is B(15) or what is B(n) when n = 15? 12) Extra Credit: On the back of this paper create a table, a
graph, and a possible representation of the 1 st three steps of the function: C(n) = 3n – 2
Answer Column:
1. __________
2. __________
3. __________
4. __________
5. see below
6. __________
7. see below
8. __________
9. __________ 10. __________ 11. __________
1
2
3
Function A Function B
1
2
3
A(n)
n
B(n)
n

88
25
Predictable Patterns QUIZ (KEY) Name_____________
1) How many tiles are in the 4th step of function A? 2) How many tiles are in step 10 of function A? 3) What is the rate of change of function A? 4) What is the initial value of function A? 5) Graph function A below. 6) Function rule, A in terms of n: A(n) = __________. 7) Make a t-table for function B below. 8) What is the rate of change of function B? 9) What is the initial value of function B? 10) Function rule, B in terms of n: B(n) = __________. 11) What is B(15) or what is B(n) when n = 15? 12) Extra Credit: On the back of this paper create a table, a
graph, and a possible representation of the 1 st three steps of the function: C(n) = 3n – 2
Answer Column:
1. ___39____
2. ____111__
3. ___12____
4. __ – 9____
5. see below
6. A(n) = 12x – 9
7. see below
8. ____–3____
9. ____18____ 10. B(n) = –3x + 18 11. _B(15) = –27__
1
2
3
Function A Function B
1
2
3
n
A(n)
n
B(n)
n
24
20
16
12
8
4
0
1
2
3
4
5 . .
10
15 12 9 6 3 . . –12

89
26
12) A possible answer for C(n) = 3n – 2
1
2
3
n C(n)0 -2 1 1 2 4 3 7 4 10 5 13 : : 10 27 n
C(n)

90

91

92

93

94
Part 1: The problem TThhee
TToowweerrss OOff
TTuummbblleerrss
You will be given a few of small tumblers (cups) and a few large tumblers (cups). Your job is to determine if it is possible to have a stack of short cups with the same number of cups as a stack of large cups while the two stacks are the same height. Consider only a traditional stack of cups where one cup is slipped into another cup.
Part 2: Collecting Data Pick one of the cup sizes and set one cup down on the table and measure its height. Slide a second cup in or around the first cup and measure the height of the stack. Repeat this process until there are five cups in the stack. Make your measurements as accurately as is reasonably possible, but remember that when collect ing real data small errors will occur. Put your data in an input/output table. Do the same for the other size cups. Part 3: Data analysis Since small errors occur when collecting data, and there are small variations between cups and how the cups are stacked, the data collected will not fit exactly into a mathematical equation. Keep this in mind as you do the following.
1. Create a graph of the data. Do the two relationships appear linear? Determine a line “of best fit” for each cups’ data. There are a variety of ways of doing this, but the idea is to find a line that comes close to most, if not all, of the points. Draw the graph of these lines on the same graph as the data points.
2. Come up with equations of these lines of best fit. You may do this from information on the graph or information from the table. If you use the ta ble, remember the first difference won’t be constant because the data is not exact and there are variations in the cups. You will have to pick a “best fit” first difference.
3. Make note of the slopes and y-intercepts of your lines of best fit. A line of best fit and its equation are said to “model” the real life situation. Part 4: Follow up questions
1. What does the slope tell you about the activity? What property of the cup does it represent?
2. Why were the slopes different for the line of best fit for the big cups and the line of best fit for the small cups?
3. What does the y-intercept tell you about the activity? What property of the cup does it represent?
4. Why were the y-intercepts different for the line of best fit for the big cups and the line of best fit for the small cups?
5. Use your equations to determine the number cups needed for the two stacks to have the same number of cups and be of the same height.
6. If the cups you were using had a height of 12.4 cm and a lip of 2.6 cm, what would be the equation for the height of a stack?
7. Is this relationship better described using a discrete or a continuous function?
5

95
“The Towers of Tumblers“– Follow-up Questions
1. What does the slope tell you about the activity? What property of the cup does it represent?
2. Why were the slopes different for the line of best fit for the big cups and the line of best fit for the small cups?
3. What does the y-intercept tell you about the activity? What property of the cup does it represent?
4. Why were the y-intercepts different for the line of best fit for the big cups and the line of best fit for the small cups?
5. Use your equations to determine the number cups needed for the two stacks to have the same number of cups and be of the same height.
6. If the cups you were using had a height of 12.4 cm and a lip of 2.6 cm, what would be the equation for the height of a stack?
7. Is this relationship better described using a discrete or a
continuous function?
6

96
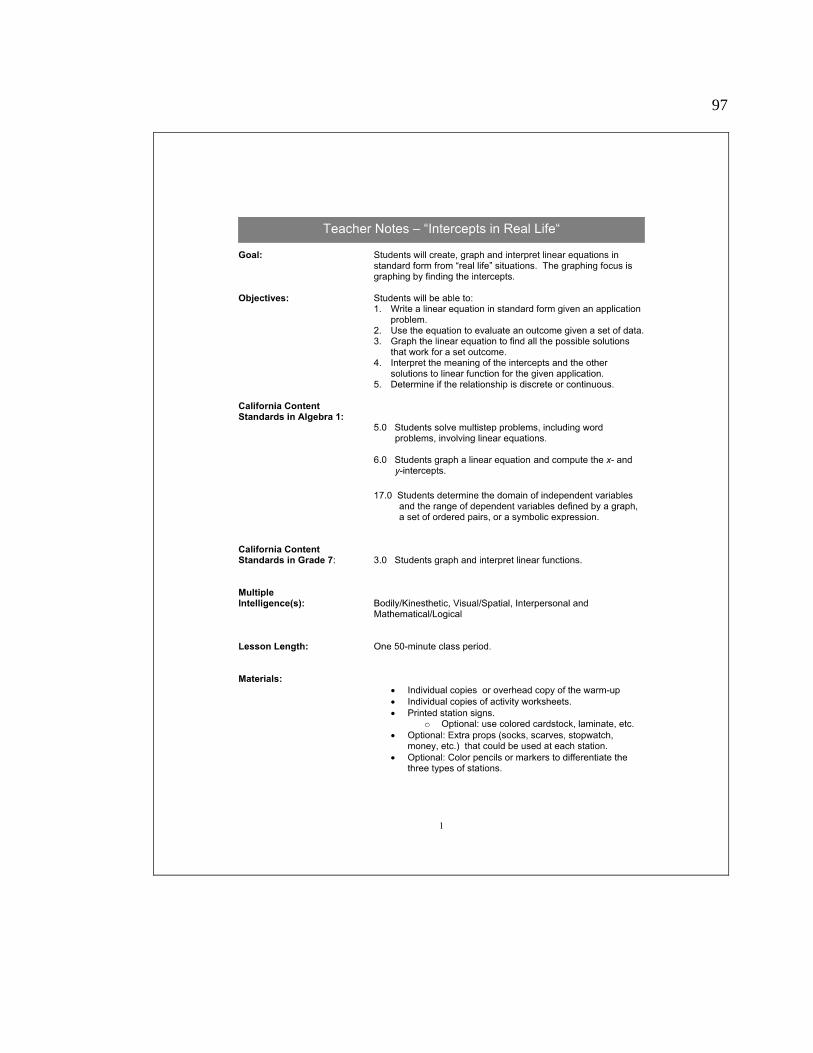
97

98
Assessment: Check for understanding throughout the activity and at the closure. The extension activity could be used as an assessment.
Extensions: Students could create their own situation that would produce a
similar linear function. Then share those with a partner to complete the questions and graph as a quiz or follow-up exercise. (See “Extension Activity” worksheet)
Attachments: Warm-up and KEY (pages 3 & 4), the “Intercepts in Real Life”
activity worksheets (pages 5 – 10), the “Intercepts in Real Life” activity worksheets Solution KEYS (pages 11 – 16), station signs (pages 17 – 24), extension activity worksheet (page 25)
Directions:
1. Setup the stations prior to class. 2. Start the student individually with the warm-up (page 3).
{5 min} 3. Have student volunteers complete the warm-up problems on
the board and check for understanding. {5 min} 4. Explain the goals of the day and the procedures of rotating
from station to station. 5. Hand out the activity worksheets. 6. Students either work in pairs or groups of three or four. 7. Give them approximately 35 – 40 minutes to compete. 8. Have student compare answers and check for understanding
with their peers. {5 min}
Closure:
1. Discuss the question of discrete versus continuous in part d and the possible answer found in part e.
2. Take time to connect the concepts of x- and y-intercept, domain, range, discrete versus continuous and linear function with this activity.
3. Discuss the challenges and successes of this activity. 4. Optional: Assign the extension activity as homework or
extra credit.
2
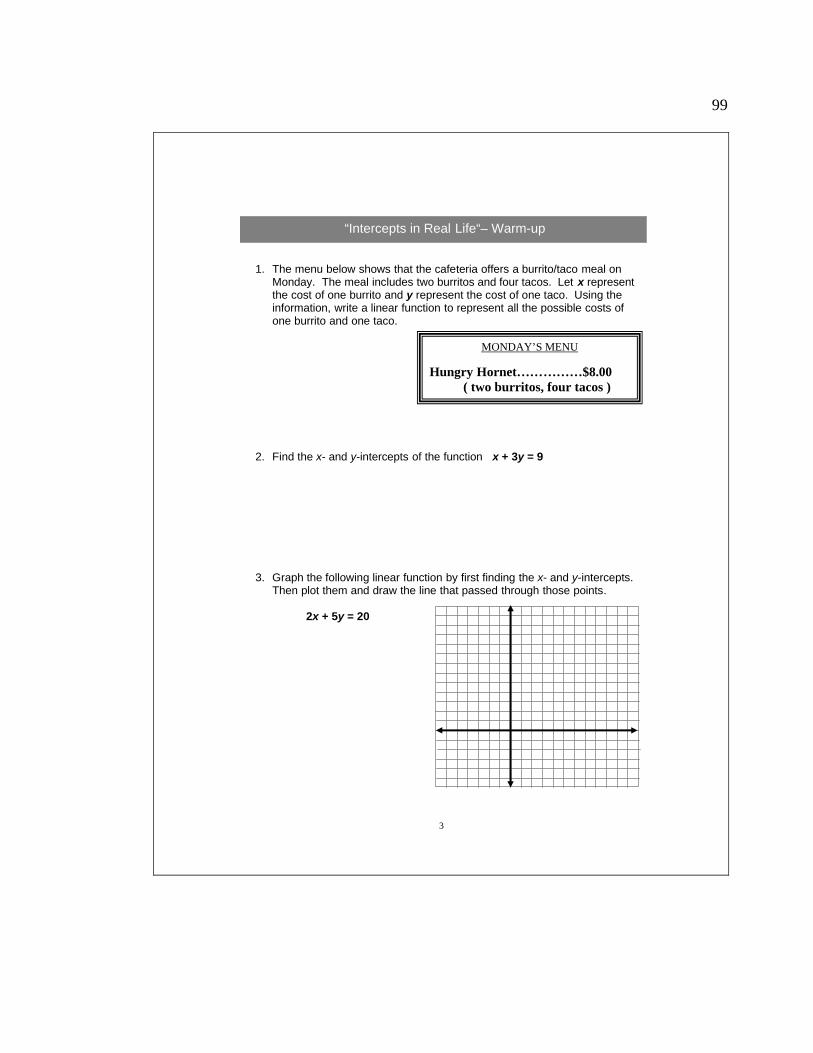
99
“Intercepts in Real Life“– Warm-up
1. The menu below shows that the cafeteria offers a burrito/taco meal on
Monday. The meal includes two burritos and four tacos. Let x represent the cost of one burrito and y represent the cost of one taco. Using the information, write a linear function to represent all the possible costs of one burrito and one taco.
MONDAY’S MENU
Hungry Hornet……………$8.00 ( two burritos, four tacos )
2. Find the x- and y-intercepts of the function x + 3y = 9
3. Graph the following linear function by first finding the x- and y-intercepts. Then plot them and draw the line that passed through those points.
2x + 5y = 20
3

100

101
Station #___ “Intercepts in Real Life”
Ticket Problem: Reserved tickets for the basketball game cost $____each while each general admission ticket costs $______. Let x represent the number of reserved tickets sold and let y represent the number of general admission tickets sold. a.
! "#$%&'( ) *%+''
, %+%-. %/'&"#$%&+0''''''''''''''''''! ')&'1 22222'-%3-%+%4&+0'2222222'5%63-%++"748''9%4%-)*': /; "++"74'! "#$%&+0'''"') &'1 22222'-%3-%+%4&+0'2222222'5%63-%++"748''< -"&%') 4'%63-%++"74'=7-'&> %'&7&)*'4?; @%-'7='&"#$%&+'+7*/0'''222222222222'
b. Use your expression found in part a, to find how much money is received for the following
ticket sales? i. 8 reserved and 10 general ii. 10 reserved and 8 general
c. A member of the Manatowa Maniacs must sell $_________ worth of reserved and general admission tickets combined.
Write an equation stating this. ______________________________
d. Find the intercepts for the equation found in part c and use them to plot the graph of the
equation. Is this a discrete or continuous function?
6A"4&%-#%3&0''''5''''''B'''''''8'
'CA"4&%-#%3&0''''5''''''B'''''''8'
e. List all the points with positive integer values that the line crosses. What does each set of
ordered pairs on the graph of the equation represent in real life?
5
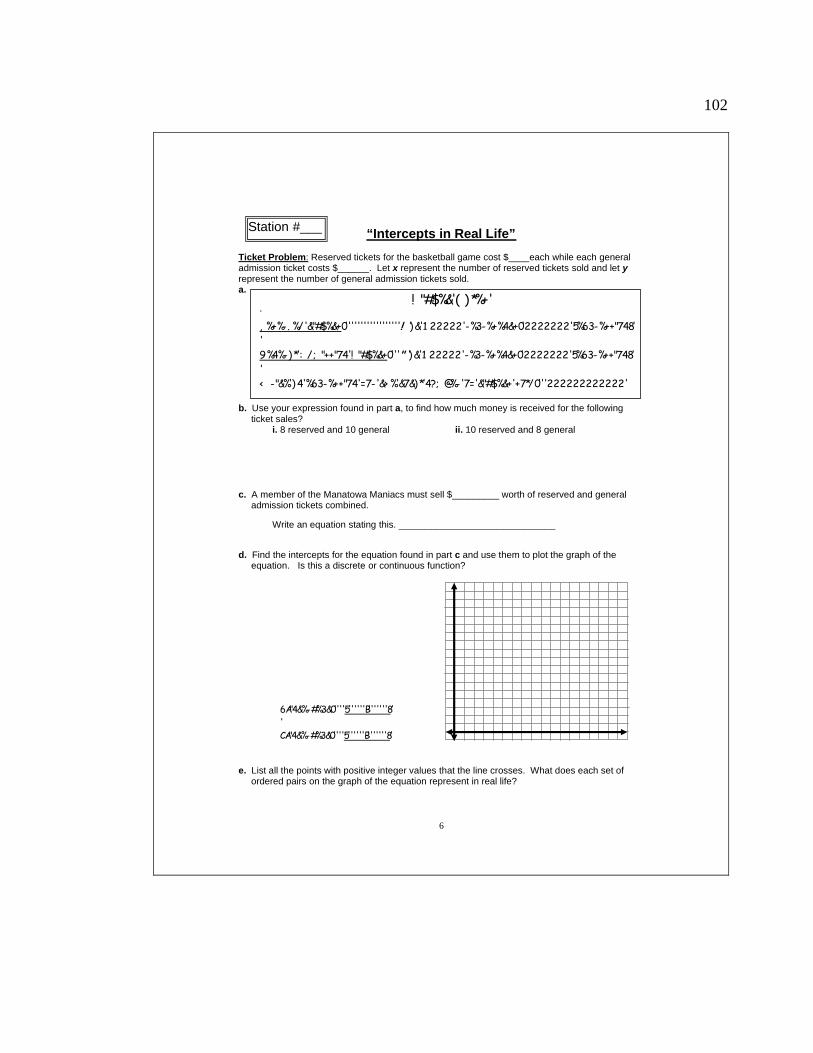
102
Station #___
“Intercepts in Real Life” Ticket Problem: Reserved tickets for the basketball game cost $____each while each general admission ticket costs $______. Let x represent the number of reserved tickets sold and let y represent the number of general admission tickets sold. a.
! "#$%&'( ) *%+''
, %+%-. %/'&"#$%&+0''''''''''''''''''! ')&'1 22222'-%3-%+%4&+0'2222222'5%63-%++"748''9%4%-)*': /; "++"74'! "#$%&+0'''"') &'1 22222'-%3-%+%4&+0'2222222'5%63-%++"748''< -"&%') 4'%63-%++"74'=7-'&> %'&7&)*'4?; @%-'7='&"#$%&+'+7*/0'''222222222222'
b. Use your expression found in part a, to find how much money is received for the following
ticket sales? i. 8 reserved and 10 general ii. 10 reserved and 8 general
c. A member of the Manatowa Maniacs must sell $_________ worth of reserved and general admission tickets combined.
Write an equation stating this. ______________________________
d. Find the intercepts for the equation found in part c and use them to plot the graph of the
equation. Is this a discrete or continuous function?
6A"4&%-#%3&0''''5''''''B'''''''8'
'CA"4&%-#%3&0''''5''''''B'''''''8'
e. List all the points with positive integer values that the line crosses. What does each set of
ordered pairs on the graph of the equation represent in real life?
6
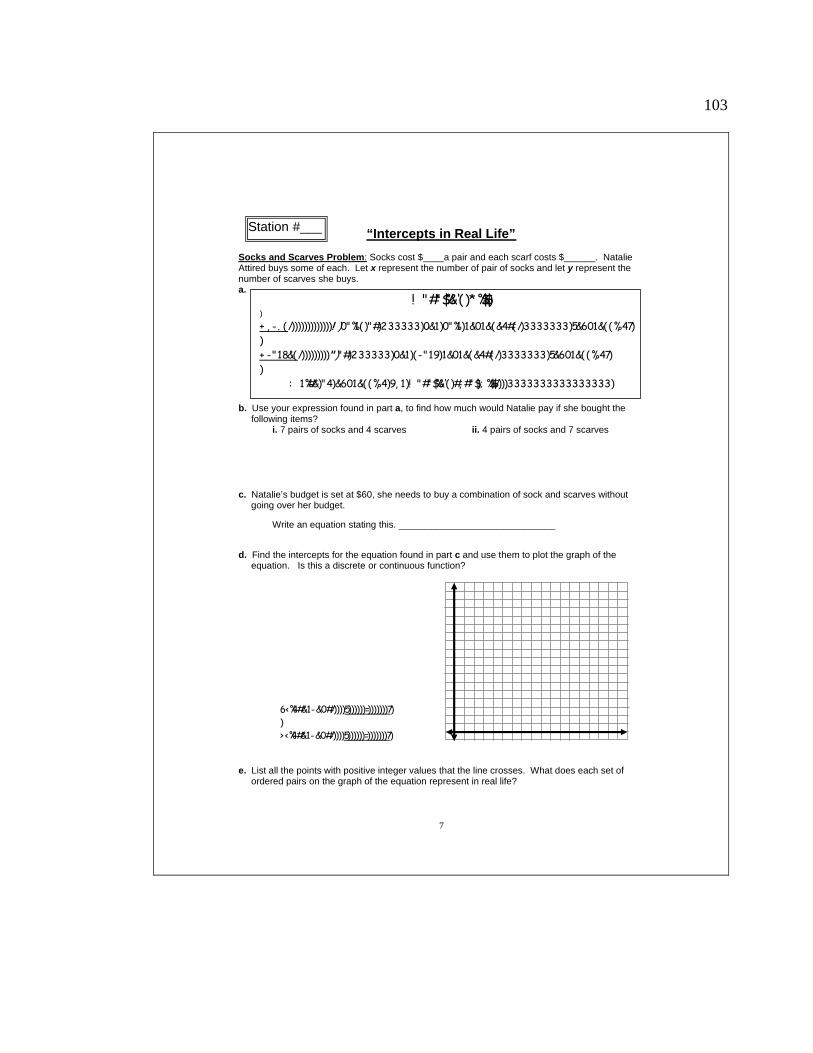
103
Station #___
“Intercepts in Real Life” Socks and Scarves Problem: Socks cost $____a pair and each scarf costs $______. Natalie Attired buys some of each. Let x represent the number of pair of socks and let y represent the number of scarves she buys. a.
! "#"$%&'()*%$$))
+ , -. (/)))))))))))))! )0"%1()"#)233333)0&1)0"%1)1&01&(&4#(/)3333333)5&601&((%, 47))+ -"18&(/)))))))))" )"#)233333)0&1)(-"19)1&01&(&4#(/)3333333)5&601&( (%, 47))
: 1%#&)"4)&601&((%, 4)9, 1)! "#"$%&'()#, #"$); %$$/)))3333333333333333) b. Use your expression found in part a, to find how much would Natalie pay if she bought the
following items? i. 7 pairs of socks and 4 scarves ii. 4 pairs of socks and 7 scarves
c. Natalie’s budget is set at $60, she needs to buy a combination of sock and scarves without going over her budget.
Write an equation stating this. ______________________________
d. Find the intercepts for the equation found in part c and use them to plot the graph of the
equation. Is this a discrete or continuous function?
6<%4#&1-&0#/))))5))))))=)))))))7)
)> <%4#&1-&0#/))))5))))))=)))))))7)
e. List all the points with positive integer values that the line crosses. What does each set of
ordered pairs on the graph of the equation represent in real life?
7
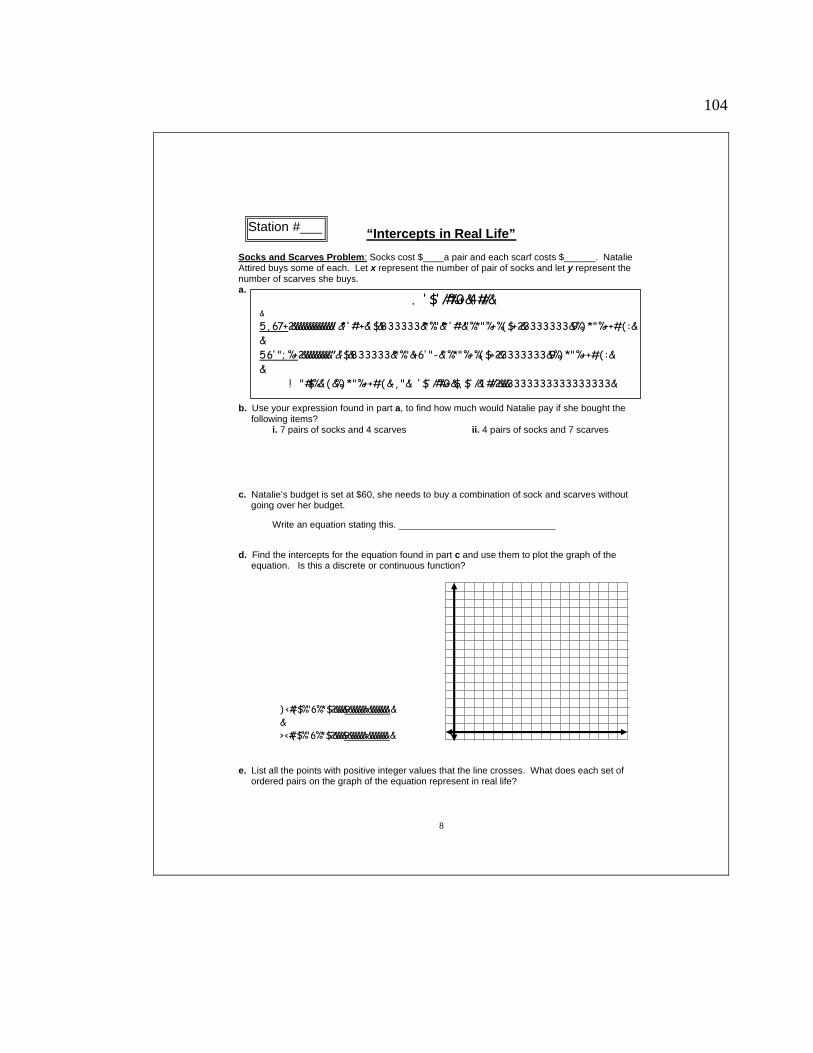
104
Station #___
“Intercepts in Real Life” Socks and Scarves Problem: Socks cost $____a pair and each scarf costs $______. Natalie Attired buys some of each. Let x represent the number of pair of socks and let y represent the number of scarves she buys. a.
! "#$%&'( &%) *"%++#, ( &-, "&. '$'/#%0+&$, $'/&1#//2&&&3333333333333333&
. '$'/#%0+&4#//&&
5, 67+2&&&&&&&&&&&&&! &*'#"+&'$&833333&*%"&*'#"&"%*"%+%( $+2&3333333&9%) *"%++#, ( :&&56'"; %+2&&&&&&&&&"&'$&833333&*%"&+6'"-&"%*"%+%( $+2&3333333&9%) *"%++#, ( :&&
b. Use your expression found in part a, to find how much would Natalie pay if she bought the
following items? i. 7 pairs of socks and 4 scarves ii. 4 pairs of socks and 7 scarves
c. Natalie’s budget is set at $60, she needs to buy a combination of sock and scarves without going over her budget.
Write an equation stating this. ______________________________
d. Find the intercepts for the equation found in part c and use them to plot the graph of the
equation. Is this a discrete or continuous function?
) <#( $%"6%*$2&&&&9&&&&&&=&&&&&&&:&
&> <#( $%"6%*$2&&&&9&&&&&&=&&&&&&&:&
e. List all the points with positive integer values that the line crosses. What does each set of
ordered pairs on the graph of the equation represent in real life?
8

105
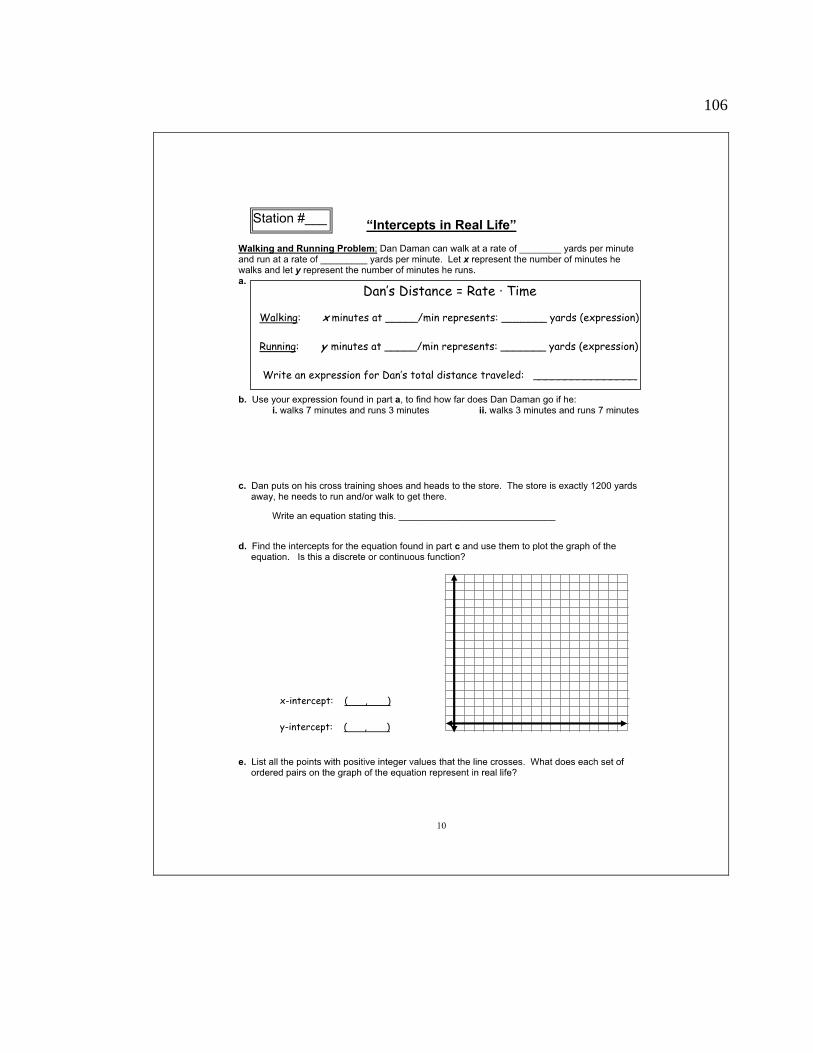
106

107

108
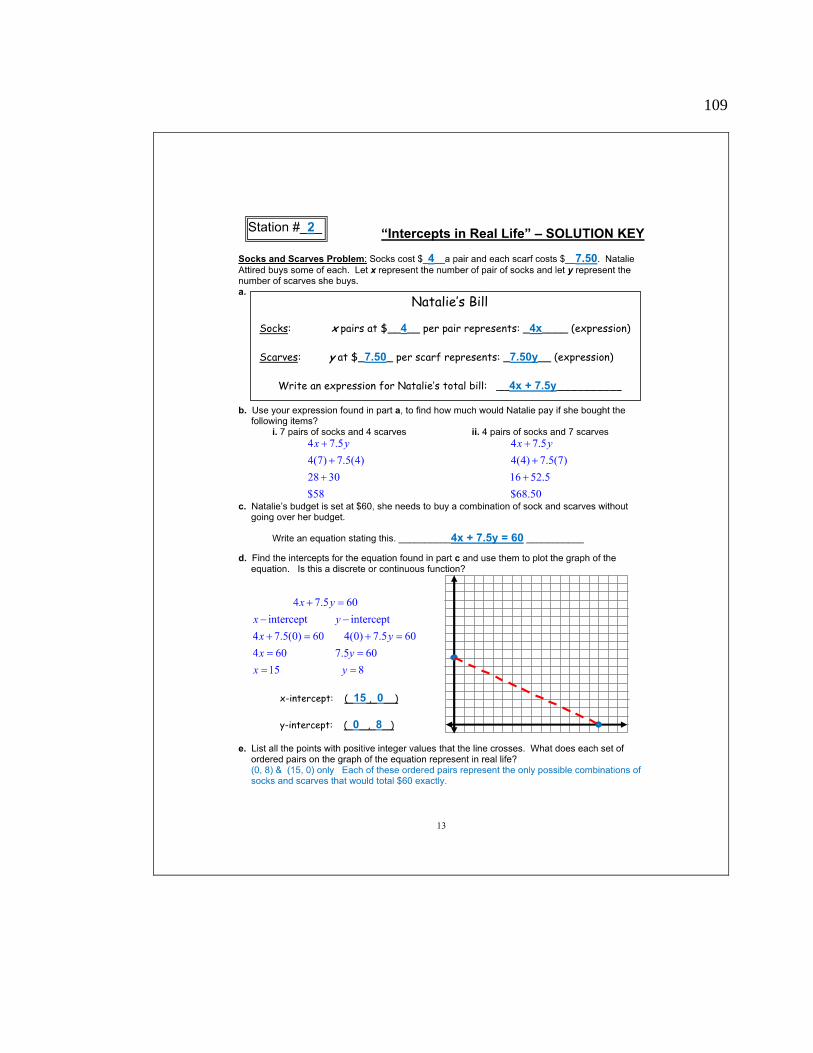
109

110
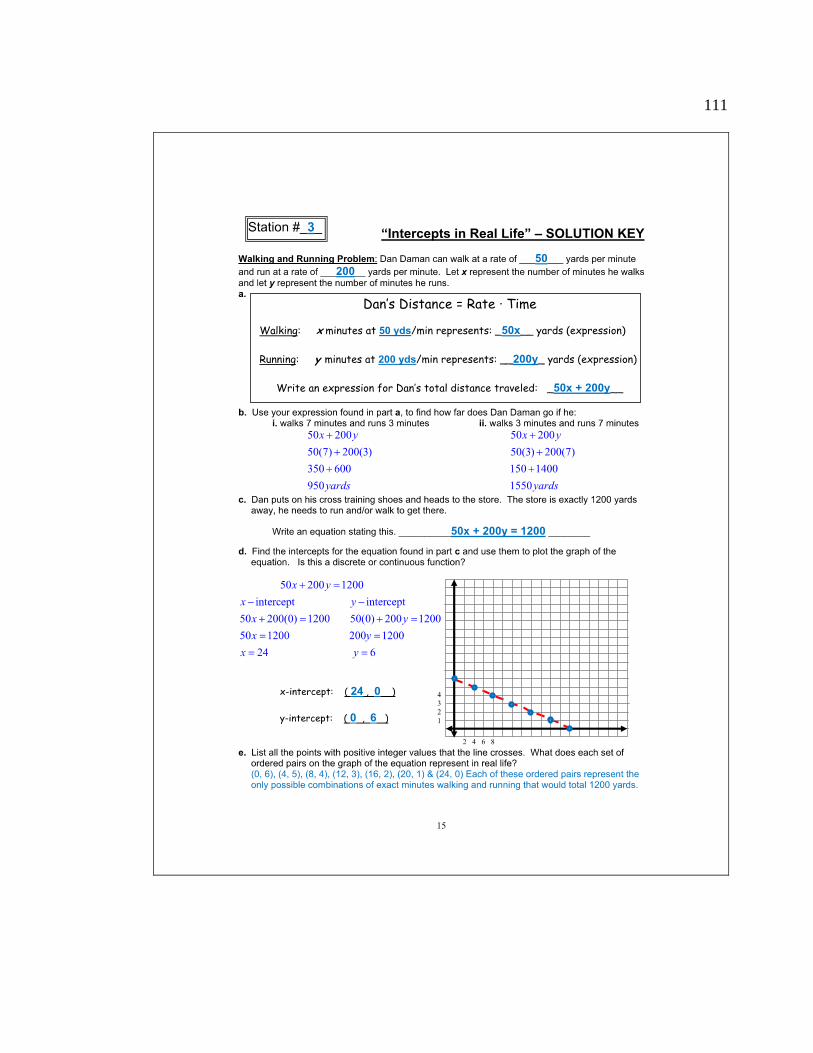
111

112
113
17
17

114
18
18

115
! "#$! "%"#$&'$( ")*&#+$",$"$
-",.$/0$122$$33""--44''$$55.. --$$%%&&##66,,..7
8899:: 99;;<< == >>$$?? $$@@$$
19
(Microsoft, n.d.)

116
20
20
(Mic
roso
ft, n
.d.)

117
21
21

118
22
22

119
! "#$! "%"#$&'$( ")*&#+$",$"$
-",.$/0$112222$$33""--44''$$55.. --$$%%&&##66,,..7
8899:: 99;;<< == >>$$?? $$@@$$
23
(Microsoft, n.d.)
120
24
24
(Mic
roso
ft, n
.d.)
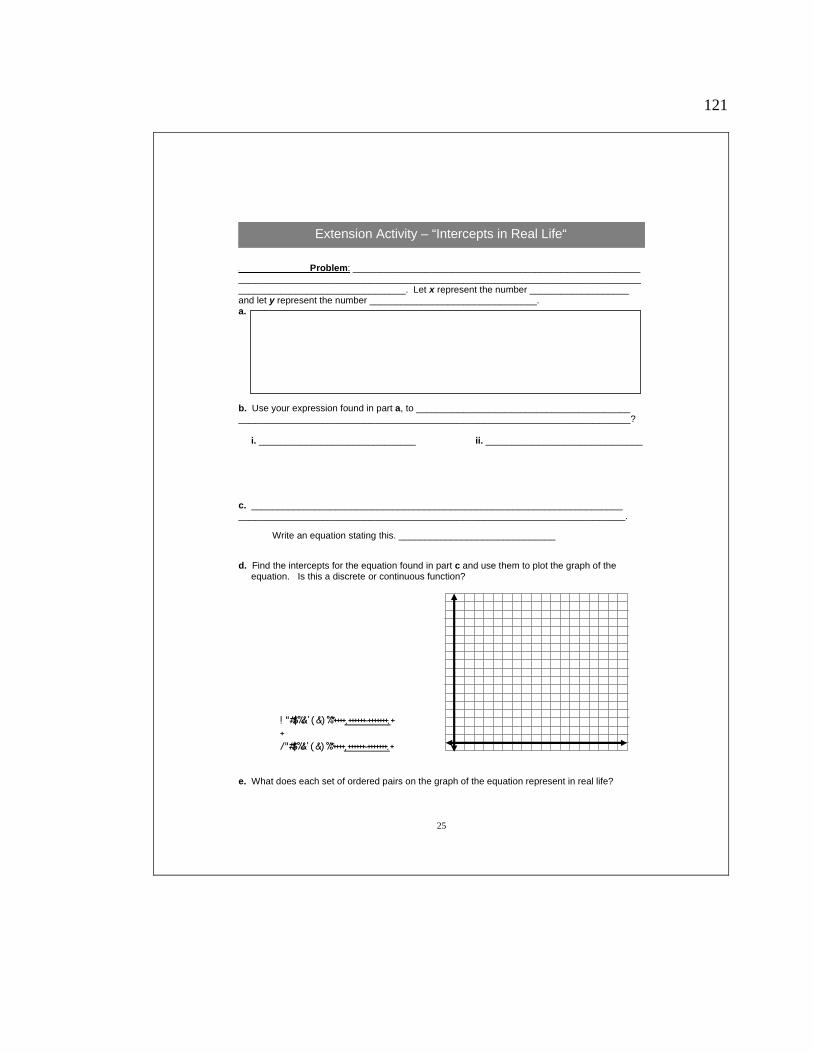
121
Extension Activity – “Intercepts in Real Life“
. Problem: _______________________________________________________ _____________________________________________________________________________________________________________. Let x represent the number ___________________ and let y represent the number ________________________________. a.
b. Use your expression found in part a, to _________________________________________ ___________________________________________________________________________?
25
i. ______________________________ ii. ______________________________
c. _______________________________________________________________________ __________________________________________________________________________.
Write an equation stating this. ______________________________
d. Find the intercepts for the equation found in part c and use them to plot the graph of the
equation. Is this a discrete or continuous function?
! "#$%&'( &) %*++++,++++++-+++++++.++/"#$%&'( &) %*++++,++++++-+++++++.+
e. What does each set of ordered pairs on the graph of the equation represent in real life?

122
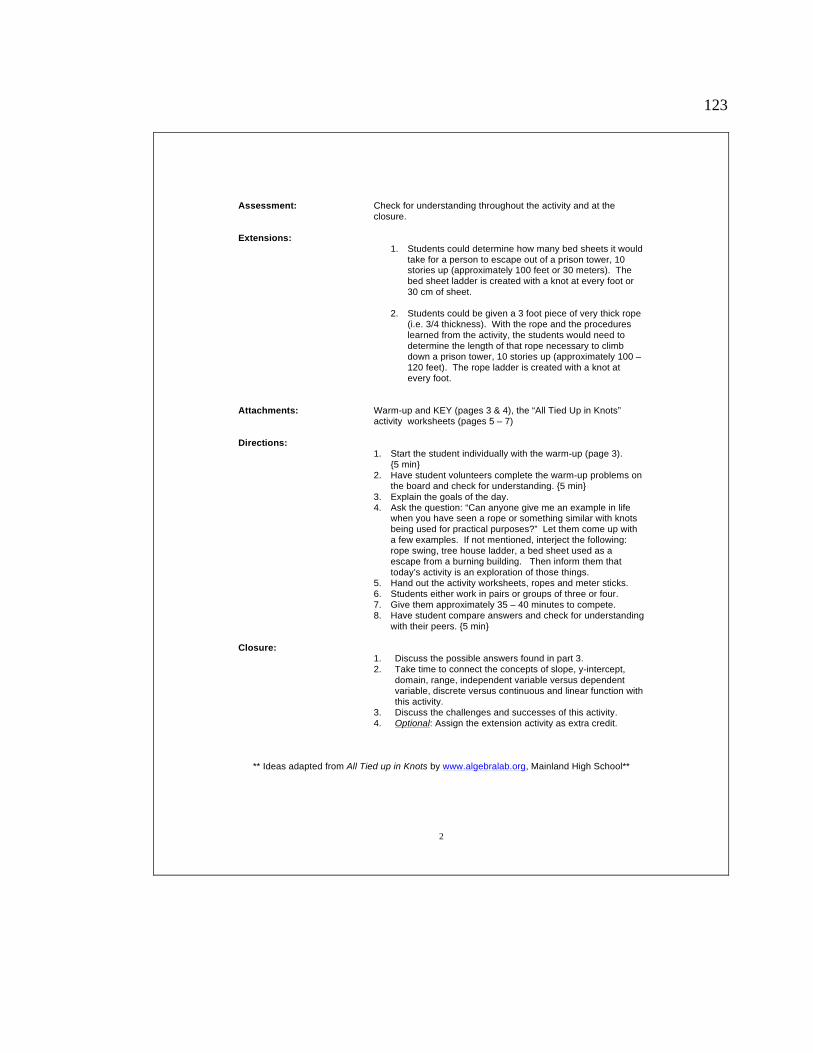
123
2
Assessment: Check for understanding throughout the activity and at the closure.
Extensions:
1. Students could determine how many bed sheets it would take for a person to escape out of a prison tower, 10 stories up (approximately 100 feet or 30 meters). The bed sheet ladder is created with a knot at every foot or 30 cm of sheet.
2. Students could be given a 3 foot piece of very thick rope
(i.e. 3/4 thickness). With the rope and the procedures learned from the activity, the students would need to determine the length of that rope necessary to climb down a prison tower, 10 stories up (approximately 100 – 120 feet). The rope ladder is created with a knot at every foot.
Attachments: Warm-up and KEY (pages 3 & 4), the “All Tied Up in Knots”
activity worksheets (pages 5 – 7) Directions:
1. Start the student individually with the warm-up (page 3). {5 min}
2. Have student volunteers complete the warm-up problems on the board and check for understanding. {5 min}
3. Explain the goals of the day. 4. Ask the question: “Can anyone give me an example in life
when you have seen a rope or something similar with knots being used for practical purposes?” Let them come up with a few examples. If not mentioned, interject the following: rope swing, tree house ladder, a bed sheet used as a escape from a burning building. Then inform them that today’s activity is an exploration of those things.
5. Hand out the activity worksheets, ropes and meter sticks. 6. Students either work in pairs or groups of three or four. 7. Give them approximately 35 – 40 minutes to compete. 8. Have student compare answers and check for understanding
with their peers. {5 min} Closure:
1. Discuss the possible answers found in part 3. 2. Take time to connect the concepts of slope, y-intercept,
domain, range, independent variable versus dependent variable, discrete versus continuous and linear function with this activity.
3. Discuss the challenges and successes of this activity. 4. Optional: Assign the extension activity as extra credit.
** Ideas adapted from All Tied up in Knots by www.algebralab.org, Mainland High School**

124
3
Determine the linear function from each table of values.
1.
2.
3.
4
x f(x) 2 5 3 8 4 11 5 14 6 17
x y -1 5 0 3 1 1 2 -1 3 -3
t v(t)-3 -21-1 -111 -1 3 9 5 19
K R -4 110 -2 105 0 100 2 95 4 90
“All Tied Up in Knots “ – Warm-up

125

126
5
ALL TIED UP IN KNOTSALL TIED UP IN KNOTS
Overview/Objectives:
In this activity you will estimate the length of two ropes with different numbers of knots tied in each. You will develop a linear model for the data and make predictions about lengths of a rope with different numbers of knots. Materials needed:
One meter stick Two different ropes Two different colored pencils or markers Individual activity worksheets.
Procedures for Part 1:
1. Before tying any knots in the ropes, measure the length of the ropes in centimeters and record the lengths in the table.
2. Tie one knot in each rope. Tie the knots snuggly, but be sure you can untie them at the end of the activity.
3. Measure the length of each rope (in cm) with one knot and record the length.
4. Tie a second knot in each rope. Measure the length of each rope and record the length. Do not tie one knot on top of another knot.
5. Repeat step #4 for three, four, five, and six knots in each rope.
Number of
Knots Length of Rope A (cm) Length of Rope B (cm)
0
1
2
3
4
5
6

127
6
ALL TIED UP ALL TIED UP IN KNOTSIN KNOTS
Procedures for Part 2: Since small errors occur when measuring and collecting data, and there are small variations between the knots, the data collected will not fit exactly into a mathematical equation. Keep this in mind as you do the following.
1. Using a sheet of graph paper, create a graph of each set of data on the same set of axis. Be sure to use different colors representing each rope. Label and number each axis. Does each relationship appear linear?
2. Determine a line “of best fit” for each set of data. There are a variety of
ways of doing this, but the idea is to find a line that comes close to most, if not all, of the points. Draw each graph of the line on the same graph as the data points. The line of best fit and its equation are said to “model” the real life situation.
3. Using the graph and the ordered pairs from each set of data, write an equation of each line of best fit.
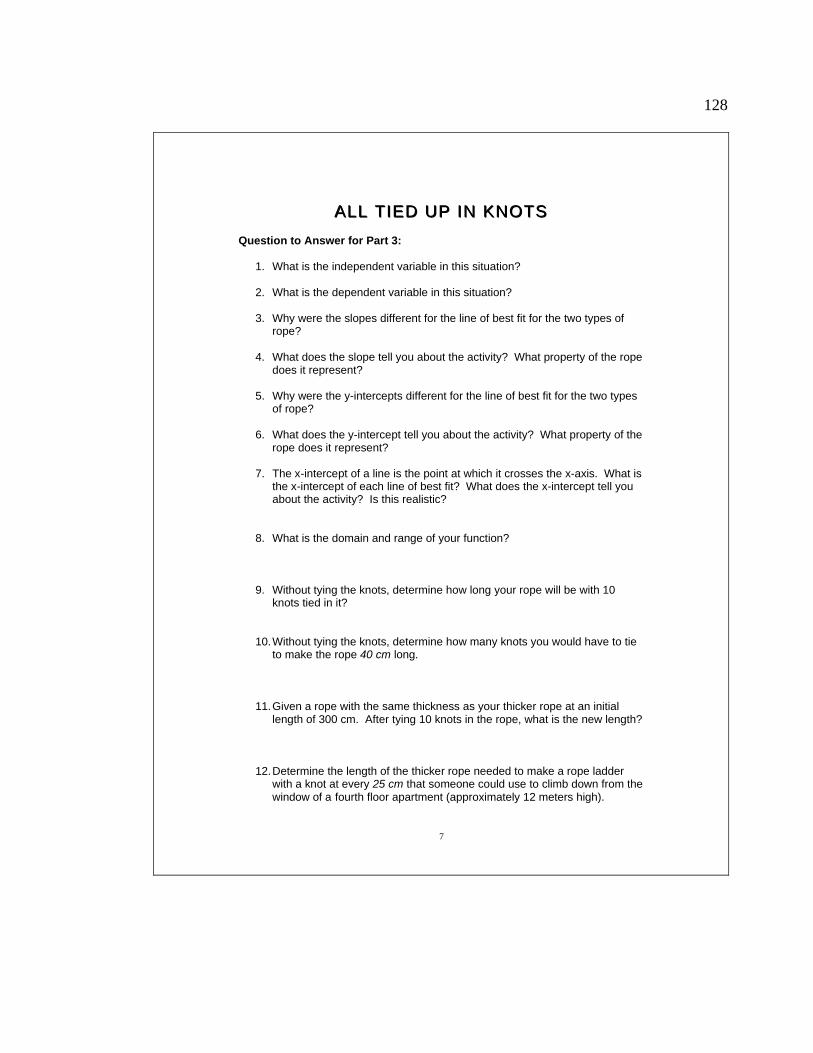
128
7
ALL TIED UP IN KNOTSALL TIED UP IN KNOTS
Question to Answer for Part 3:
1. What is the independent variable in this situation?
2. What is the dependent variable in this situation?
3. Why were the slopes different for the line of best fit for the two types of rope?
4. What does the slope tell you about the activity? What property of the rope
does it represent?
5. Why were the y-intercepts different for the line of best fit for the two types of rope?
6. What does the y-intercept tell you about the activity? What property of the
rope does it represent?
7. The x-intercept of a line is the point at which it crosses the x-axis. What is the x-intercept of each line of best fit? What does the x-intercept tell you about the activity? Is this realistic?
8. What is the domain and range of your function?
9. Without tying the knots, determine how long your rope will be with 10 knots tied in it?
10. Without tying the knots, determine how many knots you would have to tie to make the rope 40 cm long.
11. Given a rope with the same thickness as your thicker rope at an initial length of 300 cm. After tying 10 knots in the rope, what is the new length?
12. Determine the length of the thicker rope needed to make a rope ladder with a knot at every 25 cm that someone could use to climb down from the window of a fourth floor apartment (approximately 12 meters high).

129
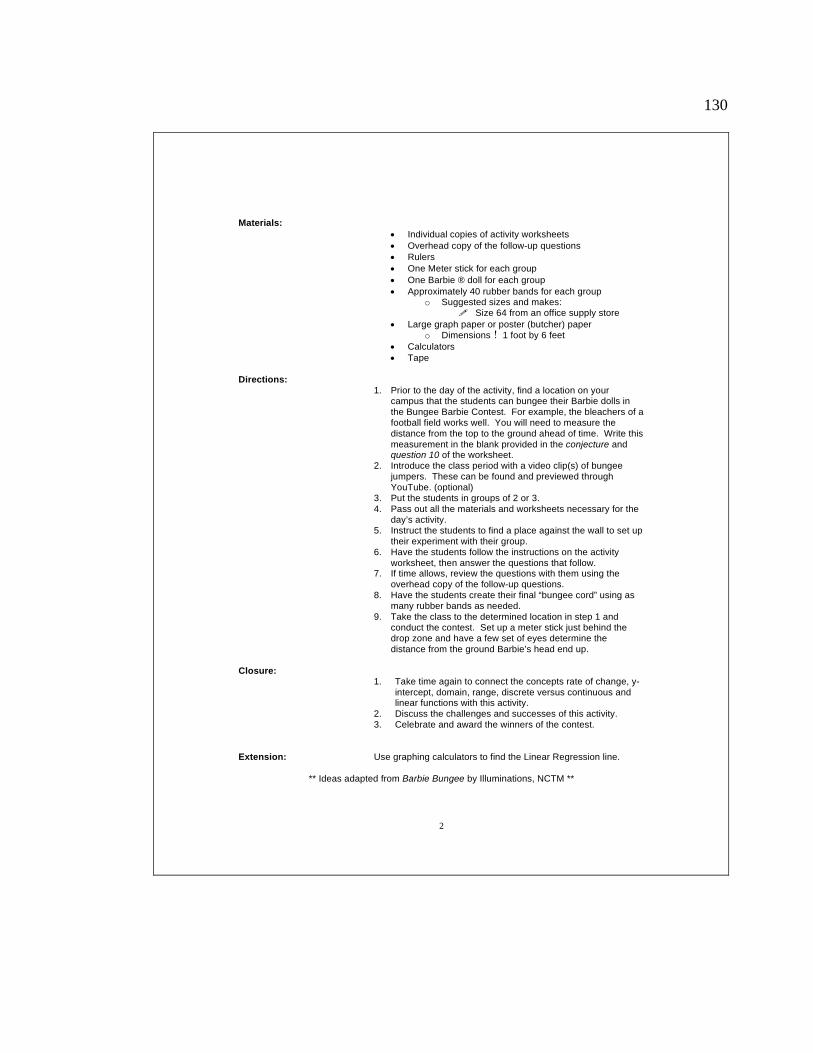
130
2
Materials: Individual copies of activity worksheets Overhead copy of the follow-up questions Rulers One Meter stick for each group One Barbie ® doll for each group Approximately 40 rubber bands for each group
o Suggested sizes and makes: Size 64 from an office supply store
Large graph paper or poster (butcher) paper o Dimensions 1 foot by 6 feet
Calculators Tape
Directions:
1. Prior to the day of the activity, find a location on your campus that the students can bungee their Barbie dolls in the Bungee Barbie Contest. For example, the bleachers of a football field works well. You will need to measure the distance from the top to the ground ahead of time. Write this measurement in the blank provided in the conjecture and question 10 of the worksheet.
2. Introduce the class period with a video clip(s) of bungee jumpers. These can be found and previewed through YouTube. (optional)
3. Put the students in groups of 2 or 3. 4. Pass out all the materials and worksheets necessary for the
day’s activity. 5. Instruct the students to find a place against the wall to set up
their experiment with their group. 6. Have the students follow the instructions on the activity
worksheet, then answer the questions that follow. 7. If time allows, review the questions with them using the
overhead copy of the follow-up questions. 8. Have the students create their final “bungee cord” using as
many rubber bands as needed. 9. Take the class to the determined location in step 1 and
conduct the contest. Set up a meter stick just behind the drop zone and have a few set of eyes determine the distance from the ground Barbie’s head end up.
Closure:
1. Take time again to connect the concepts rate of change, y-intercept, domain, range, discrete versus continuous and linear functions with this activity.
2. Discuss the challenges and successes of this activity. 3. Celebrate and award the winners of the contest.
Extension: Use graphing calculators to find the Linear Regression line.
** Ideas adapted from Barbie Bungee by Illuminations, NCTM **

131
3
Can Barbie Survive the Bungee?
Name(s): _____________________________
In this activity, you will simulate a bungee jump using a Barbie® doll and rubber bands. Before you conduct the experiment, formulate a conjecture:
I believe that _____ is the maximum number of rubber bands that will allow Barbie to successfully and dramatically complete a jump from a height of _____ cm.
The object is to have her come as close to the ground as possible without hitting the ground. Now, conduct the experiment to test your conjecture. PROCEDURE: Complete each step below. As you complete each step, put a check mark in the box to the left.
Tape a large piece of paper to the wall from the floor to a height of about six feet.
Draw a line near the top to indicate the height from which Barbie will make each jump, her “jump line”.
Create a double-loop to wrap around Barbie’s feet. A double-loop is made by
securing one rubber band to another with a slip knot, as shown (below left).
Wrap the open end of the double-loop tightly around Barbie’s feet, as shown (below right).
(Microsoft, n.d.)

132
Attach a second rubber band to the first one, again using a slip knot, as shown below.
Attach two more rubber bands to the second one, again using slip knots.
With four rubber bands now attached (the one around her legs does not count), hold the end of the rubber bands at the jump line with one hand, and drop Barbie head first from the line with the other hand. Have a partner make a mark to the lowest point that Barbie reaches on this jump.
Measure the jump distance in centimeters, and record the value in the data table
in Question 1. You may wish to repeat this jump several times and take the average, to ensure accuracy. Accuracy is important—Barbie’s life could depend on it!
Repeatedly attach additional rubber bands for each new jump, measure the jump
distance, and record the results in the data table.
When you’ve completed the data table, answer Questions 2 – 13. QUESTIONS:
1. Complete the data table below.
4
4

133
2. Make a scatter plot of your data. Label and indicate the scale on each axis.
3. On the graph above, sketch a line of best fit.
4. What is the relationship between the number of rubber bands and jump
distance? Is this relationship discrete or continuous?
5. What is the equation for your line of best fit? Define the variables in the equation.
6. Use your equation to determine what distance Barbie would fall using 100 rubber bands. (Take a moment and think -- will 100 be an x-value or a y-value?)
5

134
7. Barbie wants to bungee off the Eiffel Tower. It is approximately 300.5 meters tall. How many rubber bands will you need so Barbie just brushes her hair (hopefully not her head) on the ground?
8. What is the slope of your equation, and what does it represent in this context? Looking at the units of the slope is helpful.
9. What is the y-intercept of your equation, and what does it represent in this context?
10. Based on your data, what would you predict is the maximum number of rubber bands so that Barbie could still safely jump from ______ cm (the contest jump height)?
11. Are your predictions reliable? Justify your answer. Be sure to consider your methods of collecting, recording, and plotting data.
12. How do your predictions from Question 10 compare to the conjecture you made before doing the experiment? What prior knowledge did you have (or not have) that helped (or hindered) your ability to make a good conjecture?
13. Now it is time to test your calculations in a Barbie Bungee Contest! Tie the number of rubber bands from your prediction in Question 10 and wait for further instructions.
6
(Microsoft, n.d.)

135
7
4. What is the relationship between the number of rubber bands and jump distance?
5. What is the equation for your line of best fit? Define the variables in the equation. 6. Use your equation to determine what distance Barbie would fall using 50 rubber
bands. (Take a moment and think -- will 50 be an x-value or a y-value?) 7. Barbie wants to bungee off the Eiffel Tower. It is approximately 300.5 meters tall.
How many rubber bands will you need so Barbie just brushes her hair (hopefully not her head) on the ground?
8. What is the slope of your equation, and what does it represent in this context?
Looking at the units of the slope is helpful. 9. What is the y-intercept of your equation, and what does it represent in this context? 10. Based on your data, what would you predict is the maximum number of rubber bands
so that Barbie could still safely jump from ______ cm? 11. Are your predictions reliable? Justify your answer. Be sure to consider your methods
of collecting, recording, and plotting data. 12. How do your predictions from Question 10 compare to the conjecture you made
before doing the experiment? What prior knowledge did you have (or not have) that helped (or hindered) your ability to make a good conjecture?
“Can Barbie Survive the Bungee“– Follow-up Questions
(Microsoft, n.d.)
(Microsoft, n.d.)

136
REFERENCES
Fulton, B., & Lombard, B. (2001). The pattern and function connection. Emeryville , CA: Key Curriculum Press
Mainland High School, AlgebraLAB: Making Connections. (n.d.) All tied up in
knots. Retrieved from http://www.algebralab.org/activities/activity.aspx?file=Science_AllTiedUpInKnots.xml
Microsoft. (n.d.). Clipart. Retrieved from http://office.microsoft.com/en-
us/images/??Origin=EC790014051033&CTT=6 National Council of Teachers of Mathematic, Illuminations: Resources for
Teaching Math. (n.d.). Barbie bungee. Retrieved from http://illuminations.nctm.org/LessonDetail.aspx?id=L646


