Climatological characteristics of the tropical tropopause as - NOAA
Upload
jasmine-sharpCategory
view
213download
0
Using GPS data to studythe tropical tropopause
Bill RandelNational Center for Atmospheric Research
Boulder, Colorado
“You can observe a lot by just watching” (Yogi Berra)

Overview
• GPS radio occultation temperature measurements
• GPS observations of the tropical tropopause:
– low frequency variability (seasonal cycle, QBO)
– large and small-scale waves

GPS Radio Occultation
Occulting LEO
Occulting GPS
20 msecdata
Ionosphere
Neutral atmosphere
Earth
(LINK 1)
Basic measurement principle:
Deduce atmospheric properties based on precise measurement of phase delay and amplitude.
* high vertical resolution! ~100 m

Availability of GPS data:
• GPS/MET (1995-1997)
• CHAMP (2001-present)
• SAC-C (2001-2002)
• COSMIC (launched April 2006) (6 satellites)
number of tropical profilesper month (20 N – S)
each LEO satellite ~ 100-200 occultations/day

Sample of GPS tropical temperature profiles
Temperature profiles are characterized by high variability (planetary waves, gravity waves), closely linked to convection. GPS data offer a new tool to understand this variability.

Comparison of GPS with radiosondes
very good agreementfor wave structures

Tropical temp variability studied with GPS data
• Seasonal climatology and annual cycle
• Quasi-biennial oscillation
• Planetary-scale Kelvin waves
• Small-scale waves (inertia-gravity waves)
references: Randel et al., JGR, 2004 Randel and Wu, JGR, 2005

Cold point tropopause temperatures
deepconvection
NH winter climatology

Variability of tropopause temperature

Vertical structure at equator (NH winter)
IndonesiaAfrica South America
‘top’ ofconvectionnote eastward tilt
with height,characteristic of
Kelvin wave
TTL

high, coldtropopause over
South AsianMonsoon
NH summer climatology
deepconvection

Seasonal variation from GPS data
Equator 18 km
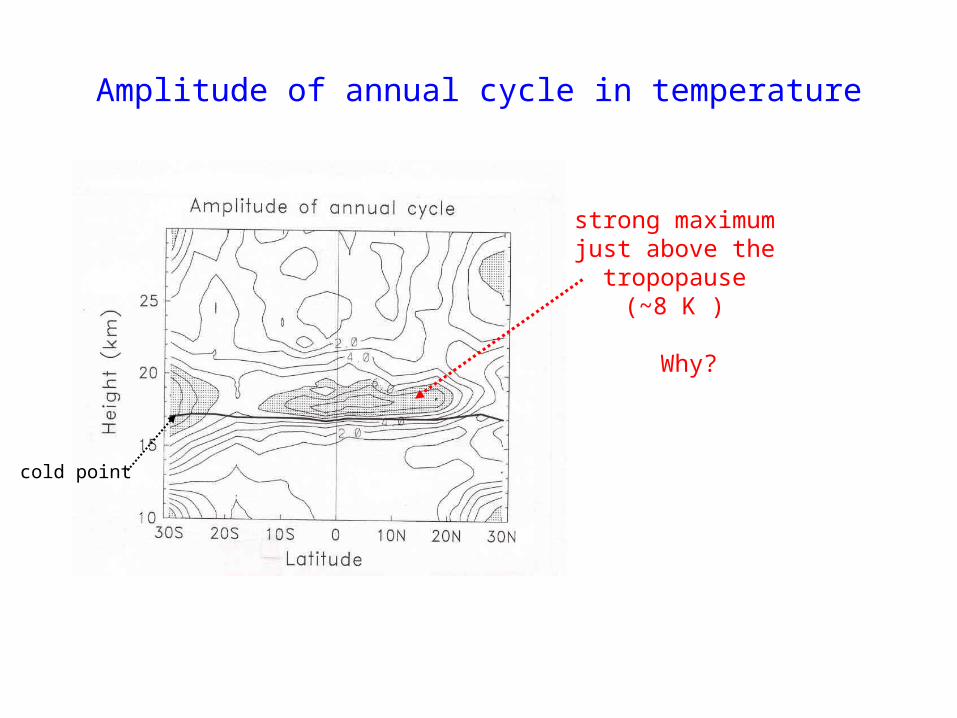
Amplitude of annual cycle in temperature
strong maximumjust above the
tropopause(~8 K )
Why?
cold point

Amplitude of annual cycle in temperature
strong maximumjust above the
tropopause(~8 K )
Why?
thermodynamic balance
smalllong radiative time scale
in lower stratosphere
hence, amplified T response

Quasi-biennial oscillation (QBO) in temperature
contours:+/- 0.5, 1.5, ...
cold point
result: QBO influence of ~ 0.5 K on tropical tropopause

Recent cooling of tropical tropopause echoed instratospheric water vapor decreases
stratosphericwater vaporfrom HALOE
satellite
tropicaltropopause
temperatures
r=.72
Randel et al, JGR, 2006

Space-time variability on daily time scalesusing CHAMP + SAC-C data
• Kelvin waves
– identification– forcing by tropical deep convection
• Small scales (gravity waves)
– coupling with background winds
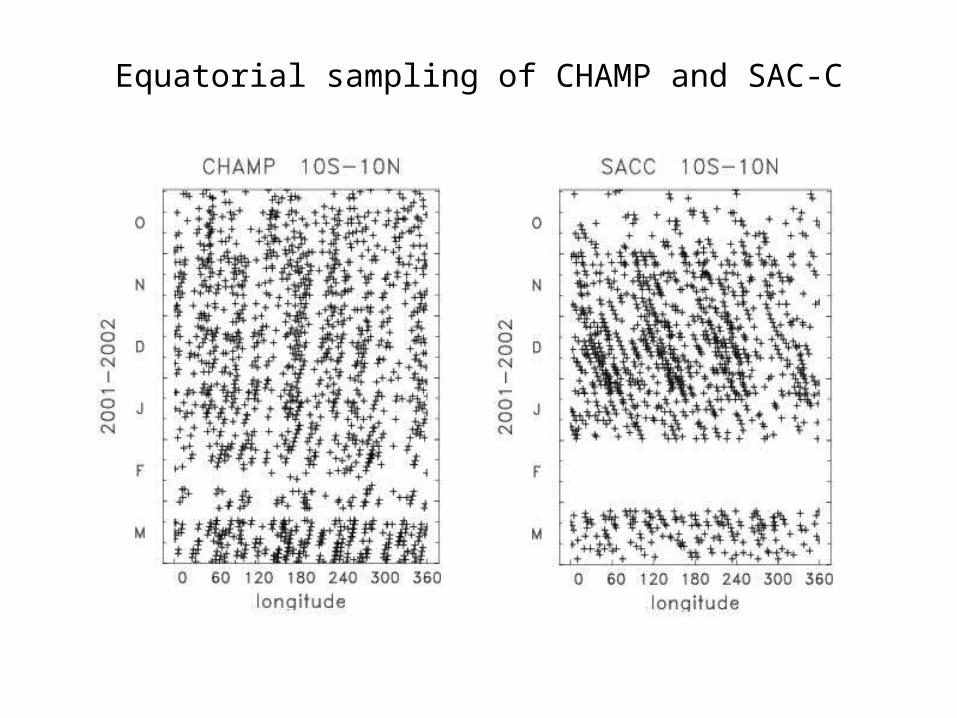
Equatorial sampling of CHAMP and SAC-C

Simple gridding procedure

Kelvin waves near the tropopause
eastward traveling
Kelvinwaves

Vertical structure
tropopause
eastward phasetilt with heightcharacteristic of Kelvin waves

How are Kelvin waves linked to deep convection?

Variations in tropical
convectionfrom OLR
measurements
Nov
Dec
Jan
Feb
Mar

Correlation of waves with convection (OLR)
wave variance at 16.5 km
OLR near Indonesia

Global-scale Kelvin wave forced by convection
note cold anomaliesabove convection,
as part of large-scalewave structure
modulation ofcold point

Residual temperature variance (small scales)

Sample of GPS tropical temperature profiles
note enhancedvariabilityabove ~15 km

Gravity waves observed by GPS/MET
Tsuda et al., JGR, 2000
maximum intropics
(see Alexanderet al.,JAS,2002)

Residual (small-scale) wave variance
maximumnear
tropopause

Residual (small-scale) wave variance
maximumjust belowu=0 line
QBO winds

Gravity waves interacting with a critical level

Key points:
• GPS data allow high resolution view of ubiquitous wave variability near tropical tropopause.
• Kelvin waves (and smaller scales) strongly linked to tropical deep convection. Global-scale dynamical
response in TTL, with cooling near tropopause overconvection.
• Maximum wave variance near tropopause (why?). Waves are coupled to background winds (QBO)
• Future: COSMIC (6 more satellites) EQUARS (equatorial orbit)

Future: COSMIC + EQUARS Soundings in a Day
COSMIC EQUARS Radiosondes

high, coldtropopause over
South AsianMonsoon
NH summer climatology
deepconvection

Circulation of the South Asian summer monsoon
deep convection
monsooncirculationnear 15 km
- - - cross sectioncold lower stratospherehigh, cold tropopause
warm troposphere
winds
tropopause

16 km cloudsfrom HIRDLS
100 hPa relativehumidity from MLS
Persistent high clouds over monsoon region

observed100 hPa
circulation
(zonal mean
removed)
response tolow frequency
tropical heating(Gill, 1980)

Persistent cirrus clouds over monsoon region
(HIRDLS measurements)cold
tropopause

Correlation of GPS temps and OLR near Indonesia
convection variesover this region
easterly winds in lower stratospheretropopause
TTL

convection variesover this region
westerly winds in lower
stratosphere
(waves do notpropagatevertically)
Correlation of GPS temps and OLR near Indonesia
tropopause TTL

Model simulation of gravity waves forced by deep convection
Alexander and Holton, 2000

Gravity waves interacting with a critical level
criticallevel

Comparison of near-coincident CHAMP and SAC-C retrievals
Hajj et al., JGR, 2004
mean bias
std. dev. ~ uncertainty of single measurement
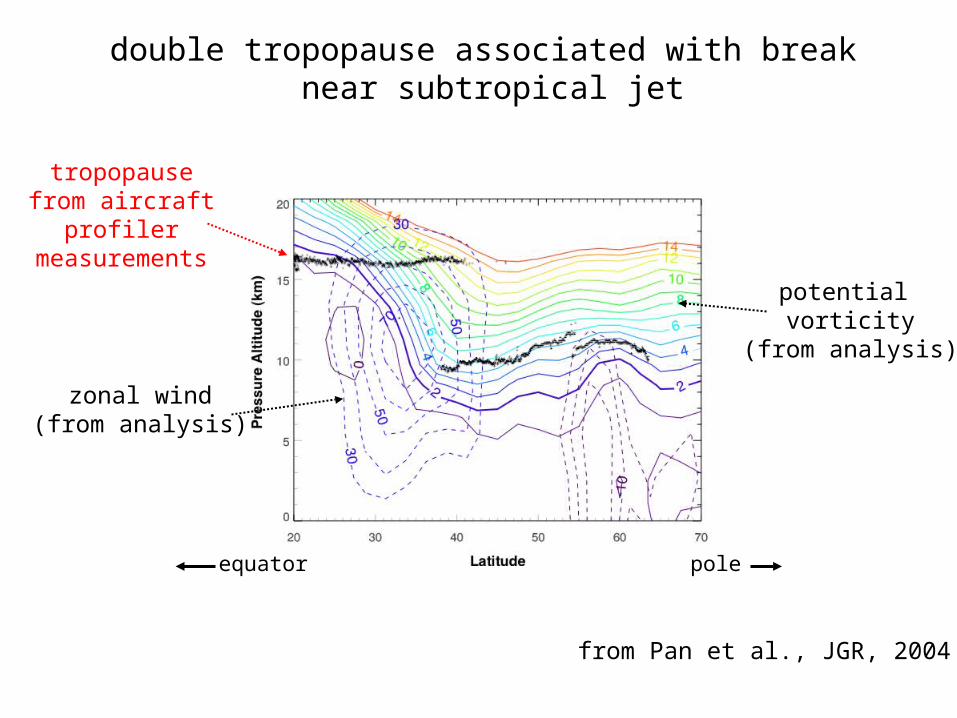
from Pan et al., JGR, 2004
zonal wind(from analysis)
tropopausefrom aircraft
profilermeasurements
potential vorticity
(from analysis)
double tropopause associated with break near subtropical jet
poleequator
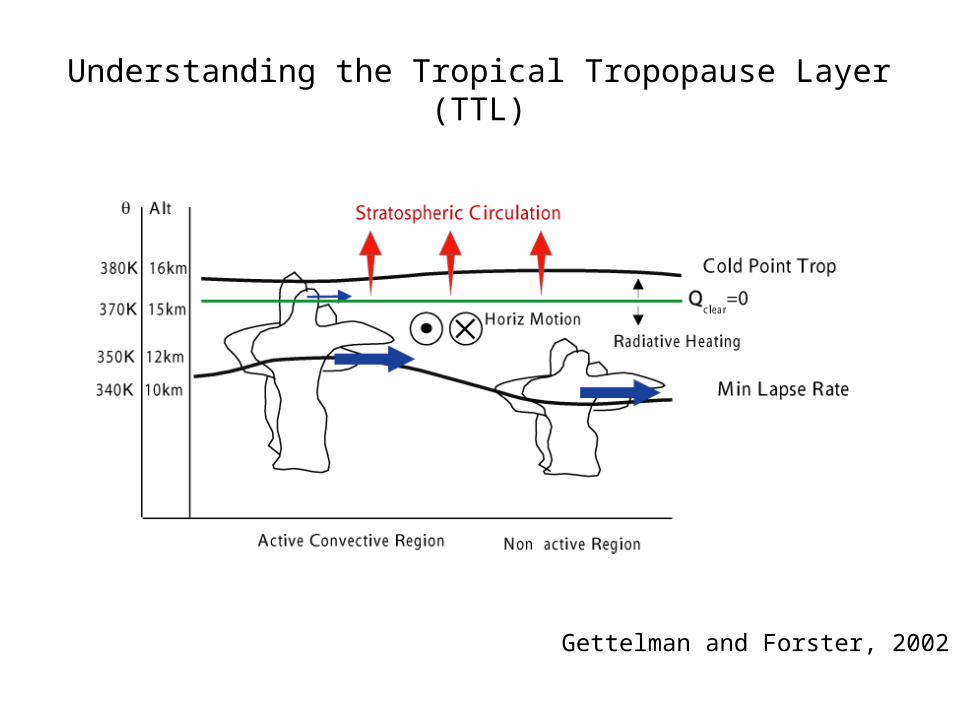
Understanding the Tropical Tropopause Layer (TTL)
Gettelman and Forster, 2002

Using GPS data to study the tropical tropopause
Bill Randel, NCAR

Vertical section through anticyclone (60-120 E)
warmtroposphere
cold lowerstratosphere
tropopause
deep convection

zonal winds
Background: stratospheric QBO
temperatures
CHAMP + SACC
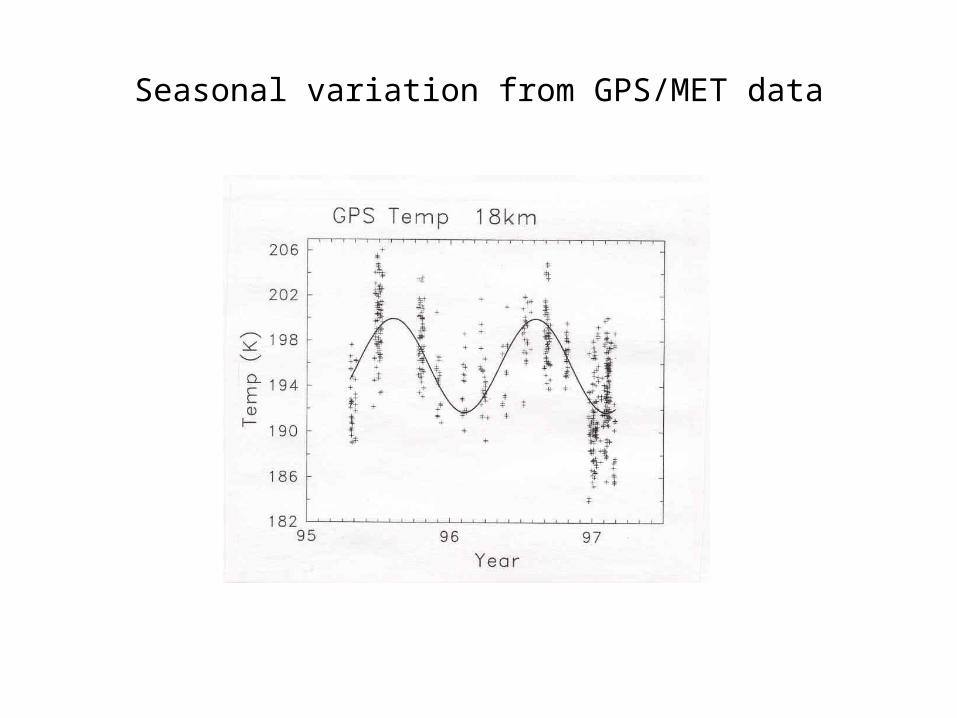
Seasonal variation from GPS/MET data