Using Geographical Information System and Remote Sensing to … · 2015-11-06 · Abbreviations:...
6
Received: 24 April, 2012. Accepted: 17 July, 2012. Original Research Paper The Asian and Australasian Journal of Plant Science and Biotechnology ©2012 Global Science Books Using Geographical Information System and Remote Sensing to Assess Suitability of Wheat Fields Affected by Climatic and Topographic Factors: A Case Study in Golestan Province, Iran Nasim Meghdadi • Behnam Kamkar * • Meisam Ghasemi Department of Agronomy, Gorgan University of Agricultural Science and Natural Resources (GUASNR), Pardis No 2, Postal code: 49189-43464; Gorgan, Iran Corresponding author: * [email protected] ABSTRACT In this study remote sensing (RS) and Geographical Information System (GIS) were integrated to detect cultivated wheat fields and to identify the suitability of those fields with respect to topographic and climatic factors affecting wheat yield. For this purpose, all raster layers related to climatic and topographic factors were provided by using different spatial functions and cultivated wheat fields were detected by a supervised detection method. Five different scenarios were considered to assess the consistency of wheat fields with suitable conditions. Among the five scenarios, fields with a slope 12%, and T max > 24°C (irrespective of rainfall value and aspect) covered 90.5% of all detected fields. 74.2% of current wheat fields were located in the North, and the study area did not have suitable conditions with respect to average temperature, but had a suitable slope and minimum and maximum temperatures. The temperature of the study area was in the range of cardinal temperatures for all common wheat cultivars cultivated in Golestan province. The area was not affected by salinity or pH restrictions and although 87.4% of fields had yield exceeding long-term recorded data, the absolute yield in the wheat fields was not high. Our results indicate that wheat grain yield in the study area changed from 1.6 to 4.4 ton ha -1 . Long-term average yield of wheat in this area is 3.5 ton ha -1 . Results revealed that integrating RS and GIS can help to identify field restrictions and to assess the problems and probable opportunities to improve obtainable yield and estimate the yield of wheat fields. _____________________________________________________________________________________________________________ Keywords: climatic restriction, land assessment, Triticum aestivum, yield map Abbreviations: GIS, geographical information system; RS, remote sensing INTRODUCTION The cultivated wheat area in Iran during the 2010-11 grow- ing season was around 6687014 ha. In Golestan province, wheat is grown on around 398160 ha per year with an average grain yield of 3.5 t ha –1 as the main winter crop. Wheat is the most important crop cultivated in irrigated and rainfed situations. Cultivated wheat grows best in locations where the climatic conditions meet their growth require- ments. Elevation, slope, aspect, soil (pH, drainage and tex- ture), land cover and many climatic factors that affect crop growth help to determine the most suitable crop growth areas. The process of land suitability classification involves the evaluation and grouping of specific areas of land in terms of their suitability for a defined use. The main objec- tive of land evaluation is to predict the inherent capacity of a land unit to support a specific land use for a long period of time without deterioration, in order to minimize the socio- economic and environmental costs (de la Rosa 2000). Nowadays, Geographical Information System (GIS) technology is becoming an essential tool for combining various maps and satellite information sources in models that simulate the interactions of complex natural systems. The value of GIS to agriculture continually increases as advances in this technology accelerate the need and op- portunities for the acquisition, management, and analysis of spatial data on the farm and throughout the agriculture value chain. At the national and local levels, possible GIS applica- tions are endless. For example, agricultural planners might use geographical data to decide on the best zones for a cash crop, combining data on soils, topography, and rainfall to determine the size and location of biologically suitable areas (Sivakumar and Hinsman 2001). Remotely sensed data also can be used to extract thematic information to create GIS layers. There are three ways to incorporate derived thematic layers (Campbell 2007). In this way, digital remote sensing data are analyzed or classified using automated methods to produce paper maps and images that are then digitized for entry into the GIS. Finally, digital remote sensing data are analyzed or classified using automated methods and then retained in digital format for entry into the GIS (Weng 2010). Any quantification and land suitability assessment would depend upon a variety of assumptions. Since land suitability analysis requires the use of different kind of data and information (soil, climate, land use, topography, etc.), GIS offers a flexible and more powerful tool than conven- tional data processing systems, as it provides a means of taking large volumes of different kinds of data sets and manipulating and combining the data sets into new data sets which can be displayed in the form of thematic maps (Mar- ble et al. 1984; Foote and Lynch 1996). The topographic characteristics, the climatic conditions and the soil quality of an area are the most important determinant parameters of the land suitability evaluations. Use of GIS allows the cons- truction of models from which a new thematic map (e.g. land suitability map) can be produced from a set of thematic maps (Harasheh 1994). Using different scenarios based on an area’s capabilities and characteristics can be helpful to interpret probable restrictions in production systems. This study aimed to integrate remote sensing (RS) and GIS to detect cultivated wheat fields and identify the suitability of fields with respect to topographic and climatic factors affecting wheat yield. ®
Transcript of Using Geographical Information System and Remote Sensing to … · 2015-11-06 · Abbreviations:...

Received: 24 April, 2012. Accepted: 17 July, 2012. Original Research Paper
The Asian and Australasian Journal of Plant Science and Biotechnology ©2012 Global Science Books
Using Geographical Information System and Remote Sensing to
Assess Suitability of Wheat Fields Affected by Climatic and Topographic Factors: A Case Study in Golestan Province, Iran
Nasim Meghdadi • Behnam Kamkar* • Meisam Ghasemi
Department of Agronomy, Gorgan University of Agricultural Science and Natural Resources (GUASNR), Pardis No 2, Postal code: 49189-43464; Gorgan, Iran
Corresponding author: * [email protected]
ABSTRACT In this study remote sensing (RS) and Geographical Information System (GIS) were integrated to detect cultivated wheat fields and to identify the suitability of those fields with respect to topographic and climatic factors affecting wheat yield. For this purpose, all raster layers related to climatic and topographic factors were provided by using different spatial functions and cultivated wheat fields were detected by a supervised detection method. Five different scenarios were considered to assess the consistency of wheat fields with suitable conditions. Among the five scenarios, fields with a slope � 12%, and Tmax > 24°C (irrespective of rainfall value and aspect) covered 90.5% of all detected fields. 74.2% of current wheat fields were located in the North, and the study area did not have suitable conditions with respect to average temperature, but had a suitable slope and minimum and maximum temperatures. The temperature of the study area was in the range of cardinal temperatures for all common wheat cultivars cultivated in Golestan province. The area was not affected by salinity or pH restrictions and although 87.4% of fields had yield exceeding long-term recorded data, the absolute yield in the wheat fields was not high. Our results indicate that wheat grain yield in the study area changed from 1.6 to 4.4 ton ha-1. Long-term average yield of wheat in this area is 3.5 ton ha-1. Results revealed that integrating RS and GIS can help to identify field restrictions and to assess the problems and probable opportunities to improve obtainable yield and estimate the yield of wheat fields. _____________________________________________________________________________________________________________ Keywords: climatic restriction, land assessment, Triticum aestivum, yield map Abbreviations: GIS, geographical information system; RS, remote sensing INTRODUCTION The cultivated wheat area in Iran during the 2010-11 grow-ing season was around 6687014 ha. In Golestan province, wheat is grown on around 398160 ha per year with an average grain yield of 3.5 t ha–1 as the main winter crop. Wheat is the most important crop cultivated in irrigated and rainfed situations. Cultivated wheat grows best in locations where the climatic conditions meet their growth require-ments. Elevation, slope, aspect, soil (pH, drainage and tex-ture), land cover and many climatic factors that affect crop growth help to determine the most suitable crop growth areas. The process of land suitability classification involves the evaluation and grouping of specific areas of land in terms of their suitability for a defined use. The main objec-tive of land evaluation is to predict the inherent capacity of a land unit to support a specific land use for a long period of time without deterioration, in order to minimize the socio-economic and environmental costs (de la Rosa 2000).
Nowadays, Geographical Information System (GIS) technology is becoming an essential tool for combining various maps and satellite information sources in models that simulate the interactions of complex natural systems. The value of GIS to agriculture continually increases as advances in this technology accelerate the need and op-portunities for the acquisition, management, and analysis of spatial data on the farm and throughout the agriculture value chain.
At the national and local levels, possible GIS applica-tions are endless. For example, agricultural planners might use geographical data to decide on the best zones for a cash crop, combining data on soils, topography, and rainfall to determine the size and location of biologically suitable areas (Sivakumar and Hinsman 2001).
Remotely sensed data also can be used to extract thematic information to create GIS layers. There are three ways to incorporate derived thematic layers (Campbell 2007). In this way, digital remote sensing data are analyzed or classified using automated methods to produce paper maps and images that are then digitized for entry into the GIS. Finally, digital remote sensing data are analyzed or classified using automated methods and then retained in digital format for entry into the GIS (Weng 2010).
Any quantification and land suitability assessment would depend upon a variety of assumptions. Since land suitability analysis requires the use of different kind of data and information (soil, climate, land use, topography, etc.), GIS offers a flexible and more powerful tool than conven-tional data processing systems, as it provides a means of taking large volumes of different kinds of data sets and manipulating and combining the data sets into new data sets which can be displayed in the form of thematic maps (Mar-ble et al. 1984; Foote and Lynch 1996). The topographic characteristics, the climatic conditions and the soil quality of an area are the most important determinant parameters of the land suitability evaluations. Use of GIS allows the cons-truction of models from which a new thematic map (e.g. land suitability map) can be produced from a set of thematic maps (Harasheh 1994). Using different scenarios based on an area’s capabilities and characteristics can be helpful to interpret probable restrictions in production systems. This study aimed to integrate remote sensing (RS) and GIS to detect cultivated wheat fields and identify the suitability of fields with respect to topographic and climatic factors affecting wheat yield.
®
The Asian and Australasian Journal of Plant Science and Biotechnology 6 (1), 62-67 ©2012 Global Science Books
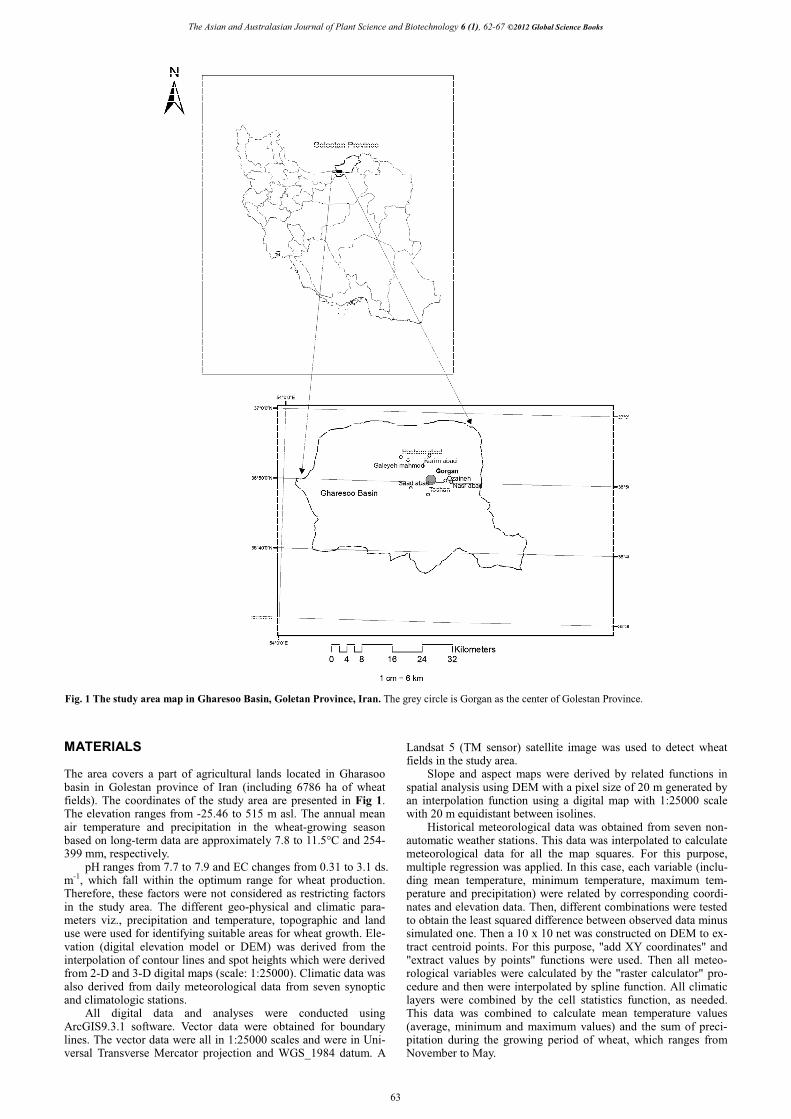
MATERIALS The area covers a part of agricultural lands located in Gharasoo basin in Golestan province of Iran (including 6786 ha of wheat fields). The coordinates of the study area are presented in Fig 1. The elevation ranges from -25.46 to 515 m asl. The annual mean air temperature and precipitation in the wheat-growing season based on long-term data are approximately 7.8 to 11.5°C and 254-399 mm, respectively.
pH ranges from 7.7 to 7.9 and EC changes from 0.31 to 3.1 ds. m-1, which fall within the optimum range for wheat production. Therefore, these factors were not considered as restricting factors in the study area. The different geo-physical and climatic para-meters viz., precipitation and temperature, topographic and land use were used for identifying suitable areas for wheat growth. Ele-vation (digital elevation model or DEM) was derived from the interpolation of contour lines and spot heights which were derived from 2-D and 3-D digital maps (scale: 1:25000). Climatic data was also derived from daily meteorological data from seven synoptic and climatologic stations.
All digital data and analyses were conducted using ArcGIS9.3.1 software. Vector data were obtained for boundary lines. The vector data were all in 1:25000 scales and were in Uni-versal Transverse Mercator projection and WGS_1984 datum. A
Landsat 5 (TM sensor) satellite image was used to detect wheat fields in the study area.
Slope and aspect maps were derived by related functions in spatial analysis using DEM with a pixel size of 20 m generated by an interpolation function using a digital map with 1:25000 scale with 20 m equidistant between isolines.
Historical meteorological data was obtained from seven non-automatic weather stations. This data was interpolated to calculate meteorological data for all the map squares. For this purpose, multiple regression was applied. In this case, each variable (inclu-ding mean temperature, minimum temperature, maximum tem-perature and precipitation) were related by corresponding coordi-nates and elevation data. Then, different combinations were tested to obtain the least squared difference between observed data minus simulated one. Then a 10 x 10 net was constructed on DEM to ex-tract centroid points. For this purpose, "add XY coordinates" and "extract values by points" functions were used. Then all meteo-rological variables were calculated by the "raster calculator" pro-cedure and then were interpolated by spline function. All climatic layers were combined by the cell statistics function, as needed. This data was combined to calculate mean temperature values (average, minimum and maximum values) and the sum of preci-pitation during the growing period of wheat, which ranges from November to May.
Fig. 1 The study area map in Gharesoo Basin, Goletan Province, Iran. The grey circle is Gorgan as the center of Golestan Province.
63

Wheat suitability assessment by GIS and RS. Meghdadi et al.
Cardinal temperatures of wheat cultivars which are cultivated in the study area were obtained from previous work by the U.S. Geological Survey (USGS method) and used to classify the land use classes. For this purpose, Ahmadi’s (2008) work using 24 multiplicative models were fitted to development rate in 8 sowing dates. This independent experiment was carried out at the Faculty of Agriculture, Gorgan University of Agricultural Science and Natural Resources, Iran in 2005-2006 in a completely randomized block experiment replicated four times. These models were 8 non linear temperature functions along with three non-linear photo-period functions which were used as combined models. An itera-tive optimization procedure was applied to estimate equation para-meters by the NLINDUD procedure in SAS (1990). Cardinal tem-peratures were determined as the parameters of a superior model.
In order to detect wheat fields in the study area, a supervised detection method was applied. Landsat 5 (TM sensor) image, which was acquired in June 2009, was used. Seven related bands were combined by two supplement bands which were obtained from spectral pre-processing procedures (PCA: principle compo-nent analysis and NDVI: Normalized difference Vegetation Index). Therefore, nine bands were used to detect wheat fields in the study area. Ground control points (228 fields) were also recorded using GPS (Garmin_MAP61 Model). Finally, 199 points were detected correctly. Kappa coefficient and general accuracy coefficient also were used to assess the accuracy of detected fields.
The five scenarios used to assess the situation of fields with respect to suitability for wheat production were:
Scenario I: Fields which were in south and east aspects, precipita-tion >350 mm and slope � 12%.
Scenario II: Fields with slope � 12%, Tmax > 24°C and rain > 350 mm. Scenario III: Fields with slope � 12%, Tmax > 24°C (irrespective to rainfall value and aspect). Scenario IV: Fields with slope � 12%, 22 � Tmax � 24°C (irres-pective to rainfall value and aspect). Scenario V: Fields with slope � 12%, Tmax < 22°C (irrespective to rainfall value and aspect).
These scenarios were selected to check their consistency with current cultivated wheat lands. Maximum temperature was selec-ted because it was closer to optimum temperature of wheat culti-vars in Golestan province. RESULTS AND DISCUSSION Crop area estimation performed by integration of GIS and RS has become the most widely used technique today in many countries. Crop estimation entails four independent components: a ground survey of randomly sampled areas based on a given method; a multi-temporal classification of satellite images covering the entire area; a combination of these two; and aggregation/disaggregation to different ad-ministrative levels (Pradhan 2001). We used these four processes to provide a map of wheat fields in the study area. The map of detected wheat fields by the supervised detec-tion method is presented in Fig. 2. All wheat fields in the study area were around 6786.24 ha. Overall accuracy coef-ficient was 0.85 and Kapa coefficient was significant at P < 0.01.
The data obtained from interpolated and tested layers
Fig. 2 Detected wheat fields by supervised classification method in the study area. Nine bands were used to detect wheat fields in the study area. 199 points from a total of 228 ground control points (228 fields) were correctly detected. Overall accuracy coefficient was 0.85 and Kapa coefficient was significant at P < 0.01.
64

The Asian and Australasian Journal of Plant Science and Biotechnology 6 (1), 62-67 ©2012 Global Science Books
revealed that average temperature during the wheat-grow-ing season in the study area changed from 7.8 to 11.5°C which was not within a favorable range. Optimum tempera-ture for wheat cultivars in Golestan province ranges from 26.8 to 28°C (Ahmadi 2008). Average maximum tempera-ture also ranges from 21.3 to 26°C. Therefore, in general, temperature regimes were far from optimum ranges but were within cardinal temperature ranges. The base tempera-ture for all cultivars cultivated in Golestan province ranges from 1.25 to 5°C, while the ceiling temperature is around 37°C (Ahmadi 2008). The slope changed from around flat to 88.9%. The slope was reclassified into two classes: � 12% and > 12%. Around 6327.88 ha were located in the �12% group, i.e., 93.2% of total land was in the favorable slope class.
The main parts of wheat fields in the study area (around 5033 ha) were located in the north aspect which, along with low radiation in the study area, could affect wheat grain yield dramatically. The areas located in the south and east aspects were around 376.8 and 84.8 ha, respectively.
Precipitation values also ranged from 254 to 399 mm during the wheat-growing season. In the study area, areas with precipitation > 350 mm were considered as rainfed fields. The yield raster layer was provided based on com-prehensive collected data from surveyed fields. The gene-rated layer with classic interpolation methods was tested with observed values in surveyed fields. The yield layer in detected fields is presented in Fig. 3. Results indicated that wheat grain yield in the study area ranged from 1.6 to 4.4 ton ha-1. Long-term yield of wheat in this area was 3.5 ton ha-1. Therefore, yield layer was divided into two classes (�
3.5 and > 3.5 ton ha-1). Results indicated that 5932.64 ha (87.4% of total cultivated wheat areas) had yield greater than the average value for the study area.
The layers of different scenarios were provided by the "Raster calculator" function in the spatial analyst tool. 90.5% of total cultivated wheat area (6142 ha) in the study area matched with Scenario III while related areas for sce-narios I, II and IV were 120.87 ha (1.78%), 500 ha (7.3%), and 130.47 ha (1.9%). Scenario VI did not cover any field. Fields for the most matched scenario (Scenario III) are presented in Fig. 4.
Overall, our results indicate that the main parts of wheat fields in the study area were not in the most suitable situa-tion. Aspect restriction together with many cloudy days during the wheat-growing season were the most important restricting factors to obtain higher yields in these fields. Although most fields in the study area have more yield than long-term average yield, the absolute yield was not high. 5033 ha (74.2% of total cultivated wheat lands) were in the north aspect with unfavorable conditions to capture incident radiation. Also, just 12.7% of total cultivated wheat lands could be in rainfed system and the rest should be irrigated. These lands were located in high slope lands with lower yield. Our results indicate that the main parts of cultivated wheat lands were on a suitable slope at maximum tempera-ture, although the average temperature was far from the optimum temperature for all wheat cultivars in the study area. These restrictions, especially with respect to aspect, low average temperature and sunshine hours (data not shown) could be considered as the main challenges to obtain better yield in wheat fields. Salinity and pH were not
Fig. 3 Reclassified map of wheat grain yield in the study area.
65

Wheat suitability assessment by GIS and RS. Meghdadi et al.
crucial and these fields were not affected by these limiting factors. Soil texture was also favorable for wheat cultivation in the study area. Therefore, it seems that among topogra-phic and climatic factors, aspect and average temperature were the main restricting factors. Undoubtedly, manage-ment options are also important in this case. Data mining procedures using comprehensive datasets could be a power-ful tool to clarify the role of management options with res-pect to the yield gap. These results indicate that integrating GIS and RS could be useful to detect challenges and create opportunities.
Developments in GIS and RS technologies and crop modeling have created promising opportunities for im-proving agricultural statistics systems (Aronoff 1989; Bur-rough 1986; Buiten and Clevers 1990; Laurini and Thomp-son 1992; Sharifi 1992; MacLean 1995; Molenaar 1998). Techniques in crop inventory systems that were based on the application of GIS, RS and agro-ecological models pro-vide examples of developments in each discipline [Taylor et al. 1997; Sharifi et al. 1997]. Several processes, such as derivation of improved land cover/use, crop production esti-mation, and data handling, are involved in each discipline and are the main components in the estimation and fore-casting of agricultural production [Maru 1997; Sharifi and De Meijere 1997). These techniques have been also used by others. Bhagat et al. (2009) performed suitability analysis by digital processing of geo-referenced data (elevation, cli-mate, soil and land cover) and calculating potential produc-tion areas by combining different types of geographical data through decision rules framed for different cereal crops in Himachal Pradesh (India) using GIS. Suitable areas have
been delineated for cereal crops in the form of land suita-bility maps. They found, in comparison to the actual area under cereal crops, the possibility of further expansion under each cereal crop. These discriminated areas appeared suitable for growing these crops and could be harnessed efficiently for achieving long-term sustainability and food security. Lobell et al. (2010) also combined Landsat remote sensing data with crop models to estimate wheat yields and sowing dates across roughly 1 Mha in Southern Punjab, India from 2003-2009 and analyze the spatial and temporal patterns of yields in other factors. Our results confirmed the capability of integrating GIS and RS to make effective and reasonable decision making on the cultivation of a crop. Undoubtedly, knowledge on ecological requirements are crucial to make decisions and to attempt to parameterize them is a necessity to present reasonable advice to help policy makers and farmers. ACKNOWLEDGEMENTS The authors thank Dr. Jaime A. Teixeira da Silva for making sig-nificant improvements to grammar. REFERENCES Ahmadi M (2008) Predicting phonological development in wheat (Triticum
aestivum L.). MSc thesis, Gorgan University of Agricultural Sciences and Natural Resources. 93 pp (in Farsi with English Abstract)
Aronoff (1989) Geographic Information Systems: A Management Perspective, WDL Publications, Ottawa, 290 pp
Bhagat RM, Sing S, Sood C, Rana RS, Kalia V (2009) Land suitability anal-ysis for cereal production in Himachal Pradesh (India) using Geographical
Fig. 4 Favorable and unfavorable lands base on Scenario III.
66
The Asian and Australasian Journal of Plant Science and Biotechnology 6 (1), 62-67 ©2012 Global Science Books
Information System. Journal of the Indian Society of Remote Sensing 37, 233-240
Buiten HJ, Clevers J (1990) Land Observation by Remote Sensing: Theory and Applications, Gordon & Breach Publishers, Amsterdam, 642 pp
Burrough, PA (1986) Principles of Geographical Information Systems for Land Resources Assessment, Oxford University Press, Oxford, 194 pp
Campbell JB (2007) Introduction to Remote Sensing (4th Edn), Guilford Press, New York, 626 pp
de la Rosa D (2000) MicroLEIS 2000: Conceptual Framework, Instituto de Recursos Naturales y Agrobiologia, CSIC, Seville, Spain. Available online: http://www.evenor-tech.com/microleis/microlei/manual2/pdfs/framework-eng.pdf
Foote KE, Lynch M (1996) Geographic Information Systems as an Integrating Technology: Context, Concepts and Definition, University of Texas, Austin. Available online:
http://www.utexas.edu/depts/grg/gcrafts/notes/intro/intro.html Lobell DB, Ivan Ortiz-Monasterio J, Lee AS (2010) Satellite evidence for
yield growth opportunities in Northwest India. Field Crops Research 118, 13-20
MacLean AL (1994) Remote Sensing and Geographic Information Systems: An Integration of Technologies for Resource Management: A Compendium, American Society for Photogrammetry and Remote Sensing, 244 pp
Marble DH, Calkins HW, Pequet DJ (1984) Basic Readings in Geographic Information Systems, SPAD System Ltd., Williamsville, NY
Molenaar M (1998) An Introduction to the Theory of Spatial Object Modelling for GIS, Taylor & Francis, London, 246 pp
Pradhan S (2001) Crop area estimation using GIS, remote sensing and area frame sampling. International Journal of Applied Earth Observation and Geoinformation 3, 86-92
Sharifi MA (1992) Development of an appropriate resource infor- mation sys-tem to support agricultural management at farm enterprise level. PhD thesis, Wageningen Agricultural University, Wageningen, 112 pp
Sharifi MA, Driessen P, van Keulen H, Bronsveld MC, Clavaux MBW, Lenaard J (1997) Development of crop inventory and forecasting system for the major agricultural commodities in Hamadan Province, Islamic Republic of Iran. Mid-Term Report, 140 pp
Sivakumar MKV, Hinsman Donald E (2001) Satellite remote sensing and GIS applications in agricultural meteorology and WMO satellite activities. In: Sivakumar MVK, Roy PS, Harmsen K, Saha SK (Eds) Satellite Remote Sensing and GIS Applications in Agricultural Meteorology, Proceedings of a Training Workshop held in Dehra Dun, India, 7-11 July 2003. Geneva, Swit-zerland: World Meteorological Organization, pp 1-21
Taylor J, Sannier C, Delincé J, Gallego FJ (1997) Regional Crop Inventories in Europe Assisted by Remote Sensing: 1988-1993. Synthesis Report. EUR 17319 EN, Office for Publications of the EC, Luxembourg, 71 pp
Weng Q (2010) Remote Sensing and GIS Integration, The McGraw-Hill Co. Inc., New York, 433 pp
67

![[REMOTE SENSING] 3-PM Remote Sensing](https://static.fdocuments.in/doc/165x107/61f2bbb282fa78206228d9e2/remote-sensing-3-pm-remote-sensing.jpg)