Using GC-MS, LC-MS and FT-ICR-MS data for structure...
42
COSMOS – Small Molecule Conference San Jose, California, July 28 th 2008 Tobias Kind - fiehnlab.ucdavis.edu UC Davis Genome Center –Metabolomics Using GC-MS, LC-MS and FT-ICR-MS data for structure elucidation of small molecules
Transcript of Using GC-MS, LC-MS and FT-ICR-MS data for structure...

COSMOS – Small Molecule Conference San Jose, California, July 28th 2008
Tobias Kind - fiehnlab.ucdavis.eduUC Davis Genome Center –Metabolomics
Using GC-MS, LC-MS and FT-ICR-MS data for structure elucidation of small molecules

Techniques and metabolite coverage
Image source: © Gert Wohlgemuth – The nice lab series

Techniques and tools @ FiehnLab
LC-MSUPLC-MS
monolithic LCHILIC, RP, NP
GC-TOF-MSGCxGC-TOF-MSQuadrupole-GC-MSPyrolysis-GC-MS
BioInformatics and ChemInformatics
BinBase and SetupXStatistics and machine learning
Open Source + commercial software
LTQ-FT-MSvia CoreLab
Gas Chromatography FT-ICR-MS Liquid Chromatography

Metabolomic profiling:• provides spatial and temporal snapshots of all metabolites• includes primary and secondary metabolites (no proteins)• diverse species and organs
Problem: • small sample amounts from diverse individuals• diverse sets of molecules and molecule classes• large sample sets
Therefore: • each run requires high chromatographic resolution• identification via RT, MS , MSn library search• instead of unique identification – annotation of unknown compounds
• identification of new unknowns requires sample fractionation and identification is usually performed by NMR
Metabolomic profiling

SetupX LIMS covers plants, animals, fungi, bacteria
Arabidopsis lyrata subsp. lyrataAcyrthosiphon pisumArabidopsis thalianaBrassica napusBeta vulgaris subsp. vulgarisCitrus sinensisCucumis meloChlamydomonas reinhardtiiHomo sapiensLupinus albusLactuca sativaLycopersicon esculentumMus musculus domesticusMalus x domesticaMus musculusMus sp.Medicago sativaNicotiana tabacumOvis ariesRattus norvegicusSaccharophagus degradansTriticum aestivumVitis rotundifoliaVitis sp.Vitis viniferaZea mays
Picture source: SetupX; Wikipedia

BinBase GC-MS platform performance parameters
BinBase:• screens for 700 metabolites
in each single run
• identifies 130 known metabolites per single run
• annotates 200 unknown metabolites per run
• can process Hundreds of samples
• contains 2.6 million mass spectra and RI sets from 11,000 samples
Problem:481 known compounds but 2220 unknown compoundsare annotated in all acquired samples.
Solution:Elucidate unknown structures and update annotation for all old and new samples in BinBase
18% known
82% unknown
metabolites
sam
ples
Creative solutions using existing technology
Image source: © Gert Wohlgemuth – The nice lab series

25-3-solanin-LTQ-pos-0V #31-282 RT: 0.10-0.89 AV: 252 NL: 1.27E4T: ITMS + p NSI Full ms [120.00-2000.00]
866 868 870 872 874m/z
0
10
20
30
40
50
60
70
80
90
100
Rel
ativ
e A
bund
ance
868.54548
869.54548
870.54548
871.54548866.45457 873.54548
Before centroiding
Enhancing mass accuracy on a linear iontrap MSSelecting the correct centroiding algorithm
After centroiding
45.66Result [ppm]
868.505820Calculated M
868.545480Experimental M
25-3-solanin-LTQ-pos-0V #31-282 RT: 0.10-0.89 AV: 252 NL: 1.27E4T: ITMS + p NSI Full ms [120.00-2000.00]
866 868 870 872 874m/z
0
10
20
30
40
50
60
70
80
90
100
Rel
ativ
e A
bund
ance
868.51274
869.54054
870.56176
871.56164866.46886 873.75101
45.6 ppm 7.9 ppm
7.96Result [ppm]
868.505820Calculated M
868.512740Experimental M
Example: Solanine; PubChem CID: 30185 ; ZGVSETXHNHBTRK-OTYSSXIJBP
Only LTQ linear ion trap used for this example (no Orbitrap, no FT-MS)Also useful for high resolution modes with Orbitrap or FT-MSSoftware approach for profile mode

Enhancing resolving power – the LTQ UltraZoom mode
Reserpin-ULTRAZOOM-highres #12-36 RT: 0.09-0.30 AV: 25 NL: 2.30E5T: ITMS + p ESI u Z ms [604.00-614.00]
609 610 611 612 613m/z
0
10
20
30
40
50
60
70
80
90
100
Rel
ativ
e A
bund
ance
609.27339R=10922
610.26196R=10210
611.25899R=9223 612.26364
R=13004613.25787R=10714
609.94414R=13662
610.78327R=28050
Normal profile scan mode UltraZoom SIM mode
A01-reserpine-nanomate_080117183750 #23-112 RT: 0.05-0.25 AV: 90 NL: 4.47E5T: ITMS + p ESI sid=30.00 Full ms [150.00-1300.00]
608 609 610 611 612 613 614m/z
0
10
20
30
40
50
60
70
80
90
100
Rel
ativ
e A
bund
ance
609.28486R=1343
610.30113R=1296
611.32037R=1309 612.32978
R=1293613.24466
R=1179
Resolving Power: 1343 Resolving Power: 10992
Switching from normal profile scan mode to UltraZoom mode enhances the true mass resolving power by factor 10 for linear iontrap (no Orbitrap, no FT-MS for this example)Problem: low scan speed and scan range

D:\Opteron-Saver\...\Reserpine-ionmapReserpine-iontree
Reserpine-ionmap RT: 0.01 - 4.99 Mass: 100.00 - 650.00 NL: 7.36E3
1 2 3 4Time (min)
100
200
300
400
500
600
m/z
Reserpine-iontree3 #45-45 RT: 0.48-0.48 AV: 2 NL: 5.64E5T: ITMS + c ESI d Full ms3 [email protected] [email protected] [110.00-460.00]
150 200 250 300 350 400 450m/z
0
10
20
30
40
50
60
70
80
90
100
Rel
ativ
e A
bund
ance
195.00
236.06
416.17204.01167.05144.08 384.15332.24248.21286.15 430.21
Reserpine-iontree3 #215 RT: 2.75 AV: 1 NL: 3.15E4T: ITMS + c ESI d Full ms4 [email protected] [email protected] [email protected] [50.00-250.00]
60 80 100 120 140 160 180 200 220 240m/z
0
10
20
30
40
50
60
70
80
90
100
Rel
ativ
e A
bund
ance
204.10
163.03120.05
144.05 172.12148.03 206.11178.98106.98 141.1691.01 218.23
MS3
MS4
Ion Map – for all m/z valuesIn mass range 100-650 Da one MS/MS spectrum
Ion Tree – performdata dependent MS2,MS3,MS4
scans over whole mass range
Use all mass spectral fragmentation modes on a linear iontrap
Comprehensive ion mapping and ion tree experiments using diverse compound sets will solve many fragmentation mysteries

Pic
ture
: Wat
ers
GC
T H
elp
fil
e
Increase intensity of low abundant molecular ions GCT high mass tune electron impact (EI)
Component at scan 685 (9.669 min) [Model = +1 putrescine_RI 58829850 80 110 140 170 200 230 260 290 320 350 380
0
50
100
50
100
5973
86
86
100
100
114 130
130
146
146
174
174
200
200
214
214 228
361
361
376
376
Putrescine 4TMSMW = 376.25814
Idea: Salvatore Abate (FiehnLab)
• lowering EI energy would result in huge abundance loss• creative idea: change TOF beam steering and focus on GCT• tune abundance in higher mass regions• works good with alkanes, FAMES, N-TMS, O-TMS cmpds.• molecular ion needed for molecular formula determination• additional confirmation with chemical ionization possible
GCT High Mass Tune EI70 eV
Normal Electron Impact (EI)70 eV

09-Jul-2008 14:22:4570eV; 200uATrap Current; mass range 65-800; ScanRate0.15-0.03; source tempe 250C;PushInter 40
m/z60 70 80 90 100 110 120 130 140 150 160 170 180 190 200 210 220 230 240 250 260 270 280 290 300 310 320 330 340 350 360
%
0
100
%
0
100AlkaneFAMEmix_split50_07-09-08_EI_70eV_matchingLibrery_acq55-800_RT30min_5 2436 (12.869) Cm (2433:2440-2392:2425x1.100) TOF MS EI+
2.21e471.0810;-99.1190
85.0970-85.1030
99.1150-71.0850
113.1313-57.0687
127.1480;-43.0520169.1969-1.0031 183.2130;13.0130211.2441;41.0441239.2762;69.0762 338.3982
168.1982267.3086;97.1086
AlkaneFAMEmix_split50_07-09-08_EI_70eV_HighMass_acq55-800_RT30min_6 2435 (12.866) Cm (2432:2439-2396:2422x1.100) TOF MS EI+ 3.79e385.0995;-85.1005
99.1162-71.0838
127.1485-43.0515
141.1648;-29.0352
169.1965;-1.0035183.2132;13.0132197.2275;27.0275 338.3980
168.1980225.2596;55.0596239.2765;69.0765267.3074;97.1074
295.3436;125.1436339.3988;169.1988
GCT high mass tune in electron impact mode
Abund. (M•+) = 4%
EI (70 eV)
TOF High Mass TuneEI (70 eV)
Increase abundance of molecular ion for reliable molecular formula determinationExample; Tetracosane; C24H50; MW = 338.39123 InChIKey: POOSGDOYLQNASK-UHFFFAOYAT
Abund. (M•+) = 24%
Idea: Salvatore Abate (FiehnLab)

Component at scan 792 (10.313 min) [Model = +307u] in c:\ ma D-Fructose, 1,3,4,5,6-pentakis-O-(trimethylsilyl)-, O-methyloxime50 90 130 170 210 250 290 330 370 410 450 490 530 570
0
50
100
50
100
58
59
73
73
89
103
103
133
133
147
147
204
217
217
231
231
277
277
291
307
307
335
335
364
364
376390 434
437464464
492492
522 554
554
O
O
O
SiN
Si
Si
O
O
O
Si
Si
MS DB Search is possible with high mass tune spectra
• NIST Hybrid search gives correct results• Hybrid search uses both the logic of normal searching plus
the logic of neutral loss searching• Absolute intensity for molecular ion is sufficiently high
for molecular formula determination(Text File) Component at scan 792 (10.313 min) [Model = +30
345 385 425 465 505 5450
5
10364
376 407
437
464 492 523
554569
ZOOM
EI (70 eV)
High tuneEI (70 eV)

Machine learning in metabolomics
Image source: © Gert Wohlgemuth – The nice lab series

Idea of automated substructure detection
NSi
OOSi s1
s2
s3
s4
s5
O
Si N
Si O
O
O
160 170 180 190 200 210 220 230 240 250 260 270 280 2900
50
100
250 260 270 280 2900
50
100
91
105
120
126
134 148
162
176
192
206
222
234 242 250
266
281
80 90 100 110 120 130 140 150 160 170 180 190 200 210 220 230 240 250 260 270 280 2900
50
100
91
105
120
126
134 148
162
176
192
206
222
234 242 250
266
281
Aim1: take unknown mass spectrum – predict all substructuresAim2: classification into common compound classes (sugar, amino acid, sterol)SuperAim1: database lookup of formula and refine with detected substructures SuperAim2: generation of complete structure using isomer generators
Pioneers: Dendral project at Stanford University in the 1970s Varmuza at University of ViennaSteve Stein at NISTMOLGEN-MS team at University Bayreuth

MS Spectrum f1 f2 f3 f4 f5 fnMS1 100 20 50 60 0 0MS2 100 20 50 60 0 20MS3 100 20 60 50 0 0MS4 0 40 20 50 0 40MS5 0 40 20 50 0 40
MS Feature matrixMS Feature matrix
Substructure s1 s2 s3 s4 s5 snMolecule1 Y Y N Y Y NMolecule2 Y Y N Y Y NMolecule3 Y Y N Y Y NMolecule4 N N N Y Y YMolecule5 N N N Y Y Y
Substructure matrixSubstructure matrix
NSi
OOSi s1
s2
s3
s4
s5
O
Si N
Si O
O
O
Principle of mass spectral features
160 170 180 190 200 210 220 230 240 250 260 270 280 2900
50
100
91
105
120
126
134 148
162
176
192
206
222
234 242 250
266
281
Mass Spectral Features• m/z value• m/z intensity• delta ( m/z)• delta ( m/z) x intensity• non linear functions • intensity series
f2
f3
f1
80 90 100 110 120 130 140 150 160 170 180 190 200 210 220 230 240 250 260 270 280 2900
50
100
91
105
120
126
134 148
162
176
192
206
222
234 242 250
266
281
80 90 100 110 120 130 140 150 160 170 180 190 200 210 220 230 240 250 260 270 280 2900
50
100
91
105
120
126
134 148
162
176
192
206
222
234 242 250
266
281
Mass Spectral Features• m/z value• m/z intensity• delta ( m/z)• delta ( m/z) x intensity• non linear functions • intensity series
f2
f3
f1

Automated machine learning workflow in Statistica Dataminer
Use of meta-learning principles: combined use of neural networks, support vector machines, CARTto find reliable and robust models (tree models sometimes topple)

Mass spectral deconvolution -spectral search and MS prediction
Image source: © Gert Wohlgemuth – The nice lab series

Peak picking and mass spectral deconvolutionare needed for LC-MS and GC-MS
44
0
22
33
11
15.40 15.50 15.60 15.70 15.80 15.90 16.00 16.10 16.20 16.30 16.40 16.50
100
0
50
75
25
20 40 60 80 100 120 140 160 180 200 220 240 260 280 300 320 340
137.1
260.2
245.2216.2
284.3190.2 322.2 340.221.0
Time [min]
(A) Automation can detect peaks under baseline (B) Automation can detect and clean overlapping (non-resolved) peaks
m/z
Case (A)
Case (B)
Baseline
Extracted clean mass spectrumwith red triangle above
Example with MassFrontier(Not to be confused with simple feature detection)

Mass Spectral Trees in Mass Frontier
MassFrontier searches MSn and CID mass spectraSource: MassFrontier Helpfile

In-silico fragmentation with MassFrontierusing fragmentation library of 20,000 mechanisms from literature

Retention time prediction
Image source: © Gert Wohlgemuth – The nice lab series

LC retention time prediction
Troublemakers: Compounds withmultiple ionizable groups and complexpKa and logD profiles.
Metabolites like thymidine monophosphatehave multiple micro species depending on pH
LC retention time prediction is possible,but only useful with large datasets (n>500) covering a broad range of metabolites.
Each model specific to special columnand solvent profile.
pkA and descriptor calculation with ChemAxon Marvin

y = 1.0191x + 0.5298R2 = 0.8744
0
5
10
15
20
25
30
35
40
45
0 5 10 15 20 25 30 35 40
experimental RT [min]
pred
icte
d R
T [m
in]
Retention time prediction for LC
32Observations
3.775187Standard Error
0.8702Adjusted R Square
0.874387R Square
0.935087Multiple R
Regression Statistics Test Set
Development set n = 48 (60%)
logDpH=1.00 <= -3.71 : | aromaticatomcount <= 7.5 : | | logDpH=1.00 <= -5.335 : LM1 (9/4.109%)| | logDpH=1.00 > -5.335 : | | | logDpH=5.00 <= -4.58 : LM2 (5/3.77%)| | | logDpH=5.00 > -4.58 : LM3 (15/3.734%)| aromaticatomcount > 7.5 : LM4 (11/24.165%)logDpH=1.00 > -3.71 : | ssCH2 <= 0.5 : | | logDpH=1.00 <= -1.99 : LM5 (4/0.468%)| | logDpH=1.00 > -1.99 : | | | logDpH=1.00 <= -0.865 : LM6 (8/20.756%)| | | logDpH=1.00 > -0.865 : LM7 (3/2.039%)| ssCH2 > 0.5 : | | Count_N <= 1.5 : | | | logDpH=1.00 <= -2.44 : LM8 (3/4.862%)| | | logDpH=1.00 > -2.44 : LM9 (3/26.501%)| | Count_N > 1.5 : LM10 (19/20.042%)
LM num: 1RTd (minutes) =
0.3176 * aromaticatomcount+ 0.8153 * logDpH=1.00 + 0.1985 * logDpH=5.00 - 0.3533 * logDpH=9.00 + 0.4969 * sOH+ 0.3158 * dO+ 0.7638 * ssCH2
…cut + 7.3651
Exa
mpl
e Cl
assif
icat
ion
tree
mod
el, d
iffer
ent f
rom
gra
phic
s
• Development set too small (n= 48), multi ionizable compounds, large errors• Model is a hybrid voting approach using multiple regression trees• Based on logD (distribution coefficient at different pH) and Kier&Hall• RT models can be used as post-screening filter after database search
Data Source: Lu W, Kimball E, Rabinowitz JD. J Am Soc Mass Spectrom. 2006 Jan;17(1):37-50; LC method using 90 nitrogen metabolites on RP-18 QSRR Model: Tobias Kind (FiehnLab) using ChamAxon Marvin and WEKA

Retention index prediction for GC
Use of RI prediction algorithm:Having correct molecular formulas from the Waters GCT we can use the Seven Rules and lookupthese formulas in isomer databases and further refine candidates with retention index data
Conclusion: NIST RI prediction can be used for removal of outliers and class detectionAlgorithm is not accurate enough for TMS compounds and single isomer identificationNIST RI DB: 20 column types; 50 different phase ratios; 22 different column lengths;
700
800
900
1000
1100
1200
1300
1400
1500
1600
0 2000 4000 6000 8000 10000 12000 14000
All C8H16O2 isomers
Kov
ats
rete
ntio
n in
dex
Esters andEther isomers
Alcohols Carboxylic acids and diverse isomers

Applications and examples for GC-MS
Image source: © Gert Wohlgemuth – The nice lab series

Workflow for GC-MS structure elucidation
EI/CIGC-MS
SetupX BinBase DB
Plan experimentCollect MSI meta data
Acquire EI and CIAccurate mass, M+
Align true metabolitesuse spectral meta data
EI mass spectra
Substructure algorithmInterpret mass spectra
SetupX / BinBaseWeb GUI
MS, RI, RAWmeta data
CImass spectra
Rank and refine molecular formulas
Substructurealgorithm
Accurate massMolecular ion
Seven GoldenRules
DB
PubChem PUGChemspider API
Isomersstructures
Retention Indexprediction
Bellerophon
Set of possible isomer structures
Exclude wrong candidates
Combine + refineall informationassign MetaboScore
Highly reproducibleEI mass spectra

Molecular ions, accurate masses and accurate isotopic abundances
60 90 120 150 180 210 240 270 300 330 360 390 420 450 480
0
50
100
50
100
73 87
89
99 114
117
131 147
147
165
175
191
191
203
219
219
233
247
249
265267
307
307324327
340353
381
381
396
397
425
437 469 493
Chemical Ionization (+)
ElectronImpact (+)
[M+H]+
[M+28]+
[M+40]+
m/z394.0 396.0 398.0 400.0 402.0 404.0 406.0
%
0
100
70eV; 500uA Emission; 40% CI gas; mass range 65-800; ScanRate0.2-0.03; source tempe 200C;PushInter 40
TOF MS CI+
1.43e+003
397.1690
396.1648
395.2110
398.1729
399.1714
400.1689 401.1606
m/z394.0 396.0 398.0 400.0 402.0 404.0 406.0
%
0
100
70eV; 500uA Emission; 40% CI gas; mass range 65-800; ScanRate0.2-0.03; source tempe 200C;PushInter 40
TOF MS CI+
1.43e+003
397.1690
396.1648
395.2110
398.1729
399.1714
400.1689 401.1606
[M+H]+ is very abundant in CI; even election species (not a radical)M+28.02=[M+C2H5]+ and M+40.04=[M+C3H5]+ are used for verification of [M+H]+
Mass accuracy and isotopic abundance accuracy depend heavily on ion statistics Set accurate mass limit (+/- 5 ppm) and accurate isotopic abundance limit (+/- 5%)
Accurate mass [u] 397.1690Mass accuracy [ppm] 5Isotopic abundance error [%] 5A+1 [%] 37.90A+2 [%] 17.84A+3 [%] 5.03

The molecular formula space of small moleculescalculated by the Seven Golden Rules
Source http://fiehnlab.ucdavis.edu/projects/Seven_Golden_Rules/Molecular-Formula-Space/
Each molecular formula can expand to billions of structural isomers.Molecular Formula ≠ Molecular Isomer
8,000,000,000possible elemental compositions< 2000 Da, CHNSOP, Lewis+Senior
600,000,000highly probable formulasusing Seven Golden Rules
The molecular formula space
700,000 formulae inPubChem covering10,000,000 isomers
50,000 elemental compositionsNaturals, Drugs, Toxicants
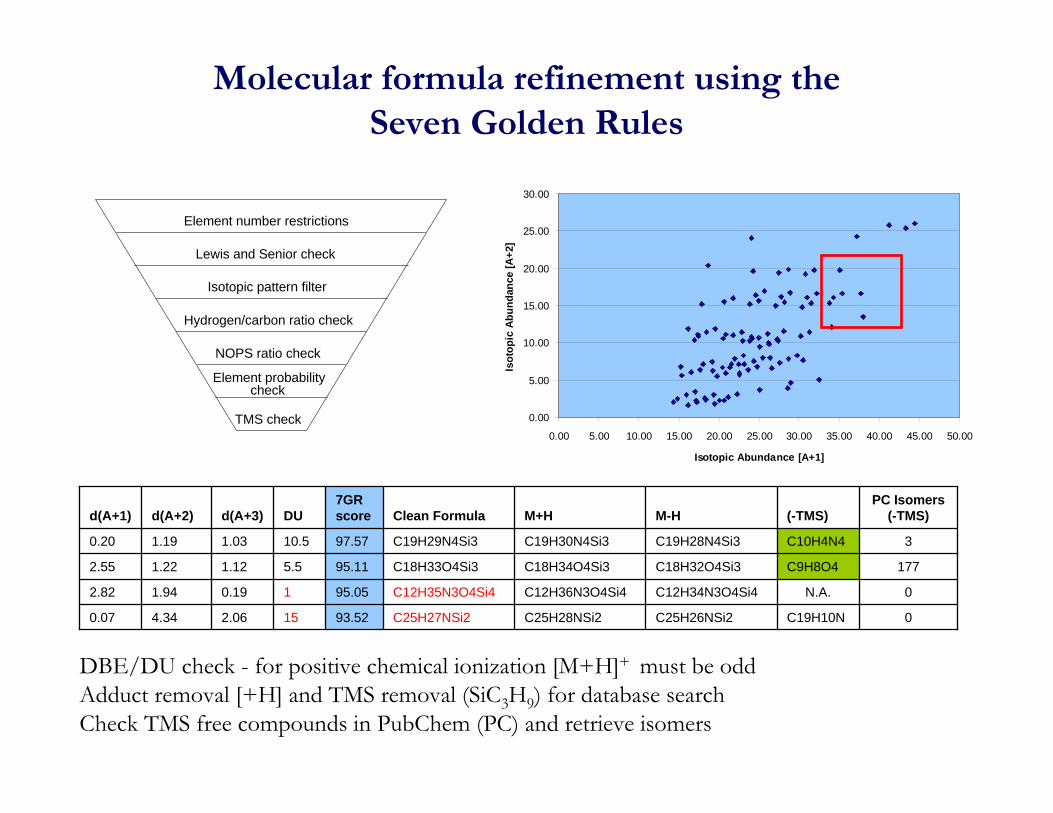
Molecular formula refinement using the Seven Golden Rules
0C19H10NC25H26NSi2C25H28NSi2C25H27NSi293.52152.064.340.07
0N.A.C12H34N3O4Si4C12H36N3O4Si4C12H35N3O4Si495.0510.191.942.82
177C9H8O4C18H32O4Si3C18H34O4Si3C18H33O4Si395.115.51.121.222.55
3C10H4N4C19H28N4Si3C19H30N4Si3C19H29N4Si397.5710.51.031.190.20
PC Isomers (-TMS)(-TMS)M-HM+HClean Formula
7GR scoreDUd(A+3)d(A+2)d(A+1)
DBE/DU check - for positive chemical ionization [M+H]+ must be oddAdduct removal [+H] and TMS removal (SiC3H9) for database searchCheck TMS free compounds in PubChem (PC) and retrieve isomers
0.00
5.00
10.00
15.00
20.00
25.00
30.00
0.00 5.00 10.00 15.00 20.00 25.00 30.00 35.00 40.00 45.00 50.00
Isotopic Abundance [A+1]
Isot
opic
Abu
ndan
ce [A
+2]
Element number restrictions
Lewis and Senior check
Isotopic pattern filter
Hydrogen/carbon ratio check
NOPS ratio check
Element probability check
TMS check

Database search of molecular formulas
A
B
C
D
CSLS: 250 hits for C9H8O4
ChemSpider: 480 for C9H8O4Programmatic access via Chemspider MS API
PubChem: 177 for C9H8O4Programmatic access via PubChem PUGPower User Gateway web-services
Molgen (Demo) constructed isomers: 402,560,255 for C9H8O4

Refine isomer DB search results by hydrogen bond donors and biological databases
• Limit number of H bond donor groups known from number of TMS groups
4H-Bond Acceptor
3H-Bond Donor
1.5XLogP
C9H8O4Molecular Formula
180.15742 [g/mol]Molecular Weight
689043Compound ID
3,4-dihydroxycinnamic acid
• Use only KEGG metabolic pathways as source database – two possible results left
p-Hydroxyphenylpyruvic acid4H-Bond Acceptor
3H-Bond Donor
1.4XLogP
C9H8O4Molecular Formula
180.15742 [g/mol]Molecular Weight
636708Compound ID
Final result:2 isomers
out of 19 isomersout of 177 isomers
19 isomers out of 177 results

Applications and examples for LC-MS
Image source: © Gert Wohlgemuth – The nice lab series

General LC-MS data processing for small molecules
Confirm with MS/MS or MSn fragmentation
100
0
50
200 400 600
MS2

UPLC_C8_DataDependent_Chlamy_07030703... 3/7/2007 3:21:28 AM
RT: 0.00 - 44.99
0 5 10 15 20 25 30 35 40Time (min)
0
10
20
30
40
50
60
70
80
90
100
Rel
ativ
e Ab
unda
nce
18.3017.80
19.11
29.36
28.7420.16 30.30
11.27 43.9730.5523.00
43.6817.49 23.80
10.31 16.079.55 31.531.56 6.37 43.0937.19
NL: 1.68E6m/z= 70.00000-2000.00000 F: FTMS + p NSI Full ms [200.00-1200.00] MS UPLC_C8_DataDependent_Chlamy_070307032128
UPLC_C8_DataDependent_Chlamy_070307032128 #1414 RT: 18.30 AV: 1 NL: 8.23E5F: FTMS + p NSI Full ms [200.00-1200.00]
754 755 756 757 758 759 760 761 762m/z
0
10
20
30
40
50
60
70
80
90
100
Rel
ativ
e A
bund
ance
756.57745R=55401
757.58209R=55100
758.58636R=56100
759.59546R=60400
762.29700R=49901
755.57501R=60200
756.89417R=86600
760.60144R=52200
756.26086R=87000
754.57471R=50200
757.90027R=79200
761.59888R=62600
LC-MS run 40 minutesC8 column, Agilent-UPLCChlamydomonas extract
FT-ICR-MS mass spectrumMS1 @ 50,000 resolving powerCheck charge state = 1756.57 represents [M+H]+
+
Deconvolution and evaluation of LC-MS data
Picture: nrel.gov
Chromatogram Source: N.Saad, DY Lee FiehnLab
LC-MSChromatogram
ExtractedMass spectrum

100
0
50
75
25
10.00 15.00 20.00 25.00 30.00 35.00 40.00 45.00
100
0
50
75
25
200 300 400 500 600 700 800 900 1000 1100 1200
756.577
706.568585.457 871.588324.209 436.437 951.566 1107.90237.733 1196.27516.755 805.909
Deconvolution and evaluation of LC-MS data
LC-MS detected compoundMarked with blue triangle
Extracted MS1 peakLibrary search useless(only single peak)
LC-MS detected compoundMarked with blue triangle141 peaks extracted
Example with HighChem Mass Frontier

UPLC-FT-MS data extraction with MassFrontier
100
0
50
75
25
250 300 350 400 450 500 550 600 650 700
478.45496.46
236.20
434.52391.34 687.72335.56271.06
Mass Frontier 5.0 Report
File MS1 FTMS + p NSI Full #1414
100
0
50
755 760
756.577
File MS 2 ITMS + c NSI d Full 756.58 #1415
100
0
50
200 400 600
478.45 496.46
335.56
100
0
50
75
25
751 752 753 754 755 756 757 758 759 760 761 762
756.577MS1
MS2
MS1
MS2
Fragment peaks m/z 478.45 and 496.46
Approach: generate molecular formula using Seven Golden Rules;find matching isomers in molecular databases;confirm possible matches by in-silico fragmentation (usually impossible);

Isotopic pattern equally important as accurate mass
0.00
5.00
10.00
15.00
20.00
25.00
0.00 20.00 40.00 60.00 80.00
Isotopic Abundance A+1 [%]
Isot
opic
Abu
ndan
ce A
+2 [%
]
756.5 757.0 757.5 758.0 758.5 759.0 759.5m/z
0
10
20
30
40
50
60
70
80
90
100
Rel
ativ
e A
bund
ance
756.57745R=55401
757.58209R=55100
758.58636R=56100
759.59546R=60400
756.5 757.0 757.5 758.0 758.5 759.0 759.5m/z
0
10
20
30
40
50
60
70
80
90
100
Rel
ativ
e A
bund
ance
756.57745R=55401
757.58209R=55100
758.58636R=56100
759.59546R=60400
m/z Intensity Relative Resolution
756.5765 589034.1 100 54901757.5814 279455.2 47.44 55100758.5862 64293.3 10.92 56100756.5526 19173.8 3.26 52000759.593 9656.4 1.64 56000
A+1 = 47.44%
A+2 = 10.92 %
We can discard all other resultsoutside the error box.Current box reflect +/- 10% error.
Experimental result Abundances for all molecular formulae

Seven Golden Rules – generate possible molecular formulas
5 formula candidates left with 30 ppm mass accuracy and 10% isotopic abundancesThese are candidates with good isotopic pattern match. These 5 were found in PubChem.C42H78NO8P - 1 isomer hitC42H77NO10 - 1 isomer hitC39H73N5O9 - 0 isomer hitC43H82NO7P - 2 isomers foundC43H73N5O6 -2 isomers foundC45H77N3O6 - 1 hit foundC45H69N7O3 - 1 hit found
Scan speed problem: Due to poor ion statistics only few scans are collectedMass accuracy and isotopic abundance accuracy are bad

Structural isomer lookup example in ChemSpider

In-silico fragmentation and metabolite scoring
C42H78NO8P fragments N.A.
Experimental peaks m/z 478.45 and 496.46 were detected in MS/MS spectrum
In-silico fragmentation should match the experimental fragmentation.In-silico - using a computer library of 20,000 fragmentation rules from the MS literature within MassFrontier
Assign metabolite score according toretention range (logP/logD) or accurate RI prediction and MS/MS match between experimental and predicted spectra
The metabolite score is computed from multiple orthogonal match factors.
C42H77NO10 no fragments N.A.
C45H69N7O3 fragments: m/z 496
C43H82NO7Pfragments m/z 478 and 496
C43H82NO7PH no fragments N.A.
High Metabolite Score
Low Metabolite Score

Thank you!
Fiehn LabDr. Oliver Fiehn (PI)Martin Scholz (SetupX)Mine Palazoglu (Library)Dr. Tobias Kind Dinesh Kumar Barupal (pyrGC)Do Yup Lee (Library)Gert Wohlgemuth (BinBase)Kirsten Skogerson (NMR, GCxGC)Kwang-Hyeon Liu (LC, Pharma)Minhye Shin (Biofuels) Salvatore Abate (GCT)Dr. Yun Gyong Ahn (GC-MS)
Former Lab MembersSeema Data (FT-MS)Nabil Saad (LC-MS)Yun Lu (Library)

![...Directorate General of Civil Aviation [Kind Attn: Shri Arun Kumar, DG] Ministry of Civil Aviation [Kind Attn: Ms. Usha Padhee, Joint Secretary], Rajiv Gandhi Bhawan, Block B, Safdarjung](https://static.fdocuments.in/doc/165x107/5f106ffd7e708231d4491b28/-directorate-general-of-civil-aviation-kind-attn-shri-arun-kumar-dg-ministry.jpg)