Using Exergy and Optimization Models to Improve Industrial...
94
Linköping Studies in Science and Technology, Dissertation No. 868 Using Exergy and Optimization Models to Improve Industrial Energy Systems towards Sustainability Mei Gong Division of Energy Systems Department of Mechanical Engineering Linköping University, Linköping, Sweden Linköping 2004
Transcript of Using Exergy and Optimization Models to Improve Industrial...
Linköping Studies in Science and Technology, Dissertation No. 868
Using Exergy and Optimization Models to Improve Industrial Energy Systems
towards Sustainability
Mei Gong
Division of Energy Systems Department of Mechanical Engineering
Linköping University, Linköping, Sweden
Linköping 2004

Cover illustration: Flows of energy and matter on the earth are driven by exergy, as a consequence of the contrast between the sun and space.
ISBN: 91-7373-933-2 ISSN: 0345-7524 Printed in Sweden by UniTryck, Linköping 2004

I
Abstract
With finite natural resources and large energy demands in the world, a sustainable development approach becomes increasingly important in the improvement of energy systems. This is the one foremost challenge presently facing science and engineering. A first step in this direction is the development of efficient concepts and methods to meet this challenge.
The concept of sustainability is examined with relation to exergy flows on the earth. The present industrial society is obviously not sustainable. The main aim of this study is to analyze and improve industrial energy systems towards an increased sustainability.
Exergy analysis is used for evaluating energy systems and for guiding efficiency-improvement efforts. An existing optimization method is improved to incorporate feedback loops and applied to an energy system in order to maximize its economic feasibility and profitability. These two methods are coordinated to benefit from the advantages of both. Life cycle analysis based on exergy that distinguishes between renewable and non-renewable physical resources is applied in order to further guide towards sustainable development. This thesis offers tools to better evaluate energy systems with regard to physical resource use, economy and environment. These tools are particularly useful for decision-making in long-term planning.
Different definitions on exergy efficiency are discussed and compared with exergy flow diagrams that offer a better insight than efficiency evaluations alone. The concepts and methods presented are useful in the design and optimization of more sustainable energy systems, particularly in industrial processes. A typical Swedish industry, a pulp and board mill, is examined using an improved optimization method together with the

II
exergy method. The main cause of the low exergy efficiency in the mill is irreversibility of combustion and of heat transfer in the steam generator. The change in the price of electricity has tremendous impact on the energy cost, more than for the price of fuel, which means a unified European electricity market has large impact on the Swedish industry. Increasing efficiency of processes usually minimizes environmental damage and maximizes economic benefits. In spite of increasing the exergy loss switching from fossil fuel to bio-fuels can decrease the net CO2 emission as well as the energy cost, and is a step towards increased sustainability. The investments in an oil-bark boiler, evaporation plant and recovery boiler give a good supply of sustainable resources, a reduction of environmental impact, and both energy and economical saving. In addition, with replacing the present evaporation plant with the non-conventional one, even more benefits could be achieved. Still, there are more potential for further improvement in the mill.

III
Acknowledgement
Dr. Göran Wall led me into my present field of research. I owe him my deep gratitude for his constant and unfailing support.
I want to extend my sincere thanks to my supervisor Dr. Mats Söderström for his all-round support and advice. His ideas and comments have been very helpful. I also want to thank Professor Björn Karlsson for many useful suggestions, and Dr. Magnus Karlsson for his assistance and fruitful discussions on MIND and Skoghall. My colleagues at Division of Energy System in Linköping have also been helpful in many ways.
I also owe the people at the Stora Enso, Skoghall Mill my thanks, especially Ida Nilsson for providing data and answering numerous questions. Financial support from Swedish Energy Agency is also gratefully acknowledged. In addition, I want to thank Dr. Darwish Al Gobaisi for his encouragement and kind support.
Finally, I would like to thank all who have helped and inspired me in all respects.
IV
List of publications
Wall G., Gong M., 2001, “On exergy and sustainable development Part I: Conditions and concepts”, Exergy – An International Journal 1(3):128-145.
Gong M., Wall G., 2001, “On exergy and sustainable development Part II: Indicators and methods”, Exergy – An International Journal 1(4):217-233.
Gong M., Karlsson M., Söderström M., 2002, “Industry and the energy market – optimal choice of measures using the MIND method”, Power Systems and Communication Systems Infrastructures for the Future International Conference (CRIS’2002), September 23-27, 2002, Beijing, China.
Gong M., 2003, “Optimization of industrial energy systems by incorporating feedback loops into the MIND method”, Energy – The International Journal 28(15):1655-1669.
Gong M., 2004, “Exergy analysis of a pulp and paper mill”, International Journal of Energy Research, in print.
Gong M., Karlsson M., “Co-ordination of exergy analysis and the MIND method – applied to a pulp and board mill”, submitted for publication.
The following publications are not appended to the thesis.
Wall G., Gong M., 1995, “Heat engines and heat pumps in process integration”, in R.J. Krane Ed. Thermodynamics and the Design, Analysis, and Improvement of Energy Systems, AES 35:217-222.
Wall G., Gong M., 1996, “Exergy analysis versus pinch technology”, in P. Alvfors et al Eds. Efficiency, Costs, Optimization, Simulation and Environmental Aspects of Energy Systems, pp.451-455.
Gong M., Wall G., 1997, “On exergetics, economics and optimization of technical process to meet environment conditions”, in R. Cai et al Eds. Thermodynamic Analysis and Improvement of Energy Systems, pp.453-460.
Wall G., Gong M., “On exergetics, economics and desalination”, in Encyclopedia of Desalination Water Resources (DESWARE), EOLSS Publishers, Oxford.

V
Table of Contents
1 INTRODUCTION...........................................................1
1.1 BACKGROUND ............................................................................1 1.2 ENERGY USE ............................................................................. 5 1.3 PURPOSE ...................................................................................7 1.4 OUTLINE OF THE THESIS .............................................................7 1.5 OVERVIEW OF PAPERS ............................................................... 8
2 SYSTEMS APPROACH AND MODELING .................... 13
2.1 OPERATIONS RESEARCH AND SYSTEM APPROACH – A BRIEF
SUMMARY ................................................................................13 2.2 MATHEMATICAL MODELS – AN INTRODUCTION OF ENERGY SYSTEM
ANALYSIS APPLICATIONS ...........................................................16 2.3 APPLICATIONS OF ANALYSIS OF ENERGY SYSTEMS USING A MILP
MODEL ....................................................................................19 2.4 COMMENTS ON THE STUDIES.....................................................21
3 EXERGY .................................................................... 23
3.1 EXERGY – A SHORT HISTORY ................................................... 23 3.2 EXERGY METHOD – A BRIEF REVIEW ........................................ 24 3.3 EXERGY, ENVIRONMENT AND SUSTAINABILITY .......................... 26 3.4 LIFE CYCLE ANALYSIS AND EXERGY ANALYSIS ............................ 29 3.5 EXERGY, ECONOMICS AND OPTIMIZATION ................................. 30 3.6 COMMENTS ON EXERGY RELATED METHODS ............................. 32
4 METHODS ..................................................................35
4.1 THE MIND METHOD AND MATHEMATICAL MODEL – GENERAL
DESCRIPTION .......................................................................... 35 4.2 EXERGY ANALYSIS FOR EVALUATING ENERGY SYSTEM ................ 36 4.3 LIFE CYCLE EXERGY ANALYSIS (LCEA).................................... 38 4.4 COORDINATION BETWEEN THE MIND METHOD AND EXERGY
ANALYSIS................................................................................ 39
VI
5 CASE STUDY...............................................................41
5.1 ENERGY USE IN THE PULP AND PAPER INDUSTRIES......................41 5.2 DESCRIPTION OF THE STUDIED MILL......................................... 43 5.3 MODEL OF THE STUDIED MILL.................................................. 47 5.4 REFERENCE STATE AND ASSUMPTIONS IN THE STUDY................. 49
6 RESULTS .................................................................... 51
6.1 IMPROVING THE MIND METHOD BY ADDING FEEDBACK LOOPS...51 6.2 EFFECT OF ENVIRONMENTAL TEMPERATURE ON EXERGY ANALYSIS
.............................................................................................. 52 6.3 EVALUATING THE PROCESSES BY ENERGY AND EXERGY ANALYSIS 55 6.4 CHANGES IN THE PROCESS – INCREASED EFFICIENCY AND
REDUCED OIL DEMAND ............................................................ 56 6.5 LIFE CYCLE EXERGY ANALYSIS................................................. 58 6.6 REDUCTION OF CARBON DIOXIDE EMISSIONS ............................ 60
7 DISCUSSION AND CONCLUSIONS............................ 63
7.1 DISCUSSION............................................................................ 63 7.2 CONCLUSIONS ......................................................................... 66
8 FUTURE RESEARCH ................................................. 69
9 REFERENCES ............................................................. 71
APPENDIX SKOGHALL’S PROCESSES ............................81
APPENDED PAPERS
I. ON EXERGY AND SUSTAINABLE DEVELOPMENT PART I:
CONDITIONS AND CONCEPTS
II. ON EXERGY AND SUSTAINABLE DEVELOPMENT PART II:
INDICATORS AND METHODS
III. INDUSTRY AND THE ENERGY MARKET – OPTIMAL CHOICE OF
MEASURES USING THE MIND METHOD
IV. OPTIMIZATION OF INDUSTRIAL ENERGY SYSTEMS BY
INCORPORATING FEEDBACK LOOPS INTO THE MIND METHOD
V. EXERGY ANALYSIS OF A PULP AND PAPER MILL
VI. CO-ORDINATION OF EXERGY ANALYSIS AND THE MIND METHOD -
APPLIED TO A PULP AND BOARD MILL
1
1 Introduction
1.1 Background The concept of sustainable development was first introduced in the
World Conservation Strategy by the International Union for Conservation of Nature and Nature Resources (IUCN), the United Nations Environment Programme (UNEP), and the World Wildlife Foundation (WWF) (IUCN et al. 1980). Since then, sustainable development has been defined and interpreted in several ways. In 1987, in the Brundtland Commission, the World Commission on Environment and Development defined sustainable development (WCED 1987) as follows:
Sustainable development is development that meets the needs of the present without compromising the ability of future generations to meet their own needs.
This definition is the one most often quoted, probably because it is vague and non-committal. Still, sustainable development represents the most important challenges of the present time, involving physical, ecological and social dimensions.
Clearly, many factors contribute to achieving sustainable development. Achieving this for industrial processes, the following aspects, illustrated in Figure 1, should be considered: 1) time; 2) economics; 3) resources; 4) technology; and 5) environment. Besides, there are also other aspects that are needed to achieve sustainable development, but these are outside the scope of this thesis.

2
Sustainable Energy System
system improvement cost optimization
renewable energy resources environmental consideration
Time
safety
new technology other aspects
unknown effects
Figure 1. In order to be sustainable over time, an energy system is subject to a number of different inputs.
Sustainable development is not a static state but a dynamic process of constant improvement and long-term planning. Appropriate signals and incentives will then be likely to lead to open and competitive markets, making a substantial contribution to sustainable development (Ryding 1992).
When discussing sustainability, it is essential to have parallel frameworks dealing with not only physical magnitudes but also monetary. Economic activities can be described as conversions of materials/energy which do not change quantity but which increase entropy, i.e. decrease exergy. The reduced exergy implies resource depletion. Economic development can only be attained as long as a secure, reliable, and affordable supply of energy is ensured.
Sustainable development requires a supply of resources that is readily and sustainably available in the long term. The negative environmental impacts of a resource must be ecologically acceptable. Natural resources, such as energy and material resources, appear partly as flows and partly as stocks. Stocks are divided into living stocks or funds, and dead stocks or deposits. Natural flows (such as sunlight, wind and ocean currents) and funds (such as forests, biomass) are renewable, whereas deposits (such as coal, oil, minerals, metals) are non-renewable resource. Renewable resources that are managed in a sustainable way can last over a relatively long period, and can be regarded as sustainable resources.

3
Sustainable development requires that resources are used as efficiently as possible with reference to environmental impact. Improving energy systems towards higher efficiencies usually minimizes environmental damage and maximizes the benefits. In a sense, all resources are finite; the more efficient the utilization, the longer the resources last, i.e. the resources become more sustainable.
Sustainable development requires that resources are utilized without destroying the environment. Environmental destruction can originate from physical, chemical, biological and ecological causes. Several causes usually act together to influence the environmental impact still further. The causes generally also increase over time, e.g. the accelerated impacts on the environment of such causes often leads over time to a variety of health, ecological and other problems.
The energy system of most industrial societies demonstrates unsustainable patterns of development characterized by a growing dependence on fossil fuels, a rising energy demand, and growing CO2 emissions (CORDIS 2003).
In 2002, Swedish industry used 2 TWh more energy than during 2001, amounting to 152 TWh, or 38% of the national final energy use (SEA 2003a). The oil crises of the 1970s resulted in a reduction in the use of oil. In Sweden, the use of oil has fallen from about half of industry’s total energy use at that time to 14% today (SEA 2003a). On the other hand, the use of electricity has increased from 21% to 37% in terms of Swedish industry’s energy use (SEA 2003a). However, over the period from 1992 to 2002, the use of oil products increased by 3.5 TWh or one fifth due to higher production, lower energy and CO2 taxes, and so on (SEA 2003a). Between 1970 and 2002, the proportion of bio-fuels, peat, etc. increased from 21% to 31% of the total industrial energy use (SEA 2003a).
On 1 January 1996, the Swedish electricity market was reformed by introducing competition in the generation and trading of electric power, but grid operations remained a regulated monopoly. The deregulated market means that customers are free to choose their supplier, although
4
only about one third of the total electricity price can be influenced in this way. The Nord Pool electricity exchange is a common marketplace for trading electricity among Nordic countries. The European electricity markets will be opened fully to all industrial customers during 2004 and to all domestic customers in 2007 (EC 2003).
The deregulated electricity market was intended to promote a more efficient use of resources, and thus lead to a reduction in electricity prices. The Nordic market is highly dependent on hydroelectric power and characterized by low electricity prices. However, this is a minor part of a single European market; in 1995, the electricity generated by the Nordic countries was around 15% of the total electricity in the European Union (EU). In the near future, a totally deregulated European electricity market with a higher marginal cost for electricity generation will drive prices up in Sweden (Dag 2000). The per capita electricity consumption in Sweden is more than twice as high as the average in the EU (SEA 2003b). Higher electricity prices and consumption will probably drive customers to a more efficient system.
The strategies for achieving a sustainable energy system include reducing greenhouse gases and pollutant emissions (the Kyoto Protocol), increasing the security of energy supplies, improving energy efficiency, and increasing the use of renewable energy. The Kyoto Protocol calls for the industrialized countries to reduce their emissions of greenhouse gases by an average of 5% by the period 2008-2012 as compared to the 1990 level (UNFCCC 1997). Energy supply needs to be further diversified and the energy intensity of economic growth reduced.
One way to meet the Kyoto Protocol undertakings, trading in electricity certificates, was introduced in May 2003 to increase power generation from renewable sources by 10 TWh by 2010 compared to the level in 2002 (SEA 2003b). This benefits industries that generate power from renewable sources, for example, bio-fuel.
With finite natural resources and large energy demands in the world, it is becoming increasingly important to develop systematic approaches

5
for improving systems with respect to technical and economic prerequisites. Then the impact on the environment can be reduced and a sustainable energy system may be achieved. Among the foremost challenges that engineers face are efficient design, minimal environmental impacts, and cost effective systems over long periods of time.
1.2 Energy use World energy use is assumed to continue to increase at an average
annual rate of 2% over the next two decades (Birol & Argiri 1999), see Figure 2. Total energy use worldwide was about 1.18×10⁵ TWh in 2001 (IEA 2003).
250
2025201020011990198019700
50
150
200Oil
Natural GasCoal
Renewable
Nuclear
History Projections
Quadrillion Btu
100
Figure 2. World Energy Use by Energy Source, 1970-2025 (EIA 2003).
From Figure 2 the fastest growing source of primary energy is projected to be natural gas. In industry, natural gas is expected to make a greater contribution to incremental energy use among the major fuels due to its environmental and economic advantage over other fossil fuels (EIA 2003). The growth in natural gas consumption throughout the world implies an increasing demand for more fuel-efficient combined gas
6
turbine power plants. Oil is still the dominant energy fuel with its share of total world energy use of about 39% in 2001 (EIA 2003). Almost 55% of the coal consumed is used for electricity generation in the world, and its role in the future is expected to be primarily as a fuel for power generation and secondarily as an energy source in a few key industrial sectors, such as steelmaking (EIA 2003). Over the 2001-2025 forecast horizon, renewables maintain their share of total energy consumption at 8% (EIA 2003).
The European Union (EU) is one of the heaviest energy-using regions in the world, accounting for about 17% of the world total energy use (SEA 2003a). However, there is an agreement within the EU to improve the availability of energy and to change from the use of fossil fuel to renewable energy. Reducing energy usage by improving energy efficiency may increase the security of supply, protect the environment, and establish a more sustainable energy system. In Sweden, the total energy use in 2002 amounted to 616 TWh (SEA 2003a).
Most of the world’s electricity is produced in fossil-fueled power plants (SEA 2003a). However, Sweden is one of the countries that have a high proportion of hydropower and nuclear power in their electricity production; in 2002 each accounted for 46% of the Swedish power generation (SEA 2003b). Sweden also has a particularly high degree of electrification compared with most other countries.
The overall objective of Sweden’s energy policy is to ensure, in both the short and the long term, a reliable supply of electricity and other forms of energy on competitive terms. The policy is thus intended to create the right conditions for the efficient use and a cost-efficient supply of energy, for example, with minimum adverse effects on health, the environment or climate, and at the same time assist the shift to an ecologically sustainable society (SEA 2002). Accordingly, a major task for industry in general is to minimize the use of non-renewable energy and raw materials as well as the environmental impact.

7
1.3 Purpose The aim of this study is to analyze industrial energy systems from the
point of view of increased sustainability; to improve an optimization method by considering feedback loops; and to analyze energy systems by considering technical and economical aspects as well as environmental impact. This thesis focuses on concepts and methods for sustainable development of industrial energy systems. The need for this is well documented in the literature. Exergy analysis is applied to real processes in order to identify their advantages and disadvantages since this seems to be a powerful scientific methodology from other areas of science. The MIND (Method for analysis of INDustrial energy systems) method is applied to the problem of optimizing processes with recycling, which is a way to improve the use of resources. This is a known problem that so far lacks a satisfactory solution. In addition, the purpose is to coordinate and develop these methods as a powerful method for the design of sustainable processes. These methods are to be designed in as general terms as possible and applied to a real industrial plant.
1.4 Outline of the thesis A background to sustainable development related to energy systems,
as well as the energy market in Sweden, is presented in Chapter 1. This chapter also includes the purpose and a summary of the included papers. The following chapter is an overview of the literature connected to the “system approach”. This includes a mathematical programming method specifically used in the modeling of the energy system and some MILP (Mixed Integer Linear Programming) applications. Chapter 3 concentrates on the concept of exergy and related methods. Six methods and one combined method are commented upon with regard to five aspects. Chapter 4 describes the main methods used in this thesis, i.e., the MIND method (Method for analysis of INDustrial energy systems), exergy analysis, and their coordination. Life Cycle Exergy Analysis (LCEA) is also briefly introduced. Chapter 5 begins with a description of the energy pulp and paper industries’ situation in general, followed by a

8
description of the pulp and paper mill that is analyzed in this thesis. Chapter 6 presents the results of the case study. The results and conclusions are discussed in Chapter 7 and some topics for future research are suggested in Chapter 8.
1.5 Overview of papers The following six papers are appended and will be referred to in the
text by their Roman numerals. The papers are reproduced as they were originally published except for minor errata. The papers are arranged in chronological order. Papers I, II and V are mainly based on the concept of exergy; papers III and IV present the development and applications of an optimization method; paper VI is based on the case in paper V and deals with both exergy and optimization with several investment alternatives. Papers II and V demonstrate the method of life cycle exergy analysis.
The first paper presents the concept and conditions for sustainable development in terms of exergy. The following three papers illustrate some features of the main tools used in the thesis. The fourth paper shows that the reuse of energy and material resources is a way to achieve sustainability. The fifth paper deals with possible improvements. The final paper examines industrial improvements to achieve sustainability; it also includes a small sensitivity analysis of the effects of varying prices of electricity and fuels.
Brief summaries of the appended papers and co-author statements are presented below:
Paper I: On Exergy and Sustainable Development Part I: Conditions and Concepts
The future of life on our planet is a matter of great concern. This paper and Paper II are based on a vision of sustainable development. This paper introduces conditions and concepts that are of importance for sustainable development. Environmental conditions in terms of
9
causes and effects of emissions, the concept of exergy as a physical measure of difference or contrast, and a number of different exergy forms common in nature are presented. The concept of exergy is introduced and the main differences between energy and exergy are described and summarized in a table. Emissions and pollutants represent contrasts to the environment, and that thus affect the environment. Exergy is a suitable measure of these differences. The concept of sustainability is examined with relation to exergy flows on the earth. The present industrial society is obviously not sustainable and is facing a collapse. Papers I and II relate to several years of collaboration with Göran Wall, who is Associate Professor at Chalmers University of Technology, Sweden. The author of this thesis contributed to this paper by taking part in the planning and writing a few sections, e.g. parts of sections 2 and 3 and discussing the results and the conclusions.
Paper II: On Exergy and Sustainable Development Part II: Indicators and Methods
This part is an overview of a number of different methods based on concepts presented in Paper I and their applications to real systems. A number of ecological indicators are presented. The method of Life Cycle Exergy Analysis is presented. Exergy is applied to emissions into the environment through case studies in order to describe and evaluate its values and limitation as an ecological indicator. The conclusion from the literature in the field is that exergy is a suitable ecological indicator. The author of this thesis wrote the major part of this paper, and planned and discussed with co-author Göran Wall, who worked on exergy analysis of Swedish society and made valuable comments on the text.
Paper III: Industry and the Energy Market – Optimal Choice of Measures Using the MIND Method
This paper is an overview of the MIND (Method for analysis of INDustrial energy system) method, which has been developed for multi-

10
period cost optimization of industrial energy systems, and its applications. The mathematical basis of the method is presented. A survey of the applications is presented and the benefits of using the MIND method in general are also covered. A discussion of how to deal with critical infrastructures using the MIND method, for example congestions in the power grid, is also included. It also gives a picture of how to make strategic decisions with regard to investments. This paper was co-authored with two colleagues, Magnus Karlsson and Mats Söderström, at the Division of Energy Systems, Linköping Institute of Technology. We have planned, analyzed and discussed the paper together. Magnus Karlsson and Mats Söderström wrote the section about the pulp and paper industry and other industrial applications respectively. The author of this thesis wrote most of the paper.
Paper IV: Optimization of Industrial Energy Systems by Incorporating Feedback Loops into the MIND Method
This paper is focused on the recycling or reuse of energy and material. The recycling or reuse of energy and material is managed by feedback loops. A mathematical description of the improved MIND/F method (MIND method with Feedback loops) is given. The improved model is applied to a pulp and paper mill in Sweden. A comparison between the original MIND method with manual handling of the feedback loops and the MIND/F method is made, and it gives successful results. The MIND/F method saves calculation time and offers a more accurate result, besides making the MIND method also suitable for the optimization of more resource efficient processes.
Paper V: Exergy Analysis of a Pulp and Paper Mill
The main objective of this paper is to evaluate the performance of a pulp and paper process in terms of exergy. Different definitions of exergy efficiency are discussed and an exergy analysis is performed at a Swedish pulp and board paper mill. Energy and exergy analyses are
11
carried out on the process level, and energy and exergy flow diagrams are presented. The largest exergy losses for the processes are indicated and these processes are the ones to be improved first. A life cycle exergy analysis of the mill is also carried out for a one-year period. In the mill, heating processes, such as boilers, are highly exergy inefficient and large exergy losses, and need to be improved first. These are important steps towards sustainable development.
Paper VI: Co-ordination of Exergy Analysis and the MIND Method – Applied to a Pulp and Board mill
This paper is a joint collaboration with Magnus Karlsson who is also co-author of Paper III. The purpose of this study is to study how exergy analysis and the MIND method can be combined in order to improve industrial energy systems. The paper is based on the case in Paper V. The largest exergy losses of the processes are found, and some suggestions are made for improving the production process. The improvements are made in the recovery boilers, oil boiler and evaporation plant. Six cases are examined using both methods for different configurations. Different investment alternatives are studied and the cost optimization is achieved through the MIND method. The cases are evaluated using the exergy method. A sensitive analysis is also performed with regard to changing prices of oil, bark and electricity, it shows that the price of electricity has a larger impact on the energy cost than the price of fuel. The combined approach shows that the cost effective alternative is usually also an exergy efficient process, i.e. more sustainable. The co-author, Magnus Karlsson, took part in the planning of the paper; conducting the MIND model runs; writing the parts about MIND, non-conventional evaporation plant and market; and analyzed and discussed the results with the author of this thesis. The author of this thesis also contributed with the exergy analysis and wrote large parts of the paper.

12
In addition to the appended papers, four earlier publications related to exergy analysis and optimization, of which three were presented at conferences and one was published as a chapter in an encyclopedia, are not included in this thesis. These papers are listed below:
Wall G., Gong M., 1995, “Heat engines and heat pumps in process integration”, in R.J. Krane Ed. Thermodynamics and the Design, Analysis, and Improvement of Energy Systems (ASME WAM’95), AES 35:217-222.
Wall G., Gong M., 1996, “Exergy analysis versus pinch technology”, in P. Alvfors et al Eds. Efficiency, Costs, Optimization, Simulation and Environmental Aspects of Energy Systems (ECOS’96), pp.451-455.
Gong M., Wall G., 1997, “On exergetics, economics and optimization of technical process to meet environment conditions”, in R. Cai et al Eds. Thermodynamic Analysis and Improvement of Energy Systems (TAIES’97), pp.453-460.
Wall G., Gong M., “On exergetics, economics and desalination”, in Encyclopedia of Desalination Water Resources (DESWARE), EOLSS Publishers, Oxford.

13
2 Systems Approach and Modeling
In this chapter the literature on the system approach and modeling is reviewed, and five basic considerations of building models are introduced as basis of modeling. Some of the recent applications are listed to give a picture of mixed integer linear programming applied to energy systems. The last section contains some comments on the studies.
2.1 Operations research and system approach – a brief summary
Operations Research (OR) was first initiated in England during World War II when a team of British scientists set out to make decisions regarding the best utilization of war material. Following the end of the war, these ideas in practice in military operations were adapted to improve efficiency and productivity in the civilian sector (Taha 2003). The early OR studies focused on making existing processes and technologies more effective, rather than replacing them with new ones (Kaijser & Tiberg 2000). Today OR has become a dominant and indispensable decision-making tool.
OR sought to apply scientific methods to complex problems that arise in the direction and management of large systems of people, machines, materials and money in industry, business, government, and defense (Jenkins 1969; Checkland 1981). The basic tenet of OR is the development of a scientific model of the system being studied, using powerful mathematical and statistical techniques to account for uncertainty and to predict outcomes. The strategy is to optimize the model in terms of the desired performance criteria, and then transfer the solution to the real-world situation.

14
OR was primarily tactical, aimed at improving existing weapon system or production systems, and the methods employed had a scientific and mathematical bias. The scope of OR later gradually widened to cover larger and more complex systems. The wider approach covers a more general area, and is long-term and more strategic and also involves structural problems.
According to Wagner (1969) an application of OR involves:
• Constructing mathematical, economic, and statistical descriptions or models of decision and control problems to treat situations of complexity and uncertainty.
• Analyzing the relationships that determine the probable future consequences of decision choices, and devising appropriate measures of effectiveness in order to evaluate the relative merit of alternative actions.
The content of the systems approach has changed substantially from early OR in the 1950s, over systems analysis in 1960s, and futures studies in the 1970s and early 1980s (Kaijser & Tiberg 2000). This process of change has been decisively influenced from the international community (Kaijser & Tiberg 2000).
Systems concepts have been components of OR since its very beginning. Many “systems” terms have been developed inside and outside the OR community since the 1940s, such as systems science, general system theory, cybernetics, systems engineering, systems approach, systems analysis, systems methodology, systems age, systems thinking, systems movement etc.
There are several ways to define the word “system” in the literature, see e.g. (Ingelstam 2002; Churchman 1968). All definers seem to agree that a system consists of sets of components coordinated to accomplish a set of goals, and those components are surrounded by a system boundary. This broad system definition includes this thesis’s definition of an energy system, i.e., an industrial energy system is a system that

15
produces certain products by using energy, raw material, and other resources.
Checkland (1981) claims that system thinking was founded upon two pairs of ideas, those of emergence and hierarchy, and communication and control. The first pair of ideas have their origin in the area of organic chemistry and biology; it was recognized that different system levels represent different levels of complexity and each level exhibited some “emergent properties”. The second pair of ideas come from the field of electrical, communication and control engineering. In the 1940s the mathematician Norbert Weiner introduced the term “cybernetics”. His study linked control mechanisms in the machines engineered by human hands to those present in natural systems. Today, cybernetics is used in control theory, automation theory, and computer programming.
In his book “The system approach” (Churchman 1968), Churchman described the main features of the systems approach. He provided the way of thinking about the total systems and their components. He examined four different ideas that constitute the system approach: the advocates of efficiency, the use of science, the use of human feelings and the anti-planners. His theory emphasizes the fact that it is important to consider the entire system instead of a particular system. He outlined five basic considerations when thinking about the meaning of a system:
• the total system objectives and, more specifically, the performance measures of the whole system;
• the system’s environment: the fixed constraints;
• the resources of the system;
• the components of the system, their activities, goals and measures of performance;
• the management of the system.
In this thesis, the objective with regard to the energy system is to find the most cost-effective and efficient system together with sustainable resource use and minimal environmental impact. The systems approach

16
helps us consider the whole system, define the problem as clearly as possible, analyze the problem and identify alternative solutions, and evaluate the effectiveness of the alternatives.
Ackoff (1956) suggested a six phase OR process: 1) formulate the problem; 2) construct a mathematical model to represent the system under study; 3) derive a solution from the model; 4) test the model and the solution derived from it; 5) establish controls over the solution; and 6) put the solution to work, i.e., implement it. The first three points are examined in this thesis. The fourth phase is to validate the models in order to determine whether the model gives a sufficiently good description of the characteristics of the system to solve the problem formulated. The MIND model used in this thesis has been validated in previous work (Nilsson 1993; Karlsson 2002). The final two phases are the implementation and continuous use of the method. These three points will not be covered in this thesis.
2.2 Mathematical models – an introduction of energy system analysis applications
Wagner (1969) states that model-building is the essence of the OR approach. Constructing a model helps you put the complexities and possible uncertainties attending a decision-making problem into a logical framework amenable to comprehensive analysis. Such a model clarifies the decision alternatives and their anticipated effects, indicates the data that are relevant for analyzing the alternatives, and leads to informative conclusions. In short, the model is a vehicle for arriving at a well-structured view of reality.
The term “model” is usually used for a structure which has been built purposely to exhibit features and characteristics of some other objects. A model is a material or formal representation of a system under consideration, and it can be described using a physical model or a conceptual model. Mathematical modeling is the common way to represent an existing or proposed industrial process. Such a model

17
normally includes descriptions of mass, energy, exergy, and fluid flow, governed by known physical laws and principles.
As a branch of mathematical modeling, optimization models have been developed since World War II, and are seen in almost all branches of industry, e.g. in product and process design, production, logistics, supply-chain optimization and strategic planning. The common feature which mathematical programming models have is that they all involve optimization to some extent (Williams 1999). A mathematical model for optimization usually consists of four key objects: data (costs or demands, fixed operation conditions of a reactor, capacities and so on), variables (continuous, semi-continuous, binary integer), constraints (equalities, inequalities), and the objective function. Though the solution of the mathematical model provides a basis for making a decision, intangible (unquantifiable) factors (such as human behavior) must be accounted for before a final decision can be reached (Taha 2003).
Depending on the type of analysis, mathematical models lead to different algorithms such as Linear Programming (LP), Mixed Integer Linear Programming (MILP), Non-Linear Programming (NLP) and Mixed Integer Non-Linear Programming (MINLP). LP models are used for linear relations when building such a model. Similarly, NLP models are used for solving non-linear relations.
Based on LP, MILP takes account of discrete or integer variables. The discrete variables are not only used for approximating non-linear functions, but also for representing a real value which can only exist in integer values, such as the number of processes and indicating a choice of process units.
Compared to MILP, MINLP can solve the non-linear relations, so it represents even more complex problems. One of the major limitations of the NLP and MINLP methods reviewed in Biegler and Grossmann (2002) is that they are not guaranteed to find the global optimum. When modeling an energy system, non-linear relations and discrete variable usually exist, and MINLP clearly provides much greater modeling

18
flexibility for tackling a large variety of problems (Grossmann & Santibanez 1980). However, due to the difficulty of finding the optimal solution in non-linear problems, MILP can also be applied by approximating non-linearities with linear functions and integer variables. Compared to MINLP the advantages of MILP are that computing time is shorter and problems are easier to solve.
All good algorithms should possess properties such as: robustness, i.e. it should perform well on a wide variety of problems for all reasonable choices of the initial variables; efficiency, i.e. it should require less computer time or storage; accuracy, i.e. it should be able to identify a solution with precision, without being overly sensitive to errors in the data or to arithmetic rounding errors. These goals may conflict and need to be given careful consideration. More details can be found in (Nocedal & Wright 1999). A good solver with efficiency and accuracy is needed in order to get final results. The solvers have achieved impressive improvements in their capabilities for solving problems during past years. Several commercial programs are available, e.g. CPLEX (1995) and Lamps (1991). MILP models have been widely used in different industrial applications; some of these will be presented in the next section.
Taha (2003) wrote that a cornerstone of OR is mathematical modeling. Mathematical modeling and simulation are widely used in industry for scale-up and design of new plants and to improve the operation of existing plants. Due to the rapidly increasing capacity of computers, the development of better and more reliable mathematical solvers, and user-friendly and sophisticated software, mathematical programming can be applied to many industrial design problems. In this thesis a mathematical model called MIND will be presented in section 4.1.

19
2.3 Applications of analysis of energy systems using a MILP model
Mathematical programming is one method to analyze industrial energy systems, and has been used for several decades. The MILP method has been frequently applied in energy engineering optimizations during design, planning, retrofit and operation of different systems, including those in the chemical and construction industries, environmental management, and non-industrial and industrial utilities. These applications can be found in the literature, e.g. (Bojić & Dragičević 2002), and a number of applications in Heat Exchange Networks (HEN) are reviewed in (Aaltola 2003).
Grossmann and Biegler (2002) summarize a number of specific models formulated for a number of applications in process systems engineering. They concluded that design and synthesis have been dominated by NLP and MINLP models due to the need for the explicit handling of performance equations, although simpler targeting models give rise to LP and MILP problems; operations problems tend to be dominated by linear models, LP and MILP, for planning, scheduling and supply chain problems; NLP plays a crucial role at the level of real time optimization; control has traditionally relied on LP and NLP models, although MILP models are being increasingly used for hybrid systems.
Grossmann and others (1999) present a review of advances that have taken place in the mathematical programming approach to process design and synthesis, including more than 250 publications. There are so many industry applications using MILP that it is impossible to cover all of them. In this section some of last 10 years’ applications using MILP models are listed.
Chang and Hwang (1996) have developed a multi-objective MILP model that considers both economic and environmental criteria. The model uses goal programming (GP) to satisfy the designer’s priority order. Environmental problems are mainly with regard to gas emissions, e.g. CO2, SOx, and NOx. The model is demonstrated in a utility system
20
of chemical processes. In their study a MILP model was used instead of a MINLP model in order to reduce the work needed to solve the corresponding process synthesis problem. The procedure to transform the MINLP model into a MILP problem follows Papoulias’ and Grossmann’s (1983) approach – a superstructure of utility generation alternatives for given heating and cooling requirements at pre-specified pressure and temperature levels.
Maréchal and Kalitventzeff (1997) developed an approach called Effect Modeling and Optimization (EMO). Effect modeling was used to simplify limitations and assumptions; the model is solved with MILP optimization by minimizing the cost of energy, including raw materials, fuels, electricity, and thermal energy. This method has been validated on applications in two major industries: one from the pulp and paper industry, and one from the brewing industry. They have also discussed a development of this method which would combine both energy and environmental targets for the industrial processes.
Bojić and Stojanović (1998) developed a software package called KOM9. This software package uses a steady-state, bottom-up approach, a network of energy modules and MILP. They have minimized the operating expenses of a Combined Heat and Power (CHP) energy system consisting of a boiler and a back-pressure turbine.
Yokoyama and Ito (2000) proposed a decomposition method for MILP problems with block angular structure. This method is applied to the operational planning of a thermal storage system. They have examined this method with the general solution algorithm. They concluded that the method is superior to the conventional branch and bound method with the depth-first or best-bound search by considering solution optimality and computation time.
Bojić and Dragičević (2002) analyzed an energy system that consisted of a boiler, a desuperheater, a condensation turbine and a heat pump. The cost region diagram is derived by using MILP in order to select the optimal inputs in real time. In their studies, they concluded that the

21
diagram might maximally enable an expense saving up to 88.8%, depending on the costs of the internal energy inputs.
Tari and Söderström (2002a, 2002b) included energy and material storage in the MIND method, which is used to optimize the entire system with several alternatives. They have applied the MIND model with storage to a Swedish pulp and paper industry. Karlsson and Söderström (2002) have studied a Swedish board mill using MIND method; their study includes a survey of future changes, together with forecasts of boundary conditions, such as changes in the price of electricity and oil. A sensitivity analysis of investments in the chemical recovery cycle was also carried out. This method is also applied at a Swedish steel plant (Larsson & Sandberg 2003; Larsson et al. 2004).
Bengtsson and others (2002) analyzed a Scandinavian board mill by combining the MIND method and pinch technology (e.g. Linnhoff & Vredeveld 1984; Wall & Gong 1996), which is used to evaluate heat exchange networks.
2.4 Comments on the studies When building a model, the five basic considerations of system
thinking put forward by Churchman (1968) should be taken into account in the study. A good algorithm for mathematical models should be chosen to achieve the goal of the study.
When modeling an industrial energy system, mass and energy balances, and detailed thermodynamic descriptions of physical property and operations are usually employed. Often the main goal is to minimize costs; the cost might include material, energy (e.g. Maréchal & Kalitventzeff 1997), investment, operation cost and external cost1 (e.g. Karlsson & Carlson 2002). Some of the studies mentioned in the previous sections consider environmental impact as an additional objective, which could lead to multi-objective optimizations (e.g. Chang
1 Energy utilization often causes harm to nature, the built environment, and humans’ health. The costs related to this damage are called external costs.
22
& Hwang 1996). Generally, objectives conflict, so that not all can simultaneously reach their optimal levels. A suitable multi-objective programming technique needs to be carefully considered. The system boundary should be correctly defined. In an optimization model the wider system boundary has a greater potential for minimizing the total system cost than the one considering only the actual changed processes (Larsson and others 2004), and it also avoids sub-optimization.
A number of methods to solve the feedback problem have been presented in the literature, e.g. (Pearson & Kwon 1976; Lu 1993; Alamir & Bornard 1995). However, none of the methods are suitable for the MILP model, being primarily designed for control systems in real time rather than for systems where time is replaced by a discrete number of states as in the MIND method.
Compared to the approach solely based on MILP, the combination of mathematical programming with other approaches provides more aspects. Several methods can complement each other. A realistic system design can be evaluated with multiple criteria, such as economic and environmental criteria. Many methods shown in the study use only one MILP model for analyzing industrial energy system. MILP studies including both the supply and the demand side, where exergy analysis is studied in particular, are not found in the literature. However, the combinations with pinch analyses are found in several applications.
Two of the criteria for analyzing industrial energy system are variability and uncertainty. Variability in the system may be due to variations in the demand of energy and material, uncertainty about operation conditions, and modeling efficiencies. Considering variable operating conditions, a multi-period model is one of the solutions, and somewhat reliable input data can be accomplished by collecting data on site and through interaction with the staff. To avoid uncertainty, both a good solver and reliable input data are needed. Variability and uncertainties in the MIND method were partly examined by Karlsson (2002).

23
3 Exergy
Like the previous chapter, this chapter is largely a literature review. This chapter focuses on the exergy method. The first two sections give a short history of developing the concept of exergy and exergy methods. The subsequent sections discuss the relations between exergy and environment as well as with economy, sustainability, LCA, and optimization. Regarding the five aspects, which were proposed in section 1.1, a few remarks concerning limited models are presented in the final section.
3.1 Exergy – A short history In 1824, N. L. Sadi Carnot (1824) stated that the extractable work of a
heat engine is proportional to the temperature difference, which later led to the definition of the second law of thermodynamics. Willard Gibbs (1873) introduced the notion of available work, including the term diffusion, in 1873.
Exergy is a thermodynamic potential, it is a general measure of work, “difference” or contrast. It has been interpreted as “available” energy by Keenan (1948) and in 1953 the term exergy was coined by Z. Rant (1956) to denote “technical working capacity”. In 1961, Tribus (1961) linked classical thermodynamics with information theory, through the entropy and the exergy concepts. In 1977, Wall (1977, 1986) offered a concise theory of exergy, and introduced exergy as a useful concept not only in engineering but also for improving resource use and reducing environmental destruction. At a conference in Rome in 1987, it was agreed among the participants to strongly encourage the use of exergy for the general concept of the potential to cause change, in lieu of terms such as availability, available energy, essergy, utilizable energy, work

24
potential, available work, convertible energy, etc. The term exergy will be preferred at all future conferences, symposia, and workshops involving the participants (Moran & Sciubba 1987). Recently, the concept of exergy has become widely accepted and used, and can now be found for example in UNESCO’s Encyclopedia of Life Support Systems2 and in the forthcoming Encyclopedia of Energy3. The international exergy community has expanded greatly in recent years (Rosen & Dincer 2003). The often quoted statement made by Goodstein (1994), professor of physics at Caltech, in Nature also deserves to be mentioned: “In a world rapidly running out of fossil fuel, the second law of thermodynamics may well turn out to be the central scientific truth of the twenty-first century”.
3.2 Exergy method – A brief review The exergy concept is of essential importance to engineering in the
design of energy systems to meet environmental constraints. A thorough understanding of exergy, providing valuable insights into the concepts of efficiency, environmental impact and sustainability of energy systems are required by any engineer or scientist working in the area of energy systems and the environment (Dincer 2002).
The first publications related to exergy analysis, based on the work done by Gouy and Stodola (Jouget 1907), generated little interest. Boĕnjaković (1938) initiated the modern development of exergy analysis; he formulated the expression “Fight against irreversibilities”. Since then, a great many exergy analyses of individual industrial processes have been presented, as well as of entire countries.
The main purpose of an exergy analysis is to detect and evaluate quantitatively causes of thermodynamic imperfection of energy processes. Exergy analysis thus offers information about the potential for improvement. In addition an economic analysis will show if these are 2 http://www.eolss.net 3 http://www.elsevier.com/homepage/sai/encycofenergy/index.htm

25
reasonable to realize. For industries where energy is a major contributor to operating costs, exergy analysis may improve competitiveness through a more efficient use of energy resources.
Many researchers and practicing engineers refer to exergy methods as powerful tools for analyzing, assessing, designing, improving and optimizing systems and processes. Therefore, the use of exergy methods in industry is increasing. Since the early 70s, interest in exergy analysis has grown steadily and the use of exergy analysis is more widespread in industries (Kotas 1995). Today, there is a much stronger emphasis on second-law aspects of systems and processes – losses, the mechanisms that cause losses, and the minimization of losses (Bejan 2001). In recent work, Sciubba (2001) has provided the following comprehensive summary:
“Already fifty years ago, energy conversion systems were the target of a detailed analysis based on second law concepts. The analysis indicated that the relevant design procedures of the time neglected to recognize that the irreversibility in processes and components depend on the energy ‘degradation rate’ and not only on the ratio between the intensities of the output and input flows, and that there is a scale of energy quality that can be quantified by an entropy analysis. In essence, the legacy of this approach, universally accepted today, is that the idea of ‘conversion efficiency’ based solely on the first law considerations is erroneous and misleading. This method evolved throughout the year into the so-called ‘available analysis’, later properly renamed ‘exergy analysis’, and it has had a very profound impact on the energy conversion system community, to a point that it is difficult today to find a design standard which does not make direct or indirect use of exergetic concepts in its search for an ‘optimal’ configuration.”
The exergy method is a useful tool for furthering the goal of more efficient energy-resource use, for it enables the locations, types, and true magnitudes of wastes and losses to be determined. The applications of exergy method are applied in a wide field. It covers society (e.g. Wall 1986, 1993; Ertesvåg 2001; Ayres et al. 2003), industry (e.g. Wall 1986;

26
Gemci & Öztürk 1998; Tekin & Bayramoğlu 2001) as well as biological processes (e.g. Wall 1977) and ecosystems (e.g. Jørgensen 1992).
Exergy is defined as the maximum available work when a system reaches equilibrium, e.g. a flow or system that comes to equilibrium with its environment. Exergy is a physical measure of contrast, quality or usefulness. From the viewpoint of exergy, maximum efficiency is attained for a process in which exergy is conserved. Efficiencies determined using ratios of exergy provide a measure of the potential for improvement. The efficiency used in a study should always be defined due to the lack of a general consensus. 100% exergy efficiency is always the maximum possible.
Improved efficiency leads to reduced losses and consequently less environmental impact. Similarly, reduction of the resource use per unit output also implies a reduction of pollutants. In addition, from a life cycle perspective local improvements mostly have a much greater influence on the reduction of the environmental impact from the total production process.
3.3 Exergy, environment and sustainability The energy of a system at a specified state is constant, but the exergy
varies with different environments, since the contrast varies. When two systems mix, energy is conserved, i.e. the mixed system is equal to the sum of the energy of the two systems. However, the mixed exergy is less than the sum of the exergy of the two systems, unless the two systems are at the same state, then the exergy will be conserved.
Exergy is also an effective measure of the environmental impact of a substance, which makes exergy a suitable environmental/ecological indicator (see e.g. Zvolinschi et al. 2003).
Figure 3 shows a system or process. In the real world all processes are irreversible, i.e., Eout < Ein. When all exergy except the exergy lost from irreversibilities are turned by the process into useful products, the exergy of emissions to the environment is zero. The emissions are harmless to

27
the environment since their chemical composition and physical properties are identical to those in the environment. In other words, the more exergy a system carries, the more its state deviates from the environment.
Ewaste
Systemor
ProcessEin
Etransit
Eout
Etransit
Eproduct
Figure 3. The input and output of exergy for a system or process.
Exergy Efficiency (%)
EnvironmentalImpact
0 100
Sustainability
Figure 4. Qualitative illustration of the relation between the environmental impact and sustainability of a process, and its exergy efficiency (Rosen & Dincer 2001).

28
One way to decrease the environmental impact is to increase the exergy efficiency, and sustainability will increase at the same time. Figure 4 illustrates the relations among exergy efficiency, environmental impact and sustainability. When exergy efficiency approaches 100%, the processes approach ideal, environmental impact approaches zero, and sustainability approaches infinity. On the other hand, if exergy efficiency approaches 0%, almost nothing is produced in the processes, resource needs increase for a fixed service, and correspondingly more waste is emitted. Sustainability approaches zero, and environmental impact approaches infinity.
Dincer (2002) summarizes some key relations:
• Energy and environment studies, leading to increased energy efficiency, can reduce environmental impact by reducing energy losses. Within the scope of exergy methods, such activities lead to increased exergy efficiency.
• Increased efficiency can often contribute significantly to achieving energy security in an environmentally acceptable way by the direct reduction of emissions that might otherwise have occurred.
• Increased efficiency also reduces the need for new facilities for the production, transportation, transformation and distribution of the various energy forms; these additional facilities all carry some environmental impacts.
• To control environmental pollution, measures to improve efficiency often need to be supported by substitution. It is through regional or national action, rather than through individual projects, that improved exergy efficiency can have a major impact on environmental protection.
Based on the characterization of exergy, exergy is the confluence of energy, environment and sustainable development. The exergy concept offers unique insights into where losses occur and where improvements

29
are possible. Life cycle analysis together with exergy analysis is suggested as a better method to meet environmental conditions and/or requirements.
3.4 Life cycle analysis and exergy analysis Exergy is a useful tool to improve energy resource use since it shows
the true losses. Obviously, an exergy analysis provides more insights and is more useful in efficiency improvement efforts than an energy analysis.
Environmentally oriented Life Cycle Assessment/Analysis (LCA) analyzes environmental problems associated with the production, use, and disposal or recycling of products. For sustainable development, as shown in section 1.1, the depletion of energy resource and emission to the environment have to be minimized. To achieve this, LCA with exergy analysis would be a good choice. Several publications deal with this analysis.
Ayres and his co-authors (1996, 1998) state the advantage of using exergy in the context of LCA, and conclude that exergy is appropriate for general statistical use, both as a measure of resource stocks and flows and as a measure of waste emissions and potential for causing environmental harm. However, no comparison is made with existing methods, like the LCA.
Cornelissen (1997) has developed a method called Exergetic Life Cycle Analysis (ELCA). The ELCA uses the framework of the LCA and can be seen as the exergy analysis of a complete life cycle. Cornelissen and Hirs (2002) concluded that the ELCA can be used in two ways: 1) to determine the consumption of natural resources; 2) to calculate the depletion of natural resources. A similar approach called Life Cycle Exergy Analysis (LCEA) also considers sustainability aspects (Gong & Wall 1997).
Finnveden and Östlund (1997) used exergy consumption as a characterization method in LCA. Several metal ores and other natural resources are analyzed with system boundaries compatible with LCA.

30
Blinge (1998) has successfully developed a method, called Energy Logistic Modeling (ELM), which is basically an adaptation and a specification of the general LCA methodology to the fuel supply systems. Exergy analysis has also been applied to the life cycle of steel by Michaelis et al. (1998). Lombardi (2001) performed an ELCA and a classical environmental LCA for a carbon dioxide low emission power cycle. In this analysis, exergy is considered to be an indicator of resource depletion, in addition to an LCA analysis alone.
3.5 Exergy, economics and optimization Exergetics combined with economics, both macro- and
microeconomics, becomes a powerful tool for the study and optimization of resource conversion systems. In macroeconomics, exergy offers a way to evaluate resource depletion and environmental destruction by means of an exergy tax (Wall 1993; Hirs 1998). In microeconomics, exergy has been fruitfully combined with cost-benefit analysis to improve operation and design. By minimizing Life Cycle Cost (LCC), the best system could be found due to the prevailing economic conditions, and by minimizing the exergy loss, the environmental impact could also be minimized. Designing efficient and cost effective systems, which also meet the need for sustainable development, is one of the foremost challenges that society faces. Obviously, exergy can help to point out possible ways to meet these requirements.
Many researchers have pointed out the relation between exergy and economic value. For example, Valero (1995) has written about present energy and exergy costs in society. Together with Tsatsaronis, they have addressed the interface where thermodynamics (including exergy) meets economics (Tsatsaronis & Valero 1989).
Many methods for performing economic analyses based on exergy have been developed and applied, with varying degrees of success (e.g. El-Sayed & Tribus 1983; Wall 1986, 1991; Tsatsaronis 1987, 1994; El-Sayed & Gaggioli 1989; Torres et al. 1996; Gong & Wall 1997; Wall 2003). These methods are referred to by such names as
31
thermoeconomics, second-law costing, exergoeconomics, exergy economy accounting, and exergy economy optimization. They usually offer a means to find the optimal allocations of economic resources. Even though exergy is linked to economic values, it is purely a physical concept and not an economic one.
Tsatsaronis (1987) identifies four main types of exergy-economic methodologies: 1) exergy-economic cost accounting, 2) exergy-economic calculus analysis, 3) exergy-economic similarity number, and 4) product/cost efficiency diagrams. Several detailed reviews of these techniques, including comparisons and critiques, are available, e.g. (Tsatsaronis 1987; El-Sayed & Gaggioli 1989).
The energy concept does not detect thermodynamic imperfections in thermal and chemical processes such as irreversible heat transfer, throttling, and adiabatic combustion. These losses have a negative impact on both cost and environment. It is only by applying exergy that these losses can be determined.
The Extended Exergy Accounting (EEA) method introduced by Sciubba (2001) incorporates elements from economics and life-cycle analysis. Sciubba (2001) uses the attribute ‘extended’ to refer to non-energetic quantities like labor and environmental impact; and the word ‘accounting’ as a reminder that the exergy destruction is the basis for the formulation of a theory of ‘cost’ because it clearly relates the idea that to produce any output, some resources have to be ‘consumed.’
Pinch technology is based on pinch point principles, first suggested by Hohmann (1971) in the early 1970s, and further elaborated by Linnhoff and others (e.g. Linnhoff & Flower 1978a, 1978b; Linnhoff et al. 1982; Linnhoff & Vredeveld 1984), and a continuous development of pinch technology at Chalmers (e.g. Nordman & Berntsson 2001). It is a method for analyzing thermal processes and heat exchanger networks. To a great extent this has been further successfully deployed by Ishida and others (1987) in a graphically based optimization method named Energy Utility Diagrams (EUD). In his book “Thermodynamics made

32
Comprehensible”, Ishida (2002) also successfully exploits the concept of system thinking within thermodynamics. The differences between these methods are documented in the literature (Wall & Gong 1995, 1996). Lombardo et al. (1992) analyzed six Kraft pulp mills using exergy analysis and pinch technology simultaneously in order to locate inefficient use of energy processes.
Poredoš and Kitanovski (2002) proposed that exergy loss is used as the basis of pricing of thermal energy. Their study of distributed district energy systems indicates a need to design a tariff system for the heat market, which is based on both the initial price of heat and the quality of the heat.
Rosen and Dincer (2003) developed a methodology called EXCEM (EXergy, Cost, Energy and Mass) analysis for evaluating systems and processes. This methodology is based on MEAD (Mass, Energy, Availability and Dollars) and MEDE (Mass, Energy, Dollars and Exergy) methods. It incorporates four key parameters: exergy, cost, energy, mass, and its code is enhanced from Aspen Plus – a state of the art process simulation code.
3.6 Comments on exergy related methods According to section 1.1, at least five aspects should be considered
for achieving sustainable development of an energy system. These aspects are:
1) Time – the method can describe the system over time;
2) Economics – the method can make economic evaluations;
3) Resources – the method can distinguish the use of sustainable and non-sustainable resources;
4) Technology – the method can support the identification of possible technical improvements;
5) Environment – the method can address the environmental impact.

33
Nowadays, many methods have been developed for energy systems analysis. In this section, six exergy related methods and one combined method are evaluated; the result is shown in Table 1.
Table 1. Evaluation of different methods to analyze energy system. (* means that aspect is considered; - means not considered; ? means not clear.)
Considered aspects Method
1 2 3 4 5
Coordination exergy and MIND methoda * * - * *
EEA (Extended Exergy Accounting) b * * - * *
ELCA (Exergetic Life Cycle Analysis) c * - * - *
ELM (Energy Logistics Modeling) d * - * * *
EXCEM (Exergy, Cost, Energy & Mass) e ? * - * -
LCEA (Life Cycle Exergy Analysis) f * - * - *
Exergy, MIND and LCEA g * * * * *
a. see Paper VI, Section 4.4. b. see (Sciubba 2001)
c. see (Cornelissen 1997) and (Cornelissen & Hirs 2002) d. see (Blinge 1998)
e. see (Rosen & Dincer 2003) f. see Paper I and Paper V, Section 4.3 g. see Chapter 4.
Presently none of the first six methods considers all five aspects, except the combined method that is presented in this thesis. First, the MIND method has a discrete flexible time division; not clear for the EXCEM; one of the bases of the other methods is life cycle analysis, which spans over the lifetime of the product or plant. Second, the MIND method, EEA, EXCEM considered the monetary cost, such as investment, and material. In the EEA, labor and capital are covered by the extended exergy. Third, ELM distinguishes fossil energy and bio-

34
energy for motor fuels, while LCEA and ELCA distinguish between renewable and non-renewable resources. Fourth, LCEA and ELCA analyze the whole plant, and it is possible to analyze each process. Finally, so far the EXCEM method does not include assessing the environmental impact.
These methods can be extended, improved and coordinated with the aim of including more functions and considerations, particularly with regard to sustainability.

35
4 Methods
The main technologies of process integration are pinch technology, exergy analysis and optimization techniques. Pinch technology is not included in this thesis. This chapter briefly describes the methods used in the thesis. In the first section an optimization model – MIND method is briefly described. Several papers in the thesis are based on the MIND method; one appended paper develops this model with feedback loops. In the next section, a picture of exergy analysis is given and some concepts are clarified. One aspect in achieving sustainable development is the use of sustainable energy resources. LCEA distinguishes between renewable resources and non-renewable resources for a life cycle. A final section contains a short description of the coordination between the MIND method and exergy analysis.
4.1 The MIND method and mathematical model – general description
The MIND method (Method for INDustrial energy system) has been developed for multi-period optimization of industrial energy systems. The MIND model can be described as follows in algebraic form:
Object: Minimize f(x, y)
Subject to: g(x, y) = 0
h(x, y) ≤ C
x ≥ 0; y ∈{0,1} or integer; C is constant
where x represents real variables, y represents binary variables, and f(x, y) is the objective function. The objective of the MIND method is to minimize the total system cost, which consists of for example

36
investment, maintenance, material, and energy costs, and other objectives such as CO2, NOx, etc.
Constraints represent both material and/or energy functions; binary variables y are used for non-linear functions and logical restrictions.
The structure of the energy system is represented as a network of nodes and branches. The branches represent energy or material flows, and the nodes represent conversion processes of energy and material. Depending on the level of accuracy one node may represent a complete industrial process, a part of the industrial plant, a process line, or just a single component. Conditions that are likely to affect the total system cost should be included at a high level of accuracy. The original model was described in (Nilsson 1993), and its development and applications can be found in Paper III.
As a decision-making tool the MIND method includes five aspects: 1) a flexible time division; 2) the choice of different levels of accuracy in parts of the energy system; 3) the representation of both energy and material flows in the process system; 4) the representation of non-linear relationships; 5) the representation of the whole industrial system – to avoid “sub-optimization”. All these aspects imply that it can identify necessary improvements to the structure of the modeled system and the optimal operational strategy, as well as evaluate the future changes needed to meet future challenges. Karlsson (2002) discussed these aspects as criteria for analyzing industrial energy systems.
The method has been transferred from a non-graphical user interface to an object-oriented platform, and developed to include more functions (e.g. Tari 2002a, 2002b; Gong 2003) in order to make the model more widely useable.
4.2 Exergy analysis for evaluating energy system Exergy analysis is a method that uses the conservation of mass and
energy principles together with the second law of thermodynamics. It is increasingly recognized that exergy analysis must be added to

37
conventional energy accounting analysis during the study, analysis, development, and design of such systems (e.g. Wall 1977; Szargut et al. 1988; Bejan et al. 1996). Only exergy analysis can identify the specific irreversibilities and is uniquely required to provide the guidance needed in the process.
For real processes the total exergy input always exceeds the total exergy output, this imbalance is due to exergy destruction, which is also called availability destruction, irreversibility, and lost work. Thus exergy is never in balance for real processes. The exergy output consists of the utilized output (products) and the non-utilized output (exergy waste). It is very important to distinguish between exergy destruction or irreversibility, and exergy waste or unused exergy, i.e. exergy flow to the environment. Both represent exergy losses, but irreversibility has, by definition, no exergy and, thus, no direct environmental effects. Exergy losses clearly identify the locations, causes and sources of deviations from ideality in a system. This information is critical to efforts to increase exergy efficiency.
Efficiency is often defined as the ability to produce a desired effect without waste of, or with minimum use of energy, time, resources, etc. Efficiencies based on exergy, unlike those based on energy, are always measures of the approach to true ideality, within the given environment, and therefore provide more meaningful information when assessing the performance of energy systems. Exergy efficiency, which is also referred to as second law efficiency, is usually defined as the ratio of utilized exergy to used exergy. It is often possible to design more efficient energy systems by reducing the inefficiencies in existing systems.
However, there are several ways to define the utilized exergy and used exergy, which add ambiguity to the application of this concept. Paper V discussed three different definitions. In this thesis, the exergy efficiency is defined as the exergy of products divided by all incoming exergy for a process.

38
By examining the exergy at different points in a series of energy conversion steps, the exergy efficiencies and losses can be determined, and the steps with the largest losses (destruction and waste flows) can be pinpointed and the processes with the largest margin for improvement identified. In general, when the exergy loss is high, this part should be considered for improvement first. However, this “tackle the biggest loss first” approach is not always appropriate. The reason is that every part of the system depends more or less on every other part of the system so that an improvement in one part may cause increased losses in other parts, so that the total losses in the modified process may be larger than in the original process configuration. The problem therefore needs a more careful approach.
Flow diagrams are a graphical method of representing the various efficiencies. These diagrams are called energy and exergy flow diagrams, see for example Figures 5 and 6 in Paper V. Exergy flow diagrams offer a better insight for several reasons: 1) the exergy efficiencies of the various parts of a system; 2) the different exergy inputs and outputs; 3) where the various exergy flows come from and go to; 4) the amount of transit exergy; and 5) the exergy destruction in every process is made clear.
4.3 Life Cycle Exergy Analysis (LCEA) Sustainable development demands at least a sustainable supply of
energy resources. Two principal general approaches exist for reducing the environmental impact associated with resource degradation: 1) increase efficiency to reduce the exergy necessary for a process; 2) use sustainable exergy resources, such as solar and wind energy.
In LCEA, exergy in-flows are divided into two parts: non-renewable resources, i.e. deposits; and renewable resources, i.e. natural flows and funds. Only non-renewable resources are accounted whereas renewable resources are regarded as free assets that in any case will be lost through exergy destruction by natural processes. The exergy input used for construction, maintenance and clean up is called indirect exergy and the
39
exergy used as resource input to the actual production process is called direct exergy. The use of indirect exergy is usually much less than the use of direct exergy during the complete lifetime of most production processes. The total exergy use over time is considered. The impact assessment is limited to calculation of the exergy of the flows and the determination of the exergy destruction and waste in the different production processes. The sum of all exergy destruction in the life-cycle gives the life-cycle irreversibility of the product.
The exergy flow through the system consists of three stages: 1) construction stage where exergy is used to build a plant and put it into operation; 2) operation stages in which the system is put into operation, i.e. the production phase, during the production phase only a small amount of exergy is used for maintenance; 3) clean up stages when the system is brought back to the original situation before the construction phase. These stages are analogous to the three steps of the life cycle of a product in an LCA. Life cycle exergy analysis is very important in the design of sustainable systems, especially in the design of renewable energy systems. More descriptions can be found in Paper II and V.
4.4 Coordination between the MIND method and exergy analysis
The MIND method was previously used in coordination with other methods and technologies, for example with pinch technology (Nilsson & Sundén 1992; Karlsson 2002), and with the MODEST (Model for Optimization of Dynamic Energy Systems with Time dependent components and boundary conditions) method (Dag 2000), which was developed to find the optimal investments in local and national energy systems (Henning 1999). Not only the results from other methods can be included in the MIND method, but also the results from the MIND method can be sent to other method. Thus, the coordinated methods can complement each other; additional characteristics are included in the analysis and consequently the results cover more aspects of the studied system.

40
Exergy analysis is used to identify inefficiencies and rank the improvements needed. The possible improvements are analyzed using the MIND method, which minimizes the system cost. An optimal structure is achieved from the MIND method where all alternatives are accounted for, whereas the exergy analysis provides information about possible improvements. The procedure for combining exergy analysis and the MIND method is shown in Figure 5. A thorough description of the coordination and a case study are presented in Paper VI.
Industrial Energy System
MIND Method
Exergy AnalysisResult
Economic aspect Physical aspect
Figure 5. Procedure for combining the MIND method and exergy analysis.

41
5 Case study
A pulp and paper board mill in Sweden was selected as a case study. The pulp and paper industry is one of the most energy-intensive industrial processes in the world, which makes it eminently suitable for study. The first section contains a general description of the Swedish pulp and paper industry’s energy use. Their consumption of electricity and oil over the past twenty years is given. The second section presents the studied mill in this thesis. The mill is an integrated pulp and paper mill, which is a common type in Sweden. In the following section, the model of the mill is presented subject to the five considerations stated in chapter 2. The final section describes the reference state and assumptions made in the study.
5.1 Energy use in the pulp and paper industries The pulp and paper industry is an important energy user worldwide,
in fact the fifth largest industrial energy user. Pulp and paper mills are the largest industrial energy users in Sweden. According to SEA (2003a), these mills account for around one fifth of the total energy use in Sweden, and use about 38% of all the electricity used in Swedish industry. The pulp and paper industry uses the by-products from various manufacturing processes within the industry to produce heat and electricity for economic reasons. Black liquor was produced and used within the pulp industry to provide 34 TWh of energy (excluding electricity production) in 2002 (SEA 2003a). In 2002, the pulp industry used a total of 7 TWh of wood fuels for heat and electricity production (SEA 2003a).
The report for the United States carried out by Ayres and his collaborators (2003) shows that a best practice plant in 1988 consumed

42
only 25 GJ energy per ton of product; however, this could be brought down to 18 GJ/t by 2010 by the adoption of advanced technologies now being developed. The Swedish pulp and paper industries used 25.6 GJ/t fuel and electricity in 2001 (SFIF 2001a). For a sustainable pulp and paper mill, the process needs to be improved still further.
0
5
10
15
20
25
30
81 83 85 87 89 91 93 95 97 99 O1
Elec
tric
ity (T
Wh)
0
200
400
600
800
1000
1200
1400
Total consumption of electricity
oil consumption
electricity generated by back-pressure turbines
Oil
(mill
ion
m3 )
Figure 6. Electricity (TWh) and oil (millions m3) consumption in the Swedish pulp and paper industry (1981 - 2001) (SFIF 2001b).
The total electricity use in the Swedish pulp and paper industry is increasing year by year. Only about 13-20% is produced locally by back-pressure turbines, while the rest is purchased, see Figure 6. In 2000, electricity consumption was 36% for paper production, 35% for mechanical pulp, 28% for chemical pulp and the rest for other purposes (SFIF 2001b). Since the oil crises of the 1970s the consumption of oil has been reduced. The increase in fuel oil consumption between 1992 and 1997 can be explained by a rise in production. Fuel oil was used as marginal fuel to meet the increased demand for process steam (Möllersten et al. 2003). The use of oil can be influenced not only by the

43
amount of products and the relation between oil price and other fuel prices (SFIF 2001b), but also by replacing oil boilers with bark boilers.
A common European electricity market implies that the price of electricity will probably increase; it will thus become necessary to reduce electricity demand. The recently launched electricity certificate trading system in Sweden can offer pulp and paper mills benefits by increasing electricity production from bio-fuels. Switching from fossil fuel to bio-fuels can decrease CO2 emissions, and is a step towards increased sustainability.
5.2 Description of the studied mill Stora Enso Skoghall pulp and paper mill, below referred to as just
Skoghall, is part of the Stora Enso Group, which was founded in 1998 when Stora and Enso merged and formed the Group. Skoghall Mill is part of the Packaging Boards Division of Stora Enso, which is one of the largest forest-industry companies in the world (Stora Enso 2003). The mill is situated on a peninsula in the northern part of Lake Vänern, just 10 kilometers south of Karlstad in the middle of Sweden. The mill is licensed for a production level of 6.5×10⁵ tonnes of board annually (Stora Enso 2003).
The mill was originally built as a sawing mill in 1914. Today, the mill produces liquid packaging board, coated Kraft back and white top liner (Stora Enso 2003). Skoghall, which consists of the sulfate pulp mill, the Chemi- ThermoMechanical Pulp (CTMP) mill and the paper mill with two board machines, is schematically illustrated in Figure 7. The processes can briefly be described as follows:
• The wood is mechanically debarked and chipped, and the chips are screened to eliminate fine material and over-size chips. The removed bark is combusted in a bark boiler.
• At Skoghall the amount of steam needed for the process is produced by three types of boilers: (1) the bark boiler, (2) the oil boiler and (3) the recovery boilers. The excess steam is used to produce

44
electricity in the power plant, which consists of two back-pressure turbines, TG8 and TG9. The turbines release low pressure steam for further use in the processes.
Debarking
Bark/OilBoilers
Digester
bark
chips
Power Plant
Causticizing etc
Recovery Boiler Washing/
Screening
EvaporationBleaching
CTMP Mill
Paper Mill
steam
steam
whiteliquor
green liquor
oil
wood
heavy black liquor
pulp wash liquor
dilutionwater
own chips
unbleached pulp
bleached pulp
bought chipsblack
liquor
CTMP pulp
steam
electricity
steamsteam
steam
Board paper
Figure 7. The schematic of the pulp and paper mill – Stora Enso Skoghall.

45
• The chips are sent to both the sulfate mill and the CTMP mill according to demand.
• In the sulfate mill the chips are cooked with white liquor at high pressure in the continuous digester. The pulp and liquor are removed from the bottom of the digester to be washed/screened and refined. The chips are steamed with direct steam to eliminate as much of the air in the chips as possible. The digester is continuously filled with warm cooking liquor (90°C - 120°C) to submerge the chips. The cooking liquor is a mixture of white liquor and spent black liquor from a preceding cook. The sulfate pulping processes can also produce organic by-products such as turpentine, tall oil, methanol, and ethanol.
• In the CTMP mill the chips are impregnated with chemicals and then refined under high pressure.
• The pulp is then formed and finished in the paper mill by dewatering, pressing and drying.
Figure 7 shows the main flows and the processes in the entire mill. Some flows, e.g. water, wastewater and electricity usage are not shown. The most energy/exergy-intensive processes can be distinguished. It must be noticed that the larger amount of energy/exergy in the liquor, black liquor and concentrated waste liquor is circulated through the evaporation plant, the recovery boilers and the causticizing department. The circulation of the processing chemicals in the various kinds of liquor, such as wash liquor, black liquor, green liquor and white liquor, can also be seen quite clearly. A description of each process is given in Appendix.
The quantity and type of products change from time to time, and to meet these changes Skoghall has intermediate storage capacities of chips, steam etc. There are also alternative production facilities to meet temporary interruptions.
The mill consumes large quantities of electricity and steam. Electricity consumption at Skoghall in 2002 was 939 GWh. Two back-pressure turbines, TG8 and TG9, produce less than one fifth of the electricity

46
needed at the mill, see Figure 8. The electricity used in the processes in 2002 is also shown in Figure 8. The mill increased its electricity consumption by 6% compared to 2001 and its production of board products by 13%.
Electricity production
Purchased electricity 85%
TurbineTG9 10%
Turbine TG8 5%
Electricity consumption
Board machines43%
CTMP mill36%
Sulfate mill20%
Other 1%
Figure 8. Electricity supply and electricity consumption at Skoghall in 2002. The electricity balance amounts to 939 GWh.
Black liquor 55%Oil 27%
Bark 11%
Other 7%
Steam production
Steam consumptionOther 4%Back-pressure
turbines 8%
Board machines49%Sulfate mill
39%
Figure 9. Steam production and steam consumption at Skoghall in 2002. The steam balance amounts to 6555 TJ.

47
The two board machines and the sulfate mill account for about 88% of the total steam consumption at Skoghall. Steam is mainly derived from two recovery boilers, an oil boiler and a bark boiler. In addition, steam is produced in a gas incineration furnace, taking care of gases from the different processes, and in the CTMP mill. Figure 9 details the proportion of each source contributor and consumer in 2002. The mill produces more heat than is needed, and the excess heat in the form of water at 85°C has been used by the municipality’s expanded district heating network since 1998.
Fuel oil consumption at Skoghall was about 65000 m3 in 2002. The largest amount is used in an oil boiler, about 75% of the 2002 total, followed by the lime kiln that used about 17%. Furthermore, fuel oil is also used as supplementary fuel in the bark boiler, recovery boilers and gas incineration furnace. The gas incineration furnace is not included in the exergy analysis due to the low steam production on site. The boilers have an environmental impact, for example they emit CO2 etc.
5.3 Model of the studied mill The five basic considerations outlined by Churchman (1967) were
presented in section 2.1. The goal of this analysis is to reduce the total system cost and to pinpoint the possible improvements for a certain quantity of board paper. The objective is to minimize energy costs including taxes.
The system boundary should be correctly applied and be coupled to the objective. In the case study, the system boundary is the same as the physical boundary of the mill. The interactions with the environment are: 1) the supplies of electricity, fuel oil, bark and pulp as well as chemical components; 2) the sale of products such as board paper, tall oil, and heat for district heating; 3) the discharge to the environment, such as wastewater and emissions; and 4) other aspects, e.g. market, policy.
Resources used are first of all the resources directly used for the production in the mill, such as processes. Resources used also include

48
the energy delivered into different processes and their utility system, and resources needed to maintain the energy system. The resources are used to serve the overall objective best. The model is designed to picture the energy and material demand in different process. A simplified node scheme for the MIND method is shown in Figure 10.
Churchman (1967) pointed out that the overall objective is not necessarily achieved by minimizing the cost for each component since there are also interactions between the components. In this study, the components are the nodes shown in Figure 10. Reducing the consumption of fuel oil may lead to an increase in the cost for utilizing the bark. The overall objective of minimized cost can be met since the components (nodes) are interlinked, see Figure 10.
Figure 10. The node scheme of the Stora Enso Skoghall mill for the MIND method.

49
Management should continuously monitor the situation and ensure that the objective is met over time. The analysis techniques presented in the papers can be a useful aid to this process. The staff at Skoghall have supplied the input data for the analysis and have also given important feedback.
5.4 Reference state and assumptions in the study The data for the exergy analysis are average annual values. The
chemical compositions of flows are given for the most part, though some had to be estimated from reference books, e.g. (Gullichsen & Fogelholm 1999).
Both exergy values and exergy losses depend on the defined reference state. The reference state has an impact on the exergy losses, and therefore also on the exergy efficiency. To be sustainable, industries need to keep the waste flows to the environment well below the level of ecological acceptance. The reference level should therefore be based on the local or standard situation. In this study, the chemical reference state was adopted from Szargut et al. (1988), and the reference temperature and pressure are T0 = 298.15K and P0 = 101.325kPa respectively. Concentrations or partial pressures of the reference substances in the environment have also been taken into account.
The turbines are assumed to work ideally in the MIND method and the coordinated method.
The investment cost for changing process is not considered in this thesis. The wood fuel is assumed to have a zero net effect on CO2 emission. It is assumed that CO2 equivalent to the CO2 released from biomass fuel combustion is absorbed when new biomass grows.

50

51
6 Results
The MIND method and exergy analysis are used as the main tools in this thesis. The MIND method is used to optimize the energy cost. In the exergy analysis input data for the improved process are mostly from the results of the MIND method. Exergy analysis gives the possibility to achieve the maximum work, and it is used to analyze processes through energy and exergy efficiency and exergy loss.
The first section presents the improved MIND method with feedback loops, and what the benefit of the improved MIND method is. The second section describes how the environmental temperature affects the result of exergy analysis. The third section gives a description of the processes in the mill, which process should be considered for improvement. The following section describes how the cost, efficiency and fuel oil demand vary with the changes to the processes. The next section illustrates the life cycle exergy analysis when considering using renewable resources instead of non-renewable resources. The last section shows the reduction in CO2 emissions due to the changes made to the processes.
6.1 Improving the MIND method by adding feedback loops
In order to meet the requirements for sustainable development, the recycling of energy and material flows is becoming increasingly common in many industrial processes. The recycling or reuse of energy and material is managed by feedback loops. These are incorporated into the original MIND method both as part of an improvement to the model and a reduction in the calculation time. In Paper IV, a comparison is

52
made between the original MIND method with manual handling of the feedback loops and the MIND/F method.
The total cost differences between manual handling and the MIND/F method are within ±0.017%; in the studied cases, however, the difference between with recycling and without recycling is more than 90%. More details about the studied case can be found in Paper IV. When the electricity price changes and the amount of flow in the feedback loop are fixed, the total cost will change. In this case, the quantity and type of products decide the amount of flow in the feedback loops and the electricity demand. For a certain quantity of products, the total electricity demand is fixed. The amount of in-house produced electricity is influenced by the prices of electricity and incoming fuel oil. The MIND/F method will find the most economical way to meet the mill’s energy demand.
6.2 Effect of environmental temperature on exergy analysis
It is important that the reference state is fully specified completely for an exergy analysis. This includes the temperature, pressure and chemical composition of the reference environment. Consequently, the results of exergy analyses are relative to the specified reference environment, which in several applications is modeled after the actual local environment.
In the case study the standard chemical exergy is adopted from Szargut et al. (1988). Szargut was one of the first to develop a reasonably complete reference system. This approach recognizes that atmosphere, ocean and crust are not in equilibrium with each other, and assumes that the reaction in any given case must go to one of the three. So far the references for chemical elements have no official standard thermodynamic handbook on exergy and the corresponding enthalpy and entropy values of all chemical elements. A discussion of this issue can be found in Gool (1998); it will not be discussed in this thesis. In this work the reference of temperature and pressure used for exergy analysis are T0 = 298.15K and P0 = 101.325kPa.

53
0
10
20
30
40
50
60
70
80
90
100
Jan. Feb. Mar. April May June July Aug. Sep. Oct. Nov. Dec.
Month
Exer
gy e
ffici
ency
(%)
DebarkingBleachingPaper MillCausticizingDigesterPower PlantWashing/ScreeningCTMP MillEvaporation PlantRecovery BoilerBark & Oil boilers
Figure 11. The exergy efficiency when the reference temperatures change with the local environmental temperature from January to December for the analyzed year.
Table 2. The maximum differences in exergy efficiencies exη∆ comparing reference temperature as local
monthly average temperatures with the analyzed reference temperature T0 = 298.15K.
Processes Max exη∆ (%) Processes Max exη∆ (%)
Debarking 0.05 Washing/Screening 0.44 Bleaching 1.65 CTMP Mill 0.60 Paper Mill 0.45 Evaporation Plant 0.59 Causticizing 1.04 Recovery Boilers 2.76 Digester 0.54 Bark/Oil boilers 3.53 Power Plant 2.59

54
Figure 11 shows the exergy efficiency of the processes when the environment temperature is applied as reference temperature. The exergy efficiency changes slightly with reference temperature. The largest differences occur in the coldest months (below zero) of the year. For some processes, such as debarking, paper mill and causticizing, the reference temperature has almost no effect on the exergy efficiencies. However, for the boilers, the effect on the result is more obvious, the difference in exergy efficiency is less than 4% compared to using environment temperature T0 = 298.15K, see Table 2. Overall, the result of an exergy analysis is acceptable also when the standard reference state is applied.
0
10
20
30
40
50
60
70
80
90
100
-15 -10 -5 0 5 10 15 20 25 30 35 40 45 50
Reference temperature (C)
Exer
gy e
ffici
ency
(%)
36800
36900
37000
37100
37200
37300
37400
37500
37600
37700
37800
The
tota
l exe
rgy
loss
(MJ/
tp)
DebarkingBleachingPaper MillCausticizingDigesterPower PlantWashing/ScreeningCTMP MillEvaporation PlantRecovery BoilerBark & Oil boilersSkoghall
Total exergy loss
Figure 12. Exergy efficiency vs. reference temperature and the total exergy loss vs. reference temperature. The exergy efficiency is for each process and the total exergy loss for the entire mill. (MJ/tp: MJ per ton of produced board paper.)

55
An important application of exergy analysis is the determination of exergy efficiency. In addition, exergy losses are important aspects to consider. Figure 12 examines a wider temperature range (from -15°C to 50°C). The changes in exergy efficiencies with the reference temperature go either up or down depending on the different processes. The exergy loss for the entire mill is also shown in Figure 12. The lowest exergy loss is at around 30°C. The lower the environment temperature is, the more amount of exergy is lost.
Since the aim of the exergy analysis is to find possible improvements, the reference state does not influence the results very much. However, when analyzing two systems in different environment, the reference state needs to be more carefully treated.
6.3 Evaluating the processes by energy and exergy analysis
The mill converts wood into board paper. About half of the incoming exergy in the form of wood, chips and pulp remains in the manufactured board paper.
The energy and exergy efficiencies are calculated for all the processes, shown schematically in Figure 7. The most energy and exergy efficient process is debarking, about 97%. The most energy inefficient process is the recovery boilers, while the most exergy inefficient is the bark/oil boiler. Both energy and exergy efficiency analyses indicate that the boilers are the most inefficient processes, followed by the evaporation plant, see Table 3. For the bark/oil boiler the exergy efficiency is much less than the energy efficiency due to the low temperature of the steam.
The energy and exergy loss in the recovery boilers represents nearly one third of the total energy and exergy loss in the mill. Thus, an energy and exergy analysis of the mill unequivocally reveals that the recovery boilers, the bark/oil boilers and the evaporation plant ought to be made more efficient, see Table 3.
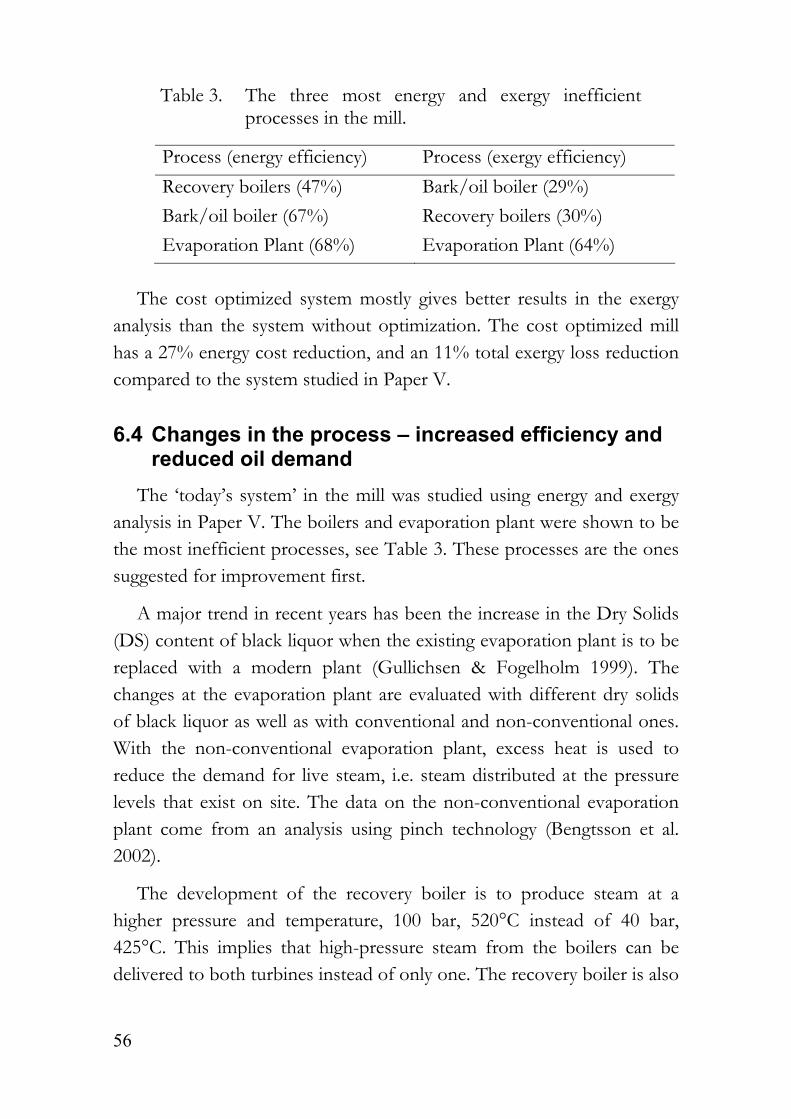
56
Table 3. The three most energy and exergy inefficient processes in the mill.
Process (energy efficiency) Process (exergy efficiency) Recovery boilers (47%) Bark/oil boiler (29%) Bark/oil boiler (67%) Recovery boilers (30%) Evaporation Plant (68%) Evaporation Plant (64%)
The cost optimized system mostly gives better results in the exergy
analysis than the system without optimization. The cost optimized mill has a 27% energy cost reduction, and an 11% total exergy loss reduction compared to the system studied in Paper V.
6.4 Changes in the process – increased efficiency and reduced oil demand
The ‘today’s system’ in the mill was studied using energy and exergy analysis in Paper V. The boilers and evaporation plant were shown to be the most inefficient processes, see Table 3. These processes are the ones suggested for improvement first.
A major trend in recent years has been the increase in the Dry Solids (DS) content of black liquor when the existing evaporation plant is to be replaced with a modern plant (Gullichsen & Fogelholm 1999). The changes at the evaporation plant are evaluated with different dry solids of black liquor as well as with conventional and non-conventional ones. With the non-conventional evaporation plant, excess heat is used to reduce the demand for live steam, i.e. steam distributed at the pressure levels that exist on site. The data on the non-conventional evaporation plant come from an analysis using pinch technology (Bengtsson et al. 2002).
The development of the recovery boiler is to produce steam at a higher pressure and temperature, 100 bar, 520°C instead of 40 bar, 425°C. This implies that high-pressure steam from the boilers can be delivered to both turbines instead of only one. The recovery boiler is also

57
constructed to be able to combust heavy black liquor at the higher dry solids content. Besides ‘today’s system’, the data used in the exergy analysis are partly from the results of MIND method, which imply that the energy cost is optimized.
Table 4 shows that improvements made in the recovery boiler and the evaporation plant have a considerable influence on the energy cost, exergy efficiency and total exergy loss. If the total investment cost is known, the pay-back period can be calculated through the energy cost. The proportion of each process contributing to the total exergy losses is shown in Figure 13. The evaporation plant contributes less to the total exergy losses in the improved process. In all the cases, the recovery boiler is still the largest contributor of all the mill’s processes, and needs to be improved further.
Table 4. Energy cost reduction and exergy efficiency improvement of changing process recovery boiler (RB) and evaporation plant (EP) compared to the ‘today’s system’.
Changed process RB, CEP (DS=80%)
RB, CEP
(DS=75%)RB, NCEP
(DS=75%)Energy cost reduction (%) 29 28 30 Exergy efficiency of RB improvement (%) 5.3 4.6 4.8 Exergy efficiency of EP improvement (%) 14 10 11 Total exergy loss reduction (%) 6.4 4.7 5.8
CEP: Conventional evaporation plant NCEP: Non-conventional evaporation plant

58
0%
20%
40%
60%
80%
100%
'Today's system'
RB, CEP(DS=80%)
RB, CEP(DS=75%)
RB, NCEP(DS=75%)
Exe
rgy
loss
esPaper MillCTMP MillBleachingCausticizingRecovery BoilerEvaporation PlantWashing/ScreeningDigesterPower PlantBark & Oil boilersDebarking
Figure 13. The proportion each process contributes to the total exergy losses in the mill. (RB: Recovery Boiler; CEP: Conventional evaporation plant; NCEP: Non-conventional evaporation plant)
6.5 Life Cycle Exergy Analysis The total exergy use during the complete life cycle of Skoghall is
considered in an LCEA. The LCEA of Skoghall is only one year in operational state, see Figure 14. In order to minimize the environmental impact, the system needs to rely on renewable resources only. Processes such as boilers and the evaporation plant need further improvement.
The oil boiler is converted to be able to combust both bark and fuel oil instead of only fuel oil. This is mainly a result of the oil boiler being the marginal fuel at the mill and large quantities of fuel oil are used for steam production. The efficiency when combusting bark is increased compared to the old bark boiler, while the efficiency when combusting fuel oil remains the same as the old oil boiler. The converted oil boiler is here referred to as the bark-oil boiler.

59
0
dttdEtE )()( =&
Construc-tion Operation Clean up
Eproduct
tstart tclose tlife
tEin-non
Eindirect
Eindirect+Ein-non
Ein-non[MJ/tp]:
Bought pulp* 942 Electricity* 2283 Oil 3317 Total 6542
* from non-renewable resources
Eproduct[MJ/tp]:
Board paper 22381 District heating 12 By products 258 Total: 22651
Δ
Δ
Figure 14. Life Cycle Exergy Analysis of Skoghall.
Table 5. Electricity and oil demand reduction from changing the processes oil boiler (OB), recovery boiler (RB) and evaporation plant (EP) compared to ‘today’s system’.
Changed process
BOB BOB,RB,CEP
(DS = 80%) RB,NCEP
(DS=75%)Electricity demand reduction 2.1% 4% 6.7% Oil demand reduction 56% 56% 44%
BOB: Bark-oil boiler CEP: Conventional evaporation plant NCEP: Non-conventional evaporation plant
When the bark-oil boiler is put into operation, all the bark goes into the bark-oil boiler instead of the old bark boiler. In this case, the old bark boiler is not in operation.
Table 5 gives a picture of the electricity demand reduction and fuel oil demand reduction in terms of exergy when the oil boiler, recovery boiler and evaporation plant are improved, while the exergy of products and
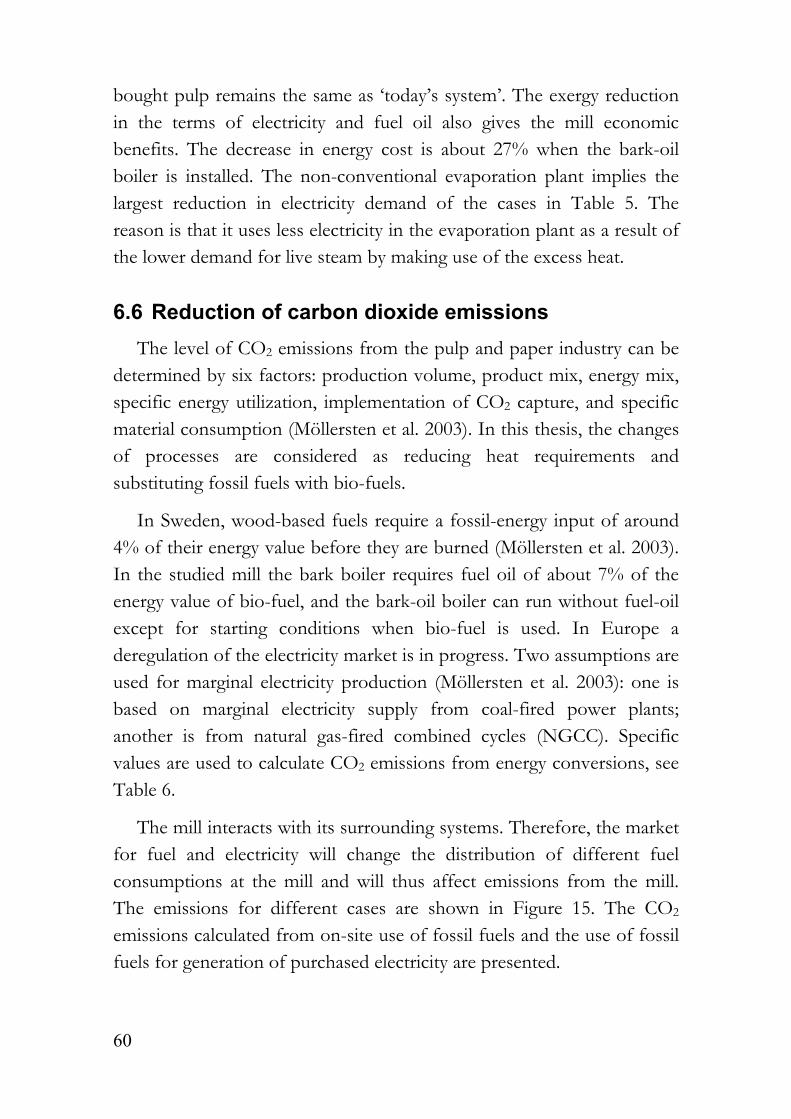
60
bought pulp remains the same as ‘today’s system’. The exergy reduction in the terms of electricity and fuel oil also gives the mill economic benefits. The decrease in energy cost is about 27% when the bark-oil boiler is installed. The non-conventional evaporation plant implies the largest reduction in electricity demand of the cases in Table 5. The reason is that it uses less electricity in the evaporation plant as a result of the lower demand for live steam by making use of the excess heat.
6.6 Reduction of carbon dioxide emissions The level of CO2 emissions from the pulp and paper industry can be
determined by six factors: production volume, product mix, energy mix, specific energy utilization, implementation of CO2 capture, and specific material consumption (Möllersten et al. 2003). In this thesis, the changes of processes are considered as reducing heat requirements and substituting fossil fuels with bio-fuels.
In Sweden, wood-based fuels require a fossil-energy input of around 4% of their energy value before they are burned (Möllersten et al. 2003). In the studied mill the bark boiler requires fuel oil of about 7% of the energy value of bio-fuel, and the bark-oil boiler can run without fuel-oil except for starting conditions when bio-fuel is used. In Europe a deregulation of the electricity market is in progress. Two assumptions are used for marginal electricity production (Möllersten et al. 2003): one is based on marginal electricity supply from coal-fired power plants; another is from natural gas-fired combined cycles (NGCC). Specific values are used to calculate CO2 emissions from energy conversions, see Table 6.
The mill interacts with its surrounding systems. Therefore, the market for fuel and electricity will change the distribution of different fuel consumptions at the mill and will thus affect emissions from the mill. The emissions for different cases are shown in Figure 15. The CO2 emissions calculated from on-site use of fossil fuels and the use of fossil fuels for generation of purchased electricity are presented.

61
Table 6. Specific CO2 emission levels (Möllersten et al. 2003).
Fuel CO2 emissiona (t CO2/MWh) Wood fuel, wet barkb 0 Fuel oil 0.27 Electricityc 0.85 Electricityd 0.34
a Values are based on the primary emission from fuel combustion. Emissions due to fuel extraction, transportation, and refinement are not included.
b When new biomass grows, CO2 equivalent to the CO2 released from biomass fuel combustion is absorbed.
c Coal-fired power plant with 38% electricity efficiency. d NGCC (Natural gas-fired combined cycle) with 60% electrical
efficiency.
In the mill the reduction of CO2 emissions depends on the national electricity production and process changes. Increasing internal electricity production will reduce fuel consumption for marginal electricity production in the external power system, which reduces the CO2 emissions. The use of marginal electricity from NGCC leads to lower emissions. The largest reduction in CO2 emissions might occur when the three processes are changed, see Figure 15.
A further improvement can be made to use the excess heat in the mill. A new case of using a bark-oil boiler, a rebuilt recovery boiler (DS=80%) and a non-conventional evaporation plant, is assumed to reduce CO2 emissions even more.
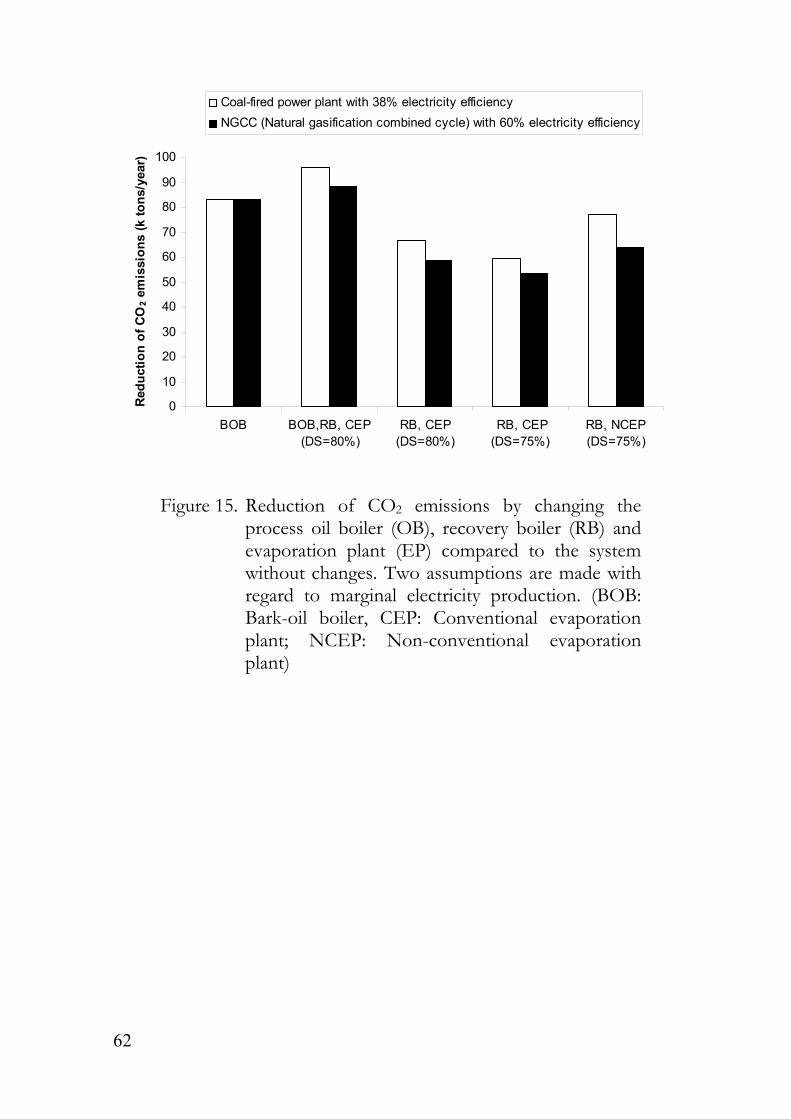
62
0
10
20
30
40
50
60
70
80
90
100
BOB BOB,RB, CEP(DS=80%)
RB, CEP(DS=80%)
RB, CEP(DS=75%)
RB, NCEP(DS=75%)
Red
uctio
n of
CO
2 em
issi
ons
(k to
ns/y
ear)
Coal-fired power plant with 38% electricity efficiencyNGCC (Natural gasification combined cycle) with 60% electricity efficiency
Figure 15. Reduction of CO2 emissions by changing the process oil boiler (OB), recovery boiler (RB) and evaporation plant (EP) compared to the system without changes. Two assumptions are made with regard to marginal electricity production. (BOB: Bark-oil boiler, CEP: Conventional evaporation plant; NCEP: Non-conventional evaporation plant)

63
7 Discussion and conclusions
Methods, results and conclusions from both chapters and appended papers are discussed below.
7.1 Discussion Industrial processes often involve the recycling of energy and material
flows to better meet the conditions for sustainable development. The improved MIND method with feedback loops makes it possible to optimize such processes. In an economic perspective the recycling of energy and material mostly offers a reduction of the total cost. A slight difference in accuracy may influence the values and the final result. However, there is no significant difference between manual handling and the improved method. At present, the improved MIND method meets the required accuracy practiced in the original MIND method with less calculation time. Moreover, the final results also depend on the precision of the MILP solvers. In this work, the commercial program CPLEX (CPLEX 1995) is used as the MILP solver. In order to avoid sub-optimization, the model must cover the entire mill.
Exergy efficiencies are often referred to as “real” or “true” efficiencies, and energy efficiencies as “approximations to real” efficiencies (Gaggioli & Petit 1977). Different results can be obtained when evaluating a process using different definitions of exergy efficiencies. This must be well understood to be used properly. Unlike energy efficiencies, all of these exergy-based efficiencies are reasonable in that they provide measures of approach to ideality. Moran and Shapiro (2000) stated that exergy analysis is particularly suited for furthering the goal of more efficient energy use, since it enables the locations, types, and true magnitudes of waste and loss to be determined.

64
Exergy analyses visualize possible process improvements. These are often considered in the order of highest exergy loss first. However, “tackle the biggest loss first” approach may not always be appropriate. Every part of the system is dependent on all the others; an improvement in one part may cause increased losses in other parts. When evaluating the system, the overall perspective must be considered. The process changes in this study are a selection of a large number of choices. More alternatives can be analyzed in future studies for the decision-making process.
In a future deregulated European electricity market, electricity prices will probably increase in Sweden and, consequently, a reduction in the demand for electricity will be necessary. The introduction of an electricity certificate trading system (“Green certificates”) in May 2003 implies that revenues from electricity sales increase if the electricity produced is based on renewable resources (SGEB 2003). This gives the mill benefits from increasing electricity production from bio-fuels. By converting the oil boiler into a bark-oil boiler, the mill not only reduces its use of non-renewable resources but also gains from selling electricity.
In the Kyoto Protocol, many nations agreed upon greenhouse gas reduction targets and are called upon to reach average emission reductions of 5% from the 1990 level by the first commitment period, 2008-2012. In Sweden, the taxes on energy and CO2 depend on whether a fuel is used for electricity production or heat production. In addition, the reduction of CO2 emissions can lead to cost savings. The mill can further reduce CO2 emissions by switching from fossil fuels to bio-fuels, improved process efficiency, black liquor gasification, and CO2 capture and sequestration.
Exergy, which originates from the contrast between the sun and space, drives flows of energy and matter on the surface of the earth. This exergy is truly renewable. The exergy of non-renewable resources is limited. As the stocks are used up, the situation is non-sustainable. Life cycle exergy analysis takes the renewable and non-renewable resources into account over the whole life cycle. In the mill the main non-

65
renewable resource is fuel oil, followed by electricity from non-renewable sources. Investing in a new bark-oil boiler instead of the old oil boiler will have a direct impact on the use of non-renewable resources. The more the processes are improved, the less exergy will be used from non-sustainable resources. Furthermore, Sweden has decided to phase out nuclear power production, which includes “the loss of electricity production being compensated by the introduction of new production capacity and reduced use of electricity” (SEA 2002).
When the investment cost is known for an alternative process, the pay-back period can be calculated from the energy cost difference. It is also important to consider the changes in energy price and tax system, as well as other aspects, e.g. interest rates and the price of products, during the pay-back time. Though they are not included in this thesis, these facts should be considered when a new process is evaluated. However, for the unpredictable market, sensitivity analyses are needed to evaluate the influence on the investment.
To achieve a zero environmental impact, the waste streams have to be discharged at thermal and chemical equilibrium with their surroundings. The choice of reference state is considered in the calculation of exergy analysis. The reference temperature affects the calculation of exergy. The exergy efficiency varies somewhat when the reference temperatures change. However, the variation is larger for the exergy losses. The reference states need to be treated with greater care when two systems in different environments are being analyzed.
Reliable input data is not always obtainable. Errors and difficulties may occur in the measurement which leads to a need to make assumptions. Accuracy in the results is dependent on the accuracy of the input data. The importance of accurate input data and sensitivity analysis must therefore not be neglected. The staff at Skoghall has helped to obtain correct input data for the analysis.
A fundamental step towards sustainable development is to increase process efficiency and to reduce the impact on the environment. In this

66
study, fossil fuels are replaced by bio-fuels wherever this is economically, environmentally, and technically feasible.
7.2 Conclusions Obviously, if a society consumes resources at a faster rate than they
are renewed, it will not be sustainable. About 62% of the exergy use in our present society originates from fossil fuels; the rest is composed mainly of wood for construction and paper, firewood, food, hydropower and nuclear deposits. Thus, the present industrial society is obviously not sustainable and is facing a collapse, and there is an urgent need to reduce the use of non-renewable resources.
The exergy flow diagram shows losses both as destruction and emissions to the environment, which is important information for estimating environmental impacts. In energy flow diagrams, energy is always conserved. Mostly, the waste heat carries the largest amount of energy into the environment, far more than is carried by the exhaust gases. However, the exergy of waste heat is small since the temperature is close to ambient.
Different definitions of exergy efficiency are discussed. Determining the most efficient process is more a matter of defining efficiency. The flow diagram usually offers more insight into the energy/exergy use. According to the analysis the exergy efficiency of the bark/oil boiler is less than half of the energy efficiency due to the low quality of steam. Energy and exergy losses of the recovery boilers are nearly one third of the total energy and exergy loss in the mill. The changes made to these processes show that the exergy efficiency of the processes has improved and the total exergy loss has been reduced. Furthermore, these improvements also give economic benefits.
Life cycle exergy analysis is very important in the design of sustainable systems that use renewable resources. Exergy is a unique and valuable ecological indicator since it is also very useful in the design process. By minimizing the exergy losses in a process, the exergy emitted to the

67
environment as waste is also minimized, and often also the environmental impact. Replacing fuel oil with bark reduces the energy cost and net CO2 emission at the mill, but increases the exergy loss.
A zero emission process can be achieved when the emissions have the same chemical and physical state as the environment. The reference state should therefore be linked to the local environment. Varying reference temperature influences the calculation of exergy; and it has a larger impact on the exergy loss than exergy efficiency, while the energy values are not influenced.
It is shown that exergy is a better tool than energy in the design of sustainable processes. Since exergy also includes the second law of thermodynamics it is a more complete and accurate concept than energy.
The pulp and paper industry is often regarded as an efficient energy user. However, it is shown that the potential for further reductions in energy/exergy demand in this type of industry is still very high, when exergy efficiency and process changes are considered.
An industrial energy system should include not only the actual industrial system, but also the relations with the surrounding energy market. With the deregulation of electricity markets and its consequences for industrial agreements on electricity prices, the need for industry to be proactive in relation to changing energy markets will become increasingly important. Swedish companies have to change the strategy of energy usage and/or process structures. The sensitivity analysis shows that a change in the price of electricity has a tremendous impact on the energy cost, more than for the price of fuel, which means that a unified European electricity market will have a great impact on Swedish industries that use electricity.
The MIND/F method offers accurate results for processes that include energy and material recycling of resources, which is not only often economical, but may also imply a lower environmental impact.
The methods illustrated in this thesis can be applied to different industries as well as in society to provide essential information for the
68
decision-making process. Efforts to improve efficiency are guided by the system’s efficiencies and losses. Exergy based efficiencies are used to address energy problems effectively and to prioritize efficiency improvement efforts appropriately. This will help decision-makers focus on possible improvements. The MIND method can help identify the best structure for the processes in order to minimize both system cost and other factors such as emissions of CO2 and NOx.
The coordination between the MIND method and exergy analysis shows a possible way to analyze an industrial energy system thoroughly. The MIND method is an optimization tool for an energy system. Exergy analysis is an effective method using the conservation of mass and conservation of energy principles together with the second law of thermodynamics in the design and analysis of energy systems. The combined approach shows that the cost effective alternative is usually also an exergy efficient process.
The investment in an oil-bark boiler, evaporation plant and recovery boiler gives a good supply of sustainable resources, a reduction in the environmental impact, and saves both energy and money. In addition, by replacing the present evaporation plant with the non-conventional one, even more benefits can be achieved. In the future, the mill will be able to rely on only biomass; in addition the mill will produce also electricity and heat. This will make the mill more sustainable.
In order to achieve a sustainable energy system, a least five aspects, i.e. time, economics, resources, technology and environment, should be considered. Other aspects, such as health and safety, are beyond the scope of this thesis. These methods can support long-term planning; find the best structure for economic savings; further the goal of more efficient energy technology; and address the impact of energy resource use on the environment.
69
8 Future research
The MIND method, originally designed for academic purposes, will one day be a decision making tool for industrial companies, with further developments – more functions, more user-friendly interfaces, and coordination with more methods. In this thesis, the MIND method is used in the cost-optimization, but it could also include other aspects, for example the environment. In addition, a multi-objective optimization could be incorporated into the MIND method.
Exergy analysis also has several other advantages that are gaining widespread acceptance. One difficulty, however, is obtaining data and performing calculations. The need to choose a reference environment in exergy analysis is considered by some to render the technique too challenging. These difficulties must be overcome. A simple tool is urgently needed and must lead to tangible, direct results. Life cycle exergy analysis needs to be further completed and applied to real systems.
The coordination between the MIND method and exergy analysis seems to be promising from the point of view of the decision-making processes. Much still needs to be done, however, both to improve understanding of the relations between them and to develop better tools. The combination of different methods also needs to be further developed with regard to economy, technology, the environment, and sustainability in particular.

70

71
9 References
Aaltola J., 2003, Simultaneous Synthesis of Flexible Heat Exchanger Networks, Ph.D. thesis. Helsinki University of Technology, Helsinki, Finland.
Ackoff R. L., 1956, “The development of operations research as a Science”, Operations Research 4(3):265-295.
Alamir M., Bornard G., 1995, “Minimum energy-based discontinuous globally stabilizing feedback for a class of nonlinear systems”, in Proceedings of the third European Control Conference 3:1851-1853.
Ayres R. U., Ayres L. W., Martinás K., 1996, Eco-Thermodynamics: Exergy and Life Cycle Analysis, Working paper, INSEAD, Fontainebleau, France.
Ayres R. U., Ayres L. W., Martinás K., 1998, “Exergy, waste accounting, and life-cycle analysis”, Energy 23(5):355-363.
Ayres R. U., Ayres L. W., Warr B., 2003, “Exergy, power and work in the US economy, 1900-1998”, Energy 28(3):219-273.
Bejan A., 2001, “Message from the Honorary Editor”, Exergy 1(1):2.
Bejan A., Tsatsaronis G., Moran M., 1996, Thermal Design and Optimization, Wiley, New York.
Bengtsson C., Karlsson M., Berntsson T., Söderström M., 2002, “Co-ordination of pinch technology and the MIND method – applied to a Swedish board mill”, Applied Thermal Engineering 22:133-144.
Biegler, L. T., Grossmann I. E., 2002, “Retrospective on optimization”, submitted for publication.
Birol F., Argiri M., 1999, “World energy prospects to 2020”, Energy 24:905-918.
Blinge M., 1998, ELM: Environmental Assessment of Fuel Supply Systems for Vehicle Fleets, Ph.D. thesis, Department of

72
Transportation and Logistics, Chalmers University of Technology, Gothenburg, Sweden.
Boĕnjaković F., 1938, “Fight against irreversibilities”, Arch. Wärmewirt., 19(1):1-2. (in German)
Bojić M., Dragičević S., 2002, “MILP optimization of energy supply by using a boiler, a condensing turbine and a heat pump”, Energy Conversion and Management 43:591-608.
Bojić M., Stojanović B., 1998, “MILP optimization of a CHP energy system”, Energy Conversion and Management 39(7):637-642.
Carnot N. L. S., 1824, Reflections on the Motive Power of Heat, Bachelier, Paris, LIbraire Philosophique J., Vrin, Paris, 1978. (in French)
Chang C-T., Hwang J-R., 1996, “A multiobjective programming approach to waste minimization in the utility systems of chemical processes”, Chemical Engineering Science 51(16):3951-3965.
Checkland P., 1981, Systems Thinking, Systems Practice, John Wiley & Sons, Chichester.
Churchman C. W., 1968, The System Approach, Dell Publishing, New York.
CORDIS (Community Research and Development Information Service), 2003, Sustainable Energy System, http://www.cordis.lu/sustdev/ energy/.
Cornelissen R. L., 1997, Thermodynamics and Sustainable Development – The use of exergy analysis and the reduction of irreversibility, Ph.D. thesis, University of Twente, Enschede, The Netherlands.
Cornelissen R. L., Hirs G. G., 2002, “The value of the exergetic life cycle assessment besides the LCA”, Energy Conversion and Management 43:1417-1424.
CPLEX, 1995, Using the CPLEX Callable Library, CPLEX Optimization Inc.
Dag S., 2000, Volvo Faces a Deregulated European Electricity Market, Ph.D thesis, Linköping University, Linköping, Sweden.

73
Dincer I., 2002, “The role of exergy in energy policy making”, Energy Policy 30:137-149.
EC (European Commission), 2003, Office Journal of the European Union, Directive 2003/54/EC of the European Parliament and of the council 26, concerning common rules for the internal market in electricity and repealing Directive 96/92/EC.
EIA (Energy Information Administration), 2003, International Energy Outlook 2003, U.S. Department of Energy, Washington, USA.
El-Sayed Y. M., Gaggioli R. A., 1989, “A critical review of second law costing methods: Part I and II”, ASME J. Energy Research Technological 111:1-15.
El-Sayed Y. M., Tribus M., 1983, “Strategic use of thermoeconomics for system improvement”, in Gaggioli R.A. ed. Efficiency and Costing, ACS Symp. Ser. No.235, 1983.
Ertesvåg I. S., 2001, “Society exergy analysis: a comparison of different societies”, Energy 26:253-270.
Finnveden G., Östlund P., 1997, “Exergies of natural resources in life-cycle assessment and other applications”, Energy 22(9):923-931.
Gaggioli R. A., Petit P. J., 1977, “Use the second law first”, ChemTech 7:496-506.
Gemci T., Öztürk A., 1998, “Exergy analysis of a sulphide-pulp preparation process in the pulp and paper industry”, Energy Conversation and Management 39(16-18):1811-1820.
Gibbs J. W., 1873, “A method of geometrical representation of thermodynamic properties of substances by means of surface”, Transfer Conn. Academics II:382-404.
Gong M., 2003, “Optimization of industrial energy systems by incorporating feedback loops into the MIND method”, Energy – The International Journal 28(15):1655-1669. (Paper IV)
Gong M., Wall G., 1997, “On exergetics, economics and optimization of technical process to meet environment conditions”, in R. Cai et al Eds. Thermodynamic Analysis and Improvement of Energy Systems (TAIES’97), pp. 453-460, Beijing, China.

74
Goodstein D., 1994, “Chance and necessity”, Nature 368(6472):598.
Gool W. V., 1998, “Thermodynamics of chemical references for exergy analysis”, Energy Conversation and Management 39(16-18):1719-1728.
Grossmann I. E., Biegler L. T., 2002, “Future perspective on optimization,” submitted for publication.
Grossmann I. E., Caballero J. A., Yeomans H., 1999, “Advances in mathematical programming for automated design, integration and operation of chemical processes”, in International Conference On Process Integration, 7-10 March, Copenhagen, Denmark.
Grossmann I. E., Santibanez J., 1980, “Applications of mixed-integer linear programming in process synthesis”, Computers and Chemical Engineering 4:205-214.
Gullichsen J., Fogelholm C. J., 1999, Chemical Pulping, TAPPI, Finland.
Henning D., 1999, Optimisation of Local and National Energy Systems, Ph.D. thesis, Linköping University, Linköping, Sweden.
Hirs G., 1998, “Exergy loss: a basic for energy taxing”, in Proceeding NATO-ASI Works, Thermodynamics Optimization Complex Energy Systems, Constantza Romania.
Hohmann E. C., 1971, Optimum Networks for Heat Exchange, Ph.D. thesis, University of Southern California, USA.
IEA (International Energy Agency), 2003, Key World Energy Statistics 2003, STEDI, France, http://www.iea.org.
Ingelstam L., 2002, Systems – to Think about Society and Technology (System – att tänka over samhälle och teknik), Energimyndigheten, Eskilstuna, Sweden. (in Swedish)
Ishida M., Zheng D., Akehata T., 1987, “Evaluation of chemical-looping-combustion-power-generation system by graphical exergy analysis”, Energy12(2):147-154.
Ishida M., 2002, Thermodynamics made Comprehensible, Nova Science Publishers, Huntington, New York.
IUCN, UNEP, WWF, 1980, World Conservation Strategy: Living Resource Conservation for Sustainable Development, International

75
Union for Conservation of Nature and Natural Resources, (IUCN), Gland.
Jenkins G. M., 1969, “The systems approach”, Journal of Systems Engineering 1(1).
Jøgensen S. E., 1992, “Exergy and ecology”, Ecological Modelling 63:185-214.
Jouget E., 1907, “The theorem of Mr. Gouy and some of its applications”, Rev. Mech., 2, pp. 213-238. (in French)
Kaijser A., Tiberg J., 2000, “From operations research to futures studies: the establishment, diffusion, and transformation of the systems approach in Sweden, 1945-1980”, in Hughes and Hughes, eds., The Systems Approach in Management and Engineering, World War II and After, MIT Press, Cambride, Mass.
Karlsson M., 2002, Analysing Strategic Energy-Related Investments in Process Industries, Dissertation No. 791, Linköping University, Linköping, Sweden.
Karlsson M., Carlson A., 2002, “Increasing the use of wood fuel in a pulp and paper mill – investment opportunity and external costs”, The tenth biennal bioenergy conference – Bioenergy for the Environment Boise, September 22-26, 2002, Idaho, USA.
Karlsson M., Söderström M., 2002, “Sensitivity analysis of investments in the pulp and paper industry – On investments in the chemical recovery cycle at a board mill”, International Journal of Energy Research 26:1253-1267.
Keenan J. H., 1948, Thermodynamics, 3rd ed., Wiley, New York.
Kotas T. J., 1995, The Exergy Method of Thermal Plant Analysis, Reprint Edition, Krieger, Malabar, FL.
Lamps, 1991, Lamps User Guide Version 1.66, Advanced Mathematical Software Ltd, UK.
Larsson M., Sandberg P., 2003, “Analysing the influence of variations when optimising the energy and material system for an integrated steel plant”, in Proceedings of the International Conference on Fluid and Thermal Energy Conversion, December 7-11, Bali, Indonesia.
76
Larsson M., Sandberg P., Dahl J., Söderström M., Vourinen H., 2004, “System gains from widening the system boundaries: analysis of the material and energy balance during renovation of a coke oven battery”, accepted for publication in Energy Research.
Linnhoff B., Flower J. R., 1978a, “Synthesis of heat exchanger networks I. Systematic generation of energy optimal networks”, AIChE Journal 24(4):633–642.
Linnhoff B., Flower J. R., 1978b, “Synthesis of Heat Exchanger Networks II. Evolutionary Generation of Networks with Various Criteria of Optimality”, AIChE Journal 24(4):642–654, 1978.
Linnhoff B., Townsend D. W., Boland P., Hewitt G. F., Thomas B. E. A., Guy A. R., Marsland R. H., 1982, A User Guide on Process Integration for the Efficient Use of Energy, The Institution of Chemical Engineers.
Linnhoff B., Vredeveld D. R., 1984, “Pinch technology has come of age”, Chemical Engineering Progress 80(7):33-40.
Lombardo G., Guillet F., Muratore E., Viinikainen S., 1992, “Exergy and pinch analyses of Kraft pulp mill”, in Energy Efficiency in Process Technology, in Pilavachi P.A. ed. Proceedings of the International Conference on Energy, Athens, Greece.
Lombardi L., 2001, “Life cycle assessment (LCA) and exergetic life cycle assessment (ELCA) of a semi-closed gas turbine cycle with CO2 chemical absorption”, Energy Conversation and Management 42:101-114.
Lu P., 1993, “A new nonlinear optimal feedback control law”, Control-Theory and Advanced Technology 9(4):947-954.
Maréchal F., Kalitventzeff B., 1997, “Effect modeling and optimization, a new methodology for combined energy and environment synthesis of industrial processes”, Applied Thermal Engineering 1(8-10):981-992.
Michaelis P., Jackson T., Clift R., 1998, “Exergy analysis of the life cycle of steel”, Energy 23(3):213-220.
Moran M. J., Sciubba E., 1987, eds. Second Law Analysis of Thermal System, ASME.

77
Moran M. J., Shapiro H. N., 2000, Fundamentals of Engineering Thermodynamics, 4th ed., Wiley, New York.
Möllersten K., Yan J., Westermark M., 2003, “Potential and cost-effectiveness of CO2 reductions through energy measures in Swedish pulp and paper mills”, Energy 28:691-710.
Nilsson K., 1993, Cost-Effective Industrial Energy Systems – Multiperiod Optimization of Operating Strategies and Structural Choices, Dissertation No. 315, Linköping University, Linköping, Sweden.
Nilsson K., Sundén B., 1992, “A combined method for the thermal and structural design of industrial energy systems”, in Sundén B. and Zukauskas A. (Eds.), Recent Advances in Heat Transfer, Elsevier.
Nocedal J., Wright S. J., 1999, Numerical Optimization, Springer, New York.
Nordman R., Berntsson T., 2001, “New pinch technology based HEN analysis methodologies for cost- effective retrofitting”, Canadian Journal of Chemical Engineering 79(4):655-662.
Papoulias S. A., Grossmann I. E., 1983, “A structural optimization approach in process synthesis I. Utility system”, Computer chemical Engineering 7(6):695-706.
Pearson A., Kwon W., 1976, “A minimum energy feedback regulator for linear systems subject to an average power constrain”, IEEE Transactions on Automatic Control AC-21(5):757-761.
Poredoš A., Kitanovski A., 2002, “Exergy loss as a basis for the price of thermal energy”, Energy Conversion and Management 43:2163-2173.
Rant Z., 1956, “Exergy, a new work for technical available work”, Forschungen im Ingenieurwesen 22:36-37. (in German)
Rosen M. A., Dincer I., 2001, “Exergy as the confluence of energy, environment and sustainable development”, Exergy 1(1):3-13.
Rosen M. A., Dincer I., 2003, “Exergy-cost-energy-mass analysis of thermal systems and processes”, Energy Conversion and Management 44:1633-1651.
78
Ryding S. O., 1992, Environmental Management Handbook, IOS Press, Amsterdam.
Sciubba E., 2001, “Beyond thermodynamics? The concept of extended exergy accounting and its application to the analysis and design of thermal systems”, Exergy 1(2):68-84.
SEA (Swedish Energy Agency), 2002, Energy in Sweden 2002, ET 20:2002, Multitryck i Eskilstuna, Sweden.
SEA (Swedish Energy Agency), 2003a, Energy in Sweden 2003, ET 20:2003, Multitryck i Eskilstuna, Sweden. (in Swedish)
SEA (Swedish Energy Agency), 2003b, The Electricity Market 2003, ET 13:2003, Multitryck i Eskilstuna, Sweden.
SFIF (Swedish Forest Industries Federation), 2001a, Energy Use in the Pulp and Paper Industry 2000, Stockholm, Sweden. (in Swedish)
SFIF (Swedish Forest Industries Federation), 2001b, The Swedish Forest Industries 2001 – Fact and Figures, Stockholm, Sweden.
SGEB (Swedish Government Energy Bill), 2003, Electrical Certificates to Promote Renewable Energy Sources, Regeringens proposition 2002/03:40, Sweden. (in Swedish)
Stora Enso, 2003, http://www.stonaenso.com, accessed 2003-8.
Szargut J., David R. M., Steward F. R., 1988, Exergy Analysis of Thermal, Chemical and Metallurgical Processes, Springer-Verlag, Berlin.
Taha H. A., 2003, Operations Research: An Introduction, 7th, Prentice Hall, USA.
Tari M. H., Söderström M., 2002a, “Modeling of thermal energy storage in industrial energy systems – The method development of MIND”, Applied Thermal Engineering 22(11):1195-1205.
Tari M. H., Söderström M., 2002b, “Optimisation modelling of industrial energy systems using MIND – Introducing the effect of material storage”, International Journal of Operational Research 142(2):419-433.

79
Tekin T., Bayramoğlu M., 2001, “Exergy and structural analysis of raw juice production and steam-power units of a sugar production plant”, Energy 26:287-297.
Torres C., Serra L., Valero A., Lozano M. A., 1996, “The productive structure and thermoeconomic theories of system optimization”, in Duncan A.B. et al. (Eds.), Proceeding ASME Advanced Energy Systems Division, Advanced Energy Systems Division (Publication) AES, Vol. 36, American Association of Mechanical Engineers, New York, pp. 429-436.
Tribus M., 1961, Thermostatics and Thermodynamics, Van Norstrand, New York.
Tsatsaronis G., 1987, “A review of exergoeconomic methodologies”, in Moran, M.J. Sciubba, E. (Eds.), Second Law Analysis of Thermal Systems, American Socialization Mechanical Engineering, New York, pp.81-87.
Tsatsaronis G., 1994, “Invited papers on Exergoeconomic”, Energy 19:279-381.
Tsatsaronis G., Valero A., 1989, “Thermodynamics meets economics”, Mechanical Engineering, pp. 84-86.
UNFCCC (United Nations Framework Convention on Climate Change), 1997, Kyoto Protocol to the United Nations Framework Convention on Climate Changes, COP 3 report, document FCCC/CP/1997/7/Add.1.
Valero A., 1995, “On the energy costs of present day society”, in: Krane, R.J: (Ed.), Thermodynamics and the Design, Analysis and Improvement of Energy System, in: AES, Vol. 35, American Socialic Mechanical Engineers, New York, pp. 1-7.
Wagner H. M., 1969, Principles of Operations Research – With Applications to Managerial Decisions, Prentice-Hall Inc., Eaglewood Cliffs, New Jersey, cop.
Wall G., 1977, Exergy – A Useful Concept Within Resource Accounting, Report No. 77-42, Institute of Theoretical Physics, Chalmers University Technology, Gothenburg, Sweden.

80
Wall G., 1986, Exergy – A Useful Concept, Ph.D. thesis, Chalmers University Technology, Gothenburg, Sweden.
Wall G., 1991, “Optimization of refrigeration machinery”, International Journal of Refrigeration 14:336-340.
Wall G., 1993, “Exergy, ecology and democracy – concepts of a vital society” in Szargut et al. (Eds.), Energy Systems and Ecology, pp. 111-121, Krakow, Poland.
Wall G., 2003, “Exergy tools”, Journal of Power and Energy 217(A2):125-136.
Wall G., Gong M., 1995, “Heat Engines and Heat Pumps in Process Integration”, in Krane R.J. (Ed.), Thermodynamics and the Design, Analysis, and Improvement of Energy Systems, November 12-17, AES-Vol. 35, pp. 217-222, 1995, ASME WAM ‘95, San Francisco, California.
Wall G., Gong M., 1996, “Exergy Analysis versus Pinch Technology” in Alvfors P. et al. (Eds.), Efficiency, Costs, Optimization, Simulation and Environmental Aspects of Energy Systems, Stockholm, Sweden.
WCED (The World Commissions on Environment and Development), 1987, Our Common Future, WCED, Oxford University Press.
Williams H. P., 1999, Model Building in Mathematical Programming, 4th ed. Wiley, UK.
Yokoyama R., Ito K., 2000, “A novel decomposition method for MILP and its application to optimal operation of a thermal storage system”, Energy Conversion and Management 41:1781-1795.
Zvolinschi A., Kjelstrup S., Holmberg A., 2003, “Industrial ecology indicators for alternative processes in a pulp and paper mill”, in 16th International Conference on Efficiency, Costs, Optimization, Simulation and Environmental Impact of Energy Systems (ECOS 2003), June 30 - July 2, 2003, Copenhagen, Denmark.

81
Appendix Skoghall’s processes
Sulfate Pulp Mill
Debarking
Bark/OilBoilers
Digester
bark
chips
Power Plant(TG8 & TG9)
Causticizing etc
Recovery Boilers Washing/
Screening
EvaporationBleaching
CTMP Mill
Paper Mill (KM8 & KM9)
steam
steam
whiteliquor
green liquor
oil
wood
heavy black liquor
pulp wash liquor
dilutionwater
own chips
unbleached pulp
bleached pulp
bought chipsblack
liquor
CTMP pulp
steam
electricity
steamsteam
steam
Board paper
Lime Kiln
Figure I. The schematic of the pulp and paper mill – Stora Enso Skoghall.
82
The Stora Enso Skoghall mill is situated in the northern shore of lake Vänern in Sweden. It is an integrated pulp and paper mill, which consists of the sulfate pulp mill, the CTMP pulp mill and the paper mill, see bold part in Figure I. The main products are Triplex, Triplex HSI, Duplex, Duplex HSI, Coated Kraft Back (CKB) and White Top Liner (WTL).
Wood room/Debarking
The main purpose of this process is to remove bark to the extent necessary for the quality of the final product. The incoming logs with dry content about 50% are first cleaned with water, especially in the winter to remove ice etc, then debarked in the barking drum. The drums are slowly rotating hollow cylinders into which wood is fed. Bark and dirt must be removed from the logs before cooking. The waste water is discharged at 27°C. The bark is then transported in a blow off pipe to the bark boiler where it is combusted. The debarked logs are chipped. Electricity is used for debarking and chipping the wood, and pressing the bark in a bark press.
Bark/Oil boilers
Bark and fuel oil are combusted to generate steam in the bark and oil boilers respectively. The steam generated passes through two back-pressure turbines.
Power Plant
The pulp mill produces more heat than needed. The steam produced in the recovery boilers and the bark/oil boilers has considerably higher pressure and temperature than needed in the process. This steam could be utilized in the back-pressure turbines to generate electricity. The generated electricity constitutes about 22% of the mill’s electricity demand. There are also throttle valves to make it possible to lower the pressure even while the turbines are not operating.
Digester
Before entering the digester the chips go through the steaming vessel and the impregnation vessel in order to eliminate the air in the chips and

83
mix them with the cooking liquid. The mixture is fed into the top of the digester, where the temperature is raised and a chemical reaction to dissolve the lignin that holds the fibers together takes place. The fibers gradually move down the digester and heat is provided by external heating of the cooking liquor. The final step is a lowering of the pressure in the bottom of the digester so that the liquor in the chips exceeds the boiling point and separates the fibers from each other. These chemicals are recovered to white liquor by several processes.
Washing/screening
This process reduces the amount of rejectable material from the inject stream. The pulp is pulverized, refined and separated from the liquor. Bundles of knots and fibers are broken up in the primary step. The cleansing liquid is brought in at the top in a continuous diffuser and pressed through the pulp. This liquor, which is heavier than water, is thus pushed out through the perforated bottom. Discharged pulp contains solid impurities, mainly incompletely delignified wood, some knots, and other solid materials. Screening separates these, and the rejects are usually reprocessed to reduce raw material losses. On the requirements of final product, part of the pulp will be sent to bleaching before the paper mill.
Bleaching
Bleaching is a purification process in which colored substances are modified so that they either lose their light absorption ability or dissolve. Other aims of bleaching are to further reduce solid contaminants that have not been separated out in previous operations, and to improve the hygienic properties of the product. The processes have several stages, e.g. oxygen delignification, chlorination, complex binder and hydrogen peroxidation. By the end of the final treatment, the fibers have been converted from a brownish mass to a more pleasant-looking white substance.
84
Evaporator plant
The aim of evaporation is to produce black liquor of sufficiently high concentration that is more efficiently combusted in the recovery boilers with minimum chemical losses. The black liquor is evaporated to about 65% of dry content (heavy black liquor) by using steam. The process takes place in several steps at successively lower temperatures and pressures. The liquor is brought in through the bottom part of the unit in tubes that are heated with steam on the outside. The upper part of the evaporator has a separator that separates the liquor from the steam, whereby the liquor leaves through the bottom part of the separator while the steam leaves at the top. In order to keep fresh steam consumption to an absolute minimum, the evaporators are connected in series so that the subsequent steps take place at a lower pressure, and thus lower temperature, and heated with the steam used in the previous step, i.e. cascading.
Recovery boiler
In the recovery boiler, the organic material in the heavy black liquor can be burned to generate high pressure steam (4MPa, 420ºC), which can generate electricity in the power plant. This boiler also recovers the processing chemicals present in the concentrated liquor. To replace the chemicals that were lost in the pulping process, pure sodium hydrate, NaOH, is added in a scrubber stage, and the water is then returned to the wash liquor tank, and into the system in the mixing tank after the recovery boiler. Here, the melt is dissolved in the weak liquor and this solution is called green liquor, getting its name from its color.
Causticizing
In the causticizing department, green liquor, which contains sodium carbonate and sodium sulfide, is converted and causticized into white liquor. Sodium sulfide is used for pulp processing while the sodium carbonate must be converted to sodium hydroxide before it can work effectively. This is done by adding lime to the green liquor.

85
The green liquor from the recovery boilers is subsequently transported to the causticizing department, where it is converted to white liquor when burned lime reacts with sodium carbonate in the green liquor. The reaction products are separated from each other as white liquor in the solution and lime mud in the precipitate.
The lime mud is washed with warm water in two steps before it enters the lime mud filter. The wash liquid is returned to the weak liquor tank. The lime that is lost in the process has to be replaced, which increases the efficiency of the process.
Lime kiln
In a lime kiln the calcium carbonate, which is formed when calcium hydroxide reacts with sodium carbonate in the green liquor, is calcined to calcium oxide and reused.
Gas incineration furnace
Gas incineration furnace combusts gases from the different processes to produce steam.
CTMP mill
CTMP pulp, which is produced with pressurized refining, needs relatively low amounts of chemical doses and the yield is typically above 90%.
Most of the chips used in the process are purchased; only 13% are made at the mill. The chips are preheated with steam to about 120˚C, impregnated with sodium sulfite (Na2SO3) and sodium hydroxide (NaOH) and then refined under pressure. Sulfur dioxide gas, SO2, is blown into liquid sodium hydroxide NaOH to produce Na2SO3 in another part of the mill.
Paper mill
In the paper mill the two board machines produce a number of different qualities of board. All qualities are used in the food industry and the differences are in the ability to print on the surface, the strength

86
of the board, the ability to resist flavor and odor changes, etc. The board is built up of five layers: the surface layer, three centre layers and the back layer with different kinds of configuration.
Nearly 100% of the supplied steam to the paper mill is used to dry the pulp to paper. Besides the pulp made at the mill, Skoghall also buy pulp; 20% of all the pulp needed at the mill is bought pulp. Some wastewater is discharged.
For further reading on processes in the pulp and paper industry, see for example the following reference:
Biermann C. J., 1996, Handbook of pulping and papermaking, San Diego, Academic Press, cop.
Britt K. W., 1970, Handbook of pulp and paper technology, New York, Van Nostrand, Cop.
Gullichsen J., Fogelholm C. J., 1999, Chemical Pulping, TAPPI, Finland.
Jokio M., 2000, Papermaking Part 3, Finishing, TAPPI, Finland.
Karlsson M., 2000, Papermaking Part 2, Drying, TAPPI, Finland.
Kline J. E., 1985, Paper and Paperboard – Manufacturing and Converting Fundamentals, Miller Freeman Publications Inc.
Paulapuro H., 2000, Papermaking Part 1, Stock Preparation and Wet End, TAPPI, Finland.
SUM (Skogindustrins utbilding i Markaryd), 1996, Mechanical Pulp – manufacturing and use, SUM AB, Markaryd, Sweden. (in Swedish)
SUM (Skogindustrins utbilding i Markaryd), 1998, Pulp and paper – a book of fundamentals, SUM AB, Markaryd, Sweden. (in Swedish)
Sundholm J., 1999, Mechanical Pulping. TAPPI, Finland.
Sveriges Skogsindustriförbund, 1991, Sulphate Pulp Manufacturing – Boiling – Washing – Recycling, Sveriges Skogsindustriförbund, Markaryd, Sweden. (in Swedish)