Using Energy Information Services Strategically
60
Using Energy Information Services Strategically ENERGY STAR Monthly Partner Web Conference July 26, 2006 Call-in Number: 1-866-299-3188 Conference Code: 202 343 9965
Transcript of Using Energy Information Services Strategically

Using Energy Information Services Strategically
ENERGY STAR Monthly Partner Web Conference
July 26, 2006Call-in Number: 1-866-299-3188Conference Code: 202 343 9965

About The Web Conferences
• Monthly
• Topics are structured on a strategic approach to energy management
• Opportunity to share ideas with others
• Slides are a starting point for discussion
• Open & Interactive
• Supports the ENERGY STAR Challenge to build a better world, 10% at time

Web Conference Tips
• Mute phone when listening! Improves soundquality for everyone.Use * 6 – to mute and # 6 to un-mute
• Hold & Music – If your phone system has music-on-hold, please don’t put the webconference on hold!
• Presentation slides will be sent by email to all participants following the web conference.

Today’s Web Conference
“Information is power” Timely and high quality energy information is more important
than ever.
Need for greater accountability for energy use at site and sub-site levels increasing.
But…
Getting good site data can be a challenge
Organizing, analyzing and communicating energy informationcan be time consuming.

Today’s Web Conference
Presenters: • Richard Beam - Providence Health and Services
• Philip Kercher - Sacred Heart Medical Center • Ed Schlect – Advantage IQ
• John Schinter - Jones Lang LaSalle • Barry Abramson - Servidyne Systems, LLC

Using Energy Information Services Strategically ENERGY STAR® Web Networking Session
July 26, 2006

Using Energy Information Services Strategically ENERGY STAR® Web Networking Session –July 26, 2006
� Richard Beam � Corporate Director for Energy Management � Providence Health & Services
� Philip Kercher, FASHE � Manager of Facilities � Sacred Heart Medical Center
� Ed Schlect, PE � VP Consulting Services � Advantage IQ, Inc.
2

Providence Health & Services
3

Providence Health & Services
Energy Management Vision
The Preferred Future Providence Health & Services’ energy management vision is to institutionalize energy management in to our Corporate policies and procedures to ensure that energy will be used efficiently throughout its facilities.
The Overall Purpose of Energy Management The purpose of Providence Health & Services’ energy management activities are to promote and sustain the efficient use of energy in keeping with our Core Values of Stewardship and Excellence.
4

Use of Natural Resources
� PHS spends over $60 million per year on energy consumption
– Natural gas, water, & electricity – Energy rates continue to increase (natural gas at double-digit)
� Effective energy programs can save 10-30% on these recurring and increasing costs
� Facilities are compared for energy efficiency using Facility IQ, an on-line Energy Information Service
5

Use of Natural Resources
� ENERGY STAR Program compares facility energy use to a national database of hospitals by area andservice type.
� PHS received ENERGY STAR Partner of the Year Award in 2004. Awarded 2004 Power Player award from Dept of Energy and Bonneville Power
� Providence Portland (2003), Seaside (2003), St. Vincent (2004), St. Peter Hospital (2003 & 2004), and Sacred Heart Medical Center (2003, 2005) have been awarded ENERGY STAR labels
� Ten office buildings pending label qualification
6

Overview of Energy Management Program (EMP) Proactive Leadership � Program actively seeks cost reduction measures system-wide. � National & regional program recognition
Success Stories � U.S. EPA named PHS its ENERGY
STAR Partner of the Year for 2004.� Richard Beam named 2003
Energy Manager of the Year for theOregon Association of ProfessionalEnergy Managers.
Providence Newberg Hospital Annual Energy Usage, kBtu/sf
0 20 40 60 80
100 120
Interi
orLi g
hts
PlugEqu
ipmen
t Proc
eata
ndRe
nn
ss h
g
mp W
He
eat
Coolin
HVACFa
s ad P
us
DH
kBtu
/sf
Code, 275 kBtu/sf Design, 203 kBtu/sf
26% Reduction in Energy Usage
� PHS NewbergEnergy Management Intervention
– 26% Reduction in Energy Usage – $178,000 in annual savings – $199,585 in grants
7
– $141,969 in tax credits – IRR of 88%
Before & After

About Advantage IQ, Inc…
We are the leading supplier of comprehensive facility intelligence and cost management services via FACILITY IQsm (our Web-based reporting tool). Our services are designed to provide multi-site companies with critical, yet easy-to-access information that enables them to reduce their facility-related expenses for utilities telecom and waste. Our reputation and experience in the industry is unrivaled, as evidenced by our client portfolio and our 95% retention rate. More information is available on our web site at www.advantageIQ.com
8

Advantage IQ, Inc. Corporate Overview
� We currently manage over $9.3B in expenses for 350+ clients
� In the last two years, we have saved our clients more than $85 million in expenses
� We currently process and pay over 500,000 bills/month supporting over 190,000 sites nationwide
� We are a complete solution—Our management services include electricity, natural gas, water/sewer, waste, and telecom expenses
� Our state of the art facility in Spokane, WA employs 350+ people, housed in a 70,000 square foot office…incorporating a 24/7 secure data management center
� We are a profitable, wholly owned affiliate of Avista Corp. (AVA on the NYSE; $1.2B revenue)
9

Advantage IQ & ENERGY STAR
ENERGY STAR Partner of the Year 2005 and 2006 � Handled more than 90% of all
automated building ratings during 2005 � Over 10x the total volume in total
buildings rated of any other ENERGY STAR partner
Advantage IQ’s scope with PH&S � Full Energy Information Management for
230 locations� Web-based reporting across 5 portfolios � ENERGY STAR automated
benchmarking� Utility and telecom services
10

11

Energy Management at PH&S Before Energy Information Services
� Energy “managed” at the site level
� Data collection manual and sporadic
� No portfolio strategy
� No central database
� Projects prioritized by access, not value
� Budget nightmares
12

Energy Management at PH&S After Energy Information Services
� Central repository of data began in 1998
� Data collection consistent
� Baseline for Corporate program established
� Allowed expansion across business units
� Enabled project identification and prioritization to best corporate value
� Budget and Supply management simplified and centralized
13

Energy Management at PH&S After Energy Information Services � ENERGY STAR ratings accelerated corporate
commitment… � Results quantified in 2003 � POY award wins internally!
– Result: $60MMallocation available for20% ROI projects
– New Corporate Energy Manager role
–Organization began to value energy differently…
14

Valuing An Energy Dollar Saved
It could take up to $50 in revenue to obtain the same $1 in margin contribution. The chart shows how much revenue is needed to have the same bottom line impact as $50,000 in operating cost savings given our different hospital net operating margins.
15

Expanding the EIS Program across Multiple Business Units
� Additional business units agreed to participate based on documented results
� Energy Information and ENERGY STAR became BEST PRACTICES
16

Portfolio results: selection of best sites for retrofit � Review of energy intensity in Facility IQ to rank sites
– Confirmed by ENERGY STAR scores � Region had 3 sites at bottom of the list
– Led to $4.5MM retrofit at 2 sites � Upgrade process
– Corporate funding commitment – Investment grade energy audit – Projects now under way…
17

Portfolio Results: New site in Newberg, OR
� First greenfield project for PH&S in 35 years –Replacing another hospital
� Used ENERGY STAR target finder to predict design ENERGY STAR score � Facility IQ is providing information services to:
–track performance vs. model –feed data to ENERGY STAR –and provide support the LEED application process
18

Portfolio Results:
19
Sacred Heart Hospital, Spokane WA

Sacred Heart Hospital, Spokane WA
� 2.08 Million Square feet � ENERGY STAR label earned 2003, 2005 � Building profile available at http://
www.energystar.gov under ‘find labeled buildings’ � Goal: reduce consumption 5% per year � …and we’re on track!
20

Sacred Heart Hospital, Spokane WA � Strategies:
– Regional team sharing best practices
– Energy Information Services provide benchmarking and trend reporting
– Key project implementation – Quarterly reviews…continuous improvement!
� Benefits: – Corporate support – Senior Management visibility and credibility – Personal ownership in facility results
21

Sacred Heart Hospital, Trend Reporting
22

Sacred Heart Hospital, Trend Reporting
23

Energy Information Services Provide
A solid foundation � Data integrity � Accurate baseline measurement � Effective prioritization
Management tools for a large portfolio � Site to site comparisons � Ongoing trend analysis
A platform to communicate � Financial messaging � Overall performance management
…and accessible 24/7…from anywhere in the company
24

You Have Two Patients….
“Providence Health & Services has two patients—the medical patient and the earth. To heal one without the other will not last.”
--Janine Benyus
(author of book, Biomimicry – Innovation Inspired by Nature in conversation with Richard Beam at the 2005 Inland NW Sustainability Conference, Boise, Idaho)
25
Providence is making it happen in environmental stewardship, with Energy Information Services as a program foundation.
26

Using EnergyUsing Energy Information ServicesInformation Services StrategicallyStrategically
JohnJohn SchinterSchinter, P.E., P.E. Barry Abramson, P.E.Barry Abramson, P.E.Director, Global Energy ServicesDirector, Global Energy Services Senior Vice PresidentSenior Vice PresidentEngineering and OperationsEngineering and Operations
ServidyneServidyneJones Lang LaSalleJones Lang LaSalle
July 26, 2006 1 1

AgendaAgenda
�� JLL and Servidyne IntroductionJLL and Servidyne Introduction�� Levels of Energy InformationLevels of Energy Information�� Portfolio BenchmarkingPortfolio Benchmarking�� Tracking and ReportingTracking and Reporting�� ConclusionConclusion
2 2

JLL Portfolio DescriptionJLL Portfolio Description
�� The worldThe world’’s leading real estates leading real estate management firm, operating inmanagement firm, operating in 50 countries.50 countries.
�� Includes a Real Estate portfolioIncludes a Real Estate portfolio of approximately 902 millionof approximately 902 million square feet undersquare feet under management worldwide.management worldwide.
3 3

JLL Energy StrategyJLL Energy Strategy
�� Jones Lang LaSalle is committed toJones Lang LaSalle is committed to energy management leadership thatenergy management leadership that supports sustainable globalsupports sustainable global environmental objectives, whileenvironmental objectives, while achieving the lowest reasonableachieving the lowest reasonable operating expense.operating expense.
4 4

Servidyne OverviewServidyne Overview“Your Building Performance Expert”
Servidyne has over 30 years of experience in optimizing facility performance at every stage of the building lifecycle. Our customers view us as building performance experts, key to their efforts to maximize the value of their portfolios.
5 5

Levels of Energy InformationLevels of Energy Information
�� Invoice DataInvoice Data–– Bill processing and payment, bill auditingBill processing and payment, bill auditing–– Portfolio data aggregationPortfolio data aggregation
�� Benchmarking/Performance TrackingBenchmarking/Performance Tracking–– Portfolio Comparison AnalysisPortfolio Comparison Analysis–– Reporting of Key Performance MetricsReporting of Key Performance Metrics
�� Interval/Meter DataInterval/Meter Data–– ““RealReal--TimeTime”” Trend and Load Profile AnalysisTrend and Load Profile Analysis–– Automated ResponseAutomated Response
6 6

77
Levels of Energy InformationLevels of Energy Information
�� The Dilemma: Not Enough Detail orThe Dilemma: Not Enough Detail or Too Much DetailToo Much Detail
• Cost
• Time
• Complexity

88
Levels of Energy InformationLevels of Energy Information
�� Invoice DataInvoice Data–– Bill processing and payment, bill auditingBill processing and payment, bill auditing–– Portfolio data aggregationPortfolio data aggregation
�� Benchmarking/Performance TrackingBenchmarking/Performance Tracking–– Portfolio Comparison AnalysisPortfolio Comparison Analysis–– Reporting of Key Performance MetricsReporting of Key Performance Metrics
�� Interval/Meter DataInterval/Meter Data–– ““RealReal--TimeTime”” Trend and Load Profile AnalysisTrend and Load Profile Analysis–– Automated ResponseAutomated Response

Portfolio BenchmarkingPortfolio Benchmarking
�� Cost per Sq. Ft.Cost per Sq. Ft.�� Energy Usage per Sq. Ft.Energy Usage per Sq. Ft.�� ENERGY STARENERGY STAR®® RatingRating�� Energy Performance TargetEnergy Performance Target
9 9

1010
Cost/SF BenchmarkingCost/SF Benchmarking
$0.00
$1.00
$2.00
$3.00
$4.00
$5.00
$6.00
$7.00
$/RSF/Yr

1111
BTU/SF BenchmarkingBTU/SF Benchmarking
0
50
100
150
200
250
300
KBTU/RSF/Yr

1212
ENERGY STARENERGY STAR®® BenchmarkingBenchmarking
0
10
20
30
40
50
60
70
80
90
ENERGY STAR Rating

Portfolio BenchmarkingPortfolio Benchmarking
�� Cost per Sq. Ft.Cost per Sq. Ft. –– Very LimitedVery Limited�� Energy Usage per Sq. Ft.Energy Usage per Sq. Ft. –– LimitedLimited�� ENERGY STAR RatingENERGY STAR Rating
–– Assessment of Where You AreAssessment of Where You Are�� Energy Performance TargetEnergy Performance Target
–– Assessment of Where You Could/Should BeAssessment of Where You Could/Should Be–– Identifies Savings PotentialIdentifies Savings Potential
13 13
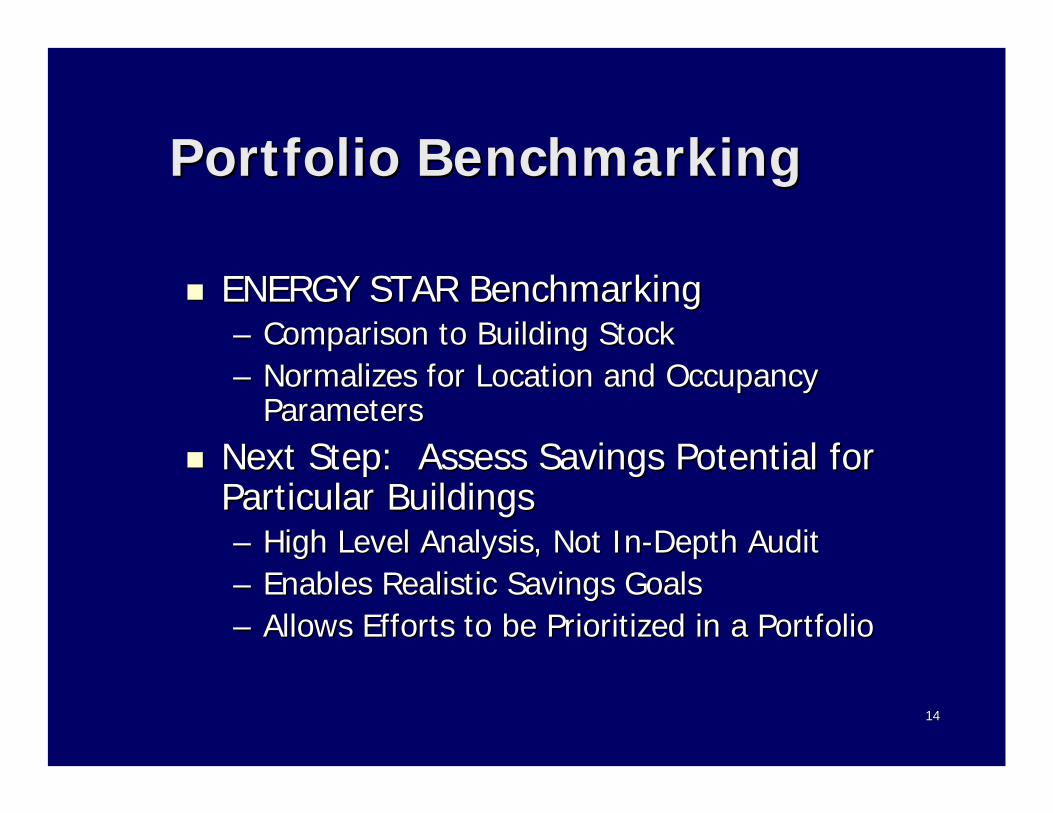
Portfolio BenchmarkingPortfolio Benchmarking
�� ENERGY STAR BenchmarkingENERGY STAR Benchmarking–– Comparison to Building StockComparison to Building Stock–– Normalizes for Location and OccupancyNormalizes for Location and Occupancy
ParametersParameters�� Next Step: Assess Savings Potential forNext Step: Assess Savings Potential for
Particular BuildingsParticular Buildings–– High Level Analysis, Not InHigh Level Analysis, Not In--Depth AuditDepth Audit–– Enables Realistic Savings GoalsEnables Realistic Savings Goals–– Allows Efforts to be Prioritized in a PortfolioAllows Efforts to be Prioritized in a Portfolio
14 14

Portfolio BenchmarkingPortfolio Benchmarking
�� Energy Performance BenchmarkingEnergy Performance Benchmarking–– Normalizes for Location, Occupancy ParametersNormalizes for Location, Occupancy Parameters
and:and:–– Building GeometryBuilding Geometry–– Building EnvelopeBuilding Envelope–– Heating and Cooling Plant Types/CapacitiesHeating and Cooling Plant Types/Capacities–– Air Distribution System Configuration/CapacityAir Distribution System Configuration/Capacity
15 15

1616
Cost/SF BenchmarkingCost/SF Benchmarking
$0.00
$1.00
$2.00
$3.00
$4.00
$5.00
$6.00
$7.00
0%
10%
20%
30%
40%
50%
60%
$/RSF/Yr % Savings
$/RSF/Yr vs. Savings Potential

1717
BTU/SF BenchmarkingBTU/SF Benchmarking
0
50
100
150
200
250
300
0%
10%
20%
30%
40%
50%
60%
KBTU/RSF/Yr % Savings
KBTU/RSF/Yr vs. Savings Potential

1818
ENERGY STARENERGY STAR BenchmarkingBenchmarking
0
10
20
30
40
50
60
70
80
90
0%
10%
20%
30%
40%
50%
60%
ENERGY STAR Rating % Savings
ENERGY STAR Rating vs. Savings Potential

1919
Tracking and ReportingTracking and Reporting
�� High Level ReportsHigh Level Reports for Quick Overviewfor Quick Overview
�� Detail Reports toDetail Reports to Drill Down forDrill Down for ActionAction

Tracking and ReportingTracking and Reporting
�� Key Performance MetricsKey Performance Metrics–– Energy Usage vs. GoalEnergy Usage vs. Goal–– Year over Year Usage and CostsYear over Year Usage and Costs–– Actual Cost vs. BudgetActual Cost vs. Budget–– Weather and Occupancy VariancesWeather and Occupancy Variances–– Unit Cost TrendsUnit Cost Trends–– Distinct Cost Impacts from Rates andDistinct Cost Impacts from Rates and
UsageUsage20 20

2121
Portfolio/Region SummaryPortfolio/Region Summary

2222
Portfolio/Region Yr over YrPortfolio/Region Yr over Yr

2323
Building SummaryBuilding Summary

2424
Building DetailBuilding Detail

2525
ConclusionConclusion
ENERGY STARENERGY STARGuidelines for EnergyGuidelines for Energy ManagementManagement

Questions & Discussion

Announcements
Summer Energy Savings ideas and guidance – on the web – www.energystar.gov/buildings – www.energystar.gov/industry
Take the ENERGY STAR Challenge- www.energystar.gov/challenge

Upcoming Web Conferences
August 16 – State-of-the-art Sub Metering
September 20 – Remote Monitoring and Control System
October 19 – Energy and Climate Risk Management
Download past web conference presentations at: www.energystar.gov/networking
Questions or comments? Contact: [email protected]

Thank You!