Using Differential Item Functioning Analyses to Enhance the Curriculum Dr Juho Looveer ACSPRIISydney...
35
Using Differential Item Using Differential Item Functioning Analyses to Functioning Analyses to Enhance the Curriculum Enhance the Curriculum Dr Juho Looveer Dr Juho Looveer ACSPRII ACSPRII Sydney Sydney December 2006 December 2006
-
Upload
jocelin-mckinney -
Category
Documents
-
view
217 -
download
0
Transcript of Using Differential Item Functioning Analyses to Enhance the Curriculum Dr Juho Looveer ACSPRIISydney...
Using Differential Item Using Differential Item
Functioning Analyses to Functioning Analyses to
Enhance the CurriculumEnhance the Curriculum
Dr Juho LooveerDr Juho Looveer
ACSPRIIACSPRIISydneySydneyDecember 2006December 2006
Using Modern Psychometric TheoryUsing Modern Psychometric Theoryto Identify Differential Item Functioningto Identify Differential Item Functioningin Polytomously Scoredin Polytomously ScoredConstructed Response ItemsConstructed Response Items
Linking Results from Differential Item Functioning Linking Results from Differential Item Functioning Analyses to the CurriculumAnalyses to the Curriculum
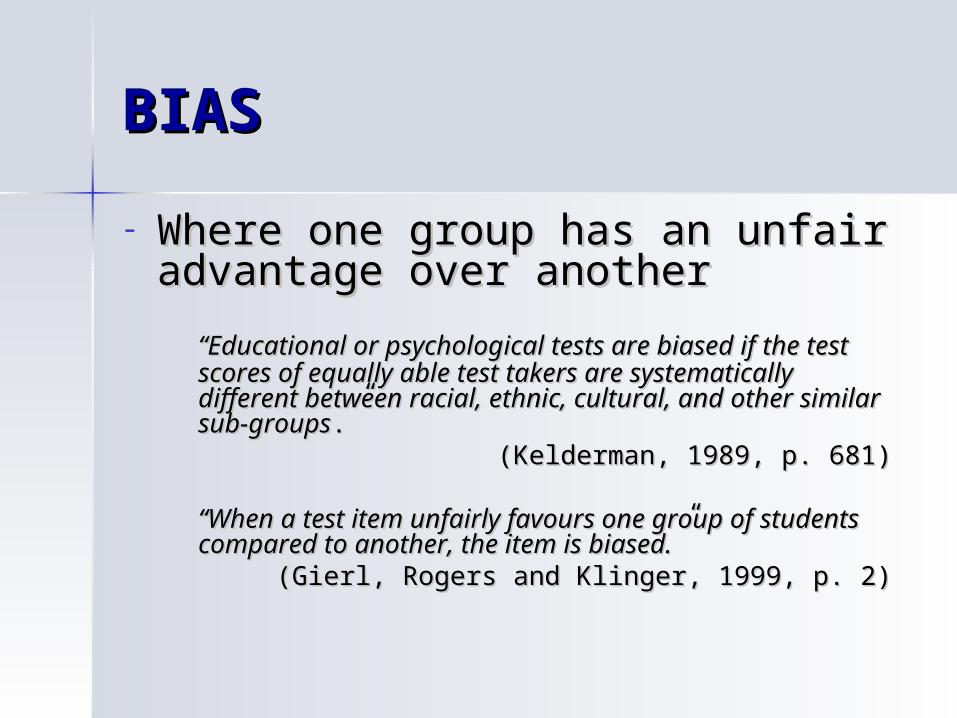
BIASBIAS
- Where one group has an unfair Where one group has an unfair advantage over anotheradvantage over another
““Educational or psychological tests are biased if Educational or psychological tests are biased if the test scores of equally able test takers are the test scores of equally able test takers are systematically different between racial, ethnic, systematically different between racial, ethnic, cultural, and other similar sub-groupscultural, and other similar sub-groups.”.”
(Kelderman, 1989, p. 681)(Kelderman, 1989, p. 681)
““When a test item unfairly favours one group of When a test item unfairly favours one group of students compared to another, the item is biased.students compared to another, the item is biased.””
(Gierl, Rogers and Klinger, 1999, p. 2)(Gierl, Rogers and Klinger, 1999, p. 2)
ImpactImpact
- Where one group performs Where one group performs differently than another groupdifferently than another group
““a between-group difference in test a between-group difference in test performance caused by group ability performance caused by group ability differences on the valid skill (e.g., the differences on the valid skill (e.g., the differences between the proportion correct differences between the proportion correct for two groups of interest on a valid item).for two groups of interest on a valid item).
(Ackerman, 1994, p. 109)(Ackerman, 1994, p. 109)

Differential Differential FunctioningFunctioning
- Differential Item Functioning (DIF)- Differential Item Functioning (DIF)
““When persons from one group answer an item When persons from one group answer an item correctly more often than equally knowledgeable correctly more often than equally knowledgeable
persons from another group, the item exhibits DIF.”persons from another group, the item exhibits DIF.” (Ackerman, 1994, p. 142)(Ackerman, 1994, p. 142)
““DIF refers to differences in item functioning after DIF refers to differences in item functioning after groups have been matched with respect to the groups have been matched with respect to the ability or attribute that the item purportedly ability or attribute that the item purportedly measures.”measures.”
(Dorans and Holland, 1993, p. 37 )(Dorans and Holland, 1993, p. 37 )
Previous Methodology Previous Methodology (1)
Test LevelTest Level– Comparing Group MeansComparing Group Means– Meta AnalysesMeta Analyses
Item LevelItem Level– CorrelationsCorrelations– ANOVAANOVA– Factor AnalysesFactor Analyses– Other multivariate techniquesOther multivariate techniques
Most studies were based on unmatched samplesMost studies were based on unmatched samples
Previous Methodology Previous Methodology (2)
Item Level with matched samplesItem Level with matched samples– Transformed Item Difficulty Index (TID-Transformed Item Difficulty Index (TID-
DIF)DIF)- Angoff 1972; 1982)- Angoff 1972; 1982)
– Contingency Table methodsContingency Table methods- eg Standardisation Method (Dorans & Kulick, - eg Standardisation Method (Dorans & Kulick,
1986)1986)
– Chi-Square methodsChi-Square methods- eg Mantel-Haenszel (Holland-Thayer, 1988)- eg Mantel-Haenszel (Holland-Thayer, 1988)
– Logistic RegressionLogistic Regression
Previous Methodology Previous Methodology (3)
Previous methods used the simple sum of Previous methods used the simple sum of scores as a measure of ability. scores as a measure of ability.
With classical test theory . . .With classical test theory . . . ““. . . perhaps the most important shortcoming is that . . . perhaps the most important shortcoming is that examinee characteristics and test characteristics examinee characteristics and test characteristics cannot be separated: each can be interpreted only in cannot be separated: each can be interpreted only in the context of the otherthe context of the other. “. “
(Hambleton, Swaminathan and Rogers, 1991, p. 2)(Hambleton, Swaminathan and Rogers, 1991, p. 2)
The results from one test can not be directly compared The results from one test can not be directly compared to the results from another test or another group of to the results from another test or another group of examinees.examinees.
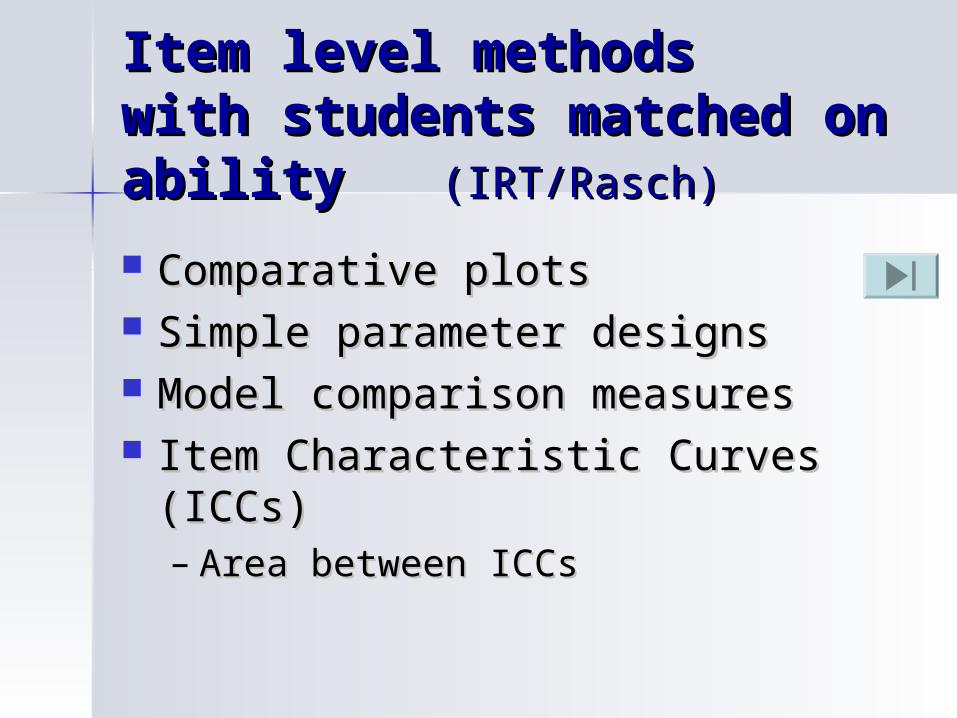
Item level methods Item level methods with students matched with students matched on ability on ability (IRT/Rasch)(IRT/Rasch)
Comparative plotsComparative plots Simple parameter designsSimple parameter designs Model comparison measuresModel comparison measures Item Characteristic Curves (ICCs)Item Characteristic Curves (ICCs)
– Area between ICCsArea between ICCs

Methods for Identifying Methods for Identifying DIF DIF in Polytomous Itemsin Polytomous Items Group means (Garner & Engelhard, 1999); Group means (Garner & Engelhard, 1999); Standardised mean differences, correlations and covariance Standardised mean differences, correlations and covariance
analyses (Pomplun and Capps, 1999); analyses (Pomplun and Capps, 1999); Factor analysis (Wang, 1998); Factor analysis (Wang, 1998); Logistic discriminant function analysis (Hamilton & Snow, 1998; Logistic discriminant function analysis (Hamilton & Snow, 1998;
Miller & Spray, 1993); Miller & Spray, 1993); Polynomial loglinear model (Hanson & Feinstein, 1997); Polynomial loglinear model (Hanson & Feinstein, 1997); Mantel-Haenszel test and the generalised Mantel-Haenszel test Mantel-Haenszel test and the generalised Mantel-Haenszel test
(Cohen, Kim, & Wollack, 1998; Hamilton & Snow, 1998; Henderson, (Cohen, Kim, & Wollack, 1998; Hamilton & Snow, 1998; Henderson, 2001); 2001);
Lord’s (1980) Chi-Square test (Cohen, Kim, & Wollack, 1998); Lord’s (1980) Chi-Square test (Cohen, Kim, & Wollack, 1998); likelihood ratio test (Cohen, Kim, & Wollack, 1998; Kim, Cohen, Di likelihood ratio test (Cohen, Kim, & Wollack, 1998; Kim, Cohen, Di
Stefano & Kim, 1998); Stefano & Kim, 1998); Separate calibration and comparative plots, and between-fit (Smith, Separate calibration and comparative plots, and between-fit (Smith,
1994; Smith 1996);1994; Smith 1996); Poly-SIBTEST (Chang, Mazzeo & Roussos, 1996; Henderson, 2001; Poly-SIBTEST (Chang, Mazzeo & Roussos, 1996; Henderson, 2001;
Zwick, Theyer & Mazzeo, 1997); andZwick, Theyer & Mazzeo, 1997); and Raju’s (1988; 1990) signed and unsigned area tests. Raju’s (1988; 1990) signed and unsigned area tests.
Using RUMM to Identify Using RUMM to Identify DIF DIF
in Polytomous Itemsin Polytomous Items (1)(1)
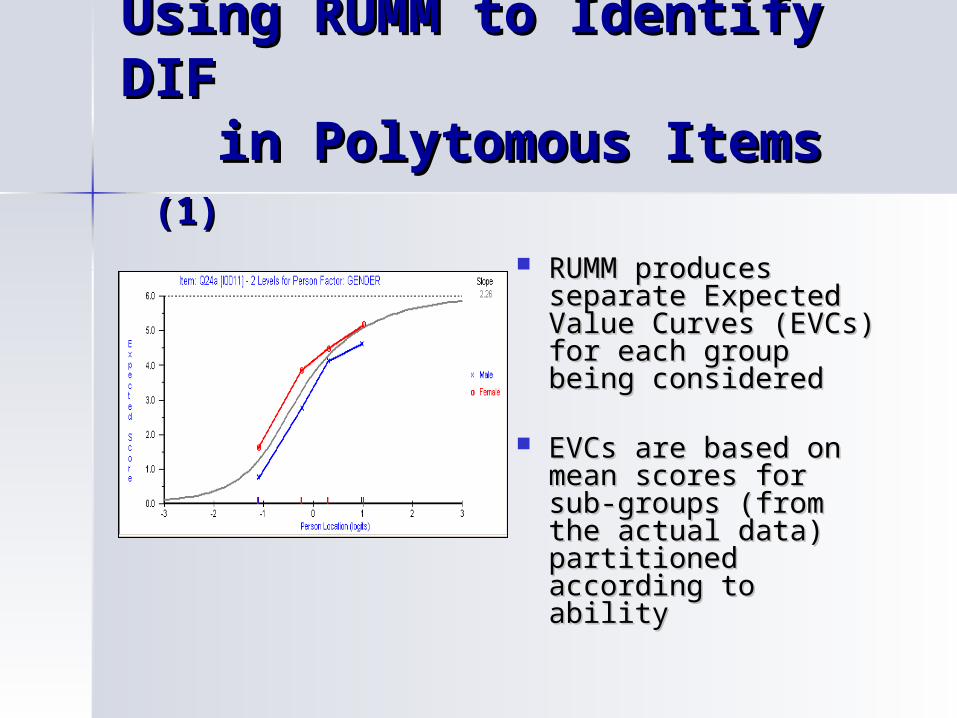
RUMM produces RUMM produces separate Expected separate Expected Value Curves (EVCs) Value Curves (EVCs) for each group for each group being consideredbeing considered
EVCs are based on EVCs are based on mean scores for mean scores for sub-groups (from sub-groups (from the actual data) the actual data) partitioned partitioned according to abilityaccording to ability
Using RUMM to Identify Using RUMM to Identify DIF DIF
in Polytomous Itemsin Polytomous Items (2)(2)
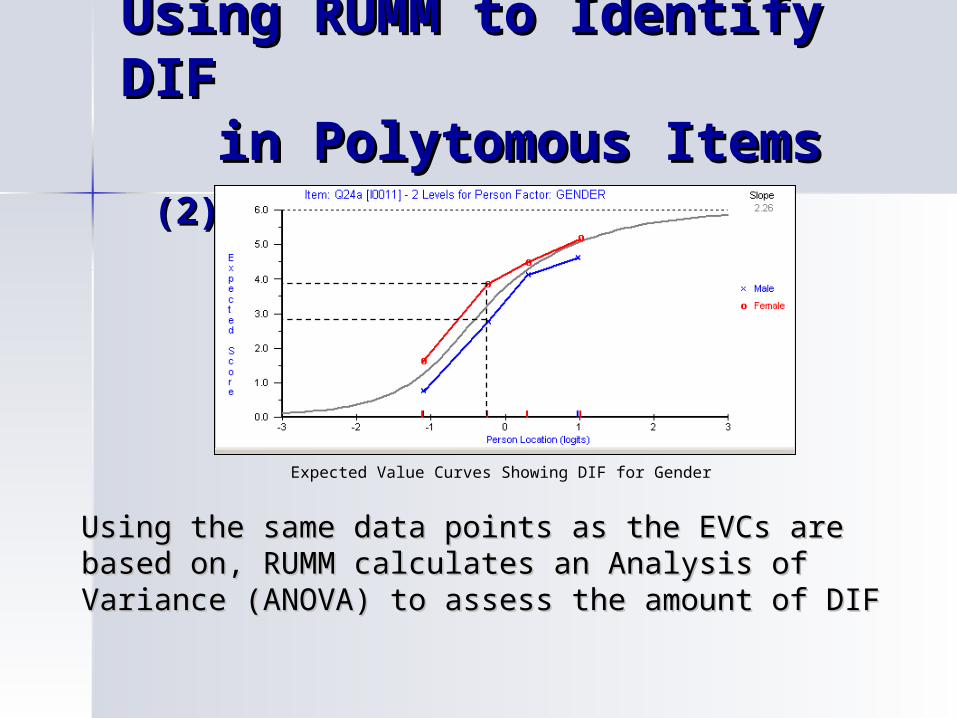
Expected Value Curves Showing DIF for Gender
Using the same data points as the EVCs are based Using the same data points as the EVCs are based on, RUMM calculates an Analysis of Variance on, RUMM calculates an Analysis of Variance (ANOVA) to assess the amount of DIF(ANOVA) to assess the amount of DIF
Using RUMM to Identify Using RUMM to Identify DIF DIF
in Polytomous Itemsin Polytomous Items (3)(3)
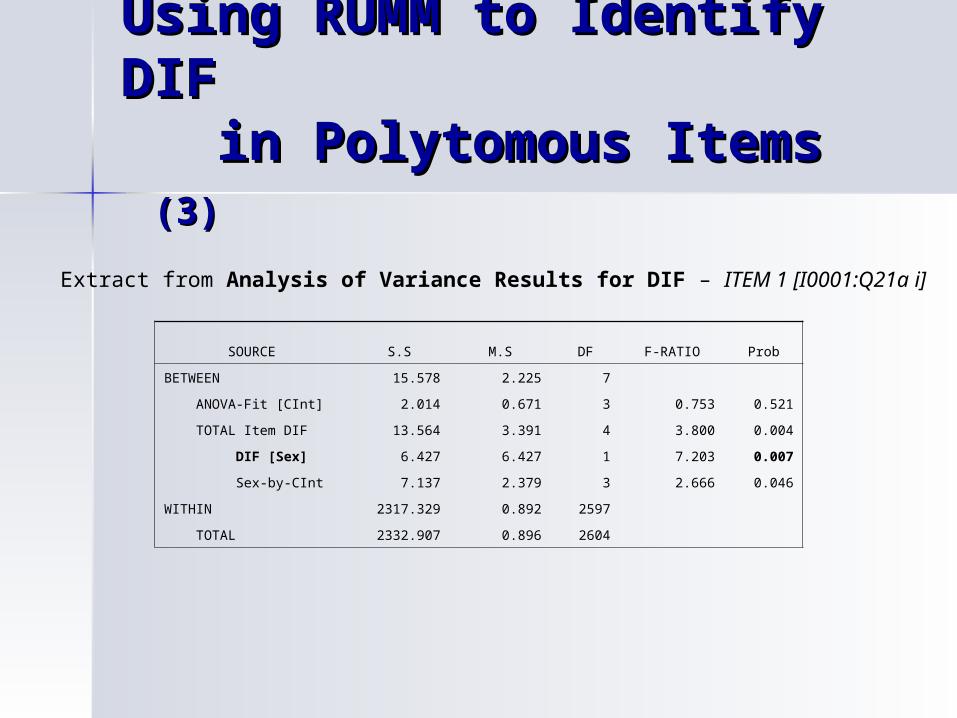
Extract from Analysis of Variance Results for DIF – ITEM 1 [I0001:Q21a i]
SOURCE S.S M.S DF F-RATIO Prob
BETWEEN 15.578 2.225 7
ANOVA-Fit [CInt] 2.014 0.671 3 0.753 0.521
TOTAL Item DIF 13.564 3.391 4 3.800 0.004
DIF [Sex] 6.427 6.427 1 7.203 0.007
Sex-by-CInt 7.137 2.379 3 2.666 0.046
WITHIN 2317.329 0.892 2597
TOTAL 2332.907 0.896 2604
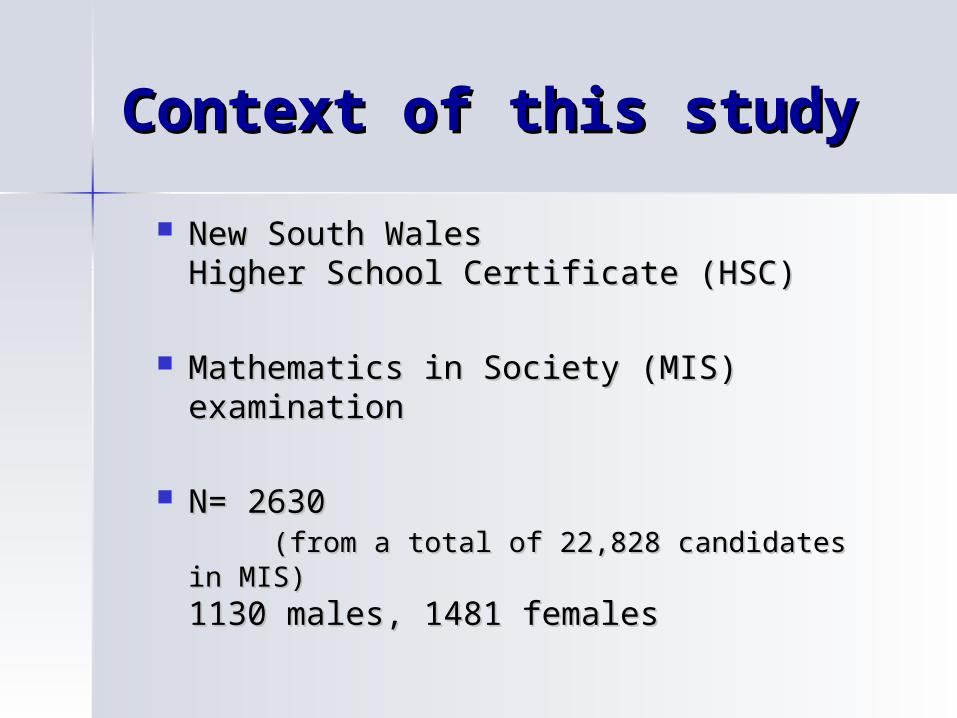
Context of this studyContext of this study
New South WalesNew South WalesHigher School Certificate (HSC)Higher School Certificate (HSC)
Mathematics in Society (MIS) Mathematics in Society (MIS) examinationexamination
N= 2630 N= 2630 (from a total of 22,828 candidates in MIS)(from a total of 22,828 candidates in MIS)
1130 males, 1481 females1130 males, 1481 females
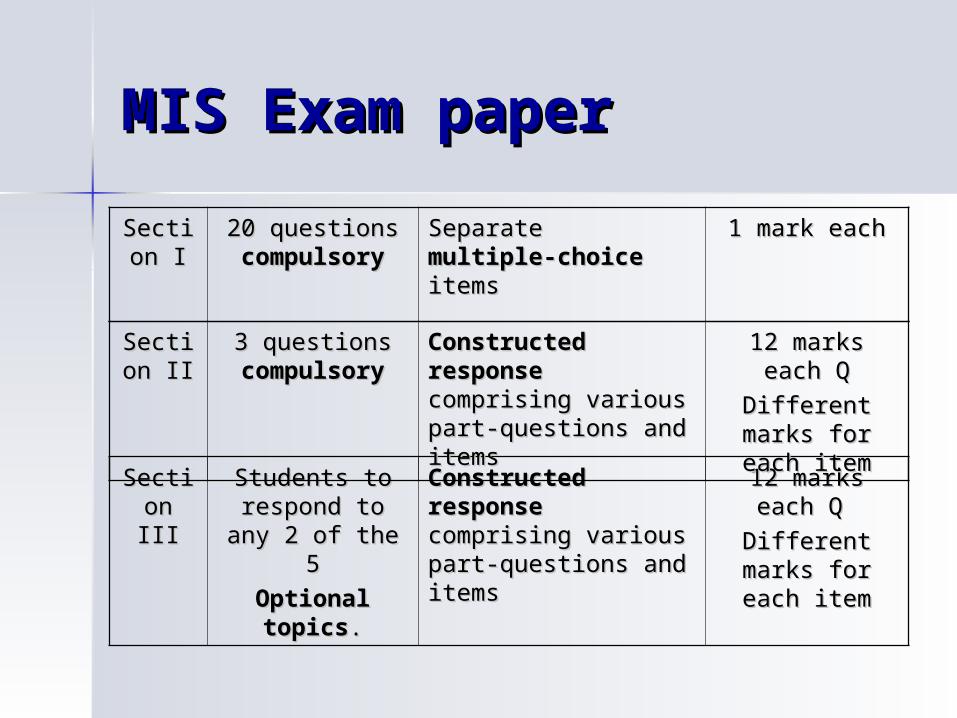
MIS Exam paperMIS Exam paper
SectioSection In I
20 questions 20 questions compulsorycompulsory
Separate Separate multiple-choicemultiple-choice itemsitems
1 mark each1 mark each
SectioSection IIIn III
Students to Students to respond to any respond to any
2 of the 52 of the 5
Optional Optional topicstopics..
Constructed Constructed responseresponsecomprising various comprising various part-questions and part-questions and itemsitems
12 marks each 12 marks each Q Q
Different Different marks for each marks for each
itemitem
SectioSection IIn II
3 questions 3 questions compulsorycompulsory
Constructed Constructed responseresponsecomprising various comprising various part-questions and part-questions and itemsitems
12 marks each 12 marks each QQ
Different Different marks for each marks for each
itemitem
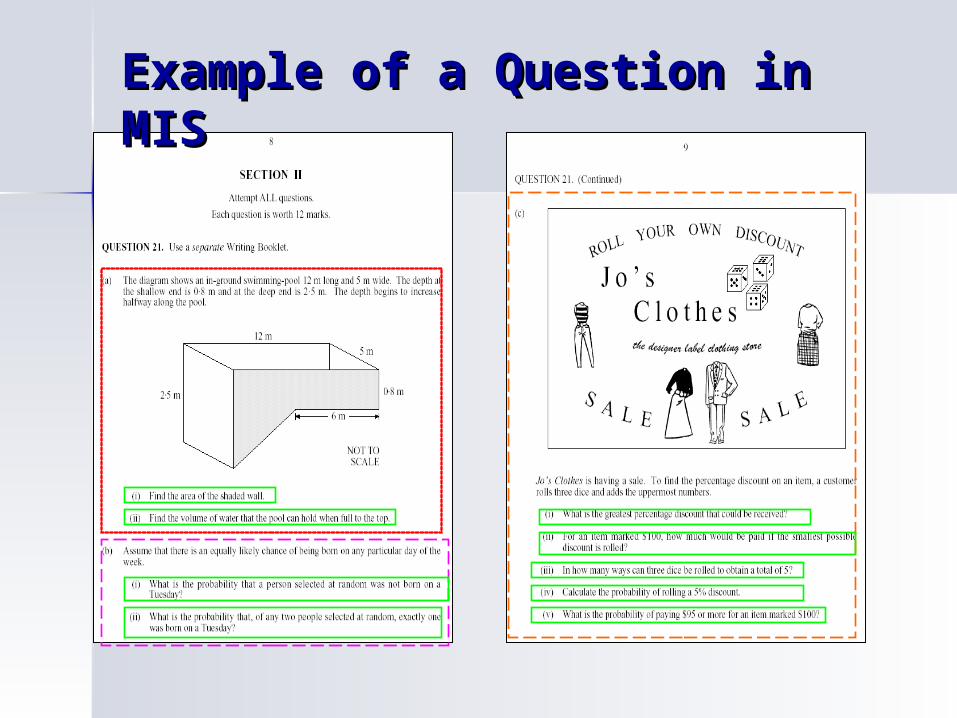
Example of a Question in Example of a Question in MISMIS
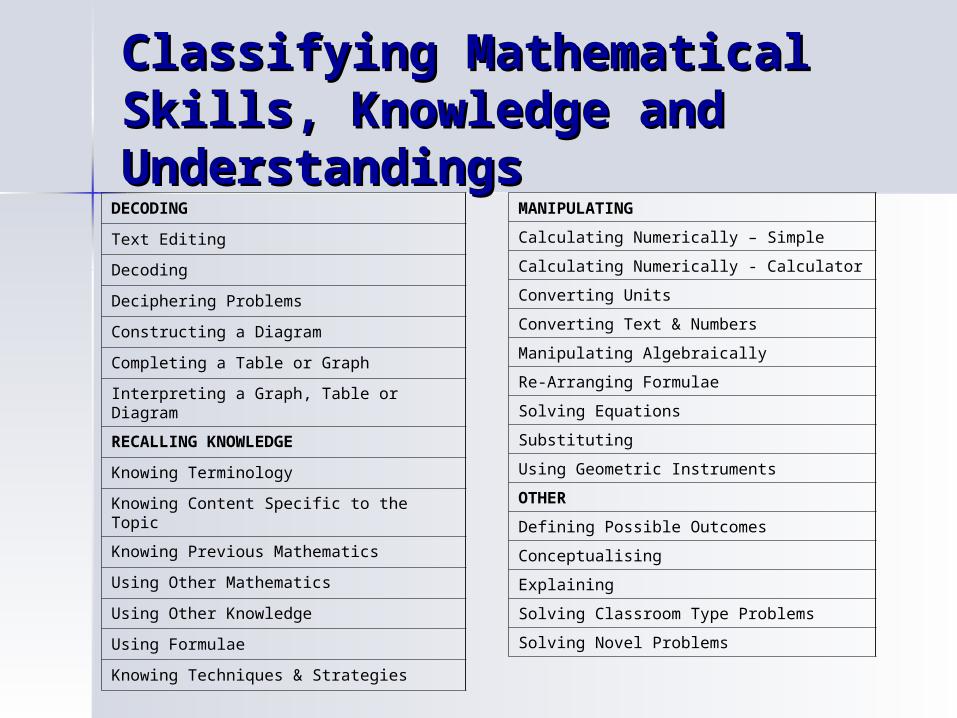
Classifying Mathematical Classifying Mathematical Skills, Knowledge and Skills, Knowledge and UnderstandingsUnderstandings
MANIPULATING
Calculating Numerically – Simple
Calculating Numerically - Calculator
Converting Units
Converting Text & Numbers
Manipulating Algebraically
Re-Arranging Formulae
Solving Equations
Substituting
Using Geometric Instruments
OTHER
Defining Possible Outcomes
Conceptualising
Explaining
Solving Classroom Type Problems
Solving Novel Problems
DECODING
Text Editing
Decoding
Deciphering Problems
Constructing a Diagram
Completing a Table or Graph
Interpreting a Graph, Table or Diagram
RECALLING KNOWLEDGE
Knowing Terminology
Knowing Content Specific to the Topic
Knowing Previous Mathematics
Using Other Mathematics
Using Other Knowledge
Using Formulae
Knowing Techniques & Strategies
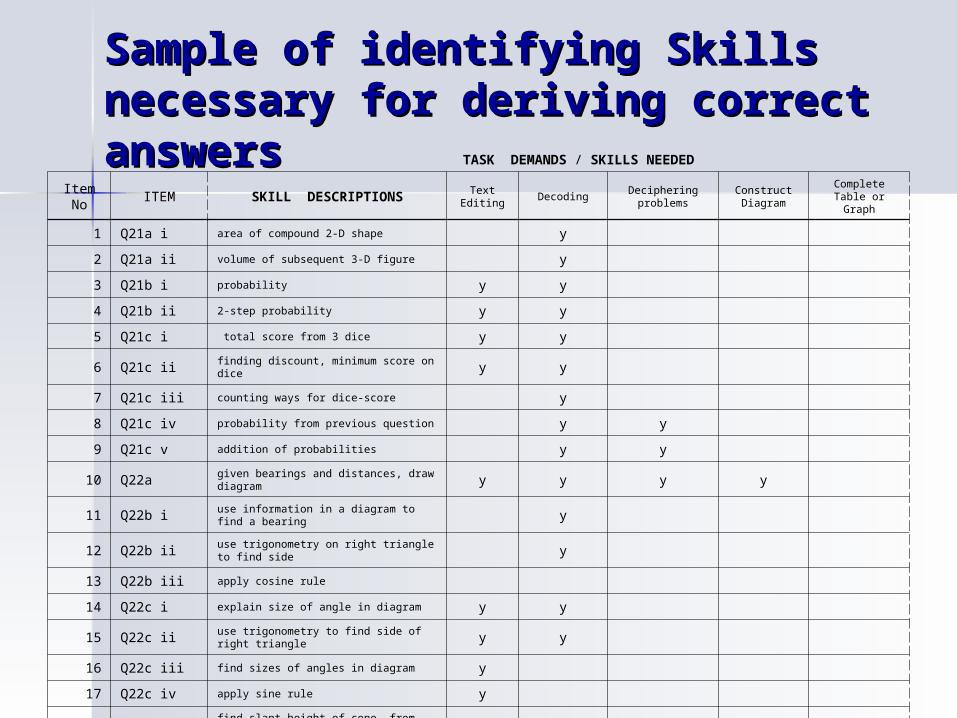
Sample of identifying Skills Sample of identifying Skills necessary for deriving correct necessary for deriving correct answersanswers TASK DEMANDS / SKILLS
NEEDED
Item No
ITEM SKILL DESCRIPTIONS Text Editing
DecodingDeciphering
problemsConstruct Diagram
Complete Table or Graph
1 Q21a i area of compound 2-D shape y
2 Q21a ii volume of subsequent 3-D figure y
3 Q21b i probability y y
4 Q21b ii 2-step probability y y
5 Q21c i total score from 3 dice y y
6 Q21c ii finding discount, minimum score on dice y y
7 Q21c iii counting ways for dice-score y
8 Q21c iv probability from previous question y y
9 Q21c v addition of probabilities y y
10 Q22a given bearings and distances, draw diagram y y y y
11 Q22b i use information in a diagram to find a bearing y
12 Q22b ii use trigonometry on right triangle to find side y
13 Q22b iii apply cosine rule
14 Q22c i explain size of angle in diagram y y
15 Q22c ii use trigonometry to find side of right triangle y y
16 Q22c iii find sizes of angles in diagram y
17 Q22c iv apply sine rule y
18 Q23a i find slant height of cone, from diagram
19 Q23a ii find curved surface area of cone
20 Q23b i use cumulative frequency graph to find median y
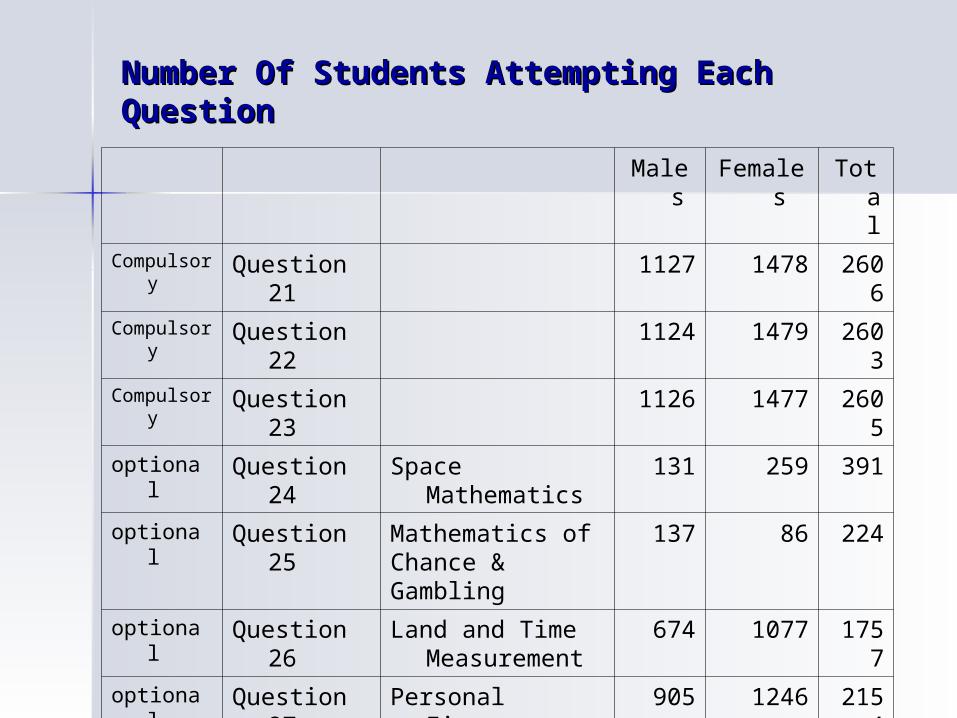
Number Of Students Attempting Each Number Of Students Attempting Each QuestionQuestion
Males Females
Total
Compulsory
Question 21
1127 1478 2606
Compulsory
Question 22
1124 1479 2603
Compulsory
Question 23
1126 1477 2605
optional Question 24
Space Mathematics
131 259 391
optional Question 25
Mathematics of Chance & Gambling
137 86 224
optional Question 26
Land and Time Measurement
674 1077 1757
optional Question 27
Personal Finance 905 1246 2154
optional Question 28
Mathematics in Construction
400 293 695
Overall numbers in sample 1127 1478 2606

Analyses of DataAnalyses of Data
Data for 71 items were analysed using Data for 71 items were analysed using RUMM 2010RUMM 2010
Item locations ranged from -2.909 to Item locations ranged from -2.909 to +2.246+2.246
9 Items showed poor fit to the model 9 Items showed poor fit to the model (based on residuals and chi-square (based on residuals and chi-square values)values)
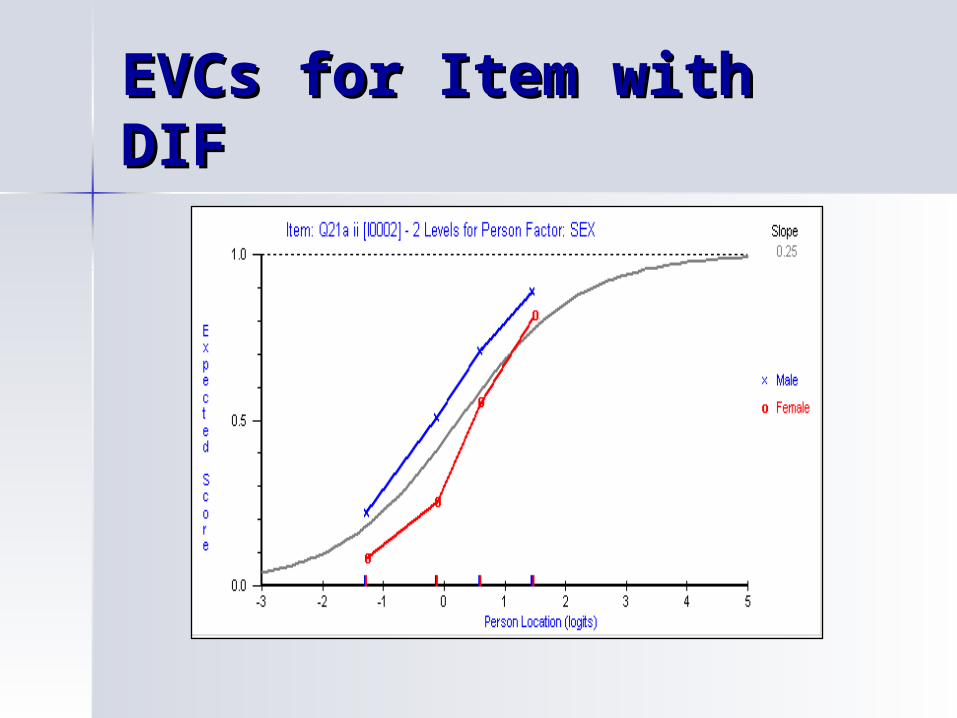
EVCs for Item with DIFEVCs for Item with DIF
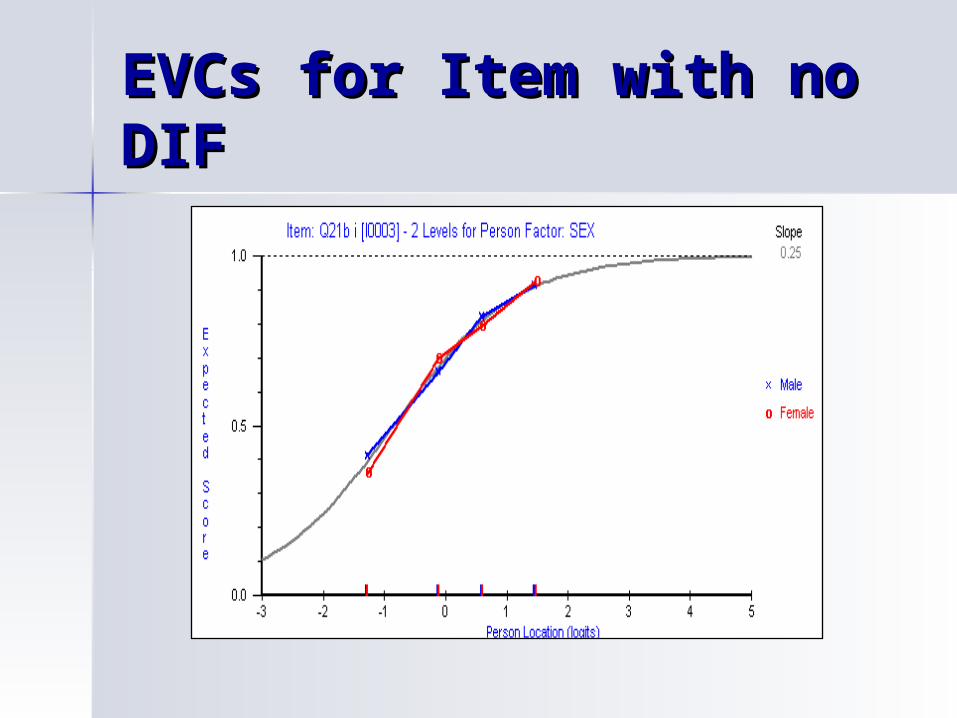
EVCs for Item with no EVCs for Item with no DIFDIF

Using EVCs to Using EVCs to understand Item understand Item FunctioningFunctioning (1)(1)
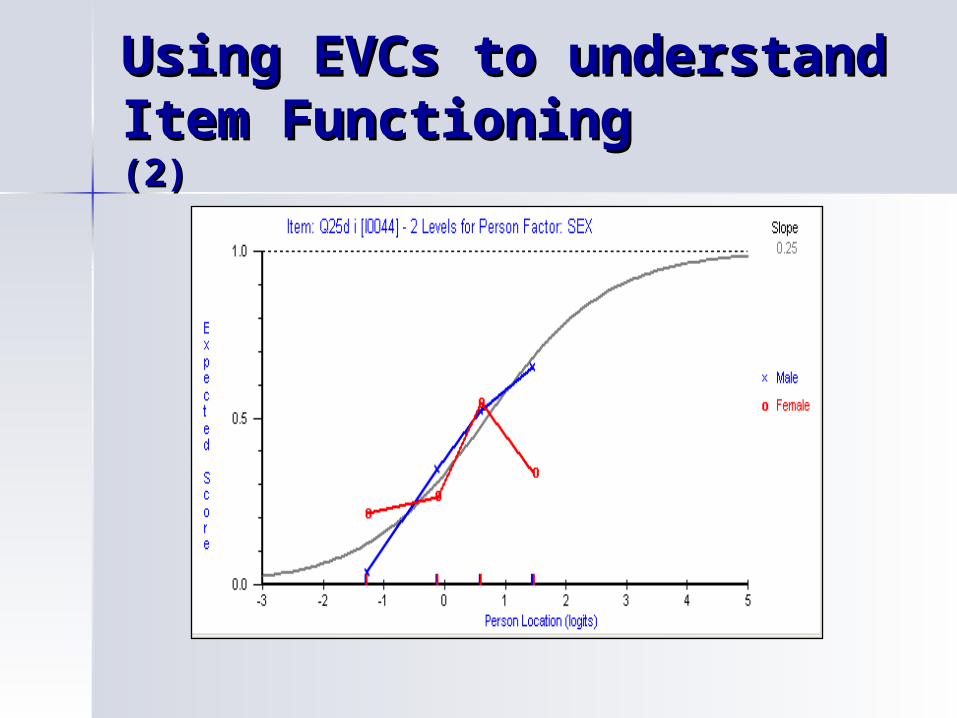
Using EVCs to Using EVCs to understand Item understand Item FunctioningFunctioning (2)(2)
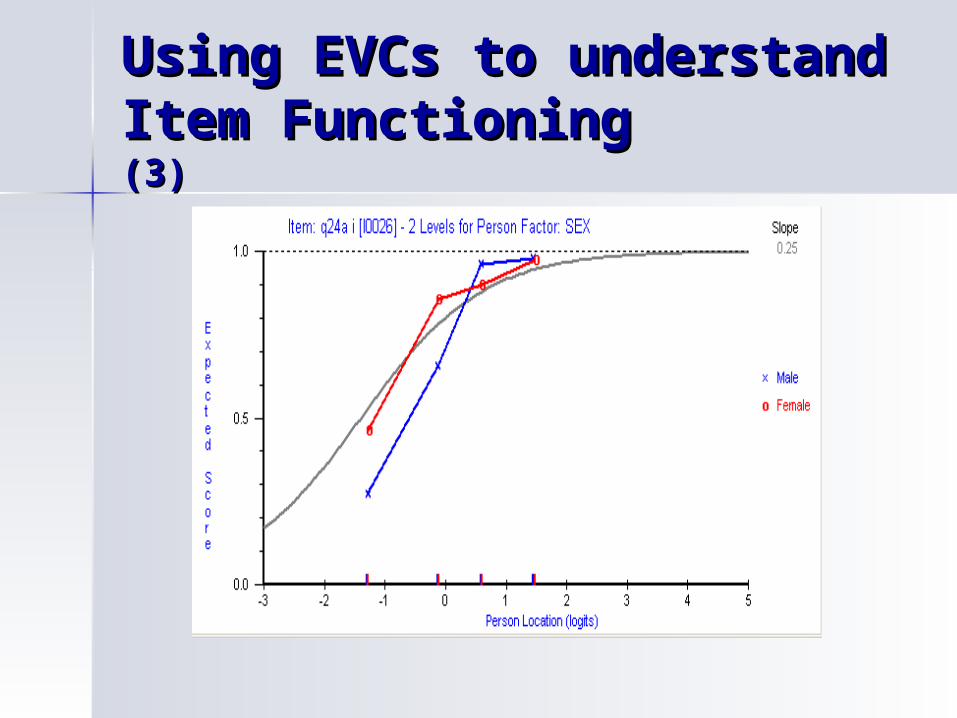
Using EVCs to Using EVCs to understand Item understand Item FunctioningFunctioning (3)(3)
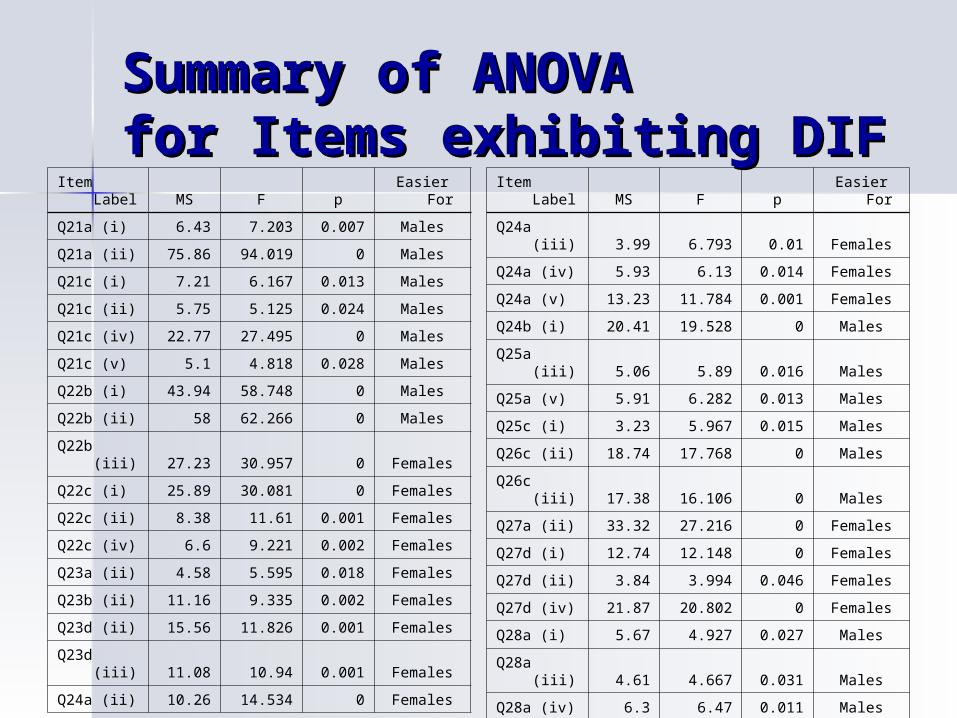
Summary of ANOVA Summary of ANOVA for Items exhibiting DIFfor Items exhibiting DIF
Item Label MS F p Easier For
Q21a (i) 6.43 7.203 0.007 Males
Q21a (ii) 75.86 94.019 0 Males
Q21c (i) 7.21 6.167 0.013 Males
Q21c (ii) 5.75 5.125 0.024 Males
Q21c (iv) 22.77 27.495 0 Males
Q21c (v) 5.1 4.818 0.028 Males
Q22b (i) 43.94 58.748 0 Males
Q22b (ii) 58 62.266 0 Males
Q22b (iii) 27.23 30.957 0 Females
Q22c (i) 25.89 30.081 0 Females
Q22c (ii) 8.38 11.61 0.001 Females
Q22c (iv) 6.6 9.221 0.002 Females
Q23a (ii) 4.58 5.595 0.018 Females
Q23b (ii) 11.16 9.335 0.002 Females
Q23d (ii) 15.56 11.826 0.001 Females
Q23d (iii) 11.08 10.94 0.001 Females
Q24a (ii) 10.26 14.534 0 Females
Item Label MS F p Easier For
Q24a (iii) 3.99 6.793 0.01 Females
Q24a (iv) 5.93 6.13 0.014 Females
Q24a (v) 13.23 11.784 0.001 Females
Q24b (i) 20.41 19.528 0 Males
Q25a (iii) 5.06 5.89 0.016 Males
Q25a (v) 5.91 6.282 0.013 Males
Q25c (i) 3.23 5.967 0.015 Males
Q26c (ii) 18.74 17.768 0 Males
Q26c (iii) 17.38 16.106 0 Males
Q27a (ii) 33.32 27.216 0 Females
Q27d (i) 12.74 12.148 0 Females
Q27d (ii) 3.84 3.994 0.046 Females
Q27d (iv) 21.87 20.802 0 Females
Q28a (i) 5.67 4.927 0.027 Males
Q28a (iii) 4.61 4.667 0.031 Males
Q28a (iv) 6.3 6.47 0.011 Males
Q28a (v) 4.78 4.56 0.033 Males
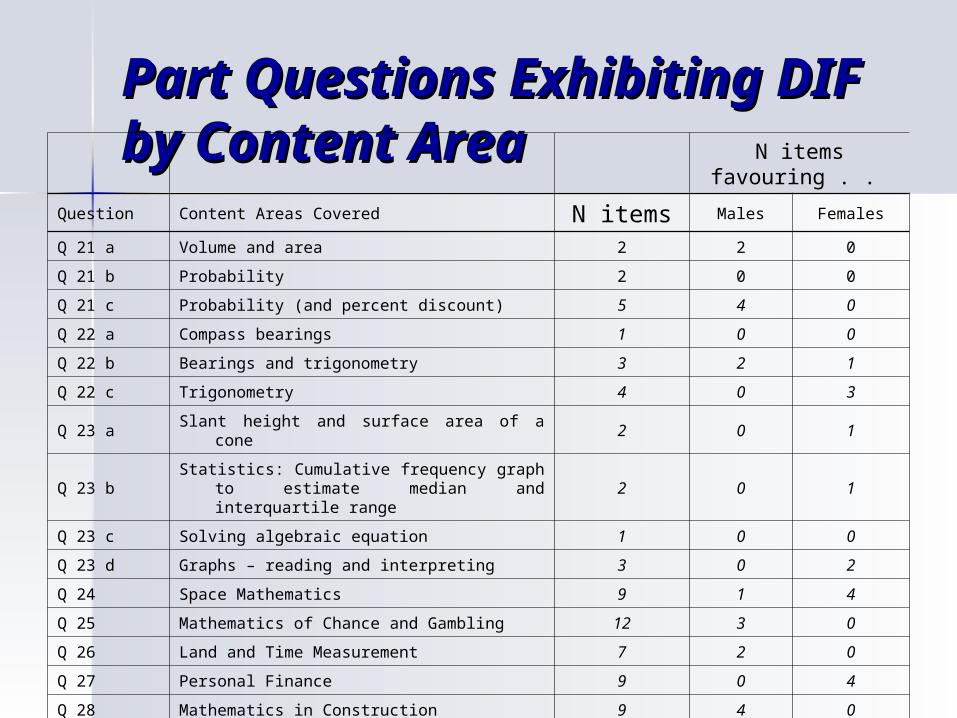
Part Questions Exhibiting Part Questions Exhibiting DIF by Content AreaDIF by Content Area N items
favouring . .
Question Content Areas Covered N items Males Females
Q 21 a Volume and area 2 2 0
Q 21 b Probability 2 0 0
Q 21 c Probability (and percent discount) 5 4 0
Q 22 a Compass bearings 1 0 0
Q 22 b Bearings and trigonometry 3 2 1
Q 22 c Trigonometry 4 0 3
Q 23 a Slant height and surface area of a cone 2 0 1
Q 23 bStatistics: Cumulative frequency graph to
estimate median and interquartile range2 0 1
Q 23 c Solving algebraic equation 1 0 0
Q 23 d Graphs – reading and interpreting 3 0 2
Q 24 Space Mathematics 9 1 4
Q 25 Mathematics of Chance and Gambling 12 3 0
Q 26 Land and Time Measurement 7 2 0
Q 27 Personal Finance 9 0 4
Q 28 Mathematics in Construction 9 4 0
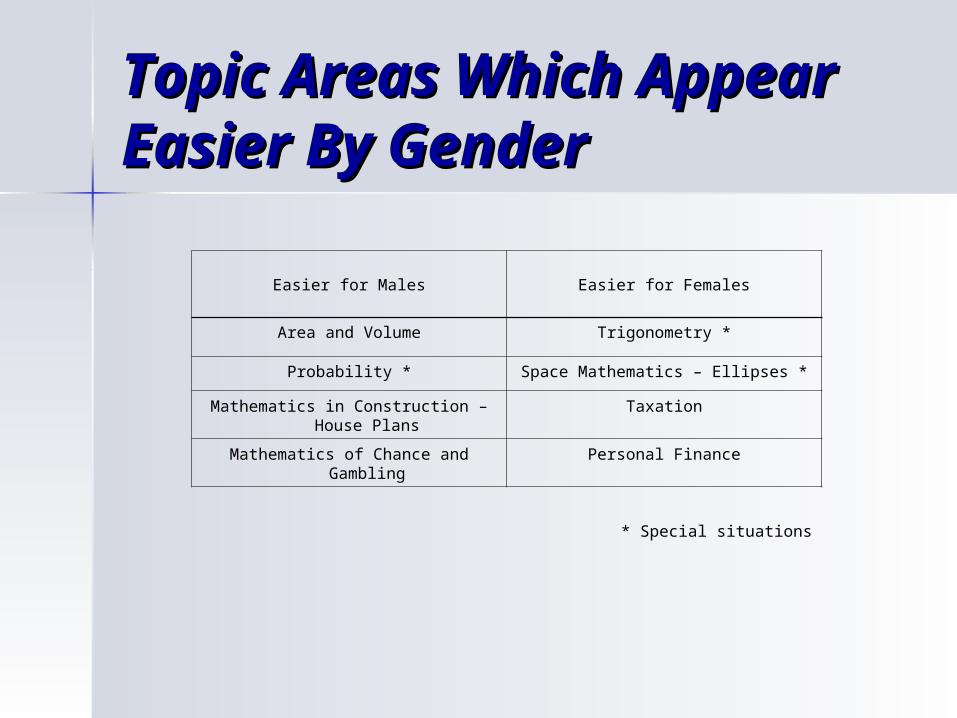
Topic Areas Which Topic Areas Which Appear Easier By Appear Easier By GenderGender
Easier for Males Easier for Females
Area and Volume Trigonometry *
Probability * Space Mathematics – Ellipses *
Mathematics in Construction – House Plans
Taxation
Mathematics of Chance and Gambling
Personal Finance
* Special situations
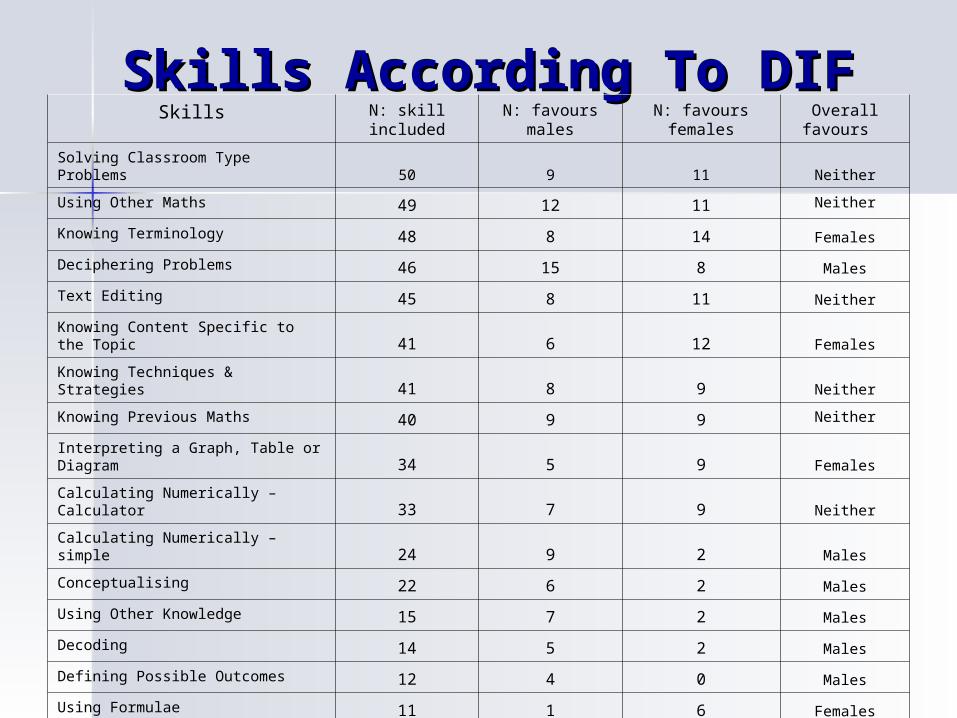
Skills According To DIFSkills According To DIFSkills N: skill
includedN: favours
malesN: favours females
Overall favours
Solving Classroom Type Problems 50 9 11 Neither
Using Other Maths 49 12 11 Neither
Knowing Terminology 48 8 14 Females
Deciphering Problems 46 15 8 Males
Text Editing 45 8 11 Neither
Knowing Content Specific to the Topic 41 6 12 Females
Knowing Techniques & Strategies 41 8 9 Neither
Knowing Previous Maths 40 9 9 Neither
Interpreting a Graph, Table or Diagram 34 5 9 Females
Calculating Numerically – Calculator 33 7 9 Neither
Calculating Numerically – simple 24 9 2 Males
Conceptualising 22 6 2 Males
Using Other Knowledge 15 7 2 Males
Decoding 14 5 2 Males
Defining Possible Outcomes 12 4 0 Males
Using Formulae 11 1 6 Females
Substituting 9 1 5 Females
Explaining 8 1 3 Females
Constructing a Diagram 7 2 0 Males
Converting Units 7 2 0 Males
Solving Novel Problems 4 1 1
Using Geometric Instruments 3 0 0
Completing a Table Or Graph 2 0 0
Converting Text & Numbers 2 1 0
Re-Arranging Formulae 2 0 1
Manipulating Algebraically 1 0 0
Solving Equations 1 0 0
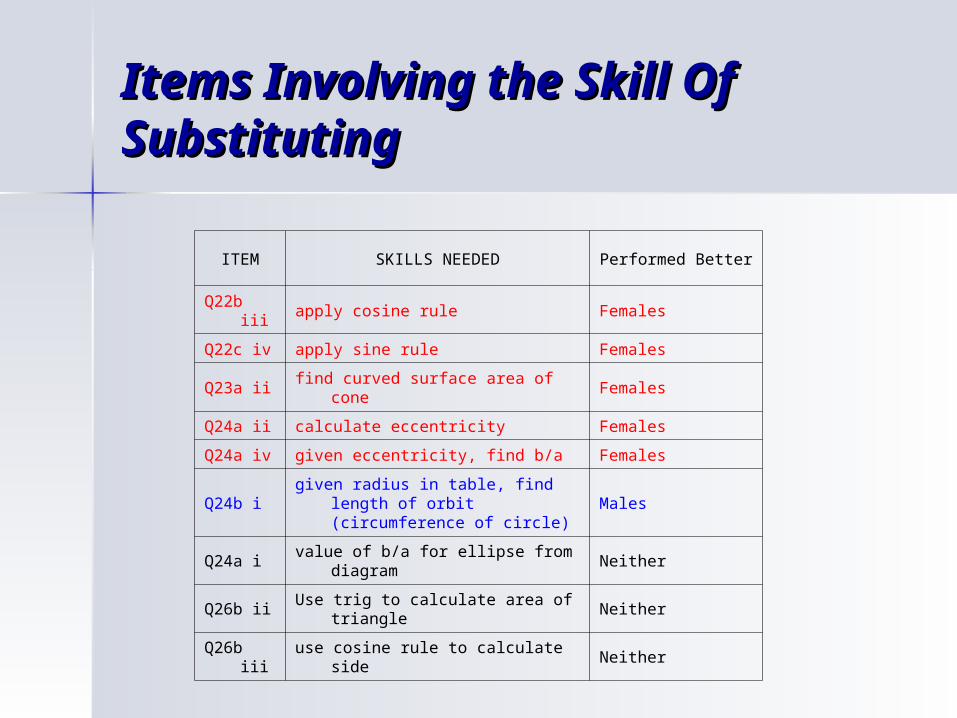
Items Involving the Skill Of Items Involving the Skill Of SubstitutingSubstituting
ITEM SKILLS NEEDED Performed Better
Q22b iii apply cosine rule Females
Q22c iv apply sine rule Females
Q23a ii find curved surface area of cone Females
Q24a ii calculate eccentricity Females
Q24a iv given eccentricity, find b/a Females
Q24b igiven radius in table, find length of
orbit (circumference of circle)Males
Q24a ivalue of b/a for ellipse from
diagramNeither
Q26b iiUse trig to calculate area of
triangleNeither
Q26b iii use cosine rule to calculate side Neither
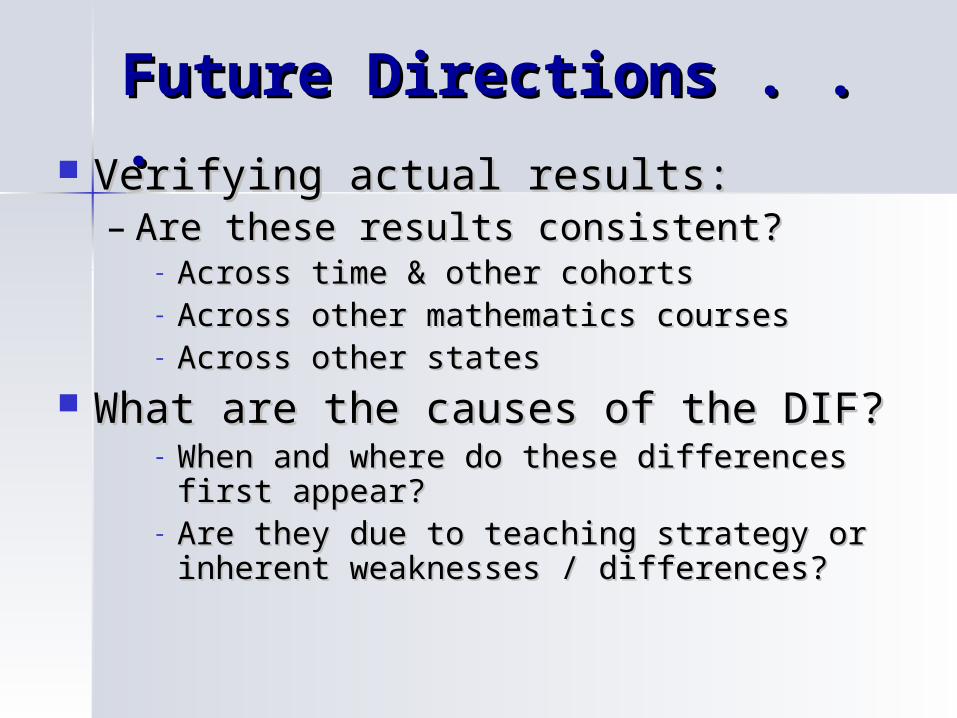
Future Directions . . .Future Directions . . . Verifying actual results:Verifying actual results:
– Are these results consistent?Are these results consistent?- Across time & other cohortsAcross time & other cohorts- Across other mathematics coursesAcross other mathematics courses- Across other statesAcross other states
What are the causes of the DIF?What are the causes of the DIF?- When and where do these differences first When and where do these differences first
appear? appear? - Are they due to teaching strategy or Are they due to teaching strategy or
inherent weaknesses / differences?inherent weaknesses / differences?
General CommentsGeneral Comments
Identification of items where DIF is Identification of items where DIF is evident can be linked to actual curriculum evident can be linked to actual curriculum areas.areas.
Identifying skills which lead to DIF can Identifying skills which lead to DIF can indicate where students need more indicate where students need more support.support.
Methodology demonstrated can be used Methodology demonstrated can be used for polytomous items and constructed for polytomous items and constructed response items in any subject arearesponse items in any subject area
?? ?? ?? ?? ?? ?? ??
Questions . . . Questions . . .


Comparative Plot for Comparative Plot for DIFDIF
-4
-3
-2
-1
0
1
2
3
-4 -3 -2 -1 0 1 2 3
Item Difficulties for Males
Ite
m D
iffi
cu
ltie
s f
or
Fe
ma
les
Note: confidence curves are based on 2 standard errors
Item 24a(ii)