Using Data for Continuous School Improvement - … Data for Continuous School Improvement 2015 Fall...
24
Using Data for Continuous School Improvement 2015 Fall CIP Workshops PM Session
-
Upload
dangnguyet -
Category
Documents
-
view
217 -
download
0
Transcript of Using Data for Continuous School Improvement - … Data for Continuous School Improvement 2015 Fall...

Using Data for Continuous
School Improvement
2015 Fall CIP WorkshopsPM Session
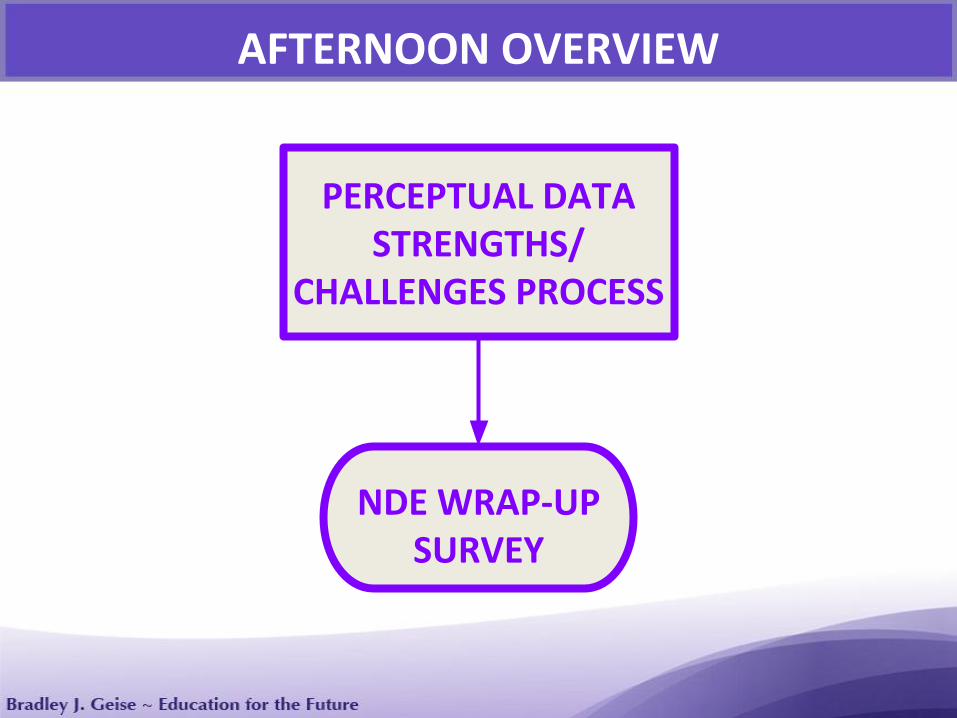
AFTERNOON OVERVIEW
NDE WRAP-UP SURVEY
PERCEPTUAL DATA STRENGTHS/
CHALLENGES PROCESS
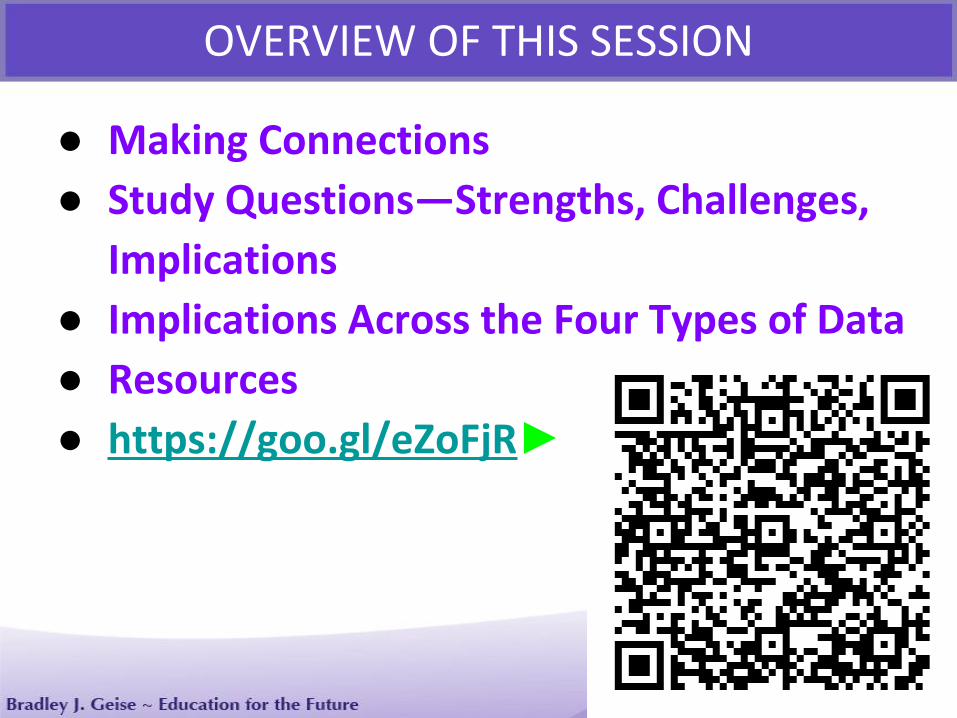
● Making Connections
● Study Questions—Strengths, Challenges,
Implications
● Implications Across the Four Types of Data
● Resources
● https://goo.gl/eZoFjR►
OVERVIEW OF THIS SESSION
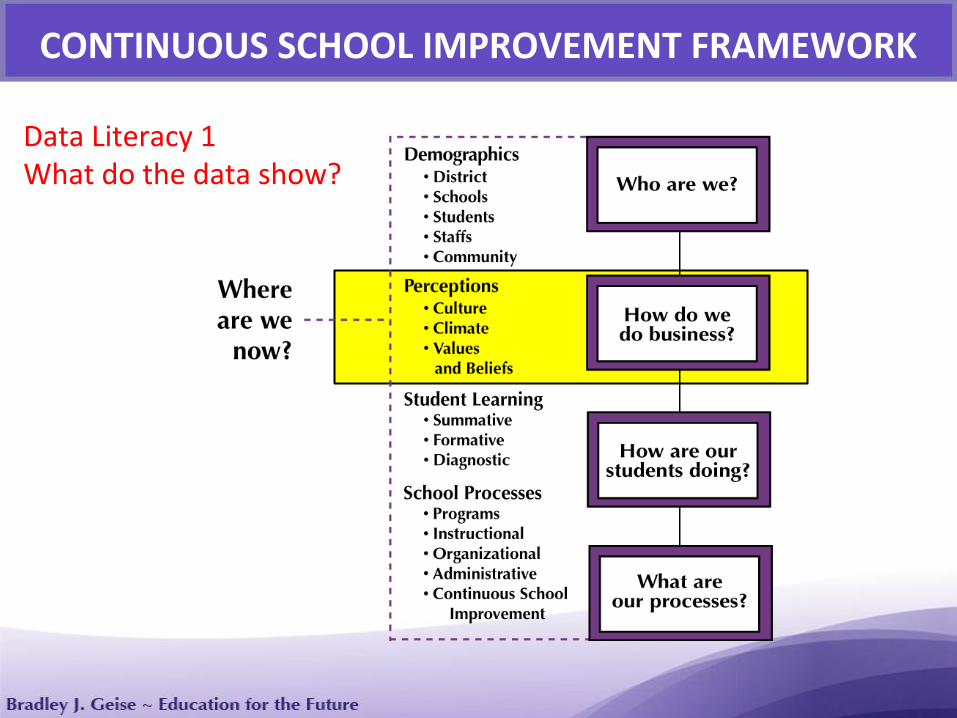
CONTINUOUS SCHOOL IMPROVEMENT FRAMEWORK
Data Literacy 1What do the data show?

CONTINUUMS: A Source of Perceptual Data

It reflects what stakeholders feel about the
school’s culture, climate, and organizational
processes.
● Staff beliefs, cohesiveness, professional learning
● Student interests, learning needs, educational environment and support
● Parent involvement in child’s learning
How do we do business?
WHY PERCEPTUAL DATA IS IMPORTANT
Pages 42-43►
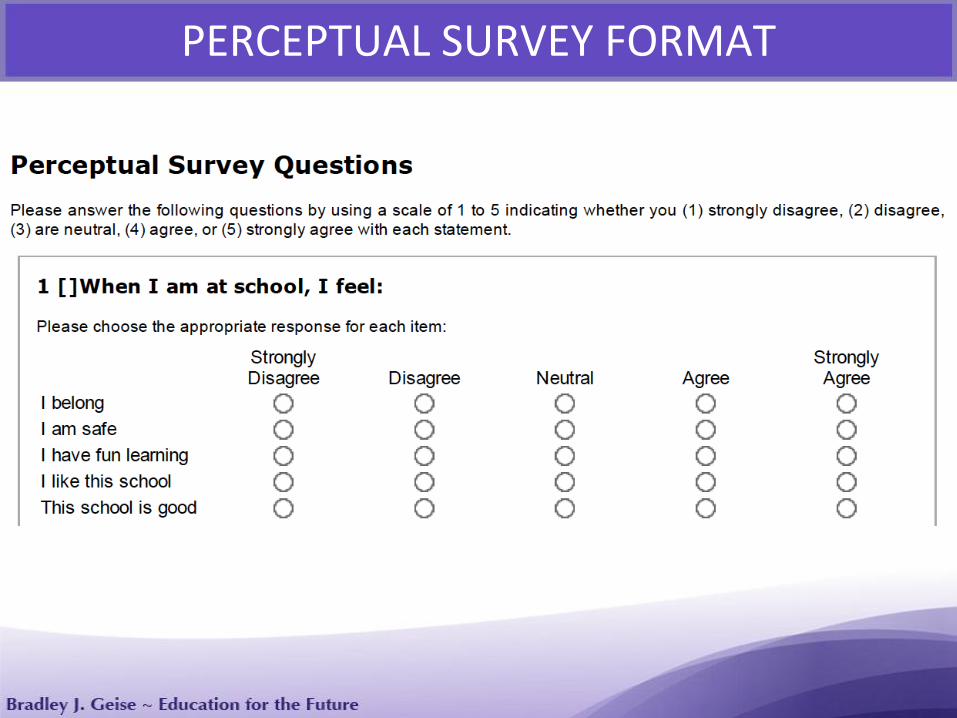
PERCEPTUAL SURVEY FORMAT

Sample Perceptual Data Page 302
Your survey results will come to you in this format.
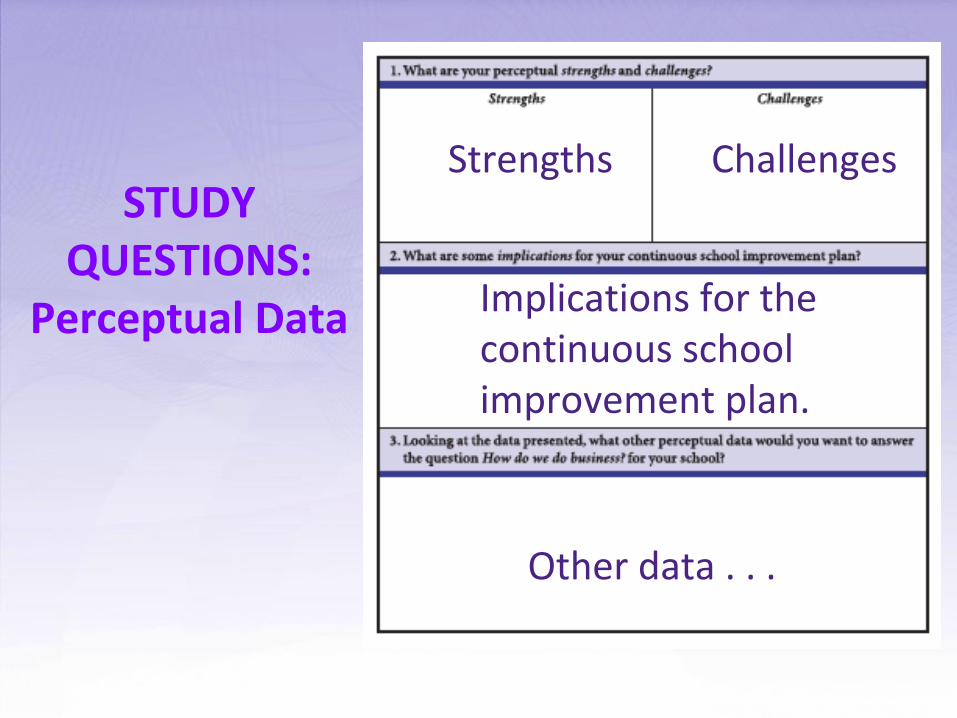
STUDYQUESTIONS:
Perceptual Data Implications for the continuous school improvement plan.
Strengths Challenges
Other data . . .

● STRENGTHS: Something positive that can
be seen in the data. Often leverage for
improving a challenge.
● CHALLENGES: Data that imply something
might need attention, a potential
undesirable result, or something out of a
school’s control.
DEFINITIONS

● IMPLICATIONS FOR THE SCHOOL
IMPROVEMENT PLAN: placeholders until
all the data are analyzed. Implications are
thoughts to not forget to address in the
school improvement plan. Implications
most often result from CHALLENGES.
DEFINITIONS

PROTOCOL:● Review the
sample data INDIVIDUALLY to identify strengths, challenges, implications for planning, and additional data needed.
● Write your findings on the Perceptual Data handout.
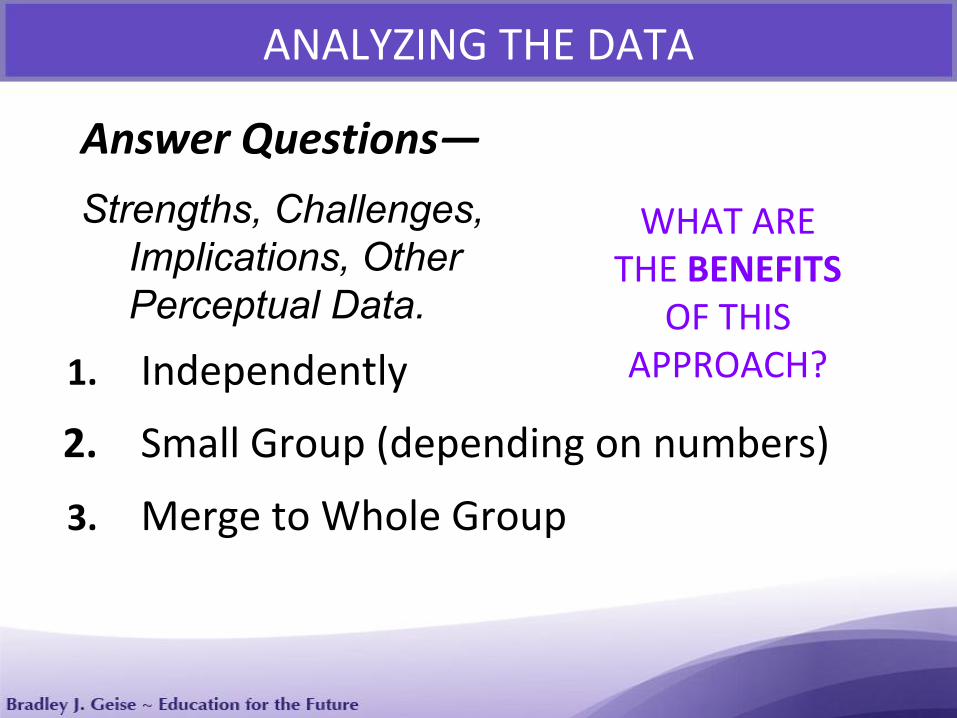
Answer Questions—
Strengths, Challenges,Implications, OtherPerceptual Data.
1. Independently
2. Small Group (depending on numbers)
3. Merge to Whole Group
ANALYZING THE DATA
WHAT ARETHE BENEFITS
OF THIS APPROACH?

Page 337, Figure G-2Identifying actionable items (implications) for consideration related to perceptual data.
SAMPLE IMPLICATIONS

Page 337, Figure G-2Identifying actionable items (implications) for consideration related to perceptual data.
SAMPLE IMPLICATIONS
p 300
309
314317321
298 I300 I, I
305
312-313
315 I319321

10-minute Break

COMMONALITIES AMONG DATA TYPES
Page 343

COMMONALITIES AMONG DATA TYPES
Page 352

COMMONALITIES AMONG DATA TYPES
Page 341
What instruments have already been developed?
● ASSIST Surveys (AdvancED)● State Surveys (NDE/ESU)
AVAILABLE RESOURCES
Click to download▼▼
NDE/ESU PERCEPTUAL SURVEYS

Work with your ESU Staff Developer to
● Engage with your district/school data● Analyze perceptual data via continuums or
through the study question process● Look at all four data types to identify goals
and establish a district action plan
NEXT STEPS
https://www.surveymonkey.com/r/dataliteracy
EXIT SURVEY

● Questions & Answers● Work Time○ Plan perceptual survey
administration○ Look at district data○ Strategic Planning
THANK YOU