Using Data for Continuous Improvement Faculty Development Model - Competency-Based Education
22
Using Data for Con.nuous Improvement Jason Levin, Western Governors University Ellen Wagner, Predic8ve Analy8cs Repor8ng Framework
-
Upload
becky-lopanec -
Category
Education
-
view
63 -
download
2
Transcript of Using Data for Continuous Improvement Faculty Development Model - Competency-Based Education

Using Data for Con.nuous Improvement
Jason Levin, Western Governors University Ellen Wagner, Predic8ve Analy8cs Repor8ng
Framework

Using Data For Continuous Improvement
Ellen Wagner Chief Research and Strategy Officer
@edwsonoma [email protected]
June 4, 2015
Reflections after Four Years in the Predictive Analytics Trenches

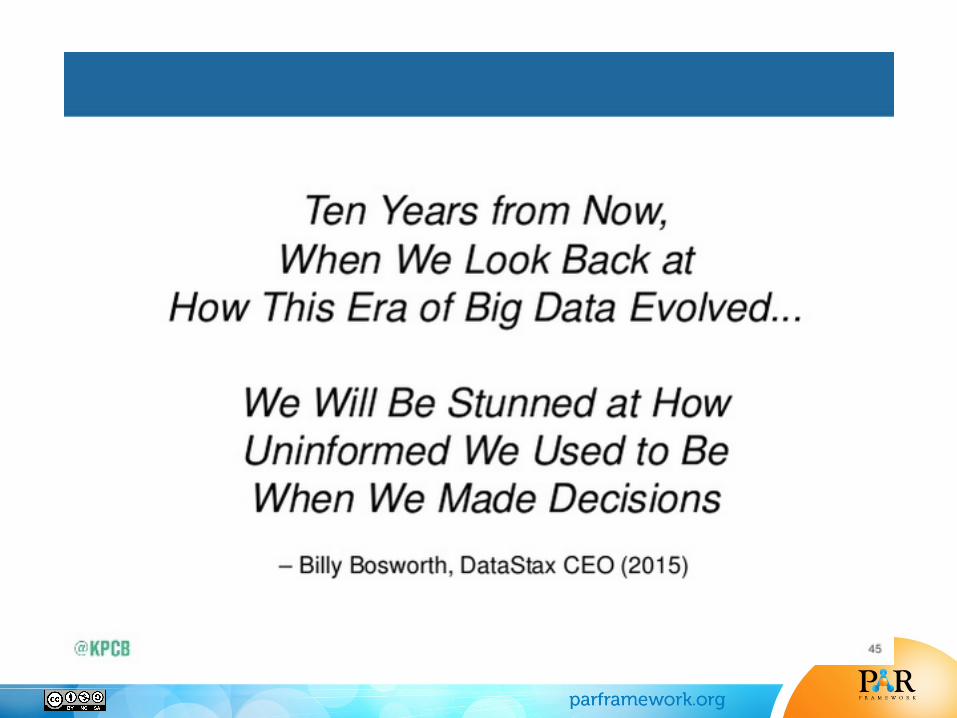
From Hindsight to Foresight

While “Big Data” raise expectations, student data drive big decisions in .edu
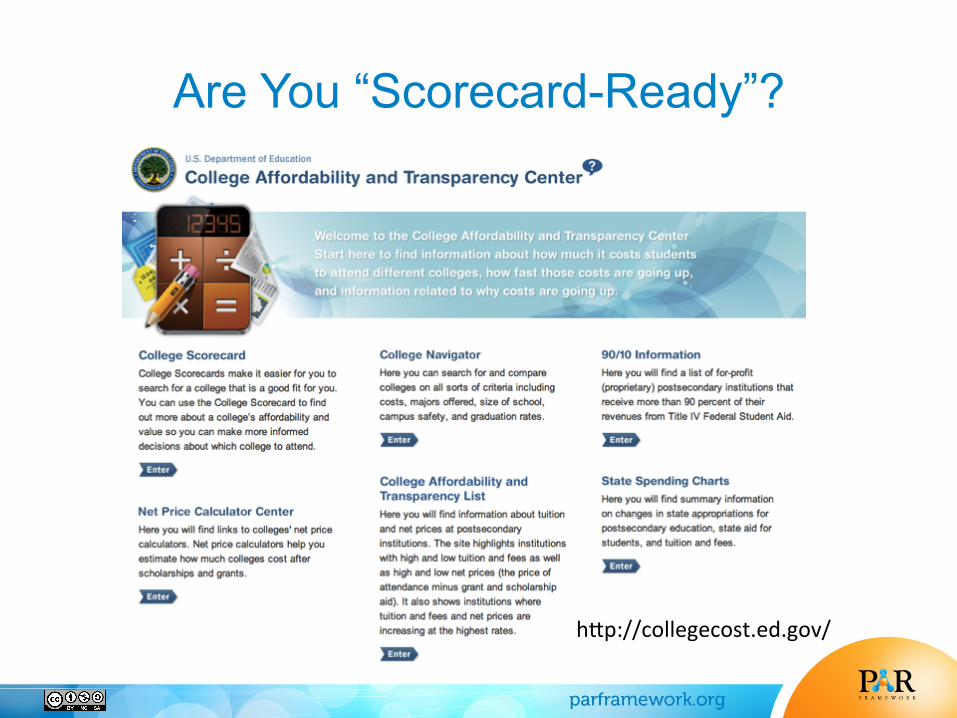
Are You “Scorecard-Ready”?
hNp://collegecost.ed.gov/
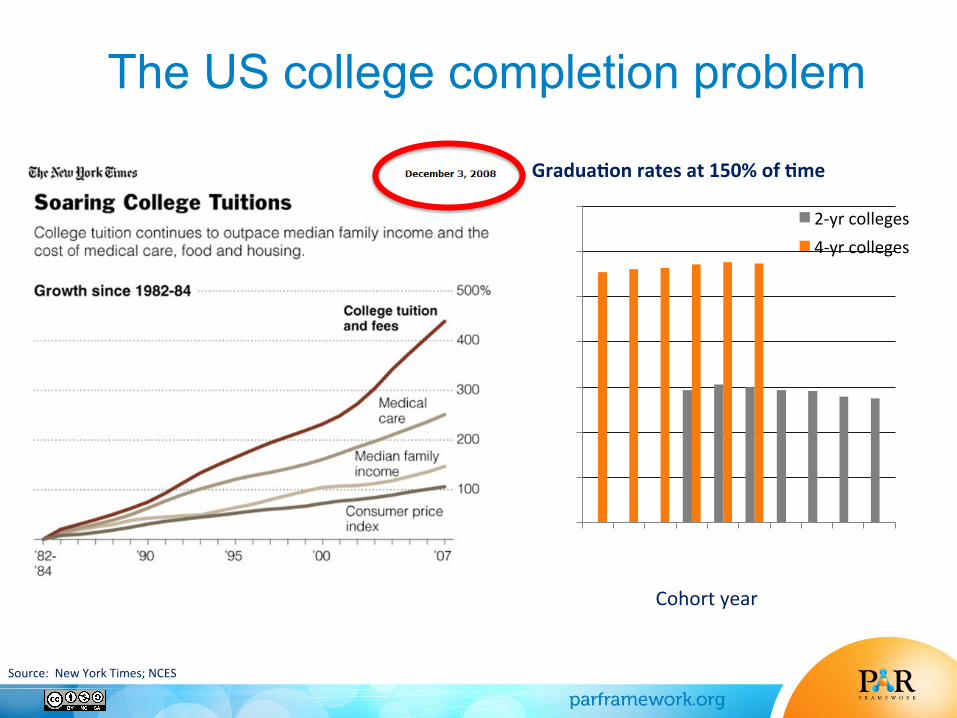
The US college completion problem
Source: New York Times; NCES
0
10
20
30
40
50
60
70
1996
1997
1998
1999
2000
2001
2002
2003
2004
2005
2-‐yr colleges 4-‐yr colleges
Gradua&on rates at 150% of &me
Cohort year

So – How are we doing?
• The president’s ambi8ous goal of being 1st in the world by 2020 looks unachievable.
• While the na8onal college-‐gradua8on rate has climbed to 44 percent, the gulf between the United States and other na8ons remains wide, and the target is moving.
• How are we doing? We have moved up from 12th place into a 8e for 11th place hNp://chronicle.com/ar8cle/6-‐Years-‐in6-‐to-‐Go-‐Only/151303/
• Meanwhile, US Ed Tech companies hit paydirt in 2014, raising $1.36 Billion in 201 rounds of funding with more than 386 unique investors.hNps://www.edsurge.com/n/2014-‐12-‐23-‐2014-‐us-‐edtech-‐funding-‐hits-‐1-‐36b
A 501 (c) (3) Organization

PAR Framework
• Collabora8ve, member-‐driven, non-‐profit analy8cs as a service provider.
• Comprehensive approach to student success – Cross ins8tu8onal benchmarks – Ins8tu8onal specific predic&ve models – Individual student-‐level watch lists for reten8on & academic success
– Ac8onable framework for evalua&ng campus interven&on programs and measuring impact

A massive, commonly defined dataset for analytics
• More than 2,500 downloads of PAR data defini8ons • > 2.4 million students and >25 million student
courses in the PAR data warehouse, in a single federated data set, developed using common data defini8ons.
• 351 unique campuses • 77 discrete variables are available for each student
record in the data set. Addi8onal 2 dozen constructed variables used to explore specific dimensions and promising paNerns of risk and reten8on.

PAR Differentiators
• PAR open frameworks • Massive dataset for analy8cs • Community of prac8ce and research, with a focus on research outcomes
• Market validated and member driven ins8tu8onal intelligence tools

PAR Starts with Structured, Readily Available Data
Common data definitions = reusable predictive models and meaningful comparisons Openly published via a cc license @https://public.datacookbook.com/public/institutions/par

Common data definitions make our disparate data sources work together
“How can we study problems related to student success longitudinally and across many ins8tu8ons if we’re not really using the same terminology?” Russ LiNle (formerly Sinclair Community College, now a member of PAR’s execu8ve team )
Photo by: Hans Hillewaert

Common Framework for Examining Interventions

PAR Puts it All Together
• Determine students probability of failure (predic'ons)
• Determine which students respond to interven8ons (upli- modeling)
• Determine which interven8ons are most effec8ve (explanatory modeling)
• Allocate resources accordingly (cost benefit analysis)

Gartner Research on the PAR Framework, July 2014
... In this complex endeavor we recommend a “learning by doing” approach and joining or at least studying the PAR Framework project experience. This is the most advanced openly available informa8on in higher educa8on to our knowledge.”
Jan-‐Mar8n Lowendahl, (2014) Educa8on Hype Cycle. Stamford CT: Gartner Research July 23, 2014 G00263196

Specific Examples of Data Driven Improvements
• U of Hawaii – “Obstacle courses” • UMUC / U of Hawaii – replica8on of community college success predic8on studies
• University of North Dakota – predic8ves 8ed to student watchlist data
• Interven8on measurement at Sinclair CC and Lone Star CC
• Data alignment – Univ of Illinois Springfield
Reflections on 4 Years in the Learner Analytics Trenches
• In .edu, big data *may* be in our future, but we also need to leverage liNle and medium data to help drive beNer decision-‐making.
• Common data defini8ons are a game changer for scalable, generalizable, repeatable learner analy8cs.
• Predic8ons are of greater ins8tu8onal value when 8ed to treatments and interven8ons for improvement, and interven8on measurement to make sure results are being delivered.
Reflections on 4 Years in the Learner Analytics Trenches
• Infrastructure maNers, but EXOSTRUCTURE maNers more.
• Scale requires reliable, generalizable outcomes and measures that can be replicated in a variety of sesngs with a minimal amount of customiza8on. In the case of PAR, common defini8ons and look-‐up tables served as a “RoseNa Stone” of student success data, making it possible for project to talk to one another between and within projects.
• Using commercial sotware stacks already in place on campuses and data exchanges to extend interoperability with other IPAS systems extends value and u8lity of tech investments.

Reflections on 4 Years in the Learner Analytics Trenches
• Change happens when fueled by collabora8on, transparency and trust.
• Data needs to maNer to everyone on campus. While data professionals will be needed to help construct new modeling techniques, ALL members of the higher educa8on community are going to need to “up their game” when it come to being fluent with data-‐driven decision-‐making, from advisors to faculty to administra8ve staff to students.
• It takes all of us working together toward the same goal in our own unique ways to make the difference.

CBE4CC
Addi.onal Ques.ons?