Using Data For Action - The SCAN Foundation
44
www.TheSCANFoundation.org 2013 LTSS Summit Sacramento, CA Using Data For Action Lisa R. Shugarman, Ph.D. Director of Policy November 13, 2013
Transcript of Using Data For Action - The SCAN Foundation

www.TheSCANFoundation.org
2013 LTSS Summit Sacramento, CA
Using Data For Action
Lisa R. Shugarman, Ph.D. Director of Policy
November 13, 2013

www.TheSCANFoundation.org
- Andy Krackov, Senior Program Officer, California HealthCare Foundation
- Charlene Harrington, Ph.D., Professor, University of California, San Francisco
- Andrew Bindman, MD, Professor, California Medicaid Research Institute, University of California, San Francisco
- Toby Ewing, Consultant, California Senate Governance and Finance Committee
Using Data For Action

www.TheSCANFoundation.org
Sign up to receive email alerts
at www.TheSCANFoundation.org
Follow us on Twitter
@TheSCANFndtn
Find us on Facebook
The SCAN Foundation
Our mission is to advance the development of a
sustainable continuum of quality care for seniors.
Our vision is a society where seniors receive
medical treatment and human services that are integrated in the setting most appropriate to the their needs and with the greatest likelihood of a
healthy, independent life.
Using Data For Action
The SCAN Foundation LTSS Summit
November 13, 2013
Andy Krackov,
Senior Program Officer

CALIFORNIA HEALTHCARE FOUNDATION
California Common Sense
data.cacs.org
CALIFORNIA HEALTHCARE FOUNDATION
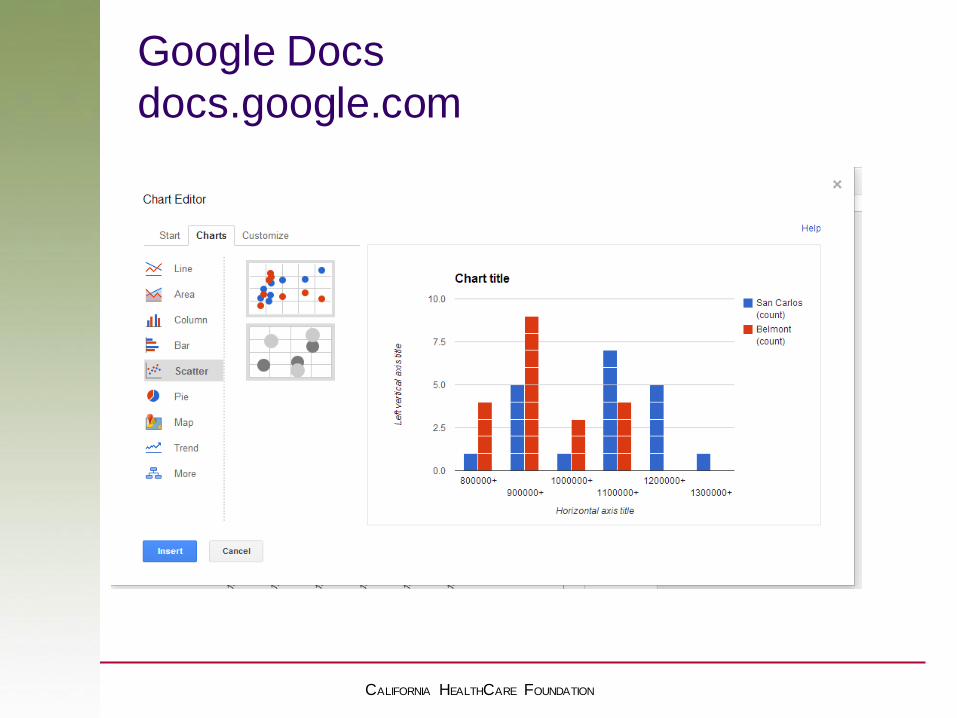
Google Docs
docs.google.com

CALIFORNIA HEALTHCARE FOUNDATION
Google Fusion Tables
www.google.com/fusiontables

CALIFORNIA HEALTHCARE FOUNDATION
Infogr.am
www.infogr.am

CALIFORNIA HEALTHCARE FOUNDATION
Datawrapper
http://datawrapper.de
www.chcf.org/freethedata | [email protected]

California Long Term Care
Services and Supports
Charlene Harrington, Ph.D. Professor
University of California San Francisco
The SCAN Foundation LTSS Summit November 13, 2013
UCSF

California Health Care Almanac
Long Term Care in California: Ready for Tomorrow’s
Seniors? C. Harrington, E. Newsom, and L. Ross, UCSF, 2013 for California Healthcare Foundation
1,895 2,278
3,634
4,542 4,467 4,724
1,288 1,372
1,770
2,840
3,630 3,639
427
601
744
1,000
1,661
2,297
0
2,000
4,000
6,000
8,000
10,000
12,000
2000 2010 2020 2030 2040 2050
85+
75-84
65-74
3,610
10,660
9,758
8,382
6,148
4,251
* In thousands
www.chcf.org/~/media/MEDIA%20LIBRARY%20Files/PDF/L/PDF%20LTCReadyForTomorrowsSeniors2013.pdf

Californians Receiving Long Term Care,
2005 and 2009
425,321
353,989
605,820
152,613
106,722
95,317
313,893
320,582
531,209
141,819
104,040
80,224
Personal Care*
Nursing Homes†
Home Health
Residential Care forthe Elderly
Hospice
Waivers*2005 2009
+18.8%
+35.5%
+10.4%
+14.0%
+7.6%
+2.6%
www.chcf.org/~/media/MEDIA%20LIBRARY%20Files/PDF/L/PDF%20LTCRead
yForTomorrowsSeniors2013.pdf

Medicaid HCBS Participants & Expenditures, 2010
Ng & Harrington, 2013. Medicaid HCBS Program Data 92-10. UCSF. See Annual Kaiser Family
Foundation reports http://www.kff.org/medicaid/upload/7720-06.pdf
Total Participants: 3.17 million
Total Expenditures: $53 billion

LTSS Data and Information
Center for PAS Personal Assistance
Services www.pascenter.org
Funded by NIDRR 2003-2013
Community Living Policy Center
www.communitylivingpolicy.org
Funded by NIDRR 2013-2018
Steve Kaye Ph.D. P.I.

UCSF Community Living Policy Center
Goals
www.communitylivingpolicy.org
Develop a strategic plan for community living research
Identify state LTSS promising practices
Conduct an inventory of state LTSS policies, practices, programs, and future plans
Conduct evaluations and cases studies including managed LTSS in California
Conduct basic research on selected topics in community living
Develop systems for monitoring progress in state LTSS

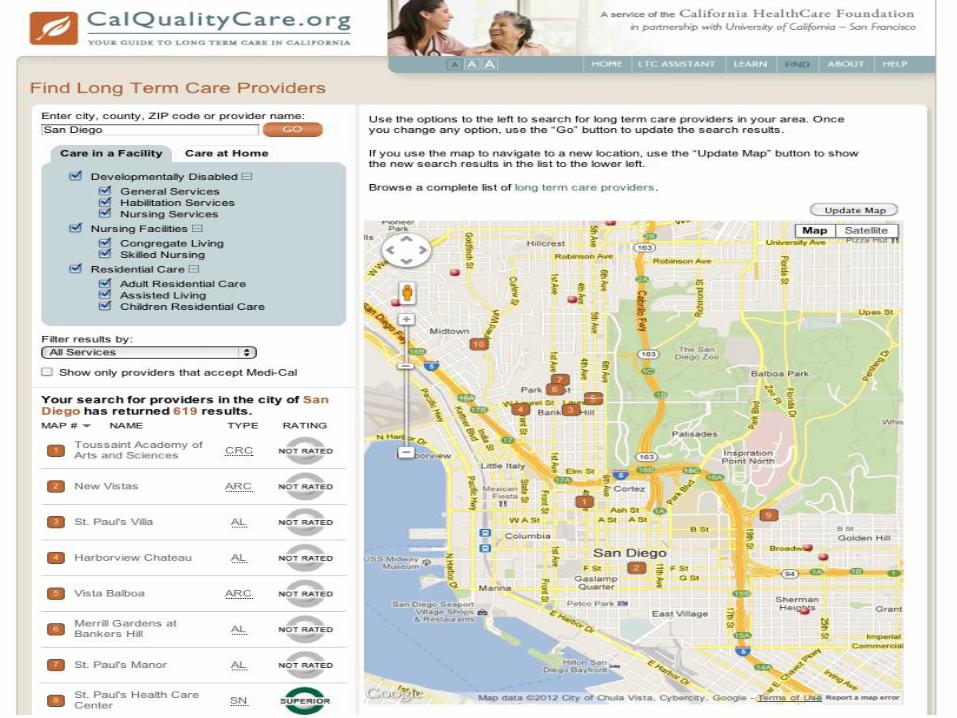
CalQualityCare.org
California Healthcare Foundation
◦ Basic information on LTSS
◦ Nursing Homes, Home Health, Hospice, ICF/DD --
5-Level Rating system
Federal and state deficiencies
Complaints
Staffing hours (for nursing homes)
Quality Measures
◦ Information on providers and state averages from
multiple data sets
◦ Used by consumers, providers, researchers, media,
others
Developed & Maintained by UCSF

CA DPH Electronic Licensing Management
System (ELMS) data

CA OSHPD & CMS CASPER & RUGS data
State Average Facility Average

CA Office of Statewide Health Planning &
Development Financial Report Data
State Average Facility Average

CMS and CA DPH Electronic Licensing Management System
State Average Facility Average

CA DPH Electronic Licensing Management System (ELMS) & CMS
Certification and Survey Provider Enhanced Reports (CASPER) Data
State Average Facility Average

CMS Nursing Home Compare quality measures
State Average Facility Average

CA Office of Statewide Health Planning & Development
Financial Report Data
State
Average
Facility
Average

Extensive Data Available
Multiple LTSS data sets available and analyzed
CHCF California Almanac www.CHCF.org
Kaiser Family Foundation www.kff.org
PAS Center/ New Community Living Policy Center – UCSF www.pas.center.org www.communitylivingpolicy.org
CHCF California Quality Care www.calqualitycare.org
Gaps in existing data –
CA Residential care data not computerized
Managed care LTSS data
Need for partnerships to collect, use and analyze LTSS data

Andrew B. Bindman, MD
Professor Medicine California Medicaid Research Institute University of California San Francisco
Using Data to Support Improvements in Long Term
Services and Supports in California

28 28
Assembling Medi-Cal, Medicare and State Data Files
Comprehensive statewide study of Medi-Cal users of LTSS, including dual Medicare and Medicaid enrolled (MME) beneficiaries
Assembling an integrated and longitudinal database of Medicaid, Medicare and state data 19 claims, assessment, eligibility and other files
from CMS, Medi-Cal and other state departments
Does not include Part D prescribing data

29 29
Examples of Key Questions
How much is spent by Medi-Cal and Medicare on LTSS beneficiaries?
What LTSS services do beneficiaries use?
How often do Medi-Cal beneficiaries receive HCBS services prior to being admitted to nursing facilities for extended stays?
How do counties vary in the types of LTSS used by Medi-Cal beneficiaries?

30 30
Study Population
Persons age 18 and older Received Medi-Cal funded LTSS in 2008
Nursing Facility (NF) Home Health (HH) In-Home Supportive Services (IHSS) Adult Day Health Care (ADHC) Targeted Case Management (TCM) Any Section 1915(c) HCBS waiver
Excluded populations Individuals who qualify for Medi-Cal based on a diagnosis
of developmental disability Individuals enrolled in Medi-Cal or Medicare managed care

31 31
Medi-Cal and Medicare Spending for Acute and Other Medical, Post-Acute and LTSS, 2008

32 32
Medi-Cal Spending on LTSS, 2008
Nursing Facility 48.1%
In-Home Supportive Services 44.6%
ADHC 5.4%
TCM 0.4%
HH 0.2%
MSSP Waiver 0.5%
Other Waivers 0.8% T
Total LTSS Spending
$6.2 Billion T
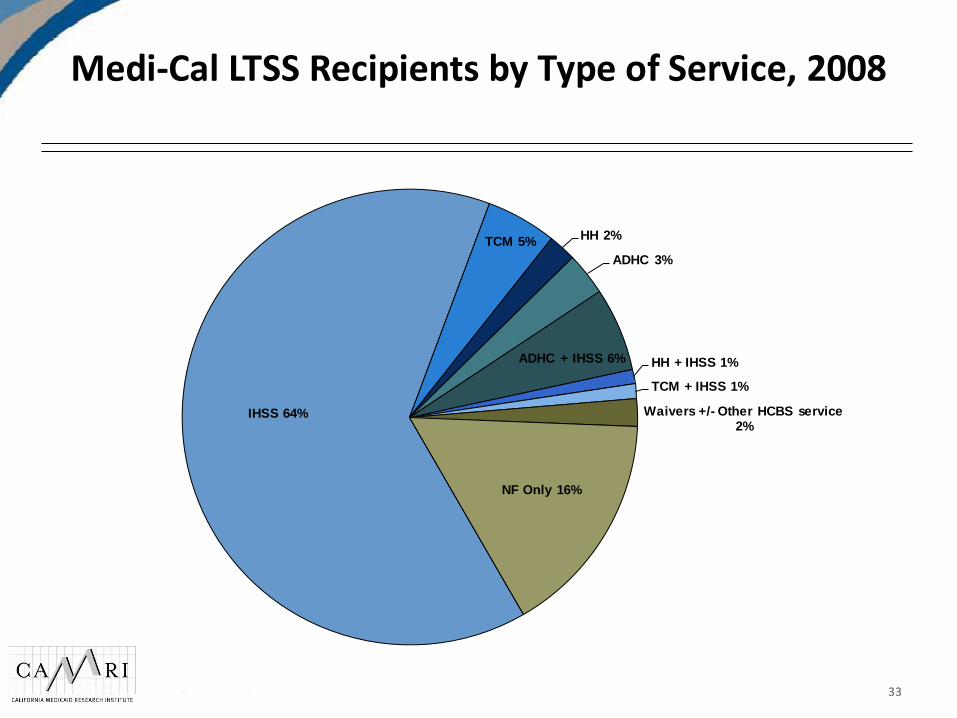
33 33
Medi-Cal LTSS Recipients by Type of Service, 2008
IHSS 64%
TCM 5% HH 2%
ADHC 3%
ADHC + IHSS 6% HH + IHSS 1%
TCM + IHSS 1%
Waivers +/- Other HCBS service 2%
NF Only 16%
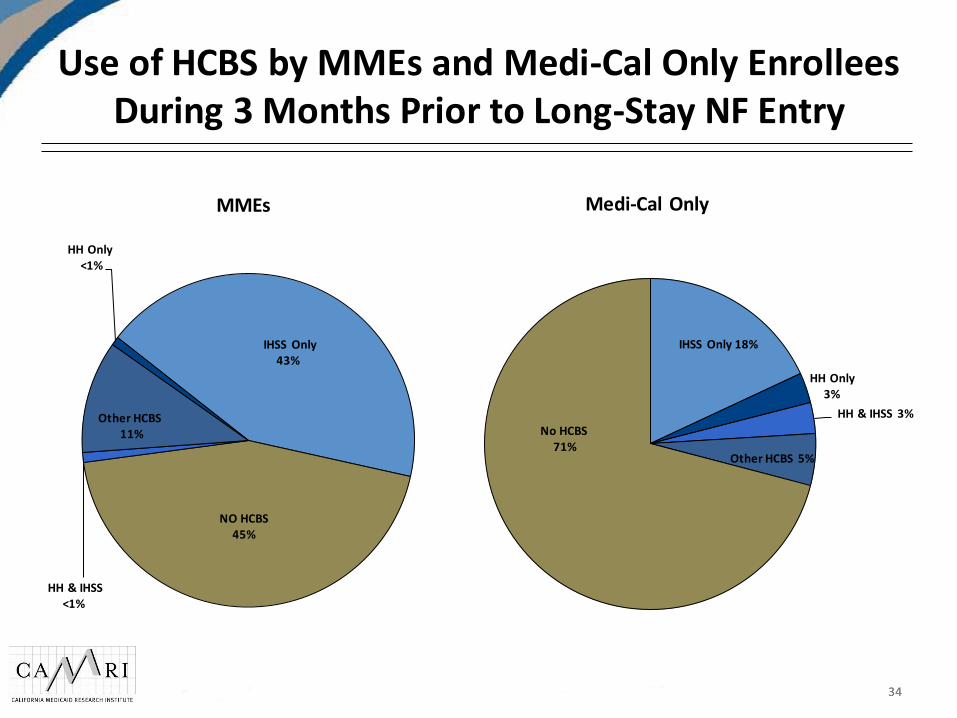
34 34
Use of HCBS by MMEs and Medi-Cal Only Enrollees During 3 Months Prior to Long-Stay NF Entry
IHSS Only 18%
HH Only 3%
HH & IHSS 3%
Other HCBS 5%
No HCBS 71%
Medi-Cal Only
IHSS Only 43%
NO HCBS 45%
HH & IHSS <1%
Other HCBS 11%
HH Only <1%
MMEs

35 35
Average Medi-Cal and Medicare Expenditures for MME Enrollees in 12 Months Prior to NF Admission
0
5,000
10,000
15,000
20,000
25,000
12 11 10 9 8 7 6 5 4 3 2 1
Do
llar
s
Months prior to NF Entry or Index Date
Acute and Post-Acute (Non-NF) LTSS (Non-NF) Acute and Post-Acute (NF) LTSS (NF)

36 36
Average Medi-Cal Expenditures for Medi-Cal Only Enrollees in 12 Months Prior to NF Admission
0
2,000
4,000
6,000
8,000
10,000
12,000
14,000
16,000
18,000
12 11 10 9 8 7 6 5 4 3 2 1
Do
llar
s
Months prior to NF Entry or Index Date
Acute and Post-Acute (Non-NF) LTSS (Non-NF) Acute and Post-Acute (NF) LTSS (NF)

37 37
HCBS Users per 10,000 Medi-Cal Beneficiaries, 2008
0 500 1,000 1,500 2,000 2,500
MONO (N=22)
TULARE (N=3,234)
KERN (N=5,741)
INYO (N=134)
DEL NORTE (N=333)
MODOC (N=107)
VENTURA (N=5,085)
EL DORADO (N=830)
SISKIYOU (N=517)
MADERA (N=1,715)
SAN JOAQUIN (N=7,083)
COLUSA (N=219)
MERCED (N=3,385)
TRINITY (N=162)
LASSEN (N=289)
FRESNO (N=13,083)
AMADOR (N=215)
NEVADA (N=559)
SOLANO (N=3,460)
SAN MATEO (N=3,922)
CALAVERAS (N=346)
SAN BERNARDINO (N=19,758)
MONTEREY (N=4,301)
TUOLUMNE (N=488)
SAN BENITO (N=488)
STANISLAUS (N=6,969)
RIVERSIDE (N=16,809)
KINGS (N=1,790)
ORANGE (N=21,578)
SANTA CRUZ (N=2,427)
SANTA CLARA (N=15,865)
YOLO (N=1,827)
PLACER (N=1,770)
NAPA (N=915)
YUBA (N=1,319)
SUTTER (N=1,436)
SANTA BARBARA (N=4,495)
BUTTE (N=3,439)
TEHAMA (N=1,098)
MENDOCINO (N=1,569)
SACRAMENTO (N=20,251)
SAN LUIS OBISPO (N=2,278)
GLENN (N=513)
MARIPOSA (N=223)
ALPINE (N=13)
CONTRA COSTA (N=9,695)
SIERRA (N=48)
ALAMEDA (N=19,244)
SHASTA (N=3,320)
SAN DIEGO (N= 28,016)
HUMBOLDT (N=2,350)
LOS ANGELES (N= 93,652)
SONOMA (N= 4,889)
PLUMAS (N=308)
MARIN (N=2,117)
LAKE (N=1,732)
IMPERIAL (N=5,429)
SAN FRANCISCO (N=24,235)

38 38
Nursing Facility Users per 10,000 Medi-Cal Beneficiaries, 2008
0 100 200 300 400 500 600 700 800
ALPINE (N=0)
MONTEREY (N=30)
SOLANO (N=63)
SANTA BARBARA (N=64)
SANTA CRUZ (N=58)
MONO (N=4)
ORANGE (N=1,282)
YOLO (N=105)
IMPERIAL (N=379)
YUBA (N=170)
DEL NORTE (N=83)
MERCED (N=688)
NAPA (N=146)
KINGS (N=319)
KERN (N=2,054)
FRESNO (N=2,774)
TULARE (N=1,457)
SISKIYOU (N=123)
MADERA (N=407)
SACRAMENTO (N=3,276)
MENDOCINO (N=255)
SAN BERNARDINO (N=4,326)
TRINITY (N=40)
HUMBOLDT (N=346)
SUTTER (N=274)
COLUSA (N=58)
GLENN (N=89)
SAN BENITO (N=112)
RIVERSIDE (N=3,942)
TEHAMA (N=219)
LOS ANGELES N=31,198)
VENTURA (N=1,576)
STANISLAUS (N=1,710)
LAKE (N=257)
SAN LUIS OBISPO (N=464)
SAN JOAQUIN (N=2,229)
SANTA CLARA (N=3,950)
LASSEN (N=92)
ALAMEDA (N=4,239)
CONTRA COSTA (N=2,268)
SAN FRANCISCO (N=2,943)
SHASTA (N=778)
CALAVERAS (N=129)
BUTTE (N=1,039)
MARIPOSA (N=62)
EL DORADO (N=389)
SAN DIEGO (N=7,470)
SONOMA (N=1,156)
SAN MATEO (N=1,708)
MARIN (N=548)
MODOC (N=71)
INYO (N=105)
PLACER (N=836)
PLUMAS (N=104)
AMADOR (N=137)
TUOLUMNE (N=288)
NEVADA (N=382)
SIERRA (N=28)

39 39
Percent of Medi-Cal LTSS Spending on HCBS, 2008
0% 10% 20% 30% 40% 50% 60% 70% 80% 90% 100%
SIERRA (N=76)
TUOLUMNE (N=761)
MODOC (N=176)
YOLO (N=54)
INYO (N=235)
PLUMAS (N=403)
AMADOR (N=323)
TULARE (N=4,133)
NEVADA (N=903)
SAN MATEO (N=722)
SANTA BARBARA (N=1,575)
SOLANO (N=238)
EL DORADO (N=1,074)
SAN BENITO (N=577)
TRINITY (N=201)
COLUSA (N=269)
MARIPOSA (N=275)
SAN LUIS OBISPO (N=370)
SISKIYOU (N=626)
LASSEN (N=375)
CALAVERAS (N=452)
ORANGE (N=2,884)
PLACER (N=2,020)
SUTTER (N=1,658)
KERN (N=6,253)
SAN JOAQUIN (N=7,427)
STANISLAUS (N=6,659)
VENTURA (N=6,049)
SHASTA (N=3,930)
BUTTE (N=4,363)
SAN DIEGO (N=28,355)
SANTA CRUZ (N=237)
MADERA (N=1,878)
MERCED (N=3,968)
CONTRA COSTA (N=8,595)
MARIN (N=2,206)
TEHAMA (N=1,282)
DEL NORTE (N=400)
SAN BERNARDINO (N=18,424)
SANTA CLARA (N=15,875)
ALAMEDA (N=17,949)
RIVERSIDE (N=15,390)
KINGS (N=2,041)
SONOMA (N=5,068)
GLENN (N=592)
FRESNO (N=12,368)
SAN FRANCISCO (N=22,286)
HUMBOLDT (N=2,660)
YUBA (N=1,433)
LOS ANGELES (N=186,544)
MENDOCINO (N=1,794)
SACRAMENTO (N=15,870)
MONO (N=26)
LAKE (N=1,936)
NAPA (N=113)
IMPERIAL (N=5,574)
MONTEREY (N=451)
ALPINE (N=13)

40 40
Key Messages
Over half of Medi-Cal’s LTSS delivered through HCBS yet there are signs of missed opportunities to reduce reliance on nursing facility care
A large proportion of Medi-Cal beneficiaries did not receive HCBS prior to a nursing facility admission
There is substantial county variation in the use of HCBS and extended nursing facility care

41 41
Unique Opportunity
CAMRI has partnered with DHCS to develop methods to combine and analyze data on Medi-Cal’s LTSS population
Opportunity to build upon this work with
updated data to enable monitoring of policies over time
Requires sustained commitment of DHCS to share data and financial resources to support the work

42 42
Acknowledgments
California Department of Health Care Services
The SCAN Foundation

Reports Available at
The SCAN Foundation http://thescanfoundation.org
CAMRI
http://camri.universityofcalifornia.edu

44 44
Project Team Members
Robert J. Newcomer, Ph.D. Charlene Harrington, RN, Ph.D. Julie Stone, M.P.A. Sei J. Lee, M.D. Todd Gilmer, Ph.D. Taewoon Kang, Ph.D. Phillip Chu, M.A. Denis Hulett, M.S. Samuel Tseng, Ph.D Arpita Chattopadhyay, Ph.D. Chi Kao, Ph.D. Pat Henderson Lena Libatique