Using Critical Physical Geography to Map the Unintended ...
187
Portland State University Portland State University PDXScholar PDXScholar Dissertations and Theses Dissertations and Theses Spring 6-6-2017 Using Critical Physical Geography to Map the Using Critical Physical Geography to Map the Unintended Consequences of Conservation Unintended Consequences of Conservation Management Programs Management Programs Melanie Malone Portland State University Follow this and additional works at: https://pdxscholar.library.pdx.edu/open_access_etds Part of the Agriculture Commons, and the Natural Resources and Conservation Commons Let us know how access to this document benefits you. Recommended Citation Recommended Citation Malone, Melanie, "Using Critical Physical Geography to Map the Unintended Consequences of Conservation Management Programs" (2017). Dissertations and Theses. Paper 3639. https://doi.org/10.15760/etd.5523 This Dissertation is brought to you for free and open access. It has been accepted for inclusion in Dissertations and Theses by an authorized administrator of PDXScholar. Please contact us if we can make this document more accessible: [email protected].
Transcript of Using Critical Physical Geography to Map the Unintended ...

Portland State University Portland State University
PDXScholar PDXScholar
Dissertations and Theses Dissertations and Theses
Spring 6-6-2017
Using Critical Physical Geography to Map the Using Critical Physical Geography to Map the
Unintended Consequences of Conservation Unintended Consequences of Conservation
Management Programs Management Programs
Melanie Malone Portland State University
Follow this and additional works at: https://pdxscholar.library.pdx.edu/open_access_etds
Part of the Agriculture Commons, and the Natural Resources and Conservation Commons
Let us know how access to this document benefits you.
Recommended Citation Recommended Citation Malone, Melanie, "Using Critical Physical Geography to Map the Unintended Consequences of Conservation Management Programs" (2017). Dissertations and Theses. Paper 3639. https://doi.org/10.15760/etd.5523
This Dissertation is brought to you for free and open access. It has been accepted for inclusion in Dissertations and Theses by an authorized administrator of PDXScholar. Please contact us if we can make this document more accessible: [email protected].

Using Critical Physical Geography to Map the Unintended
Consequences of Conservation Management Programs
by
Melanie Malone
A dissertation submitted in partial fulfillment of the
requirements for the degree of
Doctor of Philosophy
in
Earth, Environment and Society
Dissertation Committee:
Martin Lafrenz, Chair
Eugene Foster
Nathan McClintock
Veronica Dujon
Portland State University
2017

© 2017 Melanie Malone

i
Abstract
A variety of conservation trends have gained and lost favor throughout the years in
agriculture, with U.S. Farm Bills often influencing what conservation practices are
implemented by farming communities throughout the U.S. This dissertation focuses on
the unintended consequences of conservation management practices in the Fifteenmile
Watershed of Wasco County, Oregon. Specifically, I seek to address how farmer
enrollment in various conservation techniques, loosely defined as no-till agriculture, has
affected soil and water quality through the increased use of herbicide, and subsequently
rendered ecological and human health vulnerable. Using a critical physical geography
framework, I address both the biophysical factors and social structures that have co-
produced changes in soil and water quality in the study area of this research through
intensive physical field data collection, spatial analysis, social surveys, and interviews. I
also demonstrate how three neoliberal sets of processes: market-friendly reregulation;
state rollback and deregulation; and the creation of self-sufficient individuals and
communities, have transformed the human socio-environmental relationship to
agriculture. These processes have had significant effects on the policies governing how
soil and water quality are managed on both a state and national level, and have created a
dependence on enrollment in conservation practices that may ultimately prove
counterproductive for long term goals of environmental protection and sustainability.

ii
Acknowledgements
Many thanks to my committee for their contributions during my time in the PhD
program. To Martin Lafrenz, who took me on as a student after I had been enrolled in the
program for quite some time, and who humored me while I explored connections
between geomorphological and social realms, but encouraged me to stay close to my
sedimentary roots, pun intended. To Nathan McClintock, for inspiring me to continue
with my interests and for introducing me to all kinds of words and literatures that I had
never heard of before entering my program but now have found indispensable to my
research. Many thanks for all your guidance and for being an example of the type of
scholar I aspire to be one day. To Gene Foster, for graciously imparting knowledge about
all of the nuances of government regulations versus academic research and illuminating
all sorts of policy and regulatory conundrums that I have been pondering for years. To
Veronica Dujon, whom I always enjoyed listening to in IGERT classes and who has an
enviable knack for summarizing long, complex, social and historical theories that drive
larger environmental policies during seemingly casual conversations and discussions.
Many thanks to my husband, Kevin, who was often the first person to read various
drafts of my work and for giving the type of critical eye that only a super, detail-oriented
engineer could give. He was often the first to evaluate my thoughts on everything from
critical theory to soil science to every other topic I dabbled in, which took him far out of
the range of his comfort zone. His reviews of my work resulted in many amusing, but
productive conversations that forced me to explain and defend my ideas better, and I
think this dissertation benefited because of his insight.

iii
To all the wonderful people that make up the IGERT. You all have inspired me in so
many ways. Thanks to Marissa Matsler and Erin Goodling, for providing special support
as mentors in the IGERT program, for giving me valuable advice in times of need, and
for providing your friendship. To Samantha Hamlin, for being my partner-in-crime in the
program and a source of therapy throughout. To Mary Ann Rozance, for being the
ultimate academic bag lady, Diana Denham, for her inquisitive and thoughtful approach
to research, and Ashlie Denton for providing positive feedback on research
collaborations. Thanks to Basma Mohammed for joining me in my earliest adventures in
the field and assisting with difficult sampling. Also thanks to Kim Heavener, Darrell
Brown, Dave Ervin, Elise Granek, and Alan Yeakley for providing a huge amount of
institutional support. This dissertation would not have been possible without you all.
Thanks to Mike Young, who was the best intern I could have ever asked for during
the sweltering heat of the summer of 2015, and to Amy Hemingway for being a stellar
GIS intern! Also, thanks to all those that joined me for a random day of field work here
and there.
Thanks to Rebecca Lave and the rest of the CPG crew for collaborating on many
ideas that helped to make this dissertation a reality.
To my parents, siblings, and larger extended family, thanks for inspiring me to keep
up my work on environmental issues and for giving me too much praise for what I
actually work on and accomplish.
Finally, thanks and praise to God, for enabling me to get through this dissertation
program with support all along the way. For me, the completion of this degree is
attributable to nothing short of a miracle!

iv
Table of Contents
Abstract ................................................................................................................................ i Acknowledgements ............................................................................................................. ii
List of Tables ..................................................................................................................... vi List of Figures ................................................................................................................... vii Chapter 1: General Introduction ..........................................................................................1
Research Design Overview ............................................................................................4 Chapter 2: A Mixed-Methods Approach to Determine How Conservation
Management Programs and Techniques Have Affected Herbicide Use and
Distribution in the Environment Over Time ........................................................................7 Abstract ..........................................................................................................................7
Introduction ....................................................................................................................8 Herbicide Use Trends in Conservation Agriculture .................................................9 Concerns About Glyphosate ..................................................................................11
Objectives ..............................................................................................................13 Methods........................................................................................................................14
Herbicide Sampling ...............................................................................................15 October 2015 Glyphosate and AMPA Samples.....................................................16 May 2016 Co-located Glyphosate and AMPA Samples........................................18
July 2016 and August 2016 Glyphosate, AMPA, and Chlorinated
Herbicide Samples .................................................................................................18
Sampling Equipment Decontamination and Laboratory Methods.........................19 Soil Quality Indicator Samples ..............................................................................20
Spatial Analysis- NDVI Remote Sensing Analysis ...............................................21 Drone Sample Site Selection and Field Verification .............................................24
Results/Discussion .......................................................................................................26 NDVI Analysis of Satellite Imagery 1986 to 2016 ................................................26 NDVI Analysis with Drone 2016 ..........................................................................41
Herbicide Concentrations and Analysis .................................................................42 Regulatory and Toxicological Values of Concern .................................................51
Conclusions ..................................................................................................................56 Chapter 3: Impacts of Farming Practices and Conservation Management
Programs and Techniques on Sediment Cascades .............................................................58 Abstract ........................................................................................................................58 Introduction ..................................................................................................................59 Background ..................................................................................................................61
The Contribution of Past Farming Practices to Sediment Cascades ......................62 Conservation Practices Contribution to Sediment Cascades .................................63
Objectives ....................................................................................................................65
Study Area ...................................................................................................................66 Methods........................................................................................................................69
Determining Source Contributions with Cesium-137............................................69 Determining Human and Geophysical Impacts on Sediment Cascades ................73
Analysis of Historical Imagery ........................................................................74

v
Interviews and Surveys ....................................................................................75 Mapping of Floodplains and Terraces with LiDAR ........................................76
Results and Discussion ................................................................................................77 Sediment Source Contributions Determined by Cesium-137 Analysis .................77
How Humans Practices and Environmental Conditions Have Influenced
Sediment Cascades.......................................................................................................81 Past Farm Practices that Likely Influence Sediment Cascades .............................82
Ephemeral Gullies Related to Farming Practices ............................................82 Wind Erosion Related to Past Farming Practices ............................................84
Current Farm Practices that Likely Influence Sediment Cascades ........................85 Equipment Variations in Equipment, Tillage Practices and Soil
Disturbance ......................................................................................................85
Stream Modifications and Unrecognized Sources of Sediment ..................................90 Conclusions ..................................................................................................................97
Chapter 4: A Critical Physical Geographical Analysis of Conservation
Management Practices: Implications for Soil Quality, Water Quality, and Farm
Bill Policies Affecting No-Till Agriculture .....................................................................101
Introduction ................................................................................................................101 Background ................................................................................................................102
Critical Physical Geography ................................................................................103
Overview ....................................................................................................................105 Farm Bills Lay the Groundwork for No-Till .............................................................107
Market-Friendly Reregulation: Why No-till Became the Conservation
Method of Choice on the National Level .............................................................109
Market Friendly Reregulation in the Fifteenmile Watershed ..............................118 The Environmental Impacts of Market Friendly Reregulation ............................123
State Rollback and Deregulation National Level and in the Fifteenmile
Watershed ............................................................................................................126 Self Sufficient Individuals and Community in the Fifteenmile Watershed .........138
Conclusions ................................................................................................................152 Chapter 5: General Conclusions ......................................................................................154
References ........................................................................................................................159
vi
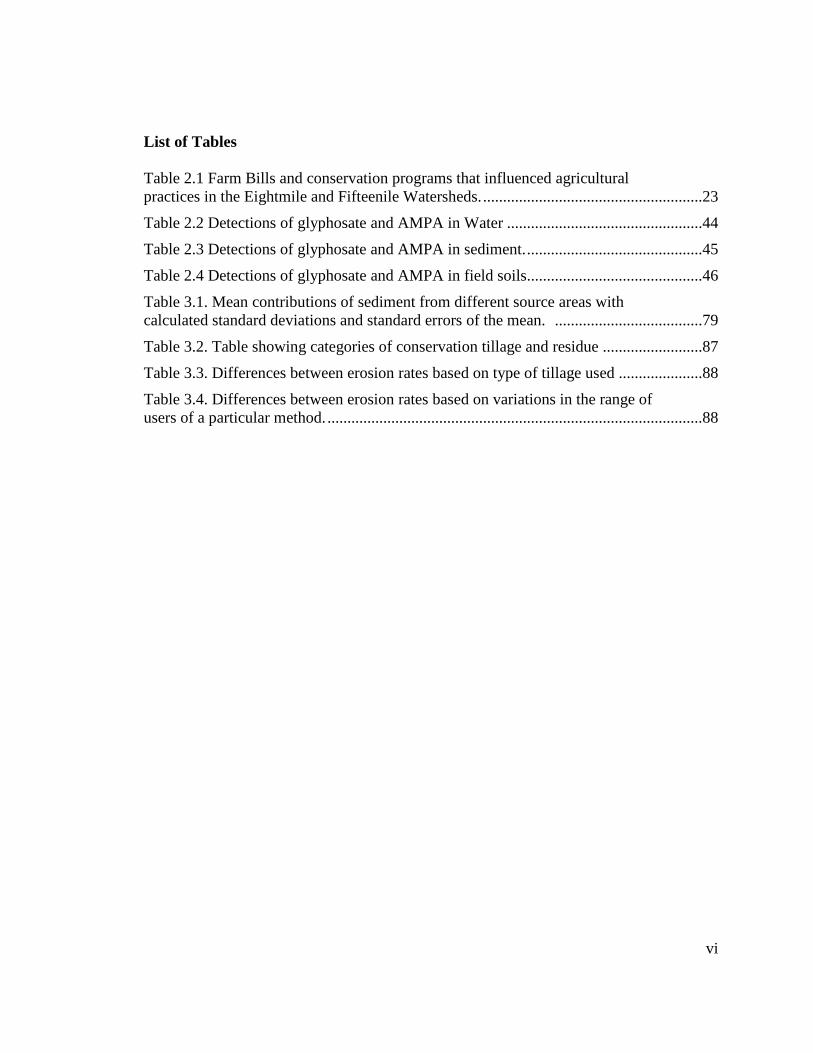
List of Tables
Table 2.1 Farm Bills and conservation programs that influenced agricultural
practices in the Eightmile and Fifteenile Watersheds. .......................................................23
Table 2.2 Detections of glyphosate and AMPA in Water .................................................44
Table 2.3 Detections of glyphosate and AMPA in sediment. ............................................45
Table 2.4 Detections of glyphosate and AMPA in field soils............................................46
Table 3.1. Mean contributions of sediment from different source areas with
calculated standard deviations and standard errors of the mean. .....................................79
Table 3.2. Table showing categories of conservation tillage and residue .........................87
Table 3.3. Differences between erosion rates based on type of tillage used .....................88
Table 3.4. Differences between erosion rates based on variations in the range of
users of a particular method. ..............................................................................................88

vii
List of Figures
Figure 2.1 Study area showing locations of soil, sediment, and surface water
samples in the Fifteen and Eightmile Watershed of Wasco County ..................................17
Figure 2.2 Photo demonstrating sampling scheme for herbicide sampling on
hillslopes and adjacent streams ..........................................................................................19
Figure 2.3 An example of drone imagery used to verify NDVI values. ............................26
Figure 2.4 Changes in Vegetation Health from 1986 to 2016 ...........................................27
Figure 2.5 The changes in vegetation health within a 100 foot buffer area from
1986 to 2016 ......................................................................................................................29
Figure 2.6 Changes between vegetation types (1986 to 1990) ..........................................32
Figure 2.7 Changes between vegetation types (1990 to 1994) ..........................................33
Figure 2.8 Changes between vegetation types (1998 to 2000) ..........................................33
Figure 2.9 Changes between vegetation types (2008 to 2011) ..........................................34
Figure 2.10 Changes between vegetation types (2011 to 2015) ........................................36
Figure 2.11 Annual precipitation in Wasco County, OR ...................................................36
Figure 2.12 June monthly precipitation in Wasco County, OR .........................................37
Figure 2.13 July monthly precipitation in Wasco County, OR..........................................37
Figure 2.14 Annual mean temperature in Wasco County, OR ..........................................38
Figure 2.15 June monthly mean temperature in Wasco County, OR ................................38
Figure 2.16 July monthly mean temperature in Wasco County, OR .................................38
Figure 2.17 Areas that remained unhealthy between 1986 and 2016 ................................41
Figure 2.18 Months of herbicide spraying and concentrations of glyphosate and
AMPA detected in water samples. .....................................................................................47
Figure 2.19 Months of herbicide spraying and concentrations of glyphosate and
AMPA detected in sediment samples. ...............................................................................48
Figure 2.20 NDVI drone image of area near sample location SD-5 ..................................49
Figure 2.21 NDVI drone image of sample location SD-12. ..............................................49
Figure 2.22 Concentrations of glyphosate and AMPA versus soil texture in
sediment and soil................................................................................................................50
Figure 2.23 Sediment, water, and soil concentrations of glyphosate and AMPA in
July and August 2016.........................................................................................................51
Figure 2.24 Figure of glyphosate human and ecological health impacts ...........................53
Figure 3.1. Study Area. ......................................................................................................67
Figure 3.2. Examples of floodplains and terraces mapped using the TerEX Tool ...........77
viii
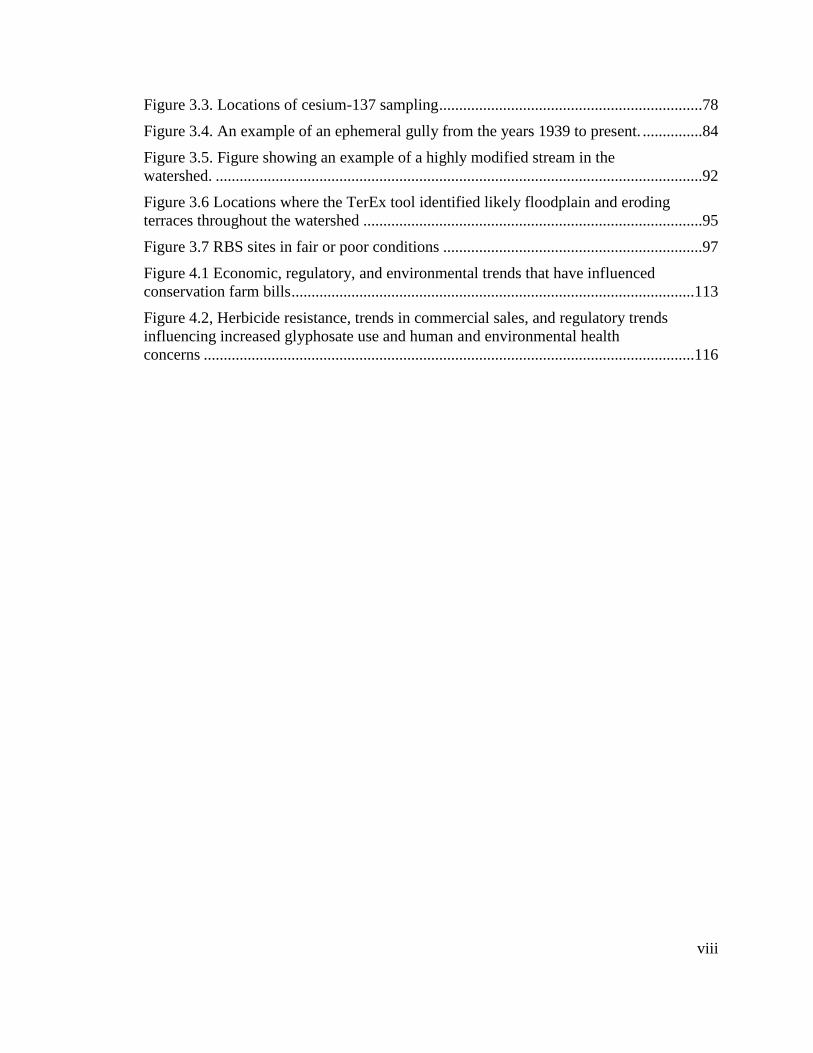
Figure 3.3. Locations of cesium-137 sampling ..................................................................78
Figure 3.4. An example of an ephemeral gully from the years 1939 to present. ...............84
Figure 3.5. Figure showing an example of a highly modified stream in the
watershed. ..........................................................................................................................92
Figure 3.6 Locations where the TerEx tool identified likely floodplain and eroding
terraces throughout the watershed .....................................................................................95
Figure 3.7 RBS sites in fair or poor conditions .................................................................97
Figure 4.1 Economic, regulatory, and environmental trends that have influenced
conservation farm bills .....................................................................................................113
Figure 4.2, Herbicide resistance, trends in commercial sales, and regulatory trends
influencing increased glyphosate use and human and environmental health
concerns ...........................................................................................................................116

1
Chapter 1: General Introduction
Soils, as intrinsic parts of largely land-based ecosystems, provide us with the most
basic means to sustain ourselves, including the purification and cycling of major
sources of water…Most life on land would therefore not even exist without soils and,
indeed, neither would we. We all depend on soils for our very survival because, at a
minimum, we all have to drink water and eat. -Salvatore Engel-Di Mauro, Ecology,
Soils, and the Left: An Ecosocial Approach
As environmental consequences of living in the age of the Anthropocene intensify,
humans need to think critically about the consequences of land management techniques
and what social and physical factors contribute to environmental degradation. This
dissertation research critically examines the effects of conservation management
techniques, loosely referred to as no-till agriculture, and its effects on soil and water
quality issues in the Fifteenmile Watershed of Wasco County, Oregon.
No-till farming gained widespread acceptance across the U.S. in the early 1990s after
a variety of intensive agricultural policies and practices in earlier decades threatened
production of soils and food, and after deepening public concern arose over unsustainable
environmental practices (Hall, 1998; Lehrer, 2010; Rigdon, 2011). In contrast to
conventional tillage, which can promote the runoff of sediment, fertilizers and pesticides
into rivers, lakes and oceans, no-till seeks to minimize soil disruption (Huggins and
Reganold, 2008). No-till farmers leave crop residue on fields post-harvest, where it
protects the soil from erosion by acting as a mulch and by fostering soil productivity that
increases organic matter. Instead of using a plow to turn the soil and open the ground, no-
till farmers push seeds down through the organic matter from prior crops, minimizing
direct disturbance of the soil (Montgomery, 2007).

2
The majority of farmers in Wasco County have been engaging in no-till practices
since the late 1990s and early 2000s with varying degrees of success. Although
environmental conditions such as erosion and elevated levels of sediment in streams
visually appear better in the watershed, several monitoring studies have indicated that
sediment in streams have not improved, and unprecedented amounts of herbicide use,
namely glyphosate, pose new threats to ecological and human health. These problems are
not unique to the watershed, but are symptomatic of varying degrees of implementation
of no-till across the U.S. (Huggins and Reganold, 2008, Rigdon, 2011). As such, an
investigation of the causes of inadequate implementation of no-till are warranted and are
increasingly needed as approximately 40% of U.S. land is currently managed with no-till
systems (USDA, 2017). The trajectory and outcomes of no-till in The Fifteenmile
Watershed has mimicked many of those on a national level. Therefore, the watershed acts
as an ideal location to investigate the advantages and disadvantages of its
implementations.
In this dissertation, I dedicated considerable research efforts to collecting soil and
sediment samples from fields and streams throughout the county to investigate soil
quality because so much of how no-till affects the environment has to do with how soils
are managed. As such, an important contribution of this dissertation will be its
contributions to literature on social processes that affect soil quality and processes that
lead to its degradation and erosion. In the past decade or so of research, there has been a
call amongst soil scientists and historians studying soil science to include humans as a
major soil forming factor (Engel-Di Mauro, 2014; Richter, 2007; Swidler, 2009). Until
well into the 20th century, nearly all pedology articles and texts mentioned little or

3
nothing about the human role in soil formation (e.g., Byers et al., 1938). Historically,
pedology has emphasized the natural environment and minimized humanity’s influence
(Dudal et al., 2002). Yet, recently multiple scientists (Engel-Di Mauro, 2015; Lave et al.,
2013 McClintock, 2015; 2013 Richter, 2007; Swidler, 2009) have argued for inclusion of
humans as either a serious component to soil formation or as a major soil forming factor.
Engel-Di Mauro (2014) argues that human contribution to soil-making should be
considered as ancient as the human species, in one degree or another, since land-based
organisms always had some effect on the formation and development of soils. As noted
by Wells and Noller (1999) and Showers (2006), the job of the pedologist has always
been to provide information about the properties and processes of Earth’s soil, and
contemporary pedologists need to understand it as a historical and cultural body as well.
The accelerating pace of global soil change challenges pedologists not only to quantify
how soils are affected by humanity (Stroganova et al., 1997; Zitong et al., 1999; Schaetzl
and Anderson 2005; Galbraith, 2006) but also to understand how human impacted soils
interact with the wider environment. The job of the pedologist has expanded from one
attending to Earth’s soil as a natural body, to one that includes all of human relations with
soils in the global environment.
Richter (2007) argues that as land uses intensify and data from long-term soil
experiments accumulate, the rate dependence of changes in soil properties is being
directly observed, and much of what has previously been conceived as being slow to
change is in fact relatively dynamic from decade to decade. On time scales of decades,
anthropedogenesis can rapidly alter acidification and salinization; organic matter
dynamics; translocations of solutes, colloids of silicate clay, organic matter, and Fe and

4
Al oxides; and redoximorphic features, surface charge properties, aggregation, porosity,
gas and water relations, and even rooting depth and texture. A number of long-term soil
experiments (Gerzabek et al., 2001; Richter et al., 2007) and repeated soil surveys
(Bellamy et al., 2005) provide evidence for soil change on relatively short (i.e., human)
time scales. Given that some of society’s most important scientific questions concern the
future of soil (for example, whether soil productivity for crops can be doubled in the next
50 years, or whether soil-management control can be established to minimize adverse
effects on the atmosphere and water) far greater attention needs to be paid to quantifying
how Earth’s soils are changing over time scales of decades (Richter, 2007). Therefore,
the historical treatment of soils and its physical manifestations must be studied in order to
understand its effects on various societies (Swidler, 2009, Engel-Di Mauro, 2014).
The following chapters describe how conservation practices have affected processes
such as soil erosion and chemical inputs, which directly influence soil development and
degradation. Further, the contents of these chapters will speak to the increasingly short
decadal time scales upon which soils are changed. Many no-till farmers have only been
practicing no-till for less than 20 years, but the impacts to soil quality and the broader
environment have been substantial.
Research Design Overview
The goals of this dissertation are two-fold. First, I recommend tools and
methodologies that will help land managers identify the current social and environmental
data gaps that hinder efforts to improve soil and water quality conditions in the county
and across the U.S. Secondly, I explore how farmers and land managing authorities’
engagement with the physical and social processes of conservation management

5
techniques may contribute to issues with soil and water quality. The goals of the project
will be met by the use of a “critical physical geography” (CPG) framework, which is at
the frontier of synthesizing human and physical geography (Lave, 2013). Use of CPG
will identify how land managers and scientists can improve the incorporation, and
applicability of, both physical and social scientific data to conservation management
techniques to achieve the best outcome for soil and water resources. As I engage the CPG
framework, I use a variety of physical and social research methods, including: field
sampling, spatial analysis, semi-structured interviews, and critical theory.
The following chapters address the questions of how to monitor and address the
implementation of no-till conservation management techniques in agricultural settings
that are experiencing the unintended consequences of uneven conservation measures.
The findings in each chapter provide answers to particular knowledge gaps in current
understandings of how conservation management techniques affect soil and water quality
in the Fifteenmile Watershed, which are reflective of broader patterns of land managed
under no-till systems nationwide. Chapter 2 investigates the outcomes of increased
herbicide use in the Fifteenmile Watershed, with the goal of determining what
concentrations of glyphosate are present in the watershed already and if they pose
concerns for human and ecological health. Chapter 3 evaluates the relative effectiveness
of various conservation management techniques that have been used over time in the
watershed, and the relative effectiveness of no-till at resolving sedimentation issues in the
watershed. Chapter 4 evaluates the roles of quasi-state actors and larger agri-
environmental policies driven by U.S. farm bills, with particular emphasis on the impacts
of farm bills implemented from 1985 forward. These bills have had the most effects on

6
how conservation methods have been implemented and explain the rise of no-till as the
conservation method of choice for market-based neoliberal processes that have shaped
farmers’ interactions with the land and water they manage.
The broader impact of this research will be a contribution to the literature that argues
for humans as a major factor for soil formation. An understanding of human contributions
to soil formation is critical for resolving issues with conservation programs in agricultural
systems (Engel-Di Mauro, 2014, Richter, 2007). Soil and landforms have no pre-
determined destiny in the presence of humans, and as such, soil acts as a historical record
of management techniques (Swidler, 2009). A large part of establishing the significance
of humans in the process of soil formation will be to contribute to the literature on how
soil is changing over increasingly short, decadal time periods instead of longer millennial
scales as has been done in the past (Richter, 2007). This project will show how soil
quality has changed over decades through unprecedented amounts of increased herbicide
use and how erosional sources have changed over the spans of decades via changes in
conservation practices.

7
Chapter 2: A Mixed-Methods Approach to Determine How Conservation
Management Programs and Techniques Have Affected Herbicide Use and
Distribution in the Environment Over Time
Abstract
Many proponents of no-till agriculture claim that it is a sustainable alternative to
conventional agriculture. No-till agriculture has the ability to reduce fuel consumption,
increase soil moisture, reduce soil erosion and increase organic matter (Williams and
Wuest, 2014). Although no-till agriculture provides many benefits to soil ecosystems and
humans, it remains unclear whether it increases herbicide use overall in the long term for
communities that use it as their primary source of conservation agriculture (Fernandez-
Conejo, 2013; Friedrich and Kassam, 2012), and the amount of herbicide use varies from
agricultural community to community. The impacts of increased herbicide use have
significant implications not only for soil quality but also for water quality. The
preponderance of literature suggests that no-till has increased herbicide use, but it is
usually difficult to quantify how much herbicide has increased in a given location and to
directly correlate changes in herbicide use to changes in soil and water quality. This
paper provides several methods to determine how herbicide use has changed over time in
an agricultural community in Oregon that switched over to no-till in the late 1990s and
early 2000s. These methods include: spatial analysis of remote sensing satellite imagery
of vegetation health along streams; use of a drone fitted with an agricultural camera to
detect vegetation health; soil, sediment, and water sampling for the most commonly used
herbicides in the study area; interviews with, and collection of data from, farmers; and
agency record review of herbicides used in the area. By conducting these methods, this

8
study shows where stream vegetation health continues to be an issue in the agricultural
community, and where concentrations of a commonly used herbicide in the community
may be impacting human and ecological health. This study has important implications for
impacts to soil and water quality over time in agricultural communities, as many
researchers have noted the need to determine the long term effects of conversion to no-till
and other forms of conservation agriculture (Huggins and Reganold, 2008; Montgomery,
2007; Service, 2007, Williams and Wuest, 2014). By providing these methods,
communities heavily engaged in multiple forms of conservation agriculture may be able
to track how herbicide use is changing in real time and on shorter decadal time spans in
places where conservation agriculture is practiced. Therefore, they may also be able
anticipate the long term effects of herbicide use on soil, sediment, and water quality and
derive the causes for changes in the quality of each.
Introduction
Since the late 1990s and early 2000s, wheat farmers in Wasco County, Oregon have
gradually converted from conventional tilling practices to no-till and direct seeding
agricultural practices. No-till and direct seed, while technically different, are used
interchangeably among farmers in the study area and much of the Pacific Northwest.
Both no-till and direct seed are forms of conservation agriculture that refer to the practice
of minimal tillage or no-tillage that cause between 15-30% of soil disturbance within a
row width (NRCS, 2006), which generally is achieved by the use of farm equipment that
minimizes the area of disturbance during planting and harvesting activities (Friedrich and
Kassam, 2012). Both practices minimize soil erosion by leaving crop stubble and residue
on the ground after harvest, increase soil moisture and organic material, and generally

9
reduce fuel consumption for farmers (Williams and Wuest, 2014). While many of the
economic and environmental improvements of these conservation management
techniques have been significant, interviews with farmers and herbicide distributors in the
county, as well as a review of the National Agricultural Statistics Service (NASS)
database (USDA, 2012), Oregon Department of Agriculture Pesticide Use database
records, and collection of herbicide use records from farmers in the county, all indicate
that herbicide use in the study area has increased since the onset of no-till and direct seed
agriculture (hereafter referred to as no-till). The increased use of herbicides in soils may
be resulting in increased herbicide runoff to streams that is harmful to human and
ecological health. However, no studies have been conducted to determine herbicide
concentrations in streams or to assess the overall effectiveness of no-till since the
majority of the county converted.
Herbicide Use Trends in Conservation Agriculture
Although there are numerous comparative studies focused on differences between
conventional tillage and no-till, no clear consensus has been established regarding the
effect of conservation tillage on herbicide use (Fernandez- Conejo, 2012; Friedrich and
Kassam, 2012). Location, climate, and soil type all affect how long herbicides persist in
the soil when used with reduced tillage systems (Hager and Nordby, 2008). Interviews
and discussions with farmers and herbicide distributors in Wasco County reveal
glyphosate, commonly known as Roundup, is the most commonly used herbicide in the
county among wheat farmers and has been used in increasing amounts since the onset of
conservation management techniques. This increase mimics a nationwide increase of
glyphosate use in the U.S., which is primarily due to the spread of herbicide resistant

10
weeds that have been coproduced with genetically modified crops (Benbrook, 2016;
Culpepper, 2006; Givens et al., 2009; Hembree and Shrestha, 2005; Koger et al., 2004
Powles, 2008; Shesthra et al., 2007). Since 1974 when glyphosate was released to the
market, over 1.6 billion kilograms of glyphosate active ingredient have been applied in
the U.S. alone, and of that, two-thirds of the total volume of glyphosate applied in the
U.S. from 1974 to 2014 has been sprayed in just the last 10 years (Benbrook, 2016). In
2014, the amount of glyphosate that farmers sprayed was enough to apply ~1.0 kg/ha (0.8
pound/ acre) on every hectare of U.S.-cultivated cropland and nearly 0.53 kg/ha (0.47
pounds/acre) on all cropland worldwide (Benbrook, 2016). Between 1996 and 2011, 527
million pounds of herbicides were used in herbicide resistant crops in the U.S. in excess
of what would have been needed in non-resistant crops (Benbrook, 2012). Although
much of the increase in glyphosate is due to the rise of “Roundup Ready” crops that are
resistant to glyphosate damage, the increase in glyphosate is also due to the rise of
conservation tillage practices, such as no-till (Service, 2007).
Farmers in the study area use a variety of glyphosate-based mixtures to control weeds
prior to and after harvest, as well as to control weeds in fallow fields throughout the year.
Because glyphosate is a broad spectrum (e.g. non-selective) systemic herbicide that kills
most herbaceous plants and cannot be used for live crops (Kremer and Means, 2009),
other herbicides (mostly chlorinated herbicides such as 2,4-D and Dicamba) are applied
less frequently to actively growing crops. Glyphosate and chlorinated herbicides are
applied in a number of ways in the study area. Most farmers currently use their own
boom sprayers or other spray devices to deploy herbicides before harvest and throughout
the year to keep weeds under control. In the past, herbicide was frequently deployed by

11
aerial crop dusters and is still sometimes used on a smaller number of farms, but has
fallen out of favor due to expense and lack of precision during spray. Though most
farmers use glyphosate on their fields, there are areas where spraying is avoided, such as
on land that is enrolled in conservation programs like the Conservation Reserve Program
(CRP) or the Conservation Reserve Enhancement Program (CREP) along streams.
Farmers are not supposed to spray CRP/CREP lands, because these lands that are
classified as environmentally sensitive. Generally, farmers try to avoid spray to these
areas, both as a matter of compliance with their program specifications, and as a cost
saving measure.
Concerns About Glyphosate
The concomitant increase in herbicide use, particularly glyphosate, in Wasco County
and the U.S is concerning for several reasons. Glyphosate was once widely believed to be
safe, but an increasing amount of literature is showing that glyphosate is not safe for
human or ecological health (Grandjean, 2014; Porter, 2010; Relyea, 2005; Schinasi and
Leon 2014). In 2003, researchers found that Polyethoxylated tallowamine (POEA), a
surfactant ingredient most often used in Roundup, accounted for more than 86% of
Roundup toxicity on microalgae and crustaceans (Tsui and Chu, 2004). In a 2008 USGS
study, glyphosate was measured at high concentrations in vernal pools and adjacent
flowing waters in Washington, D.C., with the highest concentration of 328 μg/L
exceeding the freshwater aquatic life standard for glyphosate (Battaglin et al., 2009). A
2005 study by Relyea found that Roundup alone is “extremely lethal” to amphibians in
concentrations found in the environment (Relyea, 2005). For human health, a recent and
major review of 44 scientific studies found that glyphosate exposure doubles farmers' risk

12
of developing non-Hodgkin's lymphoma (Schinasi and Leon, 2014). A 2014 study by
Grandjean and Landrigan classified glyphosate and several other pesticides as an
industrial chemical known to be toxic to the human nervous system. Researchers in a
2005 study evaluated associations between glyphosate exposure and cancer incidence in
the Agricultural Health Study (AHS), a cohort study of 57,311 licensed pesticide
applicators, and found that glyphosate had a suggested association with multiple
myeloma (De Roos et al., 2005).
The EPA acknowledges that glyphosate has the potential to contaminate surface
water because it does not readily break down in water or sunlight (EPA, 1993a) but has
still maintained glyphosate’s 1991 EPA classification as a Group E carcinogen (evidence
of non-carcinogenity for humans) (EPA, 1993b). While the EPA has not classified
glyphosate as a probable carcinogen (and even increased levels of acceptable use in
2013), the World Health Organization has classified it as such as of 2015 (IARC, 2015).
Further, a number of critics say that there is no safe dose of glyphosate due to endocrine
disrupting qualities and have stated concerns over its effect on human and ecological
health (Grandjean and Landrigan, 2014; Porter, 2010; Schinasi and Leon, 2014).
Despite generalizations that glyphosate degrades quickly and is strongly adsorbed to
soil (Mamy, 2005), numerous studies show that glyphosate is available to soil and
rhizosphere microbial communities as a substrate for direct metabolism leading to
increased microbial biomass and activity (Haney et al., 2000; Wardle and Parkinson,
1990). In another study, Simonsen et al. (2008) demonstrated that agricultural soils
amended with phosphorus fertilizers show elevated levels of unbound glyphosate as a
result of soil sorption sites being occupied by competing phosphate ions which left

13
glyphosate available for potential uptake by plant roots, microbial metabolism, and/or
leaching into groundwater.
The half-life of glyphosate in soil ranges from 2 to 215 days, and from 2 to 91 days in
aquatic systems (Giesy et al., 2000; Grunewald et al., 2001; NPIC, 2008; Vera et al.,
2010). Microbial processes primarily drive the degradation of glyphosate into another
compound called aminomethylphosphonic acid (AMPA) (Battaglin et al., 2014; Kremer
and Means, 2009). Glyphosate and AMPA are very water soluble, but AMPA degrades
more slowly than glyphosate (Grunewald et al., 2001). AMPA has a soil half-life that
ranges from 60 to 240 days and an aquatic half-life that is comparable to that of
glyphosate (Giesy et al., 2000; Bergstrom et al., 2011). Substantial increases to total
phosphorous in aquatic systems (Vera et al., 2010) can occur as a result of AMPA’s
ultimate degradation to inorganic phosphate, ammonium, and CO2 (Borggaard and
Gimsing, 2008). The main degradation product AMPA is frequently detected in soils
subjected to frequent glyphosate applications (Fomsgaard et al., 2003).
Objectives
While farmers have used a variety of conservation management practices since the
mid- 1980s, none have been as impactful to the environmental quality of the study area as
the switch to no-till, whereby 95% of farm land has been enrolled in no-till practices to
date (NRCS, 2016). No-till was implemented in the county in an effort to conserve soil
and therefore reduce the amount of soil and sediment introduced to streams that created
water quality issues in the area. However, land managers did not thoroughly consider the
implications and effects of how increased herbicide use associated with no-till would
affect environmentally sensitive areas. Therefore, this research attempts to examine areas
14
in the study area that are environmentally sensitive to herbicide increases such as riparian
areas along streams both inside and outside of CRP and CREP conservation easements.
The three main objectives of this study were to 1) determine if there have been changes in
vegetation health in environmentally sensitive areas along streams running through
agricultural property over the past several decades as a result of increased herbicide use
in the study area 2.) determine if there are locations where vegetation health does not
improve and 3) determine what concentrations of herbicides are in soils, sediments, and
surface water in streams in the study area and how they compare to soil and water quality
standards, and human and ecological health studies on herbicides.
Methods
This study was conducted in the Fifteenmile and Eightmile Watersheds of Wasco
County, Oregon (Figure 2.1). A mixed-methods approach was employed to complete the
objectives of this study to determine if increasing herbicide use could be detected in
vegetation along streams within and outside of CREP land and streams adjacent to CRP
land to determine what concentrations of herbicide were present in each sampling
location. The approach involved the following methods:
1. Collection of surface water, soil, and stream sediment samples to obtain
concentration levels of herbicide from agricultural fields and streams running through
agricultural fields over a two-year period from 2015 to 2016. The majority of samples
were analyzed for glyphosate and its derivative product AMPA. A one-time sampling
event of chlorinated acid herbicides was also conducted. Soil and sediment samples were
also analyzed for physical and chemical properties that are known to influence herbicide
concentration and persistence. The majority of sample collection took place in the

15
Fifteenmile Watershed, because the majority of wheat farms are located in this area of the
county.
2. Analysis of remotely sensed imagery of vegetation health collected by Landsat
satellites 5TM, which collected 30-meter resolution satellite data of the earth’s surface
from 1982 to 2012, and from the Landsat 7 TM+ satellite which collected the same type
of imagery from 1999-2016 (NASA, 2017). Imagery was classified into vegetation health
categories (described below) and analyzed for changes and trends in vegetation health
over that time period.
3. Sample collection using imagery collected by a drone fitted with an agricultural
camera to detect herbicide drift and overland runoff from farm fields to vegetation in and
near streams in locations where herbicide should not be present (e.g. CREP land or land
adjacent to CRP fields). This method was used to determine if vegetation that was
stressed or unhealthy could be detected during field collection. It also worked as a
ground-truth to the Landsat satellite imagery that was at a much coarser resolution than
the resolution of the imagery collected by drone (typically between 5 to 15 cm
resolution). Vegetation values obtained by drone were compared to the values collected
in remotely sensed imagery data to assess the accuracy of vegetation health categorized
in Landsat imagery.
Details on the methodologies are discussed below.
Herbicide Sampling
According to herbicide distributors and all of the farmers involved in the study,
farmers have to spray their fields with herbicide at least twice a year, and most spray
between two and four times a year. The most common time for herbicide applications are

16
in spring (May) before summer harvest, in the summer on fallow fields (July and
August), and then again in the fall right before, or as farmers are planting, their seed
(September). Glyphosate is the herbicide of choice for fallow fields and may be applied
during all of the aforementioned months in fallow fields. Glyphosate cannot be applied in
actively growing fields because of its non-selective formulation, and farmers use
chlorinated herbicides such as 2,4-D and Dicamba that will not damage crops that are
alive during application of herbicide. While it would have been ideal to collect as many
chlorinated herbicide samples as glyphosate and AMPA, sampling for all compounds was
cost prohibitive to this study. Therefore, collection of chlorinated herbicide samples was
limited to surface water in streams and in soil or sediment near streams, and was only
collected during one sampling event in July.
October 2015 Glyphosate and AMPA Samples
Sample collection for herbicides began in the fall of 2015. Herbicide samples were
not collected in September due to difficulties with access to fields/streams that arose from
farmers simultaneously planting seed and spraying herbicide during that time. Therefore,
the first year that samples were collected, samples were collected in early October 2015.
Sample locations for all months are shown in Figure 2.1. Five sediment and eight water
samples were collected from streams running across six different farm properties.
Samples were analyzed for glyphosate and AMPA and were collected inside and outside
of CRP/CREP lands to assess if there were any differences in herbicide concentration
between lands that were or were not protected.

17
Figure 2.1 Study area showing locations of soil, sediment, and surface water samples in the Fifteen
and Eightmile Watershed of Wasco County (shown in gray). Samples were collected and analyzed for
glyphosate, AMPA, and chlorinated herbicides during the years 2015 and 2016.
At each location, water was collected upstream of the person sampling prior to
disturbing the sediment in the stream for sediment collection by placing a laboratory
approved certified clean bottle into the stream and allowing it to fill with water. Once the
water sample had been collected, the sediment from the streambed was collected by
either a 2 inch diameter PVC tube that was decontaminated prior to use with Alconox and
deionized (DI) water or a shovel that was decontaminated in the same way. The selection
of the method to use depended on flow conditions in the stream and depth that could be
obtained by each instrument. The soil/sediment samples taken from 0 to 30 centimeters

18
below ground surface were loosened with the sampling instrument and placed in lab
assigned, certified clean sampling jars. Each sampling location was recorded with a
Trimble Juno GPS unit.
May 2016 Co-located Glyphosate and AMPA Samples
Seventeen samples comprised of eight sediment and nine water samples were
collected from stream channels throughout the study area that would most represent
waterways affected by no-till farming. Samples were collected with the same collection
procedures as those collected in October 2015. Samples were collected inside and outside
of CRP/CREP and were analyzed for glyphosate and AMPA.
July 2016 and August 2016 Glyphosate, AMPA, and Chlorinated Herbicide Samples
Twenty six soil and sediment samples and ten water samples were collected from five
hillslopes and their adjacent streams on each farm property in the study area and analyzed
for glyphosate, AMPA, and chlorinated herbicides. Transects representing the top,
middle, and toeslope positions of the hillslope were used for composite sampling (Figure
2.2). Along each hillslope transect, between four and five discrete soil samples,
depending on the size of the hillslope (Zapata, 2003), were collected from a depth of 0 to
30 cm and composited into one sample representing its respective transect. This depth
was chosen because it represents the portion of the soil that is most likely to move with
overland flow (Zapata, 2003). A separate transect representing the in-stream sediment
that drained the depositional area of the hillslope (i.e. the area that would capture runoff
from the hillslope above) was also sampled on each property. Samples collected along
transects in in-stream sediment were discrete and not composited. In total, four transects
(representing top, middle, toe, and in-stream channel) were devised for each property.

19
Figure 2.2 Photo demonstrating sampling scheme for herbicide sampling on hillslopes and adjacent
streams. Discrete samples along transects were composited into one sample for each transect line. Samples
collected in streams were not composited, but were collected in the area of natural drainage from the
hillslope above.
Sampling Equipment Decontamination and Laboratory Methods
Prior to initial use and between sample locations, all non-dedicated sampling
equipment used for sample collection was rinsed with DI water, brushed with DI water
and Alconox soap, and rinsed and sprayed with DI water again before use. Collected
surface water, soil, and sediment samples were placed in certified clean, glass amber
bottles for glyphosate/AMPA and clear glass bottles for chlorinated herbicides
recommended by the laboratories analyzing the samples. Samples were labeled, placed
on ice in an insulated cooler, and delivered to a private environmental laboratory with
accreditation by the National Environmental Laboratory Accreditation Program (NELAP)
or to the USGS National Water Quality Lab in Lawrence, Kansas. For glyphosate and

20
AMPA, both the private laboratory and USGS laboratory used liquid chromatography/
mass spectrometry method LCGY (https://ks.water.usgs.gov/lcgy) to analyze water
samples, with a method detection limit (MDL) of 0.02 micrograms per liter (µg/L). The
USGS Liquid Chromatography Mass Spectrometry method LCGS
(https://ks.water.usgs.gov/current-analytical-methods) for soil and sediment was used to
analyze soil and sediment samples, with a MDL of 0.02 micrograms per kilogram (µg/kg)
and 1 (µg/kg). For chlorinated acid herbicides, EPA Method 515.3 was used by the
private laboratory to analyze the samples with an MDL of 0.1 (µg/L) for water and an
MDL that ranged between 0.0194 to 0.0198 milligrams per kilogram (mg/kg) for soil and
sediment.
Soil Quality Indicator Samples
Like most herbicides, persistence and degradation of glyphosate, AMPA, and
chlorinated herbicides depends on the physical and chemical characteristics of soil or
sediment to which it is applied (Kremer, 2009; Simenson, 2008). Therefore, a portion of
each soil and sediment sample from 2015 and 2016 were dedicated to analysis for
physical and chemical soil quality indicators including pH, total exchange capacity,
organic matter, soluble salts (salinity), phosphorous content, and also for soil texture to
determine if any soil properties had an influence on herbicide concentrations or if any
correlative patterns could be deduced. Samples analyzed for physical and chemical
characteristics were analyzed either at Portland State University in a soils lab or at the
private laboratory Brookside Laboratory, Inc. Soils were analyzed for physical analysis
(soil texture) by Hydrometer Method ASTM D422, 2007 and for chemical characteristics

21
by Brookside method S005 for Bray II phosphorus, soluble salts, and pH, Organic
Matter, Total Exchange Capacity, Soluble Salts, and Mehlich III Extractable P.
Spatial Analysis- NDVI Remote Sensing Analysis
One of the primary goals of this study was to deduce whether or not herbicide drift
and runoff have been affecting vegetation health near streams since no-till agriculture
became the primary form of agriculture in the study area. Because it would be
impossible to retroactively sample water, sediment, and soil for trends in increasing or
decreasing herbicide concentration, the Normalized Difference Vegetation Index (NDVI)
was used to determine if herbicide drift and runoff to stream corridors with riparian
vegetation varied with practices in conservation management techniques and programs
practiced in the study area. The working assumption of this research was that if herbicide
use has increased since no-till became widely practiced, then herbicide drift during
application (known to be a problem in the study area to some sensitive crops) and
herbicide runoff from overland flow to riparian vegetation near streams would also
increase as well. Most farmers in the study area have either enrolled riparian stream areas
crossing their properties into CREP, which creates a buffer around streams to protect
environmentally sensitive species, and/or have pro-actively planted vegetation near
streams to prevent erosion from field runoff since the early 2000s when no-till was also
widely spreading throughout the county.
The NDVI can detect vegetation that is dead or stressed from vegetation spray or
runoff from agricultural fields (Henry et al., 2004). It is a commonly used and well-
established method (Griffith, 2002; Henry et al, 2004; Trivero, 2013) to determine
vegetation health in a variety of environments and is a defined ratio of the near-infrared

22
and visible spectral bands from remote sensing imagery. NDVI is calculated as: NDVI =
(NIR-RED)/(NIR+RED). Index values range from -1 to +1 where open water is the most
negative, concrete, rock and bare ground are close to 0, and healthy dense vegetation is
close to +1 (NASA, 2016; Trivero, 2013). NDVI can be derived from any imagery with
a red and a near-infrared spectral band, but due to the spatial and temporal resolution and
the history and availability of its data, Landsat imagery is one of the best sources for
monitoring long-term and ongoing landscape trends at a fairly high spatial resolution
(Wulder et al. 2012). Higher greenness values, especially during the late growing season
when water availability is limited, indicate healthy vegetation (Griffith, 2002).
In the study area and much of the Pacific Northwest, the late growing season in the
study area is July and early August (Small et al., 1990). Therefore, imagery from the last
two weeks of July from Landsat 5TM satellites and the Landsat 7TM+ satellite was
downloaded and analyzed for vegetation health representing the past 30+ years in the
study area. To determine if vegetation health in riparian areas had been affected by
conservation practices, 100-foot buffers of vegetation along riparian stream corridors
were extracted from Landsat images from years when conservation practices and no-
till/direct seed were likely to affect stream vegetation: 1986, 1990, 1994, 1996, 2000,
2003, 2006, 2008, and 2011, 2015 to 2016. The width of 100 feet was chosen because it
is the average buffer width of CREP land in the state or Oregon (DEQ, 2010, U.S. Fish
and Wildlife Service, 2009). Table 2.1 shows a variety of conservation programs that
have been practiced in the study area that were driven by farm bills passed since 1985.
The year 1986 was chosen as the start date for analysis of imagery because it occurred

23
after the first year that sweeping conservation efforts were made in 1985 to most of the
study area.
Table 2.1 Farm Bills and conservation programs that influenced agricultural practices in the
Eightmile and Fifteenile Watersheds. Conservation programs influenced vegetation health near streams
and water quality in agricultural landscapes by reducing soil erosion, changing herbicide practices, and
encouraging enrollment in programs that maintain stream health. The programs in the table were widely
practiced in the watersheds of the study area and likely influenced vegetation health and stream quality in
and near streams.
Year Farm Bill Title or Conservation
Agriculture Program Implemented
Impact to Farms
1985 Food Security Act of 1985 Conservation
Reserve Program (CRP) established
Multiple conservation efforts to reduce soil
erosion, including strip-cropping/ divided slope
systems. Some farmers take land out of
production and set aside in CRP contracts for
payment. The 1990 bill changed CRP by
expanding the list of eligible lands for contract
to include marginal pasture lands converted to
wetlands and allowed marginal pasturelands to
be devoted to trees in or near riparian areas, and
lands that may cause an environmental threat to
water quality.
1990 Food, Agriculture, Conservation and Trade
Act of 1990
1996 Federal Agricultural Improvement and
Reform Act of 1996. Conservation
Reserve Enhancement Program (CREP)
established. Environmental Quality
Incentives Program (EQIP) established.
Conservation practices extend to land
surrounding streams and riparian areas. Some
farmers receive payments from EQIP program
for enrolling land into no-till agriculture and for
establishing riparian vegetation buffers along
streams that run through agricultural land.
Farmers able to purchase equipment needed for
no-till agriculture.
2000-
2002
Farm Security and Rural Investment Act of
2002. Conservation Security Program
(CSP) established.
CSP continues to provide financial and technical
assistance to promote the conservation and
improvement of soil, water, air, energy, plant
and animal life, and significant provisions for
conservation purposes. In this time period most
farmers convert to no-till in the county.
2008 Food, Conservation, and Energy Act of
2008. Agricultural Water Enhancement
Project (AWEP) established.
Reinforced conservation programs. AWEP
provision places more emphasis on water
conservation through changing irrigation
practices in the county.
2014 Agricultural Act of 2014 Conservation practices continue to be
reinforced. Not much is changed in no-till
practices in the county.
Once vegetation in 100 foot buffered areas near streams were extracted from the
Landsat multispectral imagery, the Image Analysis toolbar in ArcMap was used to
convert the imagery into NDVI images. The NDVI index vegetation categories of not

24
vegetation (all values below 0.1), sparse vegetation (0.1 to 0.2), moderate vegetation
health (0.2 to 0.55), and very healthy vegetation (0.55 to 1.0) were assigned to each
image (Herring and Weier, 2000). These NDVI values represent the typical range of
healthy vegetation in many environments around the world (Herring and Weier, 2000)
and were found to be consistent with the health of vegetation in the study area. Inspection
of one-meter resolution National Agriculture Imagery Program (NAIP) aerial imagery
verified that values in each NDVI category typically matched the vegetation health
assigned in the satellite imagery. Once the satellite images were classified into the
vegetation health categories, change detection statistics were performed in the software
program ENVI. Change detection statistics were used to calculate the changes that
occurred between each progressive year and also to determine the initial and final stages
of vegetation health from year to year.
Drone Sample Site Selection and Field Verification
Landsat imagery provided useful historical analysis of vegetation health that may
have been impacted by herbicide drift and runoff (and was the only option to detect how
often it occurred in the past). However, the use of an Unmanned Aerial Vehicles (UAV),
commonly referred to as a drone, in the field provided a finer scale resolution of
vegetation stress caused by herbicide drift and runoff than could be provided with
satellite imagery alone. The drone was also useful for determination of vegetation health
at the time of sample collection. The use of drones has been significantly increasing in
the past few years to monitor crop health and crop spraying of various agrochemical
inputs (Estrin, 2015; Hunt, 2010). For this study, a DJI Phantom 4 drone fitted with a
NDVI-7 optical grade glass narrow multi-band filter camera lens was used to capture

25
images of possibly stressed vegetation during May and July 2016 when crops had
recently been sprayed. At each stream that was sampled, the drone (fitted with a GPS
unit) was flown over stream segments comprised of a mixture of healthy, dead, and
stressed vegetation. After flights were completed, the imagery obtained from the drone
was downloaded, georeferenced, and post processed for NDVI values using the Image
Classification Tool in ArcMap software to ground-truth vegetation values. Images taken
by drone were mosaicked together in ArcMap into an area that covered the same spatial
extent covered by Landsat satellite imagery.
To determine how similar NDVI values collected by drone were to those collected by
satellite, NDVI pixel values from vegetation (e.g. trees, low lying grasses, and shrubs
near streams) were randomly selected using the ArcMap Data Management Tool “Create
Random Points” within ten image locations near streams (Figure 2.3). Thirty random
points were generated within the 100-foot boundary of riparian vegetation for each
location where drone imagery had been collected and where samples were taken. The
average vegetation values for the cells in the random point locations in drone imagery
were compared to the values of the vegetation in the cells of the satellite imagery to
determine how closely the values in each type of imagery resembled one another.
While images were taken in May and July of 2016, only drone images collected
during the month of July were compared for NDVI values of satellite images because of
the phenological growth stage of vegetation in July. Since late July and early August are
the months for peak biomass growth in vegetation in the study area (Small et al., 1990),
images from this time period were likely the most useful for vegetation health analysis.

26
The use of the drone during May assisted in identifying sample locations in areas where
vegetation stress from herbicide spray could not be seen with the naked eye.
NDVI Drone Imagery
Figure 2.3 An example of drone imagery used to verify NDVI values. The image on the left shows a
picture of a riparian area that was collected by the NDVI-7 camera on the drone. With the raw NDVI
image, green healthy vegetation appears in yellow/orange/gold while other surrounding surfaces and dead
or stressed vegetation appears in grey or brown. The raw NDVI image must be post-processed to obtain
the actual NDVI values, which the image on the right shows. Some aquatic plants in the stream display as
green (very healthy vegetation) in the post-processed image. The small black dots in the image represent
the random sampling points that were generated to verify NDVI pixel values between images collected by
drone and images collected by Landsat Satellite.
Results/Discussion
NDVI Analysis of Satellite Imagery 1986 to 2016
Figure 2.4 shows the trend in vegetation health from 1986 to 2016 in both the
Fifteenmile and Eightmile Watersheds. In general, the trend for very healthy vegetation
10 0 105 Meters 10 0 105 Meters
NDVI Values

27
(0.55 or higher on the NDVI scale), declined from 1986 to 1996 and then steadily rose
from 1996 to 2011. Moderately healthy vegetation (0.2 to 0.55 on the NDVI scale)
fluctuated slightly in the amount retained from the mid- 30th percentile to mid to upper
40th percentile, but retained the same general health over the whole period from 1986 to
2011. Unhealthy or sparse vegetation health (0.2 to 0.55) decreased from 1986 to 1996,
increased between 1996 and 2003, and then decreased to levels near the previous 1986
level in 2011. Post 2011, a sharp decline in all vegetation health categories (except the
not vegetation category) occurred due to severe droughts in Oregon in the years 2014 and
2015. In this year, the areas classified as not vegetation increased from below 20% of
vegetation to over 80%.
Figure 2.4 Changes in Vegetation Health from 1986 to 2016. The trend lines in the graph show how
vegetation has changed during the years when farmers were most active in conservation programs in the
study area. Over time, vegetation health has generally improved especially in comparison to vegetation
health prior to no-till agriculture.
The vegetation health in various segments of riparian areas that changed over time is
shown in Figure 2.5, which shows Landsat imagery of the streams in the Fifteenmile and
Eightmile Watersheds classified by NDVI value. These images make it clear that
0.00%
10.00%
20.00%
30.00%
40.00%
50.00%
60.00%
70.00%
80.00%
0
5000000
10000000
15000000
20000000
25000000
30000000
35000000
40000000
45000000
50000000
1980 1985 1990 1995 2000 2005 2010 2015 2020
Are
a (S
q. M
eter
s)
Changes in Vegetation Health 1986 to 2016
Not Veg (-0.4 to 0.1) Sparse Veg (0.1 to 0.2)
Moderate Veg (0.2 to 0.55) Very Healthy Veg (0.55+)

28
vegetation health in the areas near streams were heavily influenced by conservation
programs that influenced runoff- carrying herbicide to streams and increases in protected
riparian areas enrolled in CREP. Especially significant are the years from the late 1990s
to early 2000s when large swaths of CREP riparian areas were planted and no-till was
becoming widespread in the county. During the 1996 to 2000 period, vegetation health in
the very healthy category increased by almost 20%.

29
Stream Health Changes 1986 to 2016
1986 1990
1994 1996

30
1998 2000
2003 2006

31
2008 2011
2015 2016
Figure 2.5 The changes in vegetation health within a 100 foot buffer area from 1986 to 2016. Stream
segments in red indicate areas without vegetation (not vegetation category), stream segment in blue
indicate sparse vegetation, stream segments in yellow indicate moderate vegetation health, and stream
segments in green indicate very healthy vegetation.
To fully understand if vegetation health improved or declined overall, it was also
useful to look at the initial vegetation health category versus the final vegetation health
category of areas along streams. The information was derived by examining the series of
stream health changes from 1986 to 2016 in Figure 2.5 and by examining the graphs in
Figures 2.6 through 2.9. For example, in Figure 2.6, slightly less than 10 million m2 of
vegetation in the not vegetation category remained categorized as not vegetation between

32
1986 and 1990. Significantly less vegetation in the not vegetation category converted to
the sparse vegetation, moderate vegetation, and very healthy vegetation categories. The
majority of vegetation in the moderate vegetation category remained as such between the
same period of time, with approximately 25 million m2 of vegetation.
Figure 2.6 Changes between vegetation types (1986 to 1990).
0
5,000,000
10,000,000
15,000,000
20,000,000
25,000,000
30,000,000
Not Veg (-0.4 to 0.1) Sparse Veg (0.1 to 0.2) Moderate Veg (0.2 to
0.55)
Very Healthy Veg
(0.55+)
AR
EA
(M
2)
INITIAL (1986) VS FINAL (1990) VEGETATION TYPE
Changes Between Vegetation Types (1986 TO 1990)
Not Veg (-0.4 to 0.1) Sparse Veg (0.1 to 0.2)
Moderate Veg (0.2 to 0.55) Very Healthy Veg (0.55+)

33
Figure 2.7 Changes between vegetation types (1990 to 1994).
Figure 2.8 Changes between vegetation types (1998 to 2000).
0
5,000,000
10,000,000
15,000,000
20,000,000
25,000,000
Not Veg (-0.4 to 0.1) Sparse Veg (0.1 to 0.2) Moderate Veg (0.2 to
0.55)
Very Healthy Veg
(0.55+)
AR
EA
(M
2)
INITIAL (1990) VS FINAL (1994) VEGETATION TYPE
Changes Between Vegetation Types (1990 TO 1994)
Not Veg (-0.4 to 0.1) Sparse Veg (0.1 to 0.2)
Moderate Veg (0.2 to 0.55) Very Healthy Veg (0.55+)
0
5,000,000
10,000,000
15,000,000
20,000,000
25,000,000
Not Veg (-0.4 to 0.1) Sparse Veg (0.1 to 0.2) Moderate Veg (0.2 to
0.55)
Very Healthy Veg
(0.55+)
AR
EA
(M
2)
INITIAL (1998) VS FINAL (2000) VEGETATION TYPE
Changes Between Vegetation Types (1998 TO 2000)
Not Veg (-0.4 to 0.1) Sparse Veg (0.1 to 0.2)
Moderate Veg (0.2 to 0.55) Very Healthy Veg (0.55+)

34
Figure 2.9 Changes between vegetation types (2008 to 2011).
The figures demonstrate that streams that were formerly in lower vegetation health
categories initially increased in the 1980s and early 1990s, particularly from 1986 to 1990
and 1990 to 1994, showing that stream health was in general decline during these years
when conservation programs were in the early stages of introduction in the study area.
The 1998 to 2000 period shows a dramatic improvement in vegetation near streams that
were formerly in the not vegetation category in 1994. This improvement can likely be
attributed to the large amount of streams that were enrolled in CREP due to the 1996
farm bill. Conversations with farmers and a list of streams and dates from the local Soil
and Water Conservation District (SWCD) showed that the majority of streams in the
study area were enrolled into CREP in the late 1990s (e.g. 1996/1997) and also in the
early 2000s from 2001 to 2003. Record flooding in early 1996 also likely contributed to
increases in vegetation health. Several agency employees in the watershed indicated that
vegetation health along streams improved after the flood. The trend in vegetation health
0
5,000,000
10,000,000
15,000,000
20,000,000
25,000,000
Not Veg (-0.4 to 0.1) Sparse Veg (0.1 to 0.2) Moderate Veg (0.2 to
0.55)
Very Healthy Veg
(0.55+)
AR
EA
(M
2)
INITIAL (2008) VS FINAL (2011) VEGETATION TYPE
Changes Between Vegetation Types (2008 TO 2011)
Not Veg (-0.4 to 0.1) Sparse Veg (0.1 to 0.2)
Moderate Veg (0.2 to 0.55) Very Healthy Veg (0.55+)

35
improvement continued incrementally, culminating in the 2008 to 2011 data that shows
vegetation health increasing dramatically (Figure 2.9).
The graph comparing 2011 to 2015 (Figure 2.10) for both the Fifteenmile and
Eightmile Watersheds shows significant declines in vegetation health. The year 2015 was
classified as a drought year in Oregon and, therefore, it is not surprising that vegetation
health was in decline during this year. PRISM precipitation data and temperature data
(PRISM, 2017) (Figures 2.11 through 2.16) show that precipitation was lower during the
year 2015 and it was also the hottest year on record in approximately 30 years.
Examination of the graphs reveal that while precipitation was low in 2015 and likely
contributed to vegetation stress during that year, the sharp decline in vegetation health
was more likely attributed to the high temperatures of that year more than precipitation.
For example, the year 2003 received even less precipitation than the year 2015 and
vegetation health still improved during that year. Further, sharp increases in temperature
occurred during the month of June in 2015, and July temperatures were elevated as well.
It should also be noted that a large portion of the vegetation near streams was
classified in the not vegetation category during 2011 to 2015 and 2015 to 2016 in the
satellite imagery, which is somewhat misleading. An inspection of the NAIP imagery and
experience from field work during these years revealed that the pixels in the satellite
imagery were assigned to the majority value of the NDVI pixels in the imagery, which
cover a cell of 30 x 30 m. While the vegetation in riparian areas was definitely stressed
during the drought year, to say that no vegetation was present is not accurate. Vegetation
in riparian areas during the year 2015 was present, but was not as dense as in previous
years and more dead vegetation was present. More bare rock and soil (e.g. the not

36
vegetation category) was exposed within the riparian area during this year and the
majority value of NDVI values for those bare surfaces were assigned to the cells
representing the riparian areas in the watershed. Therefore, the drastic change between
2011 and 2015 and 2016, is more representative of a large amount of dead and stressed
vegetation exposing bare rocks and soil, rather than there being no vegetation at all.
Figure 2.10 Changes between vegetation types (2011 to 2015).
Figure 2.11 Annual precipitation in Wasco County, OR.
0
5,000,000
10,000,000
15,000,000
20,000,000
25,000,000
30,000,000
Not Veg (-0.4 to 0.1) Sparse Veg (0.1 to 0.2) Moderate Veg (0.2 to
0.55)
Very Healthy Veg
(0.55+)
AR
EA
(M
2)
INITIAL (2011) VS FINAL (2015) VEGETATION TYPE
Changes Between Vegetation Types (2011 TO 2015)
Not Veg Sparse Veg Moderate Veg Very Healthy Veg
0
5
10
15
20
25
30
35
198
5
198
6
198
7
198
8
198
9
199
0
199
1
199
2
199
3
199
4
199
5
199
6
199
7
199
8
199
9
200
0
200
1
200
2
200
3
200
4
200
5
200
6
200
7
200
8
200
9
201
0
201
1
201
2
201
3
201
4
201
5
Pre
cip
itat
ion (
inch
es)
Year
Annual Precipitation in Wasco County, OR

37
Figure 2.12 June monthly precipitation in Wasco County, OR.
Figure 2.13 July monthly precipitation in Wasco County, OR.
0
0.2
0.4
0.6
0.8
1
1.2
1.41.6
1.8
2
198
5
198
6
198
7
198
8
198
9
199
0
199
1
199
2
199
3
199
4
199
5
199
6
199
7
199
8
199
9
200
0
200
1
200
2
200
3
200
4
200
5
200
6
200
7
200
8
200
9
201
0
201
1
201
2
201
3
201
4
201
5
201
6
Pre
cip
itat
ion (
inch
es)
Year
June Monthly Precipitation in Wasco County, OR
0
0.2
0.4
0.6
0.8
1
1.2
1.4
1.6
198
5
198
6
198
7
198
8
198
9
199
0
199
1
199
2
199
3
199
4
199
5
199
6
199
7
199
8
199
9
200
0
200
1
200
2
200
3
200
4
200
5
200
6
200
7
200
8
200
9
201
0
201
1
201
2
201
3
201
4
201
5
201
6
Pre
cip
itat
ion (
inch
es)
Year
July Monthly Precipitation in Wasco County, OR

38
Figure 2.14 Annual mean temperature in Wasco County, OR.
Figure 2.15 June monthly mean temperature in Wasco County, OR.
Figure 2.16 July monthly mean temperature in Wasco County, OR.
44
46
48
50
52
54
198
5
198
6
198
7
198
8
198
9
199
0
199
1
199
2
199
3
199
4
199
5
199
6
199
7
199
8
199
9
200
0
200
1
200
2
200
3
200
4
200
5
200
6
200
7
200
8
200
9
201
0
201
1
201
2
201
3
201
4
201
5
Tem
per
ature
(°F
)
Year
Annual Mean Temperature in Wasco County, OR

39
In some locations, stream health never improved between 1986 and 2011, regardless
of temperature and precipitation changes (Figure 2.17). Vegetation that fell into the
always unhealthy not vegetation category accounted for approximately 732,000 square
meters of vegetation, which is approximately 1.3% of the 55,566,000 square meters of
vegetation in the Fifteenmile and Eightmile Watersheds in the 100 foot buffer area
surrounding streams. These locations were mostly located in the eastern portion of
unnamed tributary streams of the Fifteenmile Watershed. Analysis of aerial imagery in
these locations shows that areas that did not improve were often located in the following
locations: at the steep termination areas between two farm fields that had little stream
vegetation; in locations where steep, rocky cliffs make vegetation growth difficult in
general; in locations where only ephemeral streams occur in the wettest years; or in
locations along roads or near overpasses where vegetation historically does not grow well
or is managed by road crews.
Two samples (samples SD-1 and SD-11) were collected within areas that remained
unhealthy between 1986 and 2016. The concentrations of glyphosate in the sediment of
these samples were 1.9 µg/kg and 13 µg/kg respectively, and AMPA concentrations were
13 µg/kg and 22 µg/kg. Other samples were not collected within areas that consistently
have remained unhealthy between 1986 to 2016, but further investigation into these areas
would be warranted given that many of these areas share many characteristics of other
riparian areas with healthy vegetation.
It is unlikely that vegetation that remains in the unhealthy vegetation categories
remains as such because of drought conditions or vegetation variety. If weather patterns
were affecting the areas that consistently had unhealthy vegetation, they would likely

40
improve during at least some of the years when other vegetation improved as well.
Further, many of the persistently unhealthy locations are comprised of vegetation
varieties that are similar to other locations throughout the watershed with similar corridor
widths and healthy vegetation.
Based on ground-truth images collected with the drone, herbicide persistence is likely
the cause of persistent unhealthy vegetation. The drone was flown in locations that
showed signs of recent herbicide spray in many locations throughout the watershed and
in the two sample locations (SD-1 and SD-11) that were collected in the consistently
unhealthy vegetation category. Many of the ground-truthing flights took place in the
areas between riparian vegetation and the field, where farmers usually spray to keep
weeds from creeping into crop areas. NDVI vegetation values for vegetation that was
intentionally sprayed with herbicide and those in or near the stream (that should not have
been sprayed) were within 5% of each other. The similarity in values between sprayed
vegetation and riparian areas within proximity to the spray would indicate that either
some herbicide drift had occurred, or that runoff to the stream had occurred and had
affected vegetation health.
As will be discussed shortly, glyphosate and AMPA were found in the majority of
stream sediment and water samples throughout the watershed, including in locations that
never improved in vegetation health. This would indicate that although vegetation health
has improved in riparian areas in the watershed overall, glyphosate and AMPA are still
making their way into streams in the watershed. Hence, the widespread persistence and
effects of glyphosate and AMPA are likely contributing factors to the persistence of

41
unhealthy vegetation in these locations that otherwise seem to be ideal for healthy
vegetation growth.
Riparian Areas that Remained Unhealthy 1986 to 2016
Figure 2.17 Areas that remained unhealthy between 1986 and 2016. The areas shown in red never
improved in stream health and account for 1.3% of the vegetation in riparian areas within 100 feet of
streams.
NDVI Analysis with Drone 2016
The drone proved to be useful in selecting locations that were stressed during field
collection in May and June 2016. The camera was able to detect varying ranges of
vegetation health that were not visible to the naked eye and aided in choosing sites for

42
sampling of herbicides. An overlay of sample locations with NDVI post processed
imagery typically revealed vegetation in the sparse vegetation health category range of
0.1 to 0.2.
The NDVI values from 2016 Landsat 7TM imagery were compared with NDVI
values in images collected by drone in order to act as a ground-truth to see how closely
NDVI values matched. The images were mosaicked into areas representing the vicinity
of the satellite imagery cells in the Landsat imagery and randomly sampled as described
in the Methods section of this paper. Once random sampling was performed and the
average of the drone imagery was calculated and compared to satellite imagery of the
same spatial extent, it was found that the NDVI values between the two types of imagery
only varied between 1-5%, indicating that vegetation health was accurately assessed by
the satellite imagery. The NDVI imagery and classification products of Landsat satellites
5TM and 7TM are very similar, and data from the two sensors can be used
interchangeably to measure and monitor the same landscape phenomena (Vogelman, et
al., 2001).
Herbicide Concentrations and Analysis
As mentioned previously, glyphosate and AMPA samples were collected in October
2015, May 2016, and July 2016/August 2016 (Tables 2.2 through 2.4). Chlorinated
herbicide samples were collected only during July 2016 due to budgetary restrictions for
sample collection. In all sample locations, chlorinated herbicides were not detected above
the MDL of 0.1 micrograms per liter in water (µg/L) or above the MDL for soil and
sediment which ranged between 0.0194 to 0.0198 mg/kg, therefore, the data for the
chlorinated herbicide samples is not shown or further discussed.

43
Glyphosate and/or AMPA was detected in the majority of samples collected in all
media. Simple linear regressions were used to determine if there were any significant
differences between concentrations within CRP/CREP boundaries versus those outside of
conservation corridors and none were found. In water, glyphosate was detected in 15 of
the 27 samples collected and concentrations ranged from 0.02 to 0.11 µg/L. In sediment,
glyphosate was detected in 14 of 24 samples collected with detections that ranged from
0.024 µg/kg to 240 µg/kg. In samples collected from soils on fields, glyphosate was
detected in 8 of the 15 samples collected and detections ranged from 0.02 to 0.076 µg/kg.
Glyphosate’s derivative product AMPA was detected in 19 of the 27 samples collected
for water and concentrations ranged from 0.02 to 0.2 µg/L. In sediment, AMPA was
detected in 15 of the 24 samples collected with detections that ranged from 0.023 to 290
µg/kg. Finally, AMPA was detected in 10 of the 15 samples collected in field soils with
concentrations that ranged from 0.022 to 0.076 µg/kg. All glyphosate and AMPA results
are shown in Tables 2.2 through 2.4.

44
Table 2.2 Detections of glyphosate and AMPA in Water. Detections above the MDL are indicated in
bold.
Sample Name Date Collected
Sample
Type
Glyphosate
Result (ug/l)
AMPA
Result (ug/l)
Within
CRP/CREP?
W1 10/5/2015 Water 0.11 0.03 Yes
W2 10/5/2015 Water 0.03 0.02 Yes
W3 10/6/2015 Water <0.02 <0.02 Yes
W4 10/6/2015 Water 0.04 0.20 Yes
W5 10/6/2015 Water 0.07 0.02 No
W6 10/6/2015 Water 0.04 0.03 No
W7 10/6/2015 Water 0.03 0.02 Yes
W8 10/6/2015 Water 0.03 0.02 No
W9 5/27/2016 Water <0.02 0.02 No
W10 5/27/2016 Water 0.08 0.05 No
W11 5/27/2016 Water 0.02 <0.02 Yes
W12 5/27/2016 Water 0.02 <0.02 No
W13 5/27/2016 Water 0.04 0.05 Yes
W14 5/28/2016 Water <0.02 0.02 Yes
W15 5/28/2016 Water 0.05 0.09 Yes
W16 5/28/2016 Water <0.02 0.02 No
W17 5/28/2016 Water 0.02 <0.02 Yes
W18 7/17/2016 Water 0.021 0.027 Yes
W19 7/17/2016 Water < 0.02 0.047 No
W20 7/18/2016 Water 0.095 0.034 No
W21 7/18/2016 Water < 0.02 0.04 No
W22 7/25/2016 Water < 0.02 < 0.02 No
W23 7/25/2016 Water < 0.02 < 0.02 Yes
W24 7/26/2016 Water < 0.02 0.021 Yes
W25 7/26/2016 Water < 0.02 < 0.02 Yes
W26 7/27/2016 Water < 0.02 0.025 Yes
W27 8/23/2016 Water < 0.02 < 0.02 No

45
Table 2.3 Detections of glyphosate and AMPA in sediment. Detections above the MDL are indicated in
bold.
Sample Name
Date
Collected Sample Type
Glyphosate
Result
(ug/kg)
AMPA Result
(ug/kg)
Within
CRP/CREP?
SD-1 10/5/15 Sediment 1.9 13 Yes
SD-2 10/5/15 Sediment 11 64 Yes
SD-3 10/6/15 Sediment < 1.0 < 1.0 Yes
SD-4 10/6/15 Sediment 25 28 Yes
SD-5 10/6/15 Sediment 240 290 Yes
SD-6 5/27/16 Sediment < 1.0 4.7 No
SD-7 5/27/16 Sediment 3.5 4.6 No
SD-8 5/27/16 Sediment < 1.0 2.2 Yes
SD-9 5/27/16 Sediment 16 18 No
SD-10 5/27/16 Sediment 19 25 Yes
SD-11 5/28/16 Sediment 13 22 Yes
SD-12 5/28/16 Sediment 170 160 Yes
SD-13 5/28/16 Sediment 9.1 < 1.0 Yes
SD-14 7/25/16 Sediment < 0.02 < 0.02 Yes
SD-15 7/26/16 Sediment 0.036 0.079 Yes
SD-16 7/26/16 Sediment < 0.02 0.023 Yes
SD-17 7/27/16 Sediment < 0.02 0.025 Yes
SD-18 7/27/16 Sediment < 0.02 < 0.02 No
SD-19 7/16/16 Sediment 0.032 < 0.02 Yes
SD-20 7/17/16 Sediment < 0.02 0.036 Yes
SD-21 7/17/16 Sediment < 0.02 < 0.02 Yes
SD-22 7/17/16 Sediment 0.034 < 0.02 No
SD-23 7/18/16 Sediment 0.024 < 0.02 No
SD-24 7/18/16 Sediment < 0.02 < 0.02 No
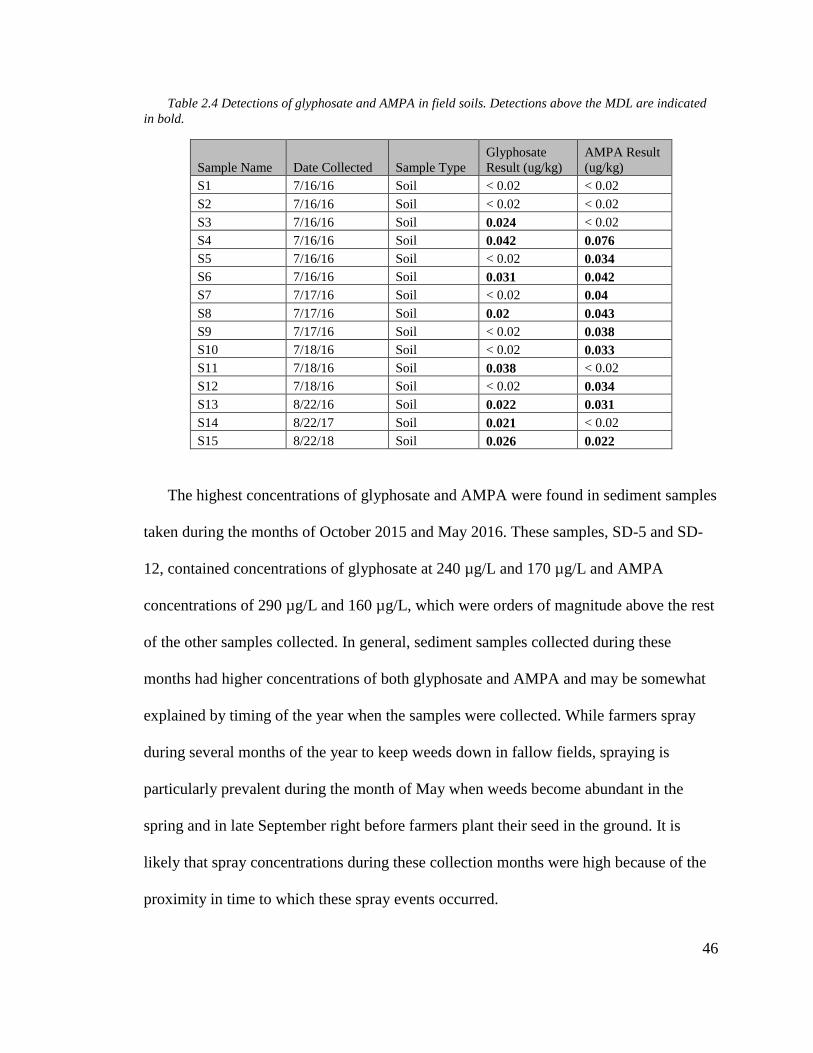
46
Table 2.4 Detections of glyphosate and AMPA in field soils. Detections above the MDL are indicated
in bold.
Sample Name Date Collected Sample Type
Glyphosate
Result (ug/kg)
AMPA Result
(ug/kg)
S1 7/16/16 Soil < 0.02 < 0.02
S2 7/16/16 Soil < 0.02 < 0.02
S3 7/16/16 Soil 0.024 < 0.02
S4 7/16/16 Soil 0.042 0.076
S5 7/16/16 Soil < 0.02 0.034
S6 7/16/16 Soil 0.031 0.042
S7 7/17/16 Soil < 0.02 0.04
S8 7/17/16 Soil 0.02 0.043
S9 7/17/16 Soil < 0.02 0.038
S10 7/18/16 Soil < 0.02 0.033
S11 7/18/16 Soil 0.038 < 0.02
S12 7/18/16 Soil < 0.02 0.034
S13 8/22/16 Soil 0.022 0.031
S14 8/22/17 Soil 0.021 < 0.02
S15 8/22/18 Soil 0.026 0.022
The highest concentrations of glyphosate and AMPA were found in sediment samples
taken during the months of October 2015 and May 2016. These samples, SD-5 and SD-
12, contained concentrations of glyphosate at 240 µg/L and 170 µg/L and AMPA
concentrations of 290 µg/L and 160 µg/L, which were orders of magnitude above the rest
of the other samples collected. In general, sediment samples collected during these
months had higher concentrations of both glyphosate and AMPA and may be somewhat
explained by timing of the year when the samples were collected. While farmers spray
during several months of the year to keep weeds down in fallow fields, spraying is
particularly prevalent during the month of May when weeds become abundant in the
spring and in late September right before farmers plant their seed in the ground. It is
likely that spray concentrations during these collection months were high because of the
proximity in time to which these spray events occurred.

47
Figures 2.18 and 2.19 show months of spray against concentrations of glyphosate and
AMPA in the watershed. Figure 2.18 shows that concentrations of glyphosate and AMPA
are relatively consistent in water during all months when glyphosate is most frequently
sprayed. However, during May and October when applicators have recently sprayed
glyphosate, concentrations of glyphosate and AMPA increase substantially in sediment
(Figure 2.19). In late September and early October, farmers also disturb soils more during
planting activities. This increased disturbance likely contributes to additional sediment
runoff to streams and would explain why concentrations of glyphosate and AMPA in
sediment are elevated during these times.
Figure 2.18 Months of herbicide spraying and concentrations of glyphosate and AMPA detected in
water samples.
0
0.05
0.1
0.15
0.2
0.25
Co
nce
ntr
atio
n (
ug/
L)
Concentrations of Glyphosate in Water and AMPA and Months of Spray
Glyphosate Spray Glyphosate Sample AMPA Sample
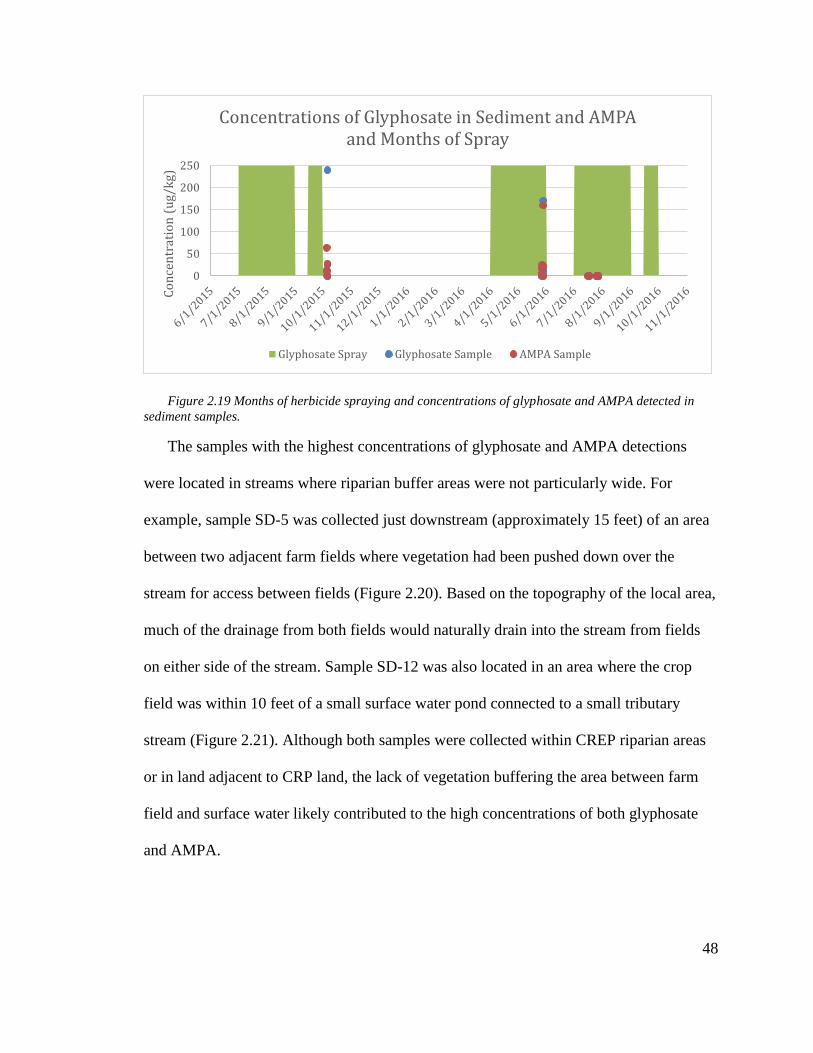
48
Figure 2.19 Months of herbicide spraying and concentrations of glyphosate and AMPA detected in
sediment samples.
The samples with the highest concentrations of glyphosate and AMPA detections
were located in streams where riparian buffer areas were not particularly wide. For
example, sample SD-5 was collected just downstream (approximately 15 feet) of an area
between two adjacent farm fields where vegetation had been pushed down over the
stream for access between fields (Figure 2.20). Based on the topography of the local area,
much of the drainage from both fields would naturally drain into the stream from fields
on either side of the stream. Sample SD-12 was also located in an area where the crop
field was within 10 feet of a small surface water pond connected to a small tributary
stream (Figure 2.21). Although both samples were collected within CREP riparian areas
or in land adjacent to CRP land, the lack of vegetation buffering the area between farm
field and surface water likely contributed to the high concentrations of both glyphosate
and AMPA.
0
50
100
150
200
250C
on
cen
trat
ion
(u
g/k
g)
Concentrations of Glyphosate in Sediment and AMPA and Months of Spray
Glyphosate Spray Glyphosate Sample AMPA Sample

49
Figure 2.20 NDVI drone image of area near sample location SD-5. The sample was collected within
CREP, but less vegetation in the vicinity of the sample location likely contributed to the high concentration
of glyphosate and AMPA in the stream. The sample was collected approximately 15 feet downstream of the
opening in the vegetation. The yellow arrow indicates the downstream direction of the stream.
Figure 2.21 NDVI drone image of sample location SD-12. The distance between surface water in the
pond and the farm field in CRP land was less than 10 feet. Sample SD-12 contained the second highest
concentration of glyphosate and AMPA in the study area.
There is abundant literature on how herbicide persistence and concentration varies by
soil type and properties, but simple linear regressions showed that there were no
correlations between glyphosate, AMPA, and any of the soil properties that were tested in
the lab in this study. Figure 2.22 shows concentrations of glyphosate and AMPA in
sediment collected in months when detections of herbicide were highest during the

50
October 2015 and May 2016 sampling events and during the months when detections of
herbicide were much lower in the July and August 2016 sampling event. In all months,
no observable patterns could be detected between soil or sediment texture and
concentration of herbicide, as shown in the figure.
Figure 2.22 Concentrations of glyphosate and AMPA versus soil texture in sediment and soil. No
correlation was found between samples taken during months when detections were high (October
2015/2016) or during months when detections were low (July/August 2016).
To determine if any other management practice could contribute to variable
concentrations of glyphosate and AMPA, I reviewed NASS Cropland Data Layers. These
data layers have been available since 2006 and show how much fallow land is present in
the watershed each year. I inspected these layers to determine if increases in fallow land
(that is sprayed often with glyphosate) increased during 2015 or 2016. The cropland data
layers for the study area indicated that between 35 to 40 percent of land was classified as
fallow in the study area between 2006 and 2015 (USDA NASS CDL, 2017). Therefore,
amounts of glyphosate and AMPA in soil, sediment, and water (Figure 2.23) should not

51
have varied with the amount of fallow land in 2015 or 2016, since fallow land acreage
remained relatively consistent during all years examined. No other discernible patterns
were found between glyphosate and AMPA and soil and sediment pH, total exchange
capacity, phosphorous, organic matter, or soluble salts using linear regression.
Figure 2.23 Sediment, water, and soil concentrations of glyphosate and AMPA in July and August
2016. Concentrations of glyphosate and AMPA were similar in each sample type during these months.
Regulatory and Toxicological Values of Concern
No regulatory screening criteria is available for glyphosate or AMPA, but the EPA’s
maximum contaminant level (MCL), which is the level of a contaminant in drinking
water below which there is no known or expected risk to health, is currently set at 700

52
µg/L (EPA, 2016). A number of countries have also established a range of “acceptable”
daily intake levels of glyphosate-herbicide exposures for humans, generally referred to in
the U.S. as the chronic Reference Dose (cRfD), or in the E.U. as the Acceptable Daily
Intake (ADI). An EPA cRfD of 1.75 mg of glyphosate per kilogram body weight per day
(mg/kg/day) has been established in the U.S. (NPIC, 2015). In the E.U, the current ADI
was originally adopted in 2002 and is significantly lower at 0.3 mg/kg/day. The data upon
which these exposure thresholds are based were supplied by manufacturers during the
registration process, are considered proprietary and are typically not available for
independent review (Myers et al., 2016; Mesnage et al., 2015).
In reviewing the literature on glyphosate levels, it is difficult to overstate how much
concern there is about the amount that it is increasing in the environment and concerns
about the levels which are currently allowed and considered acceptable in regulatory
literature (Battaglin, 2016; Benbrook, 2012; Benbrook, 2016; Grandjean and Landrigan,
2014; Porter, 2010; Kremer, 2009; Mesnage et al., 2015, Myers et al., 2016 Relyea,
2005). Although the concentration values of glyphosate and AMPA detected in this study
are far below the 700 µg/L or the 1.75 mg/kg/day cRfD established by the EPA, detected
concentration levels of both have been found to be harmful to human and ecological
health in numerous studies.
In a comprehensive review of publications focused on toxicity and glyphosate-based
herbicides, Mesnage et al. (2015) identified numerous peer-reviewed studies where the
toxicological effects of glyphosate-based herbicides and adjuvants (chemicals mixed with
glyphosate to make it more effective) were found to have toxicological effects well below
regulatory screening levels. In this study on the Fifteenmile Watershed, the concentration

53
values of glyphosate found in surface water (0.02 to 0.11 µg/L) have been found to have
endocrine disrupting and chronic effects (Figure 2.24).
Figure 2.24 Figure of glyphosate human and ecological health impacts from Mesnage et al., 2015. The
figure shows the ranges of values for which toxicological effects of glyphosate based herbicides and
adjuvants (chemicals added to glyphosate to make it more effective) have been found harmful to human or
ecological health. The concentrations of glyphosate in the samples collected for this study lie within the
range that goes up to teratogenic effects.
In the Fifteenmile Watershed, farmers would likely be most vulnerable to exposure
through ingestion of surface water and ground water intakes used for private domestic
wells, irrigation, and water contact recreation. The designated beneficial uses listed for
the waters in the watershed are: public and private domestic water supply, industrial
water supply, irrigation, livestock watering, anadromous fish passage, salmonid fish
rearing, salmonid fish spawning, water contact recreation, aesthetic quality, and hydro
power (Clark, 2003).
Farmers in the watershed and county use surface water and groundwater extensively
for irrigation and private water supply (Nelson, 2000; Clark, 2003; WCPD, 2017).
Glyphosate based herbicides contaminate drinking water via rainwater, surface runoff
and leaching into groundwater, thereby adding drinking water, bathing, and washing

54
water as possible routine exposure pathways (Battaglin et al., 2014; Majewski et al.,
2014; Coupe et al., 2012). Multiple studies have determined that groundwater wells are
susceptible to glyphosate leaching from soils (Battaglin et al., 2014; Jayasumana, 2015;
Myers et al., 2016). Further, this study has shown that surface water (which feeds
groundwater supplies in much of the watershed) is already impacted by glyphosate
concentrations that have been found to have endocrine disrupting and chronic effects.
Numerous studies (De Roos et al., 2005; Garry, 2002; Harrison, 2008; Jayasumana et
al., 2015; Larsen et al., 2012; Mesnage et al, 2015; Mesnage et al., 2013; Rull et al.,
2006; Schinasi and Leon, 2014) have also shown that farmers are exposed to herbicides,
including glyphosate, in a variety of other ways. These exposure routes include pesticide
drift and exposure to glyphosate during application of herbicides. Farmers in the
Fifteenmile Watershed are likely exposed to glyphosate and other herbicides through
both of these exposure routes, as high levels of wind and herbicide drift are frequent
problems in the watershed. The contact between continental and maritime air masses
produces strong wind patterns in Wasco County and the watershed, and the area receives
high winds over fifty percent of the time (WCPD, 2017). Residents in the watershed have
reported incidents of herbicide drift more frequently as new orchards and vineyards that
border wheat land farms are increasingly planted (personal communication with
extension agents, NRCS conservation district manager, and SWCD). This drift can cause
inhalation or ingestion of herbicide when herbicides are volatilized or carried on soil
particles in the wind (ODA, 2017).
Concentrations of glyphosate found in soil in this study (0.02 to 0.042 µg/kg) have
been found to have endocrine disrupting and chronic effects (Mesnage et al., 2015) and

55
soil particles that have adsorbed glyphosate could be carried on the wind during
application times, but even during times when application is not occurring. Low levels of
glyphosate have frequently been detected in the urine of farm workers and their families
shortly after glyphosate application in other studies (Acquavella, 2004; Mesnage, 2012).
Glyphosate and AMPA concentrations in sediment (0.024 to 25 ug/kg) and water
(0.02 to 0.11 µg/L) pose ecological health risks as well. Several rare, endangered, or
threatened species are listed in the Fifteenmile Watershed’s streams and tributaries that
are already impacted by sediment and temperature Total Maximum Daily Loads
(TMDLs). These species may be vulnerable to effects of glyphosate. Species that are
listed include native runs of winter steelhead (Onchorhynchus mykiss gairderi), which
has been listed as a threatened species by the National Marine Fisheries Service. Other
native species in the watershed include Coho salmon (Onchorhynchus kisutch), Pacific
lamprey (Lampetra tridentata), Western brook lamprey (Lampetra richardsonii) resident
redband trout (Onchorhynchus mykiss gairderi), cutthroat trout (Oncorhynchus clarkii)
sculpins (cottid family), dace (Rhinichthys spp), redside shiner, chiselmouths, northern
pike minnow (last four are members of the cyprid family), mountain suckers and
largescale suckers (catastomid spp) (Clark, 2003).
Glyphosate concentrations in sediment and water have been shown to be harmful to
aquatic life in a number of studies at the concentration levels found in this study on the
Fifteemile Watershed. For example, changes in fish ovary development have been
observed after 15 days exposure to glyphosate at only 65 ppb (Armiliato et al., 2014).
Concentrations of 50 ppb have been shown to produce toxic effects on the aquatic
invertebrate Daphnia magna during chronic toxicity tests spanning its whole life-cycle

56
(Cuhra et al., 2013). Tsui and Chui (2004) found that glyphosate based herbicides in the
range of 240-340 µg/kg in sediment were found to be toxic to benthic organisms, which
various fish species can feed on.
Temperature concerns in Fifteenmile Watershed further complicate the impact that
glyphosate could have on fish species, as the toxicity of glyphosate increases with higher
temperatures in fish. One study found that the toxicity of glyphosate doubled in bluegill
and in rainbow trout (in the species onchorhynchus mykiss) when the temperature of the
water was increased from 45 to 63 degrees F (Folmar et al., 1979 and Austin et al., 1991).
Much of the Fifteenmile Watershed reaches temperatures of over 70 degrees F (Clark,
2003).
It should also be noted that glyphosate based herbicide product formulations, many of
which are used in the study area, pose greater toxicity risks to a large number of non-
target organisms than glyphosate alone (Mesnage et al., 2015; Battaglin et al., 2014).
These organisms include mammals (Mesnage et al., 2013; Tsui and Chu, 2004), aquatic
insects, and fish (Folmar, 1979). Risk assessments of glyphosate based herbicides that are
based on studies quantifying the impacts of glyphosate alone underestimate both toxicity
and exposure, and thus risk (Myers et al., 2016). This oversight has led regulators to set
inappropriately high exposure thresholds (cRfDs, ADIs) (Mesnage et al., 2015; Myers et
al., 2016).
Conclusions
This study provides several methods to evaluate how herbicide use has been affected
by the widespread adoption of no-till and conservation programs intended to protect
stream health. While NDVI values of Landsat satellite imagery over the years of 1986 to

57
2016 revealed that vegetation health in streams appears to have improved overall with the
increase in conservation management programs and techniques, concentrations of
glyphosate and AMPA were found in the majority of surface water, sediment, and soils in
the watersheds of the study area, regardless of whether or not the samples were collected
inside or outside of CRP/CREP riparian buffer areas. The detections of glyphosate and
AMPA in streams, especially during times when spraying is increased (October and May)
indicates that the herbicide is still reaching streams even with improvements in
conservation agricultural practices. Further, certain locations within the watershed appear
to be affected by persistent herbicide runoff or drift.
In addition, concentrations of glyphosate in water and soil samples collected for this
study are within range of those that have been found to have human health impacts.
Concentrations of glyphosate/AMPA in all media types is likely the result of not only
increased amounts of glyphosate use, but also the number of months in which it must be
sprayed in order to keep weeds in fallow fields under control. The presence of glyphosate
and/or AMPA in the majority of samples during all months that were sampled is
indicative of the persistence of glyphosate and AMPA in the environment and should be
addressed for potential effects to human health.

58
Chapter 3: Impacts of Farming Practices and Conservation Management Programs
and Techniques on Sediment Cascades
Abstract
Agricultural conservation management techniques and programs are used nationwide
to prevent soil erosion and preserve water quality. Yet, the U.S. Environmental Protection
Agency (EPA) lists sediment among the top pollutants in U.S. waterways (EPA, 2012),
and agriculture is frequently listed as a major source of sediment in streams (Walling and
Fang, 2003; Blake et al., 2012). Distinguishing between sediment derived from naturally
caused geophysical processes and those instigated by anthropogenic activity has
remained challenging; therefore methods to distinguish the sources of sediment in
streams are warranted. This study examines an agricultural watershed in Oregon where
various forms of no-till agriculture have been practiced since the late 1990s and early
2000s in the majority of the watershed. Erosion analysis using RUSLE2 by the local
NRCS office has shown that erosion has been significantly reduced in the watershed
since the onset of no-till practices, but impairments to streams caused by sediment
loading remain in much of the watershed. Using a combination of historic aerial imagery
analysis, LiDAR, cesium-137 analysis for sediment source tracing, and interviews and
surveys, this research identifies what proportions of sediment are from upland versus
near-channel erosion and distinguishes between what processes are likely influenced by
human activity in contrast to those by naturally occurring geomorphic processes.
Identifying which processes are likely influenced by human activities provides an
understanding of how sediment cascades are being affected in the watershed as well as
the implications for conservation farming practices that affect current erosional processes

59
and sediment runoff into the streams of the watershed. Further, this study highlights the
importance of incorporating methods that assess human activity into research on
sediment cascades. Many geomorphological studies neglect the significant impacts that
human activity has on geomorphological processes and do not provide a way for human
activity to be incorporated into research methodology. By incorporating these methods,
this study found that there are large disparities between the erosion that is currently
estimated in the watershed and that a large amount of sediment is still generated from
cultivated sources.
Introduction
Agricultural conservation management techniques and programs are used nationwide
to prevent soil erosion and preserve water quality. Yet, the U.S. Environmental Protection
Agency (EPA) lists sediment among the top pollutants in U.S. waterways (EPA, 2012),
and agriculture is frequently listed as a major source of sediment in streams (Walling and
Fang, 2003 and Blake et al., 2012). Distinguishing between sediment derived from
naturally caused geophysical processes and those instigated by anthropogenic activity has
remained challenging. This issue is especially true as the lines between what constitutes
natural and anthropogenic sediment sinks and sources blur over time, as globally, humans
have greatly increased terrestrial erosion through a variety of mechanisms that influence
the way sediment is increased or reduced through river networks (Trimble, 1999; Syvitski
et al., 2005; Montgomery, 2007). Further, these changes are happening more frequently
on decadal rather than millennial time spans (Richter, 2007).
In much of the recent literature on sediment cascades (flux) many geomorphologists
(Brierley, 2006; Fryirs 2007; Fryirs, 2013, Reid, 2007) argue that we now have a

60
substantial understanding of sediment delivery and storage mechanisms in catchments,
and that there are well established methods for modeling them. However, how these
processes are coupled or decoupled in various types of catchment cascades is not well
understood. This challenge arises from a need for developing frameworks and models
that can enhance spatiotemporal resolution and specify provenance, timing, changes in
the rates of erosion, deposition and yield along the sediment cascade (Houben et al.,
2009; Wainwright et al., 2010). Fryirs et al. (2013) argue that a more sophisticated
approach is required to fully account for both spatial and temporal connectivity so that
the functioning of the sediment cascade is explained and alterations to internal dynamics
is understood or forecasted.
The need to incorporate humans as major geomorphological agents is also highlighted
more frequently in this literature. The basis for predicting the consequences of future
climate change is dependent on sediment cascade operation over the Quaternary (e.g.
Church and Slaymaker, 1989; Chiverrell et al., 2008; Brown et al., 2009; Houben et al.,
2009; Dosseto et al., 2010). Therefore, understanding paleo-sediment cascade dynamics
and responses to human disturbance will be important for the future (Fryirs, 2013). In
some landscape settings, variability in sediment yield associated with natural spatial
patterning and local human impacts are likely to exceed the impacts of moderate global
warming (Evans and Slaymaker, 2004).
This study examines how agricultural farming practices, particularly those intended
for conservation, have influenced sediment cascades. In doing so, this study contributes
to the literature by providing a mixed-methods approach to explore how much human
influence can alter the course of sediment cascades through various spatio-temporal

61
scales, and by quantifying the percentage of stream sediment sourced from land under
current conservation management. The specific location of study is in the Fifteenmile
Watershed of Wasco County, Oregon where a variety of conservation management
programs and techniques have been used with the goal of protecting soil and water
quality, with varying impacts to sediment flux in streams.
Background
The Fifteenmile Watershed is an ideal place to study the effects of conservation
management on sediment cascades, because the majority of the watershed (and the
county it is in) has converted to various forms of no-till, and there is a long history of
various conservation management techniques that have altered sediment flux into stream
systems. During the 1940s to 1980s, land managers used structural practices, sediment
basins, and terraces for the majority of their conservation efforts (SWCD, 2015). From
1985 to 1995, conservation efforts to reduce erosion were focused on crop residue
management transitioning to strip-cropping and divided slope systems (SWCD, 2015).
Yet, even with all of these management systems in place, the majority of the county’s
streams and tributaries have been on the U.S. Environmental Protection Agency’s
(EPA’s) water quality limited list for sedimentation since 1988 (EPA, 2015).
Conservation methods in the county intensified after a July 1995 flash flood followed by
regional flooding in February 1996 in the Fifteenmile Watershed portion of the county.
Heavy runoff and erosion from these events damaged cropland and did significant
damage to roads and bridges, earning the attention of landowners and agencies alike
(SWCD, 2015). The 1996 Farm Bill established the Environmental Quality Incentives
Program (EQIP) administered by the Natural Resources Conservation Service (NRCS)

62
(NRCS, 2015a). The bill’s educational element was adopted by the Wasco County Soil
and Water Conservation District (SWCD), which began to promote and provide
education to farmers about no-till farming systems. By 1997, what was known as the
transition to no-till agriculture began (SWCD, 2015). The educational effort coupled
with numerous grants from the Oregon Department of Environmental Quality (DEQ) and
Oregon Watershed Enhancement Board (OWEB), along with EQIP cost shares, enabled
more and more farms to make the transition from conventional tillage to direct seed / no-
till systems. By 2012, 93% of Wasco County’s farmland had been converted to what
were referred to as no-till systems, with most farmers and agencies claiming that runoff
and erosion from that land had been greatly reduced (SWCD, 2015).
The Contribution of Past Farming Practices to Sediment Cascades
Various farm practices have been used in the study area, with most centered on weed
control, retention of soil moisture, and prevention of erosion. Most of the cropland in the
study area and throughout much of the Columbia basin where wheat is grown has been
and continues to be used for summer-fallow dryland farming (dryfarming). In summer-
fallow dryfarming, no crops are grown during one crop season in order to store additional
moisture for the growth and yield of a crop the following season. This practice also helps
to control weeds and conserves plant nutrients. Farmers practice fallowing by leaving
crop stubble on the field during the winter. Under conventional tillage, prior to the switch
to no-till and direct seed, the soil was tilled with disks, sweeps, or chisels in February,
March, and April, before weeds removed much of the soil moisture and the soil surface
became dessicated (NRCS, 1982). Rod weeders were also commonly used in spring when
the soil is cultivated from one to four times a season (Williams and Wuest, 2001).

63
Comprised of cultivator blades and a square rod that turns counter to the direction of
travel, these implements are dragged approximately 25-50 mm below the loose soil
surface, uprooting weeds and sealing the soil surface by creating a dust mulch and
trapping soil moisture.
In addition to disks, sweep, or chisels, equipment commonly used for conventional
tillage included harrows, moldboard plows, slickers, and drills. Depending on the type of
equipment used for tillage and weed control, the soil could be disturbed anywhere from 2
inches to 2 feet deep (Hunter, 1907; conversations with local farmers). All of the various
forms of tillage therefore had an impact on hydrology in the watershed, albeit to varying
degrees.
Conservation Practices Contribution to Sediment Cascades
Depending on the capability class of the soil, a variety of conservation measures were
used in the past to prevent erosion. Abundant runoff and soil erosion have long been
associated with unique regional weather patterns and dryland wheat production on
loessial soils developed on steep slopes (McCool et al. 2006; McGregor 1982). In some
locations where dryland wheat is grown, susceptibility to soil loss is so great that
unprotected soil moves downslope in the absence of rainfall when the top 3 to 4 cm (1.2
to 1.6 in) of soil thaws and becomes a viscous, flowing slurry (Zuzel and Pikul 1987).
Under conventional tillage, it was common for crops to utilize only about a third of the
precipitation occurring during a 2- year period (NRCS, 1982). Water losses through
evaporation from fallow soils were high, and in certain years runoff was rapid because of
slow infiltration on finely tilled seedbeds or frozen ground (NRCS, 1982, Williams and
Wuest, 2001; Williams, 2014). Further, past conventional farming practices made the

64
land susceptible to large rills and ephemeral gullies, leading to major sediment delivery
into streams (Clark, 2003).
To counteract these extreme conditions, efforts to reduce soil erosion on steep slopes
in the region have relied heavily upon conservation practices that leave crop residues on
the surface and promote infiltration of winter rain and snow melt when crop cover is
minimal (McCool et al. 1995). Combinations of straw scattering at harvest, cloddy fallow
and minimum tillage, diversion terraces, contour farming, and several hundred to over a
thousand pounds of crop residue per acre were commonly left on the soil surface during
winter to keep soil erosion losses to less than about 4 or 5 tons per acre per year (NRCS,
1982). In straw scattering, when the grain was cut and harvested, straw was scattered or
dumped in bulk and left upon the ground to preserve soil moisture and to prevent wind
erosion (NRCS, 1982). In cloddy fallow the land was plowed as late in the spring as
possible, and no further cultivation was given. This practice would cause the soil to break
up in a cloddy form and become so dry before it was plowed that no weed seeds would
germinate (Hunter, 1907).
No-till farming has gained the most popularity for prevention of erosion and retention
of moisture over approximately the past 15 years in the Columbia Basin upland region
and is practiced on the majority of the farmland in the study area. The term “no-till” has
been used somewhat loosely in the region and sometimes refers to what is actually known
as direct seed. It may also refer to some form of minimum or reduced tillage that falls
into the category of conservation tillage, which require at least 30% of residue cover to
remain on the ground and causes less than 30% disturbance (NRCS, 2006;WSU
Extension, 2017). However, depending on whether true direct seed or some other form of

65
conservation tillage is practiced, disturbance and/or reductions in erosion can vary widely
(Huggins and Reganold, 2008). Variations in the way no-till is practiced and the range in
the amount of disturbance caused by no-till practices has generated interest because of
the potential impact to overland erosion and runoff into streams.
Objectives
Based on a recent NRCS erosion study on the Fifteenmile Watershed, NRCS
estimates that 11.6 million tons of soil has been conserved since 1975 (NRCS, 2015b)
and that sediment delivery to streams has been greatly reduced. However, before the
streams in the watershed can be removed from the impaired streams list, several key
questions need to be answered for regulating agencies: Where is the sediment that is still
in the streams coming from? What proportions of the sediment are from upland sources
versus near-channel erosion? How much of the excessive sediment loading is caused by
modern land use and water management versus the legacy of past land use? These can be
summarized in the primary research question of this paper: What are the sources of
stream sediment in the study area and what influences are conservation management
techniques having on them?
To answer the primary research question and related questions, I examine past and
current farming practices, human modifications to streams, and geomorphological
processes. The goals of this study are to: 1) identify potential sources of sediment
throughout the watershed and constrain contributions from source areas; 2) understand
how previous and current human activity has influenced sediment cascades in the
Fifteenmile Watershed; and 3) determine what the implications are of localized human
impacts on erosional processes, particularly those associated with conservation

66
management techniques. In the following sections, I describe relevant characteristics of
the study area and the range of methods employed.
Study Area
The research was conducted in wheat field farmlands of Wasco County, Oregon
(Figure 3.1). The county is bordered to the north by the Columbia River, to the east by
the Deschutes River, to the west by Mount Hood National Forest, and to the south by the
Warm Springs Reservation. The county has 670 farms, most of them wheat, which
account for the largest land use in Wasco County and approximately 81,130 acres are
actively cultivated (NRCS, 2015b). The particular focus of this study is on the
Fifteenmile Watershed of Wasco County, where the majority of wheat is grown in the
county, and where many impaired streams are listed for sediment.

67
Figure 3.1. Study Area. Wasco County is shown in red and Fifteenmile Watershed is shown on the
right hand-side with the main stream, Fifteemile Creek and its tributaries shown.
The Fifteenmile Watershed and Wasco County is located within the Columbia
Plateau physiographic province and partly on the Eastern Cascade Mountain provinces.
The Eastern Cascade province is comprised of wide and high upland eroded terraces
consisting of mostly coarse alluvial and pyroclastic materials interspersed amongst deep
V-shaped canyons. The Columbia Plateau is comprised of an uplifted lava plain with
elevation ranging from 1,000 feet along the northern boundary to about 3,500 feet in the
southwestern and western parts of the study area. The Columbia River demarcates the
northern boundary of the study area and has an average elevation of 97 feet. Escarpments
and steep slopes bordering the Columbia River rise abruptly to the upland terraces. In
some places narrow sandy terraces parallel the river; in others, vertical basalt

68
escarpments rise from 800 to 1,000 feet. Fifteenmile Creek is the main river within the
Fifteenmile Watershed where most dryland wheat farming occurs, and it terminates into
the Columbia River. Many of the tributary streams associated with Fifteenmile Creek
have steep gradients and flow through deep canyons. Its tributaries: Eightmile, Fivemile,
and Ramsey Creeks originate in the Mt. Hood National Forest and flow northeasterly,
discharging into the Columbia River just downstream of The Dalles Dam (SWCD, 2015).
The Deschutes Riverbasin borders the eastern edge of the watershed. The Columbia
River Basalt flow has preserved the major ridges adjacent to the Deschutes and Columbia
Rivers. The basalt is commonly more than 1,000 feet thick. The Dalles Formation has
been deposited over older formations in the western part of the survey area and was built
up slowly, as evidenced by buried soils in the regolith (Hodge, 1932).
There are two general types of soils in the Columbia Basin: residual and sedimentary
(NRCS, 1982). The residual soil occupies practically the entire wheat-producing portion
of the region. It is mainly the result of the weathering and disintegration of the Columbia
basalt River B, and is a very fertile soil (Hunter, 1907). These soils, comprised of a
mixture of clay, silt and gravel deposits transported by water, are also combined with ash
and pumice from former volcanic activity and loess transported by wind from other areas.
In many locations throughout the study area, the soils are now so intermixed that alluvial
and aeolian materials are no longer distinct (NRCS, 1982). However, some patterns are
present. For example, the soils on uplands are generally shallow over bedrock and are
stony. Soils that formed in material on alluvial fans and terraces generally are somewhat
gravelly or cobbly and in places are high in content of pumice. Soils formed in loess are
high in silt and are shallow to deep over bedrock.

69
During recent geologic times a mantle of loess was laid down over the entire survey
area, but now it is thickest on north facing slopes, mostly as a result of preferential
erosion (Hodge, 1932). It is a nonstratified and unconsolidated deposit by the wind.
Along road cuts in the survey area, the loess stands in vertical banks as much as 10 feet
thick (NRCS, 1982).
Methods
This study employed a mixed-methods approach to understand the geomorphic
evolution of the landscape and to identify potential sediment sources. The methods,
which account for both the human and geophysical influences on geomorphology, are
described herein:
Determining Source Contributions with Cesium-137
Cesium-137 sampling and analysis was used to determine what source areas were
contributing to sediment in streams. During the 1950s and 1960s, atmospheric nuclear
tests distributed radioactive fallout of cesium-137 around the world where it was
deposited onto and adsorbed by soil (Nagle and Ritchie, 2003). Because of its widespread
distribution, multiple studies have used cesium-137 for tracing sediment sources in
agricultural lands (e.g. Nagle and Ritchie, 2003; Stout et al., 2014; Zhang et al., 2016).
The range of topics involving cesium-137 are vast, including everything from addressing
how soil characteristics contribute to likelihood of erosion; how some heavy metals can
be correlated with cesium-137 radionuclides; and for using cesium-137 for making a
complete sediment budget in a watershed (Dragović, et al., 2008; Li et al, 2007;
Polyakov, 2004). For this study, cesium-137 was used to identify eroding sediment

70
sources in the watershed, and to assess how the identified contributing sources reflected
on conservation programs used in the watershed.
Five different properties under no-till management were sampled for cesium-137. On
each property, one or two different hillslopes were chosen for sampling that were
representative of the landscape in the watershed. Each hillslope was sampled at the top,
midslope, toeslope, and stream/ephemeral stream below using a standard shovel. In some
cases, toeslopes were not sampled when the stream below would have amounted to the
toeslope position. Between four and five discrete sampling points were taken along each
transect on the hillslopes spaced between 15 and 20 meters apart depending on the size of
the slope. At each point, samples were taken at 10, 20, and 30 cm intervals to ascertain
where cesium concentrations were highest. In some locations, particularly where channel
walls were exposed, a 50 cm and 1 m sample were also collected to determine if cesium-
137 was present at those depths, and to determine if disturbance had occurred in those
locations. Each of the sample intervals were composited into one sample that was
representative of that transect. For example, a sample along the top of a slope at the 0 to
10 cm interval was actually comprised of four or five individual samples that were
composited into one sample bag for analysis for the 10 cm depth along that transect. This
was also done for the 10 to 20 cm interval, and 20 to 30 cm interval for each transect on
each field. Interval sampling was conducted at the suggestion of an Oregon Department
of Agriculture (ODA) employee who had previously sampled cesium-137 in the area for
another study and found that it provided more consistent detections in the laboratory
when the samples were analyzed.

71
In streams or channels, samples collected were discrete and not composited. The
number of samples collected for streams/channels varied by the size of the slope above it,
but on average, three to four samples were collected from each channel and stream below
a hillslope that captured the runoff from above. When both channel and stream conditions
were ideal for sampling, the channel sample was collected within 2 m of the stream
sample. Depths of channel and stream measurements were variable due to less than ideal
substrate for sampling, but typically stream samples were collected between 10 to 20 cm,
with most stream samples collected from a depth of 10 cm. Only two stream samples
taken were collected from a depth of 30 cm. Samples in streams were collected with a 2
inch PVC pipe that was driven into the bottom sediment of the stream bed when possible.
Sediment was also sometimes extracted via hand shovel to a depth of 10 cm. A Trimble
Juno GPS unit was used to log geographic coordinates for each transect, channel, and
stream sample location.
After collection, samples were dried in an oven at 105 degrees Celsius for 24 hours
and then sieved with a 2 mm sieve and broken into two portions. One portion of the
sample was submitted to the USDA ARS Southwest Watershed Research Center in
Tucson, AZ for cesium-137 analysis. The analysis was performed using a spectrometry
system consisting of four high-purity germanium detectors (Canberra GC4019) with
>30% relative efficiency and multi-channel analyzers (DSA-2000). The system was
calibrated using mixed radionuclide reference material IAEA-327 and IAEA-447
certified by International Atomic Energy Agency (Strachnov et al., 1996). Measurement
and spectrum analysis was conducted using Genie-2000 Spectroscopy software
(Canberra, 2000). Activity of cesium-137 was calculated from the 661.6 keV photopeak

72
with 0.24 keV resolution. The samples were counted for at least 80,000 sec or until <10%
peak area uncertainty was achieved. The analysis included correction for self-attenuation
due to variation of sample density (Quindos et al., 2006).
Standard gamma spectroscopy was used for the analysis of samples and cesium-137
concentrations were input into a spreadsheet for use in a conversion model. The mean
values of cesium-137 analysis were input into a simple mixing model (Peart and Walling,
1988; Wallbrink et al., 1996), which allows for comparison of radioactivity among the
samples. This model provides a reliable estimate of the change in erosion between the
reduced tillage systems and other potential sources of soil. The equation for the model is
as follows:
𝐶𝑠 =𝑃𝑟 − 𝑃𝑏
𝑃𝑠 − 𝑃𝑏∗ 100
Where
𝐶𝑠 = contribution from cultivated surface sources (%)
𝑃𝑟 = mean value of property for stream bottom sediment
𝑃𝑠 = mean value of property for cultivated soil
𝑃𝑏 = mean value of property for bank material
The other portion of the sample was analyzed for texture to measure particle size by
Hydrometer Method ASTM D422, 2007 at Portland State University and by Brookside
Lab. Cesium-137 is strongly adsorbed to or fixed by fine soil particles and organic
matter, which are generally transported as suspended loads or wash loads in streams
(Zhang et al., 2016). To circumvent the enrichment of suspended sediment in fines, many
studies measure only the fine fractions of <63 μm (representing the silt and clay

73
fractions) in order to preserve the conservativeness assumption (Wallbrink et al., 1998;
Walling, 2005; Koiter et al., 2013, Motha et al., 2002). In keeping with this rationale, the
measured cesium-137 activity on the whole soil was divided by the silt and clay fraction
of the sample to obtain the activity on that portion, which was used in the aforementioned
mixing model and is shown in the equation below.
𝐶′𝑠 = 𝐶𝑠 ∗1
𝑓𝑐𝑙𝑎𝑦 + 𝑓𝑠𝑖𝑙𝑡
Where
𝐶′𝑠 = contribution from cultivated surface sources adjusted for particle size (%)
𝑓𝑐𝑙𝑎𝑦 = fraction of clay in sample
𝑓𝑠𝑖𝑙𝑡 = fraction of silt in sample
Determining Human and Geophysical Impacts on Sediment Cascades
In the Fifteenmile Watershed, human influence has significantly affected sediment
cascades in the landscape, primarily through varying forms of intensive to less intensive
agriculture, which have created varying landscape sensitivities over recent decades. In
addition, extensive channel modifications to stream channels throughout the watershed
have resulted in a number of changes to erosional events. These activities are common at
many catchment and landscape scales, where human disturbance can affect the effective
catchment area and timescales of connectivity (Harvey, 2002; Lane et al., 2008). For this
study, the processes and changes that affected the landscape were analyzed through
analysis of historical aerial imagery, interviews and survey, and light detection and
ranging (LiDAR) analysis.

74
Analysis of Historical Imagery
Information about conservation management techniques used on farm fields was
provided by the local SWCD, NRCS, DEQ, Oregon Department of Fish and Wildlife
(ODFW) and farmers in the area. This information was used in conjunction with aerial
imagery from 1939 forward obtained from the University of Oregon historical aerial
photograph archive. Analysis of sequential aerial photographs is of particular value in
determining frequencies and recovery times for different processes (Florsheim et al.,
2011). This process helped to quantify the temporal and spatial scales of sediment
cascades working on the landforms managed with different agricultural practices,
particularly in areas susceptible to farm practices, such as ephemeral gullies and rills.
Stream channels in aerial photographs were also examined. Stream channelization
and straightening of streams occurred with settlement of the Columbia Plateau and
streams were regularly cleaned of vegetation to facilitate the efficient removal of water
and soil from adjacent roads and fields (Williams and Wuest, 2001). More locally in the
Fifteenmile Watershed, some of the more significant human alterations to the streams of
the watershed include the Army Corps of Engineers’ modification of stream channels
throughout the watershed by installing rip-rap, dikes, and dams, particularly during the
1964 and 1996 floods (personal communication ODFW; Clark, 2003). Analysis of
historical aerial imagery as well as information from a watershed assessment conducted
in 2003 (Clark, 2003) was used to highlight changes between former and current forms of
agricultural drainage system configurations and sediment pathways.

75
Interviews and Surveys
To supplement the aerial photography analysis, I sent a survey to farmers who have
been farming in the study area over several decades. The survey inquired about the
history of various agricultural practices in the watershed. According to the local SWCD,
much of this knowledge had been informally communicated before but had never been
formally recorded. The local SWCD distributed the survey to farmers in the Fifteenmile
Watershed and released the records for this study. These surveys were useful for
constraining the years during which various types of agriculture had an influence on the
movement of sediment in the watershed to gather the following information:
1. How long the property has been in no-till or direct seed and specification for which
form of agriculture was used, and starting date/years for using no-till/direct seed.
2. Other forms of agriculture that have been used on the property in the past (e.g.
straw/mulch till, conventional till, etc.) and years that the property was used for each
agricultural management technique.
3. Known plow depths for the property and the type of equipment used on the tract,
and the size of equipment and plows use and types of plows used.
4. Modifications to, or dredging of, streams downslope and adjacent to managed
tracts, and the years that modifications and clearing of sediment occurred.
5. Any major erosion on properties from wind, rain, overland flow or gullies or rills
and, if known, any years when erosion occurred on a frequent basis and/or years of
erosional events that were more severe than others.
Semi-formal interviews with six farmers in the study area were conducted, as well.
During the interviews, farmers were asked about the different farming practices they have

76
used, equipment details, erosion concerns, and events or modifications to streams that
had occurred on their properties. These interviews were useful for obtaining more details
about how no-till is practiced in the area and for obtaining definitions about commonly
occurring practices.
Mapping of Floodplains and Terraces with LiDAR
Floodplains and terraces are numerous throughout the study area, and can be sources
of sediment when there is significant difference in elevation between the surface being
eroded and the floodplain and point bar being constructed on the opposite bank (Lauer
and Parker, 2008) (Figure 3.2). Terraces and floodplains in the Fifteenmile Watershed
were delineated using the TerEx tool in ArcMap, which extracts and maps terraces and
floodplains from a LiDAR derived DEM and measures the absolute elevation and height
relative to the nearby stream channel (Stout and Belmont, 2013). LiDAR of the study
area was provided by the Wasco County SWCD. In the Fifteenmile River, the TerEx tool
was used to extract terraces based on three user-specified attributes based on the
recommendations of the tool developers (Stout et al., 2014): 1) local relief of the terrace
did not exceed 0.5 m within a 500 m2 area; 2) the terrace was located within 100 m of the
channel centerline; and 3) the area of the surface terrace, once identified, was not less
than 500m2. Terrace surfaces selected for this tool were ground-truthed to verify that they
were alluvial deposits. Floodplains were also extracted and were defined as surfaces that
were less than 2.0 vertical meters above the channel. Alluvial surfaces higher than that
elevation were considered terraces.

77
Figure 3.2. Examples of floodplains and terraces mapped using the TerEX Tool.
(https://qcnr.usu.edu/labs/belmont_lab/resources). Figure on left shows floodplains mapped in red. Figure
on right shows mapped terrace in yellow.
Results and Discussion
Sediment Source Contributions Determined by Cesium-137 Analysis
Given the variations in the way that no-till or other conservation management
techniques are practiced in the present day and the modifications to streams in the
watershed, it was necessary to determine what proportions of sediment were still being
generated from land in conservation management programs as well as modified stream
banks that have been altered to prevent channel erosion. Figure 3.3 shows the locations
where cesium-137 samples were collected throughout the watershed.

78
Figure 3.2. Locations of cesium-137 sampling. Figure on bottom right-hand corner shows the
distribution of sampling locations, with the Fifteenmile Watershed outlined in red. The figure on the left
shows the sampling locations in relations the main streams and tributaries of the watershed. Inset on upper
right-hand side shows an example of the sampling scheme, where samples across three transects on the
upper, middle, and toeslope positions of a hillside were located above a stream channel that was also
sampled.
Although agencies and farmers in the area have noted substantial improvements in the
amount of runoff that has been generated in farm fields that flows directly to streams, the
cesium-137 analysis conducted for this study determined that approximately 49% of
sediment in streams is still sourced from cultivated fields in the watershed (Table 3.1).
The other 51% is generated from eroding channel banks. The percentage of cultivated
source materials (Cs) is calculated by taking the difference between the stream sediment
(Pr=5.21) and bank soil (Pb=5.45). This number is divided by the difference between the
cultivated soil (Ps=4.97) and the bank soil (Pb=5.45). The standard deviation and standard
error of the mean were calculated for the watershed to demonstrate the range of the

79
concentration values on the <63 µm fraction of sediment in each sample, as shown in the
previously discussed equations. Although the high standard deviation indicates highly
varied sample values, the low standard error of the mean reflects a number that is
representative of the true mean value of the watershed as a whole and the large number of
collected samples.
Table 3.1. Mean contributions of sediment from different source areas with calculated standard
deviations and standard errors of the mean.
Cultivated Bank Stream
Number of Samples 90 47 29
Mean of Activity Bq kg-1 4.97 5.45 5.21
Standard Deviation 5.02 5.60 7.31
Standard Error of the Mean 0.53 0.82 1.36
Mean Contribution to Stream 49% 51%
As mentioned previously, some samples were taken between 50 cm to 1 m to assess
the depth to which cesium-137 was found across cultivated surfaces and to assess
potential disturbance of bank deposits near streams. These samples were limited to areas
where the 50 cm depth could be reached in farm fields and to locations where channel
banks were thick enough to be sampled to 1m. In total, twelve samples from between 50
cm to 1 meter were collected, with seven of these samples collected from exposed
channel bank faces that appeared to be actively eroding. In each of the channel bank
locations, cesium-137 was detected, with an average concentration of 4.3 Bq kg-1. The
concentration of cesium-137 at this depth was surprising given that cesium-137 does not
usually penetrate to this depth level (Nagle and Ritchie, 2003). However, in the locations
where the samples were taken, it appeared that the channel banks had been accumulating
deposits from overland runoff. Materials in the soil horizon (generally what would be
considered a weakly formed A-horizon) where the samples were taken from were often

80
loosely consolidated without a strongly defined transition to the next soil horizon. These
channel characteristics indicated that the channel bank likely received overland flow
deposits from uphill, cultivated sources during precipitation and storm events.
In the five locations where samples were taken from cultivated fields, samples were
collected from a depth of 50 cm and only one sample had any concentration of cesium-
137 at 1.67 Bq kg-1, which is appropriate given the amount of soil disturbance that
occurred during conventional tillage and the large amount of runoff during that same
time. More attempts were made to reach 50 cm at each field, but the conditions of the
soils at depth (e.g. hard pan layers) made it difficult to reach 50 cm in most locations.
Nonetheless, samples were collected at the 50 cm depth at three out of five farm
properties, and the absence of cesium-137 at this depth (and the presence of the hardpan
layer) would indicate that cesium-137 it is not likely present at lower depths in most
cultivated areas, especially given that farmers did not disturb soil greater than 50 to 60
cm, even during times of conventional tillage.
It should also be noted that some of the cultivated surfaces where sampling occurred
are likely influenced by road surfaces with fine particles. Although the majority of roads
throughout the watershed are paved or graveled, there are some extensive roads that
consist of fine, loamy soils as well as exposed roadcuts across from cultivated lands.
However, the amount of sediment supplied to cultivated areas and streams in the
watershed as a whole is likely low, given the number of roads that are in this condition
were not present at the majority of the field site locations. Roads would also not be
expected to contribute as much to stream sedimentation as cultivated surfaces or eroding

81
channels banks, since roadcuts are generally not subjected to as high of turbulent flows as
channel banks (Nagle and Ritchie, 2003).
How Humans Practices and Environmental Conditions Have Influenced Sediment
Cascades
Upon determining that nearly 50% of stream sediment is still generated from
cultivated surfaces after the onset of conservation management practices, and over 50% is
still generated from channel banks even after extensive modifications to streams, it was
necessary to find out why. Further, it was necessary to determine what practices and
events over both spatial and temporal scales are likely influencing the sediment cascades
in the watershed.
Ten farmers, who represents about one-third of the farmers in the watershed (personal
communications with SWCD), responded to surveys with varying levels of detail
provided about past farm practices and known modifications to streams. The level of
detail supplied in the surveys varied, with most farmers noting general trends of land use,
as opposed to specific locations of management practices. However, more detailed
information was provided by the informal semi-structured interviews that were conducted
with six farmers who, cumulatively, are amongst the highest recipients of subsidy and
conservation payments in the watershed related to no-till practices (EWG, 2017a; EWG,
2017b) and who have also managed a large percentage of the Fifteenmile Watershed for
at least several decades (personal communication with SWCD). The combination of these
methods along with aerial imagery and LiDAR analysis provided information that helped
to constrain the time frame and temporal scales over which sediment likely contributed to
streams in the watershed.

82
Past Farm Practices that Likely Influence Sediment Cascades
Most farmers practiced conventional tillage until at least 1985 when the first
conservation programs payments associated with the 1985 Farm Bill became available.
Answers to questions 1 through 3 of the surveys and interviews concerning past practices,
equipment used, and known plow depths were found to be consistent with the
information summarized in Background section of this paper.
During interviews, all farmers indicated that the number of passes over a field for
harvesting and planting had been reduced since the onset of no-till on their properties.
Interviewees indicated that the number of passes over a field ranged from anywhere
between four to six times prior to even seeding for preparatory work that was necessary
under conventional tillage. This preparatory work involved disking and chisel plowing
from anywhere between 2 inches to 2 feet deep, followed by a pass with a rod weeder.
These practices seemed to have exacerbated two main issues in the watershed: ephemeral
gullies and wind erosion. The erosional processes and their temporal and spatial
component of their effects are discussed below.
Ephemeral Gullies Related to Farming Practices
All surveyed or interviewed farmers and agency employees indicated that ephemeral
gullies in the watershed used to be a significant concern when conventional tillage was
widely practiced in the watershed. These gullies provided steep drainage pathways to
streams adjacent to farm lands and were often exacerbated during years of conventional
tillage. All farmers indicated that they had not had problems with erosion occurring in
ephemeral gullies since converting to-no-till, and some of them noted that they have been
able to rework some of the former gullied areas into level surfaces with farm equipment

83
by filling in the gullies with surrounding soil. This practice previously had to be
conducted every year, but has not been as frequent since the onset of no-till.
Aerial imagery analysis shows that while many gullies have improved over time, the
scars of the majority of the gullies remain. Figure 3.4 shows an example of an ephemeral
gully that has remained from 1939 to the present. Many of the gullies seem to narrow in
width and depth, but the scars of the gullies remain in aerial photos of majority of the
landscape at present. Runoff from gullies was often exacerbated during extreme storm
events that are common to the region, especially during the winter months when the
majority of rainfall occurs.
While farmers indicated gully conditions had improved, two farmers and an agency
employee indicated that new pest concerns have arisen since the onset of no-till that may
also affect older gully areas, namely gopher holes and burrows that channel floodwaters
and erode large quantities of subsurface soil in cropland. Rodent populations can thrive
under no-till conditions, as burrow systems are undisturbed and plant residues able to
build-up on the surface, providing cover and insulation (Witmer et al., 2004). Many of
the burrows on sampled properties are even visible in widely accessible satellite imagery
provided by Google, and may be contributing to erosion from cultivated surfaces into
streams presently. Burrows from pests have been shown to exacerbate gullied areas in
other dryland wheat farm environments in Oregon, as well (Nagle and Ritchie, 2003).
Farmers have been attempting to combat these issues by placing nesting boxes near
wheat fields that encourage birds of prey to manage rodent populations.

84
Figure 3.3. An example of an ephemeral gully from the years 1939 to present. As in the pictures shown
above, although runoff from many of the gullies improve over time and may narrow in width and shallow in
depth, the majority of gullies left impressions on the landscape that persist to the present day.
Wind Erosion Related to Past Farming Practices
Wind erosion was also significant during times of conventional tillage. The
Fifteenmile Creek subbasin lies in the transition zone between western and eastern
Oregon, and both summer and winter air temperatures can be somewhat extreme in the
eastern portion of the subbasin where the majority of the Fifteenmile Watershed is
located (Nelson, 2000). Prevailing winds are from the west, although easterly Fifteenmile
Creek Subbasin winds occur along the Columbia River in December and January. In this
area, even many flat, low lying floodplain areas without slope and converted into
farmland are classified as highly erodible land (HEL) because of the wind. All farmers
interviewed indicated that wind erosion and dust storms have not been as frequent since

85
no-till became widespread. Wind erosion was likely more severe during drought years
and years of lower precipitation, and was exacerbated by conventional plowing practices
that reduced organic matter.
While all farmers interviewed indicated that wind erosion was much worse during
times of conventional tillage, one farmer also stated that there were dust storms in 2016
that were comparable to the wind storms experienced when farms were under
conventional tillage. Another farmer stated that his land continues to erode from wind
erosion, even though the majority of his property is on flat land adjacent to a floodplain
and is categorized in the HEL category.
When asked how they managed land to avoid erosion from wind, two of the farmers
interviewed indicated that when wind was an issue under conventional tillage, farmers
plowed in directions that would help to reduce topsoil loss. They also indicated that they
would avoid working areas of the fields with gullies and rills in order to prevent wind
erosion and dust storms from occurring. However, even with these practices, dust storms
often occurred during conventional tillage.
Current Farm Practices that Likely Influence Sediment Cascades
Equipment Variations in Equipment, Tillage Practices and Soil Disturbance
Although conventional tillage clearly exacerbated the normal environmental
conditions of the region, variation in the way no-till currently is practiced also appear to
be having an effect on runoff into streams. There is a high amount of variability in the
way that farmers practice no-till in the Fifteenmile Watershed. Indeed, even the definition
about what constitutes no-till farming varies. After the last major flood of 1996, many
farmers upgraded their equipment to various types of direct seed equipment that was

86
authorized under various government contracts that they had access to during the late
1990s and early 2000s. According to the farmers interviewed and local NRCS employees,
as long as farmers purchased equipment that met the criteria for direct seed, then farmers
who enrolled in conservation contracts and converted their land to no-till were considered
to be in compliance with the amount of disturbance allowed and would receive payments
for the duration of their contracts (usually 3 to 5 years). However, the transition to no-till
took place over several years; most farmers interviewed gradually converted acreage
from conventional tillage to some sort of reduced tillage or what is often referred to as
minimum tillage (see Table 3.2). In addition, true no-till practices, as defined by literature
provided by the NRCS office (NRCS, 2006), have a soil tillage intensity rating (STIR) of
< 10, which translates to approximately 15% disturbance of row width during planting.
However, NRCS also noted that equipment that has been accepted for contracts for
enrolling into no-till programs in the watershed has included equipment that contains
hoe/chisel openers and drills, which can cause as much as 30% disturbance to row widths
during planting and is in the moderate range of tillage intensity (NRCS, 2006). Four of
the six the interviewees indicated that they used air drills and knives with their direct seed
equipment, keeping disturbance closer to 15%. The other two farmers indicated that they
use other types of hoe openers that fall within the acceptable range of disturbance but are
not true no-till. Farmers who submitted surveys did not indicate the specific type of
equipment they used.
Most farmers have bought direct seed equipment that generates a STIR value
equivalent to 15 to 30% disturbance, within the range of conservation tillage, but higher
than that allowed by true no-till or direct seed as defined by NRCS employees (personal

87
communication with NRCS and NRCS presentation on Erosion in Watershed). Initially,
when farmers signed up for no-till contracts, some farms were checked for compliance
with this STIR value on their properties. However, limited resources and labor restricted
the government’s ability to confirm that the amount of disturbance occurring across the
watershed actually met the STIR value criteria. Further, since most farms are now out of
contract for these conversions to no-till and overseeing agencies assume that most
farmers have direct seed equipment, the actual percentage of disturbance on each tract of
land is unknown on a watershed scale, leading to some confusion over what type of no-
till practices are occurring, if at all.
Table 3.2. Table showing categories of conservation tillage and residue. Large differences between
residue conserved, soil disturbance, and erosion occur due to equipment differences used for each method.
Source Washington State University Extension Service (2017).
The number of farmers practicing true direct seed as opposed to some other form of
conservation tillage is extremely important, because of the effect it can have on surface
erosion in cultivated soils otherwise assumed to be minimally disturbed. Table 3.3 shows
the erosion rates that NRCS determined using RUSLE 2 for the watershed in 2015
(NRCS, 2015b). Assuming that there are 81,130 cultivated acres in the watershed and
that farmers are practicing no-till using true direct seed techniques, approximately 27,000
tons of soil erodes per year, which is significantly less than the amount of soil eroded

88
under conservation tillage or conventional tillage. However, once variations in
disturbance are factored in, the amount of erosion occurring increases substantially, as
shown in Table 3.4.
Table 3.3. Differences between erosion rates based on type of tillage used. Erosion rates were
calculated by NRCS in Wasco County using RUSLE2. The amount of tons of soil lost per year assumes that
there are 81,130 acres of cultivated land in the watershed. If all users practice no-till/direct seed as defined
with less than 15% disturbance, only 27,584 tons are eroded per year. Erosion rates were supplied by
NRCS Soil Conservationist in Wasco County.
No-Till/
Direct Seed
Conservation Tillage (Rate for Reduced
Till, Minimum Till, Mulch Till)
Conventional
Tillage Rate
Erosion Rate
(tons/acre/year) 0.34 4.6 8.83
Eroded Soil (tons/year) 27584 373198 716378
Table 3.4. Differences between erosion rates based on variations in the range of users of a particular
method. The table shows a range of possibilities for erosion given the variability of farmers’ responses
during interviews and information supplied by agency employees with knowledge of the study area. If it is
assumed that approximately 5% of users still practice conventional tillage (the mean value of those left
over if it is assumed that between the 93 to 96% of users practice some form of no-till), then 171,468 tons
of soil are eroded each year. This is much higher than the estimate shown in Table 7 if all users practice
no-till/direct seed as technically defined.
No-Till/
Direct Seed
Conservation Tillage (Rate for Reduced
Till, Minimum Till, Mulch Till)
Conventional
Tillage Rate Total
Percentage of
Users 63% 32% 5%
Eroded Soil
(tons/year) 17470 118179 35819 171468
According to the local SWCD and NRCS, there are 81,130 acres of actively
cultivated land in the Fifteenmile Watershed and between 93 to 96% of farmers are
practicing what they have reported to be no-till conservation practices. If the information
supplied during informal interviews is applied to the watershed as a whole—a reasonable
assumption given that they manage the majority of the watershed—and four out of six
people (or 63%) practice direct seed as it is technically defined, then approximately
17,000 tons of soil erosion per year can be attributed to the current version of no-till

89
practices. The remaining 32% of users practicing some form of conservation tillage
produces almost 120,000 tons of soil erosion, and those still practicing conventional
tillage produce over 35,000 tons of soil erosion, with a total amount of over 170,000 tons
of soil eroded per year. While this estimate is below what would be eroded if everyone
practiced conventional till, it is still significantly higher than the estimated 27,000 acres
of soil eroded per year were all farmers practicing true direct seed, and is likely a reason
that higher sediment loads in streams persists.
Beyond interviews with farmers and NRCS, interviews with other agencies and
extension agents with knowledge of the region corroborated much of the variability that
is likely occurring in the watershed. One agency employee stated in an interview that
every farmer has his own definition for what constitutes no-till and that this definition
varies between farmers, with most farmers considering some form of high residue tillage
(e.g., reduced till, strip till, mulch till, and zone till; see Table 3.2) as no-till. The agency
also indicated that many farmers are able to practice no-till or direct seed that meet the
requirements for maximum residues and minimal disturbance in two or three of their crop
rotations, but also might have to incorporate a form of conservation tillage another year
due to field conditions or other environmental factors that do not permit adherence to true
no-till practices. For this reason, many farmers use the term “no-till” interchangeably
with conservation tillage, even though they may not be consistently meeting the
requirements of true no-till or direct seed practices.
Some extension agents noted that a small number of farmers in the county and the
Fifteenmile Watershed had returned at least part of their land back into some form of
conventional tillage or minimum tillage after practicing no-till. These conversions were

90
due to a variety of issues related to difficulties with herbicide resistance, difficulties
managing crop stubble, and changes in weather patterns that made predicting farming
difficult. Under conventional tillage, farmers could “farm by the calendar,” meaning that
there was a set schedule and time by which preparatory work and ongoing management
of farming occurred. With no-till, on the other hand, extension agents and several farmers
noted that even though they were getting better at no-till practices, they were still trying
to figure out the best timing for some practices. This trial-by-error approach has
sometimes proven difficult, especially during times when changing weather patterns have
been prevalent in the region and the state. Several farmers even brought up climate
change as a contributing factor to their difficulties with management, but the majority
indicated that conditions under no-till were better overall than when they practiced
conventional tillage or other forms of conservation tillage as distinguished from their
current definition of no-till practice.
Stream Modifications and Unrecognized Sources of Sediment
The streams of the Fifteenmile Watershed have undergone extensive modifications.
Typical manmade channel modifications include dikes, riparian roads, stream crossings,
dams, and rip rap in many areas (Clark, 2003). According to ODFW, which has been
heavily involved in various stream modifications and improvements for the past several
decades, all of Fifteenmile Creek has been altered or straightened at one time or another
starting in the 1940s and after every flood since then. Flooding is a natural factor that
modifies the channel of a stream, and most agencies and farmers indicated the most
extensive floods occurred in 1964 and 1996.

91
The prevalent modifications to streams that occurred throughout the watershed were
corroborated by investigation of aerial imagery of streams in the watershed from 1939
forward. Historical images in various parts of the watershed and for all of the properties
sampled were available for the years 1939, 1947, 1958, 1965, and 1972 from the
University of Oregon’s historical imagery collection. The most apparent changes to
streams occurred during the years of the aforementioned floods in 1964 and 1996.
Imagery from the year 1964 was not available, but aerial imagery from 1965 that showed
changes in stream configurations post-1964 flood were reviewed.
Figure 3.5 shows an example of a stream that has had major changes within its
channel configuration from 1947 to 2011. Although it was impossible to avoid sampling
in channel areas that have been modified, locations where channels have been modified
extensively, as shown in the figure, were not chosen for sampling. These locations
included areas where intentional channel modifications had been made after the 1960s
(when cesium-137 would have been deposited) and areas where the 1964 and 1996 floods
changed channel morphology.

92
Figure 3.4. Figure showing an example of a highly modified stream in the watershed. The red arrows
draw attention to areas that were modified extensively over several decades. Many channel modifications
like those shown above are prevalent throughout the Fifteenmile Watershed. Streams that showed
significant channel modification were avoided during cesium-137 sampling for this study.
Aerial photograph inspection and review of watershed assessments demonstrate that
floodplains have been extensively used for agriculture and residence. Stream channels
have been manipulated in order to consolidate farm fields, protect infrastructure, and
accommodate roads (Clark, 2003). However, consensus on whether or not the floodplain
currently interacts with streams in the Fifteenmile Creek varied amongst farmers and
agency employees. Conversations with ODFW indicated that the main Fifteenmile Creek
no longer interacts with floodplains anywhere in the Fifteenmile Watershed, while other
agencies have identified locations in the watershed that still interact with the floodplain.

93
Three farmers out of the six interviewed indicated that stream erosion had occurred on
their properties prior to the planting of vegetation in Conservation Reserve Enhancement
Program (CREP) corridors. The other three interviewed farmers were not confident
about the ways in which stream channels interacted with floodplain areas or eroding
terraces that crossed their properties. According to the SWCD, since the late 1990s,
CREP has been implemented in the majority of the watershed through contracts with
farmers to improve stream habitat and prevent erosion to streams. In addition, ODFW
constructed approximately 1000 in‐stream fish habitat structures using rock and logs in
addition to constructing 209 miles of riparian protection fences for over 100 miles of
stream from intensive livestock grazing funded by BPA from 1986 to 1994 ODFW.
Given the continued exceedances of sediment TMDLs, the USFS, DEQ, and ODA
have attempted to determine how much sediment is still in streams and if it has improved
over time since no-till practices were implemented. Pebble counts conducted by USFS
have been replicated by DEQ since the early 2000s. Relative Bed Stability (RBS)
measurements were conducted by ODA in 2005 and 2006 and again in 2015 and 2016.
Although DEQ, ODA, and USFS have admitted that variations in methods have occurred
from year to year, all of these analyses have indicated that sediment in streams has not
improved (Jessup, 2016). A recent report prepared for DEQ evaluating all of these
methods specifically notes that data from 2000 to 2015/2016 using pebble count
measures and data from 2005/06 to 2015/16 using RBS methods indicates that no
improvements in substrate conditions were detected using t-tests watershed-wide (Jessup,
2016).

94
To assist with constraining the local sources of sediment from channel banks, this
study employed the use of the TereX tool (Stout et al., 2014) and 1 meter LiDAR, to
identify floodplains and eroding terraces that are likely contributing sediment to streams.
It should be noted that the tool is capable of identifying, and did identify, many locations
throughout the watershed that were likely cultivated terrace source areas, but these areas
are not included in this analysis. Permission to access these cultivated surfaces was not
granted for verification, so at this time it is not reasonable to include those areas in this
study. However, a future study should include analysis of the cultivated surfaces if access
is permitted.
The LiDAR analysis identified floodplains and upland terraces (excluding cultivated
surfaces) that are likely contributing sediment to streams (Figure 3.6). Many of the
floodplain areas are adjacent to, or border, farmland that is located in floodplain areas.
Cumulatively 0.92 square kilometers of surfaces have been identified as contributing to
the watershed. While, the TerEx tool itself does not give a value for the amount of
sediment generated at each location, the surface area of likely surfaces that are eroding
into streams, coupled with the information from the cesium-137 analysis revealing that
51% of sediment is generated from locations along channel banks is cause for concern.

95
Figure 3.5 Locations where the TerEx tool identified likely floodplain and eroding terraces throughout
the watershed.
The source areas along channel banks identified by the TerEx tool were overlaid with
RBS sites that were found to be in poor or fair condition from the 2016 report prepared
for DEQ (Figure 3.7). At these locations, an exceedance of fine particles were found in
relation to the rest of the watershed. By combining the RBS sites with the map of
contributing floodplains and terraces, it was deduced that three of the five sites that were
in these conditions were also located in areas identified as source areas. One contributing
floodplain identified by TerEx was identified as being 60 meters downstream of another
RBS site in poor condition (24567). Another site (28337) does not appear to be impacted

96
by floodplains or terraces in the vicinity, as it is located across a roadway from these
features. RBS sites located in the watershed, but in forested area were not included in this
map, as the processes affecting sediment in streams in forested areas were not assessed in
this study and are likely driven by different forces than those that occur in the agricultural
regions of the watershed. Nonetheless, using the map could prove useful for future
assessments in the watershed to determine sediment source contributions and to assess
the conditions of substrate in those locations. This information would assist in decisions
on how stream management could be improved. In the most conservative estimate that
takes into account variability of no-till practices where two-thirds of farmers are
practicing no-till with minimal disturbance, 118,179 tons of soil are being eroded into
streams without accounting for channel bank erosion. With additional sediment generated
from floodplains and terraces near streams, it becomes clear that erosion estimates in the
watershed are likely substantially lower than they should be, and the additional
information provided by investigating source areas in and near streams could be useful in
efforts to quantify the amount of sediment being generated.

97
Figure 3.6 RBS sites in fair or poor conditions (locations with an excess of fine particles) combined
with terraces and floodplains identified as likely sediment sources.
Conclusions
This study provides valuable information about the likely sources of sediment in the
Fifteenmile Watershed. By incorporating a mixed-methods approach, this study found
that there are large disparities between the erosion that is currently estimated in the
watershed with RUSLE2 and what is more likely occurring. The mixed-methods
approach used allowed for a greater investigation into the complexity of why sediment
was likely still coming from cultivated fields and revealed that current conservation

98
practices are still likely contributing large amounts of sediment to streams. The study also
demonstrated that current erosion estimates do not take into consideration erosion from
channel banks, which accounted for just over half of sediment in the watershed.
This study also highlighted the need for input of methods that allow for engagement
with farming communities, as the variations in practices in no-till would likely not have
been factored into this analysis unless interviews and surveys had been conducted. By
combining these methods with measurable quantitative data produced by cesium-137
analysis and LiDAR analysis, this study showed that lands that are largely managed with
conservation management techniques are contributing far more sediment than previously
thought and that streams modified to not interact with watershed floodplains actually do
in many locations. Conventional Universal Soil Loss Equations (USLE) based estimates,
such as RUSLE2, are useful for identifying local erosional hotspots, but USLE-based
approaches are inherently limited at the larger watershed scale by the a priori assumption
that the contemporary sediment yield is directly attributable to erosion ongoing in the
upland environment (hillslopes and agricultural fields) (Stout et al., 2014). Given that
over half of the sediment in the streams is generated from channel bank locations in the
watershed and that sediment conditions have not improved since no-till was implemented
in the watershed, it is clear that additional considerations for these source areas need to be
factored into methods for reducing sediment in the watershed.
It should also be noted that this study’s findings do not indicate that no-till farming is
doing more harm than good for the watershed. It has been well documented that no-till
practices reduce erosion rates from dryland agricultural watersheds (e.g., Fernandez-
Cornejo, J. and Hallahan, 2013; Fu et al. 2006; Schreiber et al. 2001). As discussed

99
previously, prior to no-till practices, farmers faced severe consequences in the form of
wind and gully erosion when conventional till was practiced. Rather, this study finds that
the amount of disturbance and amount of erosion varies widely by the way no-till is
practiced in the watershed, and that more effort should be put into finding out what
practices are causing different amounts of erosion in the watershed. This could be done
by a more detailed engagement with farmers in the community to assess how much
disturbance their machinery causes to the landscape and working on practices that could
improve and minimize erosion on the landscape. This would be beneficial for the entire
community, as many of the farmers involved in this study expressed their pride in being
involved in conservation programs and were genuinely interested and engaged in
practices that would improve stream conditions. As mentioned previously, between 93 to
96% of farmers in the area at least attempt to use no-till on their property, and the farmers
that participated in this study are likely among the most engaged and dedicated to
practicing conservation with a goal of improving the watershed.
Further, it should also be noted that the farmers in this study and throughout the
watershed were encouraged to participate in no-till through a variety of programs and
contracts that were made available to them. The information supplied to them by NRCS
about no-till and how much it improves farming conditions and what their practices
should be should have significantly improved stream quality, but has not for the
following reasons: 1) conservation programs associated with farm bills often have loosely
defined requirements in how to improve environmental conditions 2) lack of resources
(both in labor and time) available to government employees who are instructing farmers
how to use no-till limit the amount of critical evaluation of how effectively a given

100
conservation is being practiced and 3) continued misinformation provided to farmers and
the community perpetuate the idea that environmental conditions are improving when
they are not. This last point is most damaging and frustrating for farmers that are engaged
in conservation practices as, on the one hand, they are encouraged to practice a method
that is said to improve their environment, while on the other, they are regulated when the
methods they think they are using correctly do not work as intended. When one makes
these observations, it is clear that the persistence of sediment in the watershed is more a
reflection of inadequate policies and instruction derived from an institutional level than
any one practice that a farmer may be practicing on his property, and strategies to identify
how conservation methods could be improved should be discussed.

101
Chapter 4: A Critical Physical Geographical Analysis of Conservation Management
Practices: Implications for Soil Quality, Water Quality, and Farm Bill Policies
Affecting No-Till Agriculture
Introduction
A variety of conservation trends have gained and lost favor throughout the years in
agriculture, with U.S. Farm Bills often influencing what conservation practices are
implemented by farming communities throughout the U.S. (Lehrer, 2010; Rigdon, 2011).
This paper focuses on the unintended consequences of conservation management
techniques and programs in the Fifteenmile Watershed of Wasco County, Oregon.
Farmer enrollment in various conservation management agricultural techniques, loosely
referred to as no-till agriculture in the study area, has affected soil and water quality
through the increased use of herbicide and variations in the way no-till agriculture is
practiced. As a result, glyphosate, the most used herbicide in the world (Benbrook 2016),
has been detected in soil, sediment, and water at concentrations below regulatory
standard levels, but above levels that have been shown to have negative impacts to
human and ecological health in numerous peer-reviewed studies. Soil erosion processes
have also been affected by uneven implementation of best management practices (BMPs)
associated with conservation management techniques, and these variations have failed to
reduce sedimentation in streams as much as is needed for many of the county’s streams to
be taken off the state’s regulatory impaired water quality list (EPA, 2015). Given that
participation rates in conservation programs is high among farmers in the county, many
practitioners wonder why the practices have failed to produce the desired results and if
the conservation practices are as effective as they should be. This paper will discuss the

102
contributing physical and social factors that have led to the current environmental issues
in the watershed.
Background
The specific focus of this study is the Fifteenmile Watershed portion of Wasco
County, Oregon. The watershed experiences extreme precipitation and wind events, and
is comprised of a landscape of steep slopes and hills prone to erosion even in the absence
of weather-related events. As such, farmers in the watershed have always had to
implement a wide variety of conservation methods in an effort to combat soil erosion,
even since the 1940s when conservation practices were not widely practiced across the
U.S. (Rigdon, 2011). The implementation of the 1985 Farm Bill encouraged many
farmers to engage in more conservation practices such as the Conservation Reserve
Program (CRP) (Hall, 1998; Rigdon, 2011). However, substantial changes in
conservation management techniques in most of the Fifteenmile Watershed did not occur
until severe flooding in the years 1995 and 1996 resulted in mass erosion events that
caused most farmers to consider no-till farming as an alternative to conventional farming
practices. Farm subsidies and grants associated with the 1996 and 2002 farm bills
incentivized farmers to buy the equipment needed to make the conversion to no-till.
Educational programs hosted by the Natural Resource and Conservation Service (NRCS)
and local Wasco Soil and Water Conservation District (SWCD) further assisted in the
transition from conventional tillage to conservation management techniques associated
with no-till. By 2012, 93% of farmland was managed under some form of no-till
agriculture in the Fifteenmile Watershed (SWCD, 2015).

103
Although herbicide use, particularly glyphosate, is known to be on the rise because of
the switch to no-till, most of the concern in the study area has been on soil erosion issues
because they are directly related to sedimentation issues in streams. These issues were
supposed to be remedied by wide scale conversion to no-till conservation practices and
have gained the attention of regulatory and non-regulatory managing agencies alike, as
they have not been resolved. Given that sediment remains a problem in streams
throughout the watershed and that additional problems associated with no-till and
herbicide have arisen, I ask the following questions: Why have sedimentation issues
related to soil erosion persisted in the presence of conservation programs that are
supposed to improve water quality? How and why has the focus on soil erosion obscured
the impacts that herbicide use has had on soil quality and its potential impacts to human
and ecological health? Are farmers being encouraged through quasi-state actors and
government subsidies to engage in conservation programs in ways that do not support
programs goals or result in contradictory outcomes and unintended consequences?
Critical Physical Geography
To answer the research questions of this paper, I engage with a Critical Physical
Geography (CPG) framework. CPG has largely arisen out of the need to expand political
ecology’s horizons and has sought to rework the relationship between human and
physical geography (Lave et al., 2013). As several authors of the emerging field have
noted (Lave et al., 2013; Rhoads, 1999; Tadaki, 2015), studies of the environment often
become polarized as purely social or purely biophysical problems (depending on the lens
of the researcher) and CPG seeks to integrate the two. At the center of CPG is an
integration of the links between and causes for the social and biophysical causes of

104
environmental problems. As Lave et al. describe it, CPG promotes an integration of “the
power relations and social processes at the heart of critical human geographic inquiry and
the material processes at the heart of physical geographic inquiry in a wider project of
social and environmental transformation” (Lave, 2013). A CPG framework assumes that
human-environmental problems can only be well understood through a mixture of social
and environmental change and seeks to provide an interdisciplinary synthesis of
causation.
CPG has been used in conjunction with a wide variety of disciplines and has been
built on a transdisciplinary approach (Bridge 2008; Castree 2012; Clifford 2002; Goudie
1986; Harrison et al. 2006; Lane 2001; Rhoads 1999). CPG integrates particularly well
with biogeography, soil science, and geomorphology, because researchers in these fields
generally “share an intellectual world-view centered on complexity, uncertainty, the
importance of process, and the particularity of local systems” (Lave, 2014). Even though
it is a relatively new field, several articles and books that have served as inspiration to the
integration of CPG and soil science (Richter, 2007; Richter, 2001; Swidler, 2009) have
been published and there have already been exemplary articles and books published that
integrate CPG and soils analysis (Engel-Di Mauro, 2014; McClintock; 2015) since its
emergence in 2013.
With conservation management in mind, CPG is useful for determining how land
management decisions are made that affect soils, which are at the center of much of this
research. A CPG approach enables the study of soils in a way that promotes an open
discussion on political positions (e.g. about land use), the scope of science, and the role
of scientists relative to the state and the rest of society, among many other unspoken, yet

105
underlying issues (Engel-Di Mauro, 2014). It has also opened the door to the
incorporation of relations of power and social context into soil science (Lave, 2013;
Engel Di-Mauro, 2014; McClintock, 2015). Understanding these power relations in a
complex of nonhuman and human processes, all of which operate on varying
spatiotemporal scales (Richter, 2007), provides insight into a variety of environmental
problems on both regional and global scales.
Overview
I begin the paper with overviews of how farm bills have influenced conservation
practices, with particular emphasis on bills created after 1985. The farm bill of 1985,
known as the Food Security Act of 1985, was the first true conservation farm bill,
because it imposed financial penalties in the form of subsidy revocation on farmers who
failed to meet minimum standards of eco-conduct (Rigdon, 2011). Every bill since the
1985 farm bill has mandated that farmers incorporate conservation practices as part of
requirements for receiving subsidies. The types of mandates associated with the bills
offer substantial explanation as to why it is that no-till became the preferred conservation
method for much of the U.S. to prevent soil erosion. I then discuss the history of the most
widely used herbicide in the world, glyphosate, and how its rise coincided with – and in
many cases, increased in use because of – conservation practices associated with no-till.
In examining this, I point to how loose interpretations of conservation practices, influence
from agrochemical companies, and the rise of neoliberalism have all contributed to
environmental issues associated with no-till agriculture. To illustrate an example of how
these larger phenomena work in tandem on a local scale, I present the current
environmental impacts of no-till agriculture in The Fifteenmile Watershed of Wasco

106
County, Oregon. Numerous authors have discussed how social forces such as economics
or policy have influenced conversions to no-till (e.g. Lerher, 2010; Hall, 1998; Rigdon,
2011), while other studies have focused on the biophysical effects of no-till (e.g.
Fernandez-Conejo, 2013; Montgomery, 2007; Williams and Wuest, 2011). While these
studies may briefly allude to the social or biophysical causes of environmental issues
associated with no-till, they focus on one or the other, and do not explain how these
processes in combination translate to actual environmental change. By using a CPG
approach, this study will illuminate how these processes work in tandem to alter the
social and physical environments.
In line with a CPG framework, I used a mixed-methods approach to address both the
biophysical, quantitative aspects of this research as well as the social, qualitative aspects.
The methods had to identify: 1) Where sediment in the watershed originated to determine
if sediment in streams was sourced from cultivated landscapes under no-till management
in the watershed and/or from other sources in the watershed; 2) What concentrations of
herbicide were present in soil, sediment, and water in the watershed to verify if
concentrations of herbicide were persisting and terminating in stream waters and
sediment where they should not be present; and 3) How management practices were
affecting the geomorphological processes in the watershed as well as the concentrations
and persistence of herbicides. I describe the methods used to derive this information in
detail in Chapters 2 and 3 of this dissertation, and I will not discuss them further in this
chapter.

107
Farm Bills Lay the Groundwork for No-Till
Much has been written on farm bills and the reasons that certain subsidies and
commodities were included or excluded over time (e.g. Hall, 1998; Lehrer, 2010; Rigdon,
2011; Lenihan and Brasier, 2010). Briefly, farm bills establish federal agricultural food
policies, and historically have focused on farm income objectives, international trade, and
decreasing soil erosion. Farm subsidies associated with farm bills have a large influence
on what farmers do with their land – from what they decide to plant to how much they
irrigate – as well as determining what effort they put into protecting the environment
(Keeney, 2010). Farmers widely participate in subsidy programs, and therefore, also
widely participate in the management practices that are associated with the subsidies. For
example, from 1997 to 2006, producers in the U.S. received an average of 30% of their
net farm income from direct government payments (Service, 2007). The largest subsidies
are provided for corn, wheat, rice, soy and cotton (Gale, 2013). Early farm bills, like
those implemented between 1933 and the early 1970s, did not take into account
environmental problems that could potentially result from certain farm practices. These
farm bills were largely implemented with subsidies and commodities that were put into
place for the survival of the American Farmer (Lehrer, 2010; Rigdon, 2011). In many
instances, this set up led to the subsidy system rewarding unsustainable farm practices (de
Rugy, 2012). While policy makers and regulators encouraged farmers to use conservation
practices to combat erosion issues (like those experienced during the Dust Bowl era),
farmers were not formally required to use them in order to receive subsidies.
By including requirements that all farmers on highly erodible land file an erosion plan
within ten years, The Food Security Act of 1985 marked a major transition – from farm

108
bills focused on farmers’ survival to farm bills mandating conservation. The events that
catalyzed this transition, can actually be traced to an earlier farm bill, the Agriculture and
Consumer Protection Act of 1973. The 1973 farm bill prompted the era of large farms
and “fence row to fence row” planting practices and “get big or get out” policies
encouraged by Nixon’s Secretary of Agriculture Earl Butz (Lehrer, 2010). While the
policies associated with these practices eased worries about potential food shortages at
the time, intensive tillage associated with these operations caused numerous
environmental concerns, with the major one being increased soil erosion (Hall 1998,
Lehrer, 2010; Rigdon, 2011). Hence, in the 1970s and 1980s, recognition that soil erosion
was outpacing soil production led to warnings that society could “run out of soil before
oil” (Brown, 1981). Further, farmers and researchers began to report that substantial
losses of soil were leading to the need for more and more expensive inputs to sustain high
crop yields (Milham, 1994).
Many of the practices that followed the 1973 farm bill also ultimately led to the farm
profitability crisis of the 1980s (Rigdon, 2011), which further propounded these issues.
This time period was marked by declining farm commodity prices, increased farm loan
interest rates, declines in land prices, and increased global competition and trade wars
that made farm profitability increasingly difficult (Basran and Hay, 1988; Goodman and
Redclift, 1991; Winson, 1992). As a result, many farmers were forced to seek out new
techniques and technologies.
It is within this context that the search for a more sustainable, soil conserving form of
agriculture began to take hold, and is best described as the result of several processes of
neoliberalization discussed herein. While many forms of neoliberalization shape the
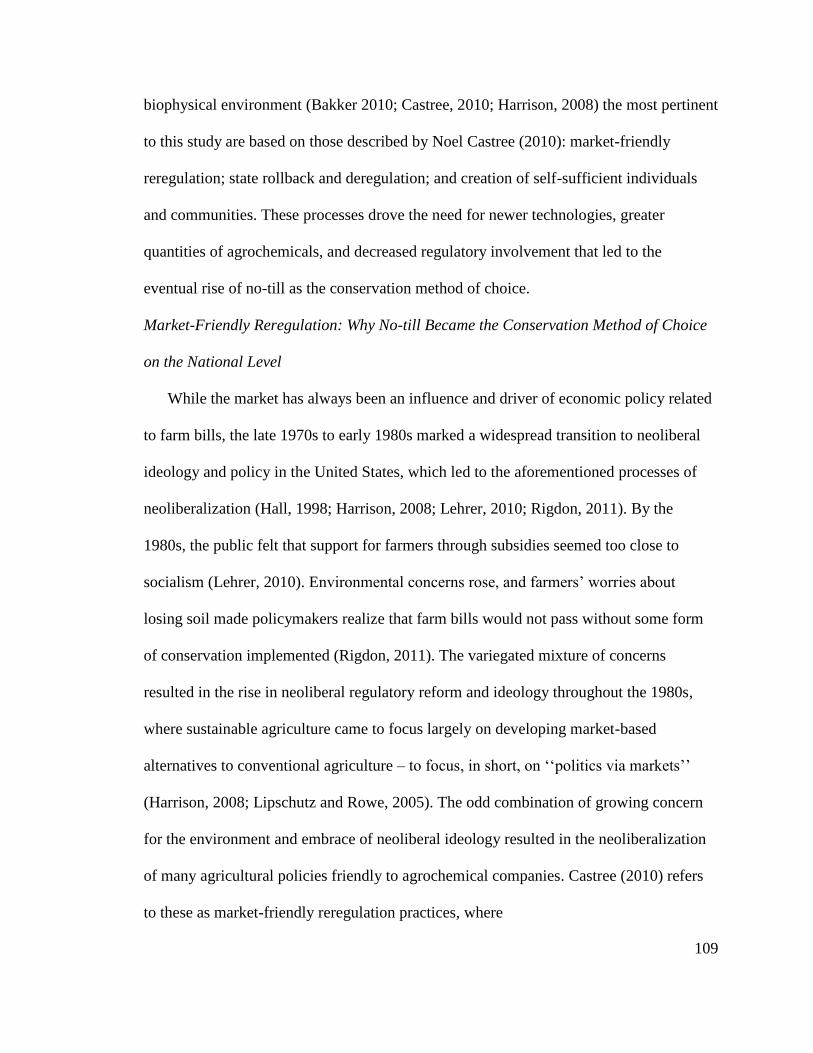
109
biophysical environment (Bakker 2010; Castree, 2010; Harrison, 2008) the most pertinent
to this study are based on those described by Noel Castree (2010): market-friendly
reregulation; state rollback and deregulation; and creation of self-sufficient individuals
and communities. These processes drove the need for newer technologies, greater
quantities of agrochemicals, and decreased regulatory involvement that led to the
eventual rise of no-till as the conservation method of choice.
Market-Friendly Reregulation: Why No-till Became the Conservation Method of Choice
on the National Level
While the market has always been an influence and driver of economic policy related
to farm bills, the late 1970s to early 1980s marked a widespread transition to neoliberal
ideology and policy in the United States, which led to the aforementioned processes of
neoliberalization (Hall, 1998; Harrison, 2008; Lehrer, 2010; Rigdon, 2011). By the
1980s, the public felt that support for farmers through subsidies seemed too close to
socialism (Lehrer, 2010). Environmental concerns rose, and farmers’ worries about
losing soil made policymakers realize that farm bills would not pass without some form
of conservation implemented (Rigdon, 2011). The variegated mixture of concerns
resulted in the rise in neoliberal regulatory reform and ideology throughout the 1980s,
where sustainable agriculture came to focus largely on developing market-based
alternatives to conventional agriculture – to focus, in short, on ‘‘politics via markets’’
(Harrison, 2008; Lipschutz and Rowe, 2005). The odd combination of growing concern
for the environment and embrace of neoliberal ideology resulted in the neoliberalization
of many agricultural policies friendly to agrochemical companies. Castree (2010) refers
to these as market-friendly reregulation practices, where

110
the state in its various forms becomes ‘market manager’ or ‘night watchman’, and
less of a ‘provider’ to the citizenry or special interests therein: it intervenes for the
economy not, as it were, in it… to enable ‘free’ movements of money capital and also
other less ‘fluid’ commodities (Castree, 2010, p. 1728).
In the case of agricultural policy, this reregulation ultimately had consequences for
the environment. For example, soil conservation problems were known to be serious
issues that were largely a result of the 1970s era policies that encouraged intensive tillage
and high yields. However, the conversation surrounding conservation measures that led
to the 1985 farm bill asserted that, with good management and best management
practices (BMPs), farmers could produce more productive soils with minimal adverse
effect on the environment, while still using intensive farm practices. Hall (1998) and
Higgins and Lockie (2002) have argued that by controlling and framing the discussion in
this way, both industry and the government were able to assert that a major shift away
from the intensive use of soil resources or the focus on high yields of a limited range of
crops was not required. Rather, the focus stayed on providing high yields even though the
conversation was actually supposed to be about conservation practices that preserved soil.
This framing of the discussion was a huge benefit to agribusiness. The conversation
seemingly discussed conservation practices that could help with erosion, and did address
some of the problems caused by erosion (Langdale, Leonard, and Thomas, 1985), but it
still allowed for continued exploitation of productive soils at the same basic rate, and
with a continued reliance on chemical fertilizers (Hall, 1998).
By the early 1990s, it was clear that conservation requirements would likely be a
permanent fixture of new farm bills. Agribusiness and state interests had clearly aligned.
No-till agriculture was gaining popularity as a conservation method that would have high
production yields while mitigating the soil erosion issues that were so prominent and at

111
the forefront of environmental conversation efforts (Adkin, 1992; Buttell, 1993). As
Marshall (2000) notes, agribusiness interests at the time maintained strong relationships
with the USDA and became more involved in the 1996 farm bill than they had ever been
previously. Congress and agribusiness interests aligned to champion farm policy that was
driven by a liberalized trade agenda. Their goals were to increase efficiency and
competitiveness, while maintaining a balanced federal budget that minimized the needs
for social welfare programs (Sorenson, 1994).
An additional perk to agribusiness was that no-till often required higher inputs of
chemicals to manage weeds that were becoming more prolific (Glenna, 1999). This boost
in chemical usage would bolster sales of chemical inputs in agribusiness that had been in
decline since the early 1980s (Osteen and Fernandez-Conejo, 2013; Robbins and Sharp,
2003). With advances in technology and new formulations of chemicals available,
agribusiness enabled farmers to increase farm size acreage, which meant greater sales of
chemical inputs to control weeds. These financial incentives appealed to farmers, as well,
because no-till had the potential to provide production efficiencies through cost savings
and greater concentration of land by large farm operators (Glenna, 1999; Lehrer, 2010).
No-till was attractive to farmers because larger equipment and reliance on chemicals
meant reductions in labor costs and more farm acreage; overall, farmers could become
more “efficient” (Hall, 1998; Rigdon, 2011). In summary, no-till agriculture was so
successfully championed as the conservation method of choice because it had
ideologically aligned the interests of farmers, the state, and agribusiness. The state
seemingly mitigated erosion issues through improved conservation programs; farmers

112
benefited by becoming more productive, efficient, and profitable; and agribusiness saw
an increase in sales of equipment and chemical inputs.
The alignment of state, agribusiness, and farm group interests via the market-friendly
practices that drove farming regulations and policy paved the way for advances in
technology that supported the transition to no-till in the late 1980s to 1990s. Figure 4.1
shows a timeline of key farm bills, economic, regulatory, and environmental trends that
have influenced farm policies, along with the eventual technological innovations that
contributed to the rise of no-till. Even though there have been events that could have
steered farm policy away from no-till and towards less chemically intensive forms of
conservation agriculture – the release of Rachel Carson’s Silent Spring in 1962, the
founding of the EPA in 1972, or the rising concern over chemicals and their effects on
the environment in the 1980s (Hall, 1998) – these events were often countered by market
forces that were bolstered by limits to regulatory authority. For example, the EPA was
only a few years old before its budget plummeted throughout the late 1970s, a budget that
has not recovered since (US OMB, 2006). The Toxic Substances Control Act (TSCA)
was implemented in 1976 to regulate the introduction of new chemicals and some
existing chemicals. However, it was largely limited in its authority from the outset
because chemicals that were already released on the market (of which there were 60,000
released prior to 1976) were grandfathered into the act and deemed safe (EPA, 2017). As
of 2015, only 250 of the original 60,000 chemicals that were grandfathered in have been
tested for safety, and since 1976, more than 80,000 new chemicals have been released
(EPA, 2017). Many of these have been agrochemicals, which have become more potent
in their chemical formulations over time (Harrison, 2008; USDA, 2017). Therefore, by

113
the early to mid-1990s, much of the path had been paved for no-till technologies that
would support sales of large agribusiness chemical inputs.
Figure 4.1 Economic, regulatory, and environmental trends that have influenced conservation farm
bills.
The rise of precision agriculture was particularly important for the success of no-till
agriculture during this time. Precision agriculture uses proximal and remote sensor
surveys to delineate and monitor within-field variations in soil and crop attributes,
guiding variable rate control of inputs, so that in-season management can be responsive
(Hedley, 2014). Its rise during the 1980s was made largely possible by the emergence of

114
affordable geographic positioning systems (GPS) technology, numerous affordable soil
and crop sensors, and improved computer technologies and software that made precision
application of various chemicals and sprays possible. Since precision agriculture came
about, it has been praised for its increases to efficiencies for farming (e.g.Gonzalez-de-
Soto et al., 2016) and its potential to reduce chemical and fertilizer use overall for most
farms (Hedley, 2014). However, given that rates of herbicide use have increased over the
same time period as developments in precision agriculture (USDA, 2017), and increases
in chemical potency have also occurred during that time, it is clear that it has not
mitigated increased amounts of agrochemicals in the environment completely, and cannot
solve the entire problem of increased chemical use on its own.
Hence, by the 1996 and 2002 farm bills, which allotted major payments to farmers
who practiced conservation tillage, the technologies to make no-till successful were
already available. Farmers across the U.S. were able to buy larger, expensive equipment
in the name of conservation. Prior to these farm bills, farmers had not had access to, and
would not have access to, this equipment without programs like the Environmental
Quality Incentives Program (EQIP) and Conservation Security Program (CSP) funded by
these farm bills. These programs provided farmers and ranchers with financial cost-share
assistance and technical assistance to implement conservation practices on working
agricultural land and allowed them to buy no-till equipment and technologies needed for
chemical sprays.
Not surprisingly, the increases in conservation practices also coincided with the
increase of glyphosate, commonly referred to as Roundup (Figure 4.2). Between 1995
and 2015, when farm bills increased payments for no-till and other conservation-related

115
methods, glyphosate application in the U.S. increased from 28 million pounds to 300
million pounds (Benbrook, 2016; USDA, 2015). As genetically engineered and herbicide
resistant crops gained market share from 1996 to 2000 – 1996 being the year of the
Freedom to Farm bill, and 2000 when glyphosate lost its patent on the market –
glyphosate rates rose by 70 million pounds and accounted for 80% of national use
(Benbrook, 2016). By 2010, over 90% of farmers used glyphosate (Benbrook, 2016;
NASS, 2017). Much of the increase in glyphosate is due to the rise of “Roundup Ready”
crops that are resistant to glyphosate damage, but the increase in glyphosate is also due to
the rise of conservation tillage practices, such as no-till (Service, 2007).

116
Figure 4.2, Herbicide resistance, trends in commercial sales, and regulatory trends influencing
increased glyphosate use and human and environmental health concerns. Adapted from Benbrook (2016)
and Mesnage et al. (2015).

117
The timeline above draws from timelines by Benbrook (2016) and Mesnage et al.
(2015) and highlights glyphosate trends in human and environmental health, herbicide
resistance, and regulatory trends, with additions from other peer-reviewed sources and
regulatory sources (Grandjean and Landrigan, 2014; Chang et al., 2011; USDA, 2014;
USDA 2015; IARC, 2015) as well as public interest health groups like Moms Across
America. The timeline shows that while regulatory allowances for glyphosate residue in
various crops increased from the mid- to late-1990s forward, there was also an increase in
the following: general glyphosate use, an increase in where glyphosate is found in the
environment, increases in herbicide resistant weeds, and increases in human and
ecological health concerns. For instance, in 1996, only one glyphosate resistant weed had
been confirmed globally. By 2014, over 100 million acres were infested with glyphosate
resistant weeds, and by the following year, 32 species of glyphosate had been identified
worldwide (Benbrook, 2016). As time went on, and glyphosate lost its patent in 2000, the
EPA made more exceptions to allow higher levels of glyphosate residue in food crops.
More genetically altered Roundup Ready crops and crop technologies were developed
that would support conservation tillage techniques (such as no-till) as well. During this
time, glyphosate use increased approximately 15-fold from 1996 to 2015 (Benbrook,
2016).
Many of the farm bill trends that allowed for increases in payments to farmers for
technologies coincided with these developments, and now glyphosate is detected in the
majority of air, water, soil, and sediment in the U.S. (Battaglin, 2014; Chang et al, 2011);
it is even found in our bodies (see Schinasi and Leon, 2014; Gandjean and Landrigan,
2014; Mesnage et al., 2015). The widespread presence of glyphosate is of growing

118
concern. The International Agency for Research in Cancer (IARC), a division of the
World Health Organization (WHO), has classified glyphosate as a probable carcinogen,
and scholars have published a growing number of studies on endocrine disruption
concerning glyphosate. In the timeline, it is also important to note that many of the
human health studies have been reviewed as part of a larger group of several meta-
analysis studies (e.g. Mesnage et al., 2015), and only represent a subset of a much larger
number of cases where glyphosate has been found to have carcinogenic or endocrine
disrupting effects.
Market Friendly Reregulation in the Fifteenmile Watershed
The story of how no-till came about in Wasco County parallels many of the larger
national trends of the 1980s and 1990s, with technological advances and economic
incentives for farmers and agribusiness often driving conversion to no-till more than
environmental issues. In the late 1980s, when it became clear that participation in some
form of conservation would be necessary to continue to receive subsidy payments, some
farmers in neighboring Sherman County (directly east of Wasco County) decided to try
no-till. Interviews with extension agents, several members of the SWCD, and various
agency officials indicated that this attempt to switch to no-till was largely unsuccessful
because the equipment necessary to do no-till was prohibitively expensive and not
actually designed for the landscape in the area. Others noted that the chemicals needed
for no-till were not yet available. Influenced by their neighbors in the adjacent county, a
handful of farmers in Wasco County‘s Fifteenmile Watershed also tried to convert to no-
till at that time, but encountered the same issues as the farmers in Sherman County. With
little success, farmers still participated in programs like Conservation Reserve Programs

119
(CRP) that were associated with the 1985 farm bill, where environmentally sensitive land
prone to erosion was taken out of production. In large part, however, most people
continued to use various forms of conservation tillage that fell into reduced tillage
categories. The problems associated with no-till farming in the 1980s came up often
during interviews, as reflected in the quote below:
The problem is that it became apparent that after the fact that it really wasn’t
sustainable because the mechanical technology was sort of one-size-fits-all and didn’t
really fit the varying topographies at the time … It was such a huge and heavy drill –
the no-till drill or yielder drill, you call it – it took so much horsepower. It didn’t
really fit the topography at all. The yielder drill was technology that was available but
it really wasn’t very adaptable to the very physical landscapes and the changes in the
landscapes around. When you are on a hillside, with the yielder drill, it’s like, “Oh
my gosh!” you know, it’s a little scary. You get to Wasco County and there’s some
really steep slopes. The other problem was that there wasn’t the chemical technology
to support it and I think that you probably get that problem from everybody. I mean
things like Roundup – and you really need help to control the weeds. So we noticed a
hugely massive problem for no-till early on and I think what probably one of the
biggest, my take on it, one of the biggest reasons it didn’t really take off very well. It
got started, people thought it was a really great idea, it made sense economically, but
there just wasn’t any way to make it sustainable, and so things kind of died down, and
in the process some of the bigger companies started looking at drills and Monsanto
and others looking at weed controls, weed sprays. So it kind of sort of cooled down
and then came back. In the process, people, like in Sherman County, really, they got
burned. You might find some of the old equipment in the draws down there.
(extension agent, personal interview)
Even though there were environmental concerns in the watershed, what actually
provided much of the incentive and means for farmers to move to no-till was the number
of grants that were available through the 1996 and 2002 farm bills. These grants, along
with improvements in technology, made the equipment feasible for use in the county.
During an interview, the former NRCS district conservationist related the effect that grant
money had on farmers’ accessibility to no-till equipment:

120
There were concerns and a lot of people were wanting to try it but the costs were
prohibitive if you tried to do it on your own, so there was a lot of interest on how can
you help us do this, give us some financial help. With no-till, there was quite a lot of
unproven chemical so there was a lot of train wrecks. Every time we tried no-till we
would lose our yields … later, we had 300-and-some applicants and we ended up
funding 290. Close to 26 million dollars went into that project and that would include
all tillage systems, it wasn’t just no-till, but quite a bit went into no-till. (former
NRCS district conservationist, personal interview)
Once the technology and money were available, the idea of switching to no-till was
considered an actual possibility and farmers in the area took the opportunity to convert.
One no-till farmer reflects,
Then historically, you know, in the ‘80’s a lot of farmers went broke and the joke was
you would go to one of those auction sales and there would be a no-till drill there and
to a certain extent it was true. But it was a different no-till technology to what we
have now. I mean, what really made no-till work is inexpensive Roundup. Really, in a
nutshell, if you didn’t have inexpensive Roundup, you couldn’t afford to do it. (no-till
farmer, personal interview)
A non-regulatory agency employee also described how the cost of no-till
equipment created barriers to purchasing the equipment before grant money was
available:
The big thing was investment of the equipment and that’s what most of the money
ended up going for. No-till drills are expensive and when you get one of those you
have to have a bigger tractor, it was a real expensive proposition moving into that.
(non-regulatory employee, personal interview)
Changes in technology led to bigger farms using very different equipment in the
Fifteenmile Watershed. It also led to more chemical equipment and higher rates of
chemical use. Just as it did nationally, the transition to no-till had an effect on labor and
perceptions of herbicide use. Much of the ideology of improved efficiency and cost-
savings were expressed during interviews. One extension agent discussed how advances

121
in technology changed farm practices in the watershed and drove farmers to increase their
acreage:
I just don’t know. But right now those guys are struggling, and they’re kind of
looking back, which I hate to see. You’ve got to stay in business, you’ve got to
cover costs. A combine cost half a million dollars now. So it’s serious money for
these guys and, that’s the reason – when I started, the average farm size was 1,500
acres, now its 4,000 plus acres, for a family farm, a husband and wife and maybe one
employee or one family member, a son or daughter that’s helping them and that’s
what they run the place on. It’s just like McDonald’s. You have to get bigger and
bigger to be sustainable. So when you look at this equipment, like at the Wasco
county fair they had this – I’ve seen this before but – it’s a self-propelled sprayer.
That thing must be 50 or 60 feet long. You could not see it out of both sides of your
eyes. It sort of feeds on itself. As the costs rise – what is the wheat price now? If you
look over the decades, guys don’t really make a lot of money, you know. So they got
to produce more, so they need bigger equipment, so they need bigger farms. It’s just
like an arms race, you know. You got to keep getting bigger, so you need bigger
equipment. Bigger acres, just less people. People cost so much money, so you can’t
afford it. It’s like there’s just no winning in this world. (extension agent, personal
interview)
In another interview, the former NRCS district conservationist talked about how the
decline in Roundup’s price, coupled with better no-till equipment, incentivized farmers’
conversions to no-till practices throughout the watershed.
I can’t remember how much Roundup [used to] cost per gallon. So once it became
more affordable and effective, the equipment became more specific for no-till and
direct seed, better built, more reliable, but still expensive. More and more people
started looking at it as an alternative practice, so with those cost share programs we
really started seeing a huge change and people were adapting. And it was a little
strange because it wasn’t just the cost share. It was a lot of peer pressure, looking
over the fence of the neighbors and seeing that they were doing it and it was
successful. People weren’t seeing huge declines in their yield, they were still able to
raise good wheat, they were able to cover more acreage, they were more efficient, the
labor cost went down and it was kind of a win-win for a lot of people. Some of the
big growers here in Wasco County made the switch without any cost share. Then we
saw the writing on the wall that we can save 15% on our overall inputs, it just made
sense for us to do it, we didn’t care if we got cost share on not. One man can cover a
lot of acreage so unfortunately a lot of hired men lost their jobs. So if you are farming
a thousand acres a year maybe it’s not such a big deal but if you’re farming 5,000

122
acres per years you’ve got to be able to get over all that in a timely manner. So
spraying is one important part to that. Controlling your weeds because that was one of
the biggest hang-ups why no-till was not successful; it was not able to control the
weeds. But with Roundup and other chemicals they were able to do a better job of
controlling the weeds and to do it relatively quickly. They are applying it more often,
the chemicals are probably more effective, they are not relying on tillage to control
their weeds, they basically have to rely on chemicals to control their weeds. (former
NRCS district conservationist, personal interview)
These interviews illuminate how market-friendly practices driven by agribusiness
influenced the conversion to no-till in the Fifteenmile Watershed. However, the reader
should also consider how the actual physical environment of the Fifteenmile Watershed
contributed to the widespread conversion to no-till as well. Much of the conversion to no-
till was driven by market forces and incentives that were influenced by farm bill policy,
but the conditions specific to the landscape (e.g., steep slopes and mass erosion events)
also made it necessary for farmers to find a technology that had been proven to prevent
erosion and stabilize the literal foundations of their economy. Even in the absence of no-
till, it is likely that farmers would have eventually tried different methods and
technologies in order to mitigate some of the effects that unsustainable farming practices
were having on the watershed. However, the timing of market-driven no-till technologies
and their capacity to mitigate erosion concerns experienced by farmers in the watershed,
which are more severe than in other places in the U.S, made no-till more of an obvious
choice for farmers in the Fifteenmile Watershed. These specific concerns coupled with
larger agri-environmental policies caused the watershed to participate in and experience
many of the trends that affected agricultural communities across the U.S., as will be
discussed shortly.

123
The Environmental Impacts of Market Friendly Reregulation
The data collected for this study indicates that glyphosate is affecting the environment
in multiple ways in the Fifteenmile Watershed. The most traceable effects are herbicide
resistance in no-till fields, and glyphosate contamination of soil, sediment, and water at
levels that have been found to impact human and ecological health throughout the
watershed. During interviews, farmers – as well as almost every regulatory and non-
regulatory agency employee working in the area – named a number of herbicide resistant
weeds. Most interviewees noted that weed problems were worse at the beginning of the
watershed’s conversion to no-till than they are currently. Over time, some of the weed
issues were mitigated as members of the community became more familiar with no-till
practices and newer technologies became available. Chemical representatives were also
brought in to advise users of no-till about chemical use, and additional money associated
with farm bill grants helped to fight some of the weeds associated with herbicide
resistance. The initial concerns about herbicide were widespread and considerable effort
was put into fighting weeds. One extension agent explains,
Cheat grass and the goat grass and all this other stuff and the weeds became – the no-
till fields were just weeds – “Oh, there’s wheat out there, right?” You couldn’t see it
for the weeds. Annual weeds have always been the bane for no-till, cheat grass, goat
grass, the basic winter annuals, it’s just been a huge problem, so that it’s obvious
we’ve got a number of different things. Now, so I think, once those came on board –
some of the new technologies – then some of the more progressive growers picked up
on the technology, some of the younger fellows, as well, saw the potential for
reducing cost and improving efficiencies. They picked up on it, to their huge credit.
They supported themselves. So we actually would have meetings every other week
and we’d bring in speakers and it was kind of a self-help kind of a thing and guys
would share ideas, and were like, “Okay, we tried this and this didn’t work.” We’d
get some of the chemical reps coming in, some of the local guys, and then just to try
to talk out issues. Like, “Okay, here’s a problem we’re all facing.” It really was
supportive. Ironically, we’re not doing that lately, but people get so busy. That lasted

124
for a number of years. You have a really strong network of growers in Wasco
County,C and part of that we owe to when all the agencies were working together,
like us and NRCS and SWCD and FSA. NRCS and SWCD folks had grant money to
offset some of the costs for the equipment and to try new things. We were doing a lot
of work, still doing a lot of work on rotational crops and stuff, but there was money to
be creative and look at new options … They’ve got millions of dollars into the county
that supported this change over and it took the edge off. (extension agent, personal
interview)
However, meetings with herbicide representatives, technological advances, and
chemicals did not resolve all weed problems. The majority of people interviewed
indicated that they are still fighting herbicide resistant species, a number of which had not
been present prior to their dedicated switch to no-till. Further, many of the interviewees
noted that the herbicide resistance problems were often associated with increased
glyphosate use: “Russian thistles and other broad leafs are becoming Roundup resistant,
even the orchard is becoming like that, when they spray their trees with Roundup they
run into mallow and different weeds that they can’t kill with Roundup anymore” (former
NRCS district conservationist, personal interview). Another farmer also discussed his
struggles with herbicide resistant weeds and the chemical methods he used to manage the
weeds:
Some of the ones that give me problems – I would say, Pigweed Lettuce, that’s a big
one. Russian thistle is another bad one. Some of those are worse because I can’t use
2,4-D-like products and so I have to use a higher rate of glyphosate and it will cost
me more money and it’s expensive and plants are becoming resistant to it. (no-till
farmer, personal interview)
Based on fieldwork and interviews with farmers and agency workers in the
watershed, I was able to identify nine weeds in the Fifteenmile Watershed that have
become herbicide resistant, all of which are listed in the International Survey of
Herbicide Resistant Weeds (2017) for Oregon. Unfortunately, the majority of

125
recommendations for mitigating herbicide resistance have been to either rotate the
chemicals used, or to use more chemical to kill the herbicide resistant plant. Generally,
this has led to increased use of glyphosate, as well as more applications of glyphosate,
since it is one of the cheapest herbicides to use. A former NRCS district conservationist
explains,
Trying to rotate chemicals is the best way to do it. The other good way to avoid
herbicide resistance is to make sure that you use proper labeled rates, maximum rates,
nothing worse than a wounded cheat grass. It will grow and survive and the problem
with that is that it won’t take in the next chemical application. It kind of hunkers
down. It will grow and make seed, but it won’t take another round of Roundup
application. If you are going to kill it, kill it. It’s like that saying, don’t just shoot it,
shoot it in the head. That happened earlier on with some of the guys who were
inexperienced and with different grades of Roundup they were using. They would
say, “I was able to get by with only six ounces.” But if you kill 75% of your cheat
grass but 25% survives, then it will get resistant to Roundup because it learns that
“you dinged me with this chemical before so I’m going to produce a seed that is
resistant to it” instead of killing everything that’s out there. (former NRCS district
conservationist, personal interview)
Beyond impacts to herbicide resistance, this study also found that glyphosate and/or
AMPA is already found throughout the Fifteenmile Watershed at concentrations that
have been found to have human and ecological health impacts (see Chapter 2).
Glyphosate and/or AMPA was also detected in the majority of samples collected in all
media (e.g. soil, sediment, water). Although the concentration values of glyphosate and
its derivative product AMPA detected in this study for the Fifteenmile Watershed are far
below the 700 µg/L or the 1.75 mg/kg/day chronic reference dose (cRfD) established by
the EPA, agrochemicals have a long history of being regulated at standards which are far
too high to be protective of either human or ecological health. Examples of chemicals
that have had minimal (and not protective) regulatory standards in the past include the
compound DDT, which is now a known carcinogen, and is known to be harmful to bird

126
populations (Grandjean and Landrigan, 2014; Harrison, 2008); or atrazine, which has
been shown to have a number of reproductive effects on amphibians (Boone et al., 2014;
Fagin, 2012).
State Rollback and Deregulation National Level and in the Fifteenmile Watershed
The process of the “state roll back or deregulation,” defined by Castree (2010) is
the withdrawal or diminution of government intervention in certain areas of social
and environmental life in order to enable firms and consumers to exercise ‘freedom of
choice’; and the subsequent creation of new quasi-state or state-sanctioned actors to
take on functions that states themselves could otherwise perform in theory or practice
(Castree, 2010, p. 1728)
Peck and Tickell (2002) argue that through neoliberalization, the internal
contradictions and glaring social externalities produced by ‘roll-back’ neoliberal
deregulation have prompted the ‘deepening’ of the neoliberal project and associated
policies, like those that govern agriculture. These translate to the “meaner and leaner”
(Brenner and Theodore, 2002) policies that affect much of agri-environmental policy and
which coerce market-based “voluntary” agreements between industry and civil society to
develop. Lenihan and Brasier (2010) further expound upon this idea by arguing that much
of U.S. agri-environmental policy is voluntary and incentive based because agricultural
production and environmental quality are considered contradictory rather than
complementary goals. Hence, a voluntary approach to agri-environmentalism is borne out
of primary productive interests in the U.S. that are driven by a desire to minimize
government regulation (Buttel, 2006). This approach translates to federal emphasis on
reducing soil erosion and land retirement as opposed to dealing with the harmful effects
of chemically intensive farming. The approach also helps perpetuate the hegemony of
powerful agribusiness interests by promoting a corporate friendly version of sustainable

127
agriculture that maintains farmer dependence on purchased inputs, while legitimizing the
system in the eyes of primary producers and consumers (Lenihan and Brasier, 2010; Hall,
1998; Glenna, 1999).
Both voluntary compliance and state rollbacks and deregulation have contributed to
sediment issues related to no-till practices and the increases in herbicide use in the
Fifteenmile Watershed. Yet, this outcome seems counterintuitive given the number of
agencies that work on issues related to soil erosion and water quality. Much of Wasco
County and the Fifteenmile Watershed is managed by the Wasco Watershed Pesticide
Stewardship Program (PSP) which is made up of the SWCD, Oregon State Extension
Service, Columbia Gorge Fruit Growers, Department of Environmental Quality (DEQ),
Oregon Department of Agriculture (ODA), The Dalles Watershed Council, Fifteenmile
Creek Watershed Council, and US EPA (through grant funds). While some of these
agencies have legal authority to implement best management practices concerning
herbicide use and farming practices that would affect erosion and water quality, many of
these agencies do not have formal enforcement power and act as “quasi-state” actors.
For example, for decades the ODA (an agency with enforcement power) has had a
strategy for compliance with the federal Clean Water Act on farmland that was largely
complaint-driven (Perkowski, 2014). However, complaint-driven enforcement in the area
was only partially effective because some water quality problems were never reported. In
2012, ODA decided to “self-initiate” compliance with water quality rules, relying on
publicly available information like aerial photographs and topographical maps to identify
potential problem areas and notify the landowners. Because the agency did not have the
resources to conduct in-depth monitoring of the entire state, this new approach was first

128
tested in Wasco and Clackamas counties. As stated in the Oregon Agriculture Water
Quality Report (ODA, 2012, p. 2) “By law, ODA has authority to adopt and implement
regulations as part of the program. Compliance with the regulations is required, but
farmers and ranchers may choose the strategies they use to comply”. While ODA has
touted this approach as successful (ODA, 2012), it still represents the diminution of
government that often leads to negative environmental consequences as a result of larger
neoliberal processes.
The rollback in government affects the Fifteenmile Watershed significantly because
there is not enough government power to oversee how no-till is actually practiced. The
rollback also limits the ability of agencies to enforce penalties when no-till is not
practiced correctly, thereby leading to variable results in farm fields that are supposedly
managed using the same conservation management system. Further, the ways that
conservation programs are monitored, or rather unmonitored, lead to questions of
whether or not they are being practiced in the ways intended. Interviews with NRCS,
ODA, and farmers practicing no-till have indicated that the way a farmer practices no-till
is highly variable from farmer to farmer. In an inquiry to a NRCS employee working in
the county, I asked how the agency knows if no-till is being practiced correctly (e.g. how
much disturbance there is or how much residue there is on a crop). In response, the
NRCS employee stated that farm fields are not usually visually inspected to make sure
that residue percentage requirements are met or that a minimum amount of disturbance
has occurred, even though these are explicitly stated as requirements in the conservation
programs in which the farmers enroll. Instead, farmers are often required to state what
types of equipment they use, and the NRCS assumes that the farmer will meet the criteria

129
for the practice of no-till. However, as stated by Williams and Wuest (2001), “the no-till
drills disturb the soil to varying degrees” and significant variability from farm to farm
and community to community exists using this conservation management technique,
which has significant implications for how well soil and water quality are protected.
Several farmers that were interviewed indicated that when they received money for
switching to no-till through EQIP or CSP programs, they were initially checked for
compliance with no-till practices, which requires more than 30% residue coverage and
somewhere in the range of 15 to 30% disturbance of a row in a crop (according to the
current NRCS district conservationist). However, these checks were usually only
performed at the time of the farmer’s original conversion to no-till and infrequently
during the time the farmer was in contract, which generally ranged between two to three
years. Most farmers, as well as the NRCS district conservationist, noted that it was only
equipment that was checked for compliance, not the actual fields. As one farmer said
during an interview, “If that’s part of your program – if that’s what you signed up for [no-
till farming] – they will come and verify it, but a lot is like, just you have this model and
drill, and you know what it does”. In a different interview, a no-till farmer said, “When
you got an EQIP contract they would check what the equipment is doing and what it’s
supposed to do”. Finally, another farmer reiterated these comments, but also indicated
that compliance checks became less frequent over time. He said, “Oh yeah, they
monitored. When we were getting money, they did. Oh yeah, they were required to …
but not as much anymore since everybody switched over”.
Since compliance checks were only conducted at the beginning of (and periodically
during) contracts, and because equipment was the primary focus of the compliance check,

130
the amount of disturbance and the actual practice of no-till is, and was, highly varied
across the watershed. Information such as how much disturbance occurred, the number of
passes over fields, and other information that lends itself to describing how no-till was
being practiced was often not recorded and is still not available from any agency when
inquiries are made. The variation in techniques used for what everyone refers to as “no-
till” has even led to confusion as to whether farmers are even practicing no-till in much of
the area. Definitions of what constitutes no-till farming varies from farmer to farmer. A
regulatory agency official discusses just how confusing it is,
Everybody does it different, everybody has their own definition or range of
definitions. I have talked to people – it’s everything from what I would call high
residue tillage, which is still definitely tillage, but they’re calling it no-till because
there’s so much stuff that isn’t raked up. It’s not the pristine clean field. I have heard
people that have called everything from high residue tillage to drilling with no-till and
strip till and everything in between, and in a lot of cases, it really depends on the
rotation because there are folks that have a rotation that is defined that allows them to
drill to actually do no-till practice, and then there’s other folks that maybe two or
three out of the different plant types in the sequence of their rotation they can do true
no-till and they might have to do a strip till, they might have to do a high residue
tillage in order to make that rotation work for them, but I think that most of the folks
see no-till as the opposite of conventional tillage. “If I’m not doing conventional
tillage, I’m doing no-till.” And I would say that there is conventional tillage and
there’s conservation tillage and the conservation tillage includes high residue tillage.
It includes strip till and no-till. It has a range of different options, but I think there’s a
lot of time when they use no-till interchangeably with conservation tillage.
(regulatory agency employee, personal interview)
The confusion about what farmers are practicing is widespread amongst agency
workers and farmers in the watershed. That is to say, all farmers interviewed know how
much disturbance they are causing from year to year, how much residue they are leaving
on the ground for cover, and how their equipment works at an individual level. However,
there is no collective sense of whether or not a farmer is practicing true no-till, meaning

131
no metal disturbs the ground (according to the local NRCS district conservationist); direct
seed, which is what most people refer to casually as no-till in the watershed, and disturbs
between 15 to 30% of a row in a crop; or some other form of conservation tillage, which,
by definition, must leave at least 30% residue on the ground but often disturbs the soil
more than direct seed (NRCS, 2006; WSU Extension, 2017). The local SWCD and
NRCS assume that most people are practicing what falls into the direct seed category,
and NRCS has based its current erosion estimates using the Revised Universal Soil Loss
2 (RUSLE2) model on the assumption that virtually the entire watershed is being
managed with this conservation technique.
Although many agencies are involved, no single agency has the capacity to check
that everyone in the watershed is actually practicing no-till as intended. Further, it took so
much effort to get no-till implemented (with all of the educational events about how to
practice no-till, grant money, and getting over cultural inertia to switch to no-till after
initial failures with equipment), agency members are often hesitant to actually enforce or
to ask about whether or not what is being practiced actually qualifies as no-till. This
problem is partially reflective of a larger problem experienced throughout the U.S. with
state rollback and deregulation; states have reported having insufficient funds, inadequate
monitoring programs, and limited staff to collect and analyze such data (GAO, 2011).
According to the U.S. government General Accountability Office (GAO), only six states
have enough data to fully assess the condition of their waterbodies, while only 18 have
enough data to place their waterbodies on the list of impaired waters (303d list).
Therefore, even in cases where agencies involved in the Fifteenmile Watershed want to
check practices that affect water quality, the resources available to do so are often not

132
available. Hence, some improvement in land practice is looked at more favorably than no
improvement at all. Managing agencies try to exude support for the efforts that the
farmers have made thus far, even while knowing that eventually the way no-till is
practiced will have to be changed. In one interview a regulatory employee explained,
I look at it and I think what they are doing is definitely better. I’m not going to go out
and slap their hand and say, “Wait, that’s not no-till,” because it’s better, and I want
to encourage them to do stuff better, but we definitely need to have that conversation,
we need to get where they are on that scale as opposed to just lumping it all into no-
till because otherwise the way that we review the outcomes and the results is all going
to be muddied up. (regulatory agency employee, personal interview)
In another interview, a regulatory employee explained how minimal state resources
limit an agency’s ability to monitor actual no-till practices. These limited resources often
force agency employees to rely on somewhat of an honor system where farmers are
responsible for truthfully reporting their practices, as demonstrated in the quote below:
We are working with folks in the watershed and we say, “What are you doing?” if
they come in and they say, “We are doing this.” Sometimes I get, or someone else in
my capacity gets, the opportunity to go out to their property and really see what they
are doing, but most cases we have to take their word for it. We don’t – I mean, I’m
not covering what I’m supposed to be covering now. I don’t have the capacity to do
that. (regulatory agency employee, personal interview)
Yet another regulatory employee described how state resources occasionally allow for
verification of conservation practices, but the employee also indicated that in most cases
verification is not feasible. The employee explained,
So that’s why we are taking their word for it too in the cases where we don’t have a
direct financial input. If they tell me that they are doing X Y Z then I write it down
that they are doing X Y Z. In those cases where I heard otherwise where every now
and again somebody will say, “Wait a minute, why do you have that? Because I have
a map that says this practice is going here and that practice is going there.” So they
will look at that and we will be in conversation, and they will say they are doing strip
till and I think they are doing high residue, so there has been a few cases where we
have gone out and talked to somebody about it, but for the most part, no. (regulatory
agency employee, personal interview)

133
The extent to which farmers are practicing no-till as defined by direct seed
requirements, as opposed to some other form of conservation tillage in the Fifteenmile
Watershed is extremely important, because of the effect it can have on surface erosion in
cultivated soils assumed to be minimally disturbed at present. In Chapter 3 of this
dissertation, I used radioisotope sampling and spatial analysis to source where sediment
in streams is coming from and found that approximately 49% of sediment in streams is
directly sourced from cultivated fields. In addition, I found that 51% is sourced from
actively eroding channel banks that are not included in any erosion model that is, or has
been used, for the Fifteenmile Watershed. This finding was surprising given that every
single person interviewed noted how much more improved the streams are than they were
prior to the conversion to no-till. Further, most reports on the Fifteenmile Watershed (e.g.
the Fifteenmile Creek Subbasin Summary (2000), the Fifteenmile Watershed Assessment
(2003), and the Fifteenmile Creek Basin Aquatic Habitat Restoration (2010)) indicate that
streams do not interact with eroding channel banks or floodplains. In conversations with a
local regulatory employee, I was specifically told that “the stream no longer interacts
with the floodplain anywhere in the basin” (regulatory agency employee, personal
interview).
Yet, I would argue that this literature and the dominant agency narrative have caused
managing agencies to overlook floodplain and channel bank sources that are still
contributing to streams. This oversight is likely due to limited resources caused by state
rollback and deregulation. Further, the disconnect between what is published in reports
about the Fifteenmile Watershed’s channel bank and floodplain interaction in streams and
what is actually occurring is leaving managing agencies with a gap in the data for

134
estimates of how much sediment is coming from these locations. Even prior to no-till,
sediment erosion in many streams classified as confined (meaning streams did not
interact with channel banks or floodplains) was taking place. For example, even though
many channel banks had been confined by the 1960s by various Army Corps of Engineer
projects and Oregon Bonneville Power Authority (BPA) projects, channel bank erosion
often occurred in riparian areas that were not yet been placed in CREP corridors, where
vegetation helps to prevent soil eroding into streams until the late 1990s and mid-2000s.
In other locations classified as confined, cattle were still let into streams, and sediment
was often eroded into those locations from heavy animal foot traffic. These examples
demonstrate that land managers and agencies often overlook localized management
practices that have likely contributed to continued sediment erosion issues over time.
This oversight is even highlighted in the Independent Multidisciplinary Science Team
(IMST) report on DEQ’s Draft Development and Selection of Bedded Sediment
Benchmarks in Oregon (2009), which states that
Landscape erodibility is complex and highly variable, incorporating a greater range of
erodibility than is captured in the landscape classification proposed in the draft.
Likewise, local in-stream sediment deposits are inherently variable because of local
variability in land use, stream slope, historical sediment deposits, local soils, beaver
activity, and large wood … Some discussion of those issues would help the reader
understand the observed variability in the indicators. (IMST, 2009, p. 2)
These oversights are reflective of scarce budget and labor resources that are the
results of state rollback and deregulation in the watershed. With only partially available
information, regulatory agencies like DEQ have tried to use limited resources that are
spread thin over the state of Oregon to determine why sediment problems persist in the
Fifteenmile Watershed. DEQ has found that sediment in streams is higher than it should

135
be by using a variety of methods such as the Wolman Pebble Count, Relative Bed
Stability (RBS), and macroinvertebrate habitat studies that measure sediment particle
sizes in streams. These problems should have been resolved given that other non-
regulatory and regulatory agencies alike have indicated that streams should have
improved with conservation farm practices and money spent on stream protection.
In some ways, it is easy to see why increasing detections of, and use of, glyphosate in
the watershed have not been addressed by any agency thus far. There is a great deal of
confusion surrounding how no-till is actually practiced. Sediment issues related to
unresolved erosion issues persist and limited government resources make oversight of
herbicide use exceedingly difficult in the county. Various agencies working in the
watershed have implemented BMPs that should mitigate erosion issues that should also
minimize the amount of glyphosate reaching streams. However, continued focus on
erosion issues without considering increased herbicide use has obscured what Harrison
(2008) refers to as the harmful effects of the neoliberalized and inadequate pesticide
regulatory complex. Here, state rollback and deregulation have complicated the social
and ecological processes by which glyphosate increases in the environment.
When I spoke with employees of regulatory and non-regulatory agencies, most
indicated that they knew glyphosate use was on the rise, but had limited knowledge of
how extensive problems associated with glyphosate are and/or had limited capacity to
deal with it. In confidential interviews, several agency employees noted that they would
like to test for glyphosate more often, because they realized that it is of growing
ecotoxicological and human health concern. However, they also noted that funding and
labor resources only allow them to test for the most restricted chemicals at present, such

136
as Malathion, which is used in large quantities by orchard growers in the watershed and is
known to be extremely toxic. Further, glyphosate is a costly herbicide to analyze for in
sediment. Glyphosate analysis often cost nearly $400 per sample in comparison to other
herbicides that are more frequently analyzed across the U.S. such as chlorinated
herbicides, which cost closer to $100 per sample to analyze. In fact, many of the samples
in this study would not have been analyzed if USGS had not volunteered to analyze some
of the samples for free at the water quality testing lab in Kansas. The pattern of having
limited resources to analyze glyphosate is a national one, since glyphosate is difficult and
costly to measure and assessment efforts in the US have been “limited primarily to
regional, targeted, or short-term studies” (Stone et al., 2014).
Interviews with local regulatory officials revealed that employees often experience
growing frustration when they try to determine how much herbicide use is occurring and
how it is affecting environmental health as well. Here again state rollback and
deregulation creates additional environmental concerns, as herbicide regulation has
become severely restricted because of increasing restrictions on regulatory scientists’ and
the public’s access to research materials (see PEER, 2006; Urstadt, 2004; NYT, 2006). In
addition, neoliberal policy reforms have resulted in reductions to regulatory funding that
control herbicide regulations. These reforms have served the agricultural industry’s
economic interests more than public health for decades (Baker, 1988; Lake and Disch,
1992; Nash, 2004).
Most interviewees indicated that resources to monitor or find out about herbicide use
were often limited. One regulatory employee, for example, reflects,

137
When I talk to folks about pesticide use, there’s sort of a general conclusion that it
has changed pretty dramatically in those areas that have a large conversion to
conservation tillage, but again, how its changed- it depends on the producer and the
crop rotation and what’s going on- and then you take that kind of low resolution data
– when they report their pesticide use – it’s sort of like an annual mass. It’s not, “I put
this on this field on this day and that on that day and then I come back and put some
more later.” At the end of the year they say, “I used 600 tons” – or you know,
whatever it is. It’s really high resolution reporting, so you take that kind of reporting
and then you have this other overlay that – during the drought there was land that was
fallow – and so they doubled up the water on another little piece of land and planted
something completely different than they are used to planting because they didn’t
have the water that they needed for what they’re used to planting, and you take all of
that complexity and you just can’t figure that out. It’s impossible to say, “Oh well,
Farmer X is using more because of conservation tillage.” It’s impossible right now.
We have had too many perturbations in what used to be a pretty even data stream.
You just can’t figure it out right now. (regulatory employee, personal interview)
In addition, certain laws are specific to certain agencies, so while NRCS, for example,
may have access to herbicide use from farmers, another agency, like DEQ, which
regulates the effect of the chemical in the environment does not. Similarly, agencies like
ODA can legally restrict the use of a chemical when it suspects that it is causing an
environmental harm, while DEQ cannot. Beyond this, Oregon is unique in some ways
because waterways are managed according to their dedicated beneficial use, which does
not always align with ecological and human health standards. For example, if a water
body in Oregon is used for drinking water, but its beneficial use is not designated for
drinking water, it cannot be regulated for it by any managing agency. Some of these
constraints are reflected below.
We probably don’t have enough resources to do that [monitor pesticide levels]. In
terms of just … yeah, providing the most intensive outreach possible, we involve
them, all the core partners at the local level working on watershed projects,
identifying what their different needs are so they can be defined by these grants.
Some of those are more general outreach efforts. Some are more specific activities,
like spray optimization equipment that helps the blasters and the berries get their
sprays and breathe but … if an area’s not used for drinking water, then we don’t have

138
a standard that’s applicable. So we go back to the benchmark and the benchmarks are
totally non-regulatory. (regulatory employee, personal interview)
In summary, state rollbacks and deregulation have largely been responsible for
limitations that have made it difficult for local agencies to address new concerns, such as
increased glyphosate use, and to evaluate the impacts of BMPs associated with
conservation practices that have been put into place to improve environmental conditions.
While agencies in the Fifteenmile Watershed should have been monitoring continually
improving stream conditions, instead they have been preoccupied with trying to figure
out why conservation programs designed to improve sediment conditions have not
worked thus far. As this has transpired, increased glyphosate use associated with these
conservation practices has posed new threats to human and ecological health in the
watershed. These unintended consequences have all been driven by larger state rollbacks
that have been responsible for many of the shortcomings of the government programs
associated with no-till farming and U.S. farm bills. These consequences have manifested
in the environment in various forms, including: unidentified sediment sources, which
have not been incorporated into erosion estimates for the watershed; persistent
sedimentation issues; and vegetation affected by persistent herbicide.
Self Sufficient Individuals and Community in the Fifteenmile Watershed
Castree (2010) defines the creation of self-sufficient individuals and communities as
the cultivation of an ethic among persons and communities that emphasizes less, and
ultimately limited, reliance on state-provided services for life’s necessities. For
neoliberals this ethic is almost a ‘natural’ good. It encapsulates the individual’s right
to maximum freedom and their responsibility for their own affairs (Castree, 2010, p.
1728).
Evidence of the neoliberal self-sufficient individual is strong in The Wasco County
Rural Living Handbook (2009), which states “Every farmer, rancher, grower,

139
homeowner, and hobbyist is asked to do his/her part to help solve water pollution
problems” (SWCD, 2009, p. 22). The list of what the individual is responsible for is large
including: identifying sources of bacteria and nutrient runoff, soil erosion from crop and
pasture lands, and identifying those practicing improper fertilizer and pesticide use.
Further, the handbook written by the SWCD “quasi-actor” puts responsibility on the
individual to carry out appropriate management on the landscape without claiming any
authority to do so. It states, “While SWCDs are not regulatory nor enforcement agencies,
they are often called upon to offer assistance when a complaint is filed with ODA. It is
totally up to the individual whether or not to accept the assistance offered” (SWCD,
2009, p. 22).
This manual, the aforementioned 2012 rollback of the ODA, loose regulatory
enforcement of NRCS on contractual obligations, laws and guidelines that hinder access
to useful information, and limitations in resources needed to successfully implement
conservation programs offer pieces of evidence that the creation of the self-sufficient
individual and community is an important part of the Fifteenmile Watershed. Although
there are many agencies working together on conservation issues, as previously
demonstrated, they have little authority to address some of the primary goals of the
conservation management programs and techniques, based on all of the limitations and
barriers discussed previously. This produces the outcomes of putting much of the onus of
caring for the environment on the individual land owner in the county, while government
oversight becomes almost informal. This is best described by Prudham (2004) as the
result of “an example of a broad regulatory failure and the systematic production of
environmental risks by neoliberal governance reforms”.

140
I would argue that out of this self-sufficient community, a dominant narrative has
emerged that has been beneficial for conservation methods in some ways and harmful in
others. Every person interviewed – from farmer, to extension agent, to agency employee
– regards no-till highly in the watershed and continues to talk about the improvements,
especially in regards to sediment in the streams. During interviews and meetings, most
people provided vivid descriptions of how soil used to run off the hillslopes before no-till
was widely practiced in the watershed. For example, one no-till farmer said “We used to
get a high wall of sediment in the creek, it used to be brown. It looked like chocolate
milk, but now it’s clean for the most part” (no-till farmer, personal interview). Another
farmer said,
They [my family] kind of experimented with it [no-till] a little bit, to start with. They
had it [the equipment] all around custom-fitted for a few years before they bought the
no-till drill. And then my dad always tells this story of when they were driving down
the road one spring- and almost everybody at that point switched to no-till except for
one neighbor- and there was a big rain storm and water was just rushing off of his hill
sides and everyone else was just soaking it in. They made their full commitment then
and bought a drill, even though they had been doing it for a few years already. (no-till
farmer, personal interview)
Given that everyone that has worked in the watershed agrees that soil erosion is better
and streams have a lot less sediment, it is likely true that no-till has benefited the
watershed in many ways. Past photos of the watershed show major washout areas on land
managed with conventional tillage and historic imagery shows rills and ephemeral gullies
throughout the landscape that prove that things are not as they were when the majority of
the watershed was managed with conventional tillage or other less effective conservation
techniques. Moreover, all across the U.S., studies have shown that no-till has been
successful at reducing soil erosion, improving water quality, improving soil quality,

141
reducing fuel costs, as well as providing a whole other array of ecosystem benefits
(Huggins and Reganold, 2008; Montgomery, 2007).
However, as mentioned in previous sections of this chapter, recent studies by DEQ
have indicated that sediment conditions in streams have not improved and variability in
how no-till is practiced appears to be widespread. In this research, I found that
approximately 63% of farmers practice no-till as it is intended, which has greatly
improved the amount of loose sediment available for transport to streams. Yet, uneven
implementation of no-till throughout the rest of the watershed still likely contributes to
elevated levels of sediment in streams. Therefore, even though streams no longer look
like “chocolate milk” during large precipitation events, sediment is still being eroded into
streams while farmers use various conservation practices that they loosely refer to as no-
till.
Further, now that much of the grant money to support no-till is gone and farmers
receive limited oversight, farmers decide what version of no-till is best for them, even
when that means they are not practicing true no-till. During interviews, most farmers
indicated that participating in conservation programs designed to help the environment
was becoming increasingly difficult because of cuts to farm bills. These cuts limit the
amount of money available to their county because of all the conservation practices they
had already participated in. This is an ironic outcome, given that Wasco County is known
for not only having one of the highest conversions to no-till in the state, but also because
Wasco County received some of the highest payouts of conservation payments from bills
associated with the farm bill such as EQIP and CSP (EWG, 2017). Since farmers
participated in so many conservation payments in the late 1990s and early 2000s when

142
ample grant money was available, they have essentially disqualified themselves from
receiving any more payments for conservation efforts.
With declines in payments for conservation practices in recent farm bills (e.g., after
2008), farmers often feel that they do not have the means to improve on their practices
without government subsidies, even though they are tasked with protecting the
environment. At this point in time, many of the farmers are ineligible to receive
additional conservation payments because they are participating in practices, like no-till,
that are considered to be proven to work. One regulatory employee explained, “The
granting organizations are looking at it and saying ‘Well everybody knows that works.
It’s not a pilot project anymore, that’s not new and innovative technology and so we are
not paying for that. They should know that works’” (regulatory agency employee,
personal interview).
Another farmer described his frustration with the lack of grant money available from
current farm bills when he said:
Yeah, the last farm bill [2014] sucked … They have just been beating us like an old
tired dog out here. We lost tons of money. Only two of us in the county got a CSP.
They became like, “Well, if you make enough before, if you make what we deem
enough, then it’s fine,” but they did it on a 5-year rolling Olympic average. We are
not going to be making any money, yet we are not going to get any government
payments either. (no-till farmer, personal interview)
These statements illuminate how neoliberal policies shaping farm bills force farmers
into the role of the self-sufficient individual. On the one hand, farmers are tasked with
making environmental decisions that are supposed to protect the environment, while on
the other, they cannot enroll in new environmental practices because of limitations in
funding for such endeavors. Further, many of the conservation practices they have been

143
encouraged to participate in already (such as no-till) have resulted in several negative
impacts to the environment because of failings on a policy and implementation level.
Herein is the rub: even though there are many actors and policies that drive unintended
environmental consequences before the farmer is even involved, much of the blame for
negative soil and water quality impacts are ultimately blamed on the farmer. This
dynamic complicates the relationship the farmer has with the environment. In some cases
this dynamic even fosters a disregard for environmental interests (i.e. if the farmer is
going to be blamed either way when conservation practices fail, he may as well choose
the most profitable option, regardless of environmental impact). In this type of scenario,
Leitner et al. (2007) describes the emergent neoliberal individual as one that “normalizes
the logics of individualism and entrepeneuralism, equating individual freedom with self-
interested choices, making individuals responsible for their own well-being, and
redefining citizens as consumers and clients” (Leitner, 2007, p.2). As mentioned
previously, environmental interests are often seen as contradictory and not
complementary in the U.S. Given these predicaments, farmers usually try to participate in
the conservation efforts that they deem to be the least harmful to avoid regulation, but the
most financially beneficial. Participation in conservation programs becomes more
financially than environmentally driven. In one interview, a farmer discussed how his
choice to enroll in no-till was influenced more by financial considerations than
environmental:
I do see the impact of the environmental one and I think it was wise for us to change
[to no-till], but it wasn’t that environmental first. I don’t think many farmers cared
that the water would run off into the creek. Now we see it and realize that it wasn’t
good, but it has been going on for 50 plus years. (no-till farmer, personal interview)

144
During another interview, a regulatory employee explained that most farmers are not
as worried about environmental regulation as they are about maintaining their livelihood:
Every now and then people are talking about, “Well, what are you going to do with
the TMDL or what are you going to do with this or that?” But that alone does not
seem to be enough to push them towards making those other choices. They are
essentially betting their income, their ability to make their house payments, to keep
their kids in school, and it was a really serious investment for them to say “Well,
some water quality agency is going to come in here and get on your case.” That
doesn’t quite rise to the level of ”I might lose my farm”. (regulatory agency employee
personal interview)
Yet, it would be incorrect to state that only monetary incentives are driving
conservation efforts. During my time of research and in interviews, many of the farmers
and agency employees intimated how important it was that better conservation practices
were found for the survival of the community, both in terms of preserving soil for future
agriculture and sustaining water in streams that are continually stressed by multiple users.
Many also expressed their pride in how widespread the use of no-till is in the watershed.
Along with these comments, frustrations were relayed and several people indicated that
they had been disappointed that they had not been able to produce quantifiable results in
the watershed that showed how much no-till had improved stream conditions and soil
runoff. This frustration in the community appears to be building, as more reports on water
quality and quantity issues come out in media reports, such as The Oregonian, and efforts
to improve the watershed are not recognized. During an inquiry for maps of channel
modifications, I had an unexpected conversation that turned into an interview with a
regulatory agency member and local landowner. The interview was generally led by the
individual, who wanted to express his thoughts on the impacts of environmental
responsibilities falling on the individual farmers in the community. In this exchange, the

145
individual expressed his concerns over the research I was conducting for this study
(because he knew I also studied herbicides) and conveyed his thoughts on all the studies
that have been done on the Fifteenmile Watershed. His comments reflect the frustration
experienced by some people in the watershed who have tried to improve environmental
quality and not felt adequately acknowledged for their efforts. He said,
I own a lot of land out here myself and we don’t let cattle into the stream anymore.
I’ve been working here for thirty years and we’re still talking about the same things.
Sediment impairments, temperature impairments, the same thing … We’re still
dealing with that article that came out in The Oregonian …The important thing is
people are trying … and like with this pesticide thing ... Why would I give you the
pesticide data if you’re just going to stab me in the back with it? I mean, all the
farmers out here have all used better equipment, and some use precision agriculture
and use a lot less spray. The farmers are trying and that’s what matters. We’re never
going be pristine, but we can provide functional habitat. (regulatory employee and
landowner in watershed, personal interview)
Here, I want to say that this type of negative exchange was not typical of my
interactions with farmers and agency workers that live and work in the Fifteenmile
Watershed. Since no-till is perceived to be very successful in the watershed, especially in
regards to how much sediment has improved, most farmers and agency employees take
pride in participating in conservation methods and were fairly open about sharing their
information. I am indebted for the information they supplied for this study. However, the
sentiments expressed during this interview do speak to the tensions that arise when
conservation efforts that took so much effort to implement fail, and individuals are left
with the environmental blame for improper stewardship.
The Oregonian article referenced above is entitled “Draining Oregon: A creek in
crisis” (House, 2016) and was mentioned by several farmers during interviews and during
watershed meetings that I attended in the past year. While the article is focused on water
146
use issues surrounding conservation, and does not mention no-till specifically, it outlines
many themes that I have found to be consistent with my own research (e.g., weak
regulatory oversight, lack of resources to adequately monitor water conditions, and
unacknowledged environmental problems).
The contents of the article are beyond the discussion of this chapter, but what I do
want to mention here, and found most interesting about the article, is the response it
generated in the Fifteenmile Watershed. This response elucidated the hardships that many
farmers experience as they are held accountable for environmental issues that are, in
some ways out of their control, and in other ways, largely determined by their own
personal choices as the state puts increasing pressure on them to become self-sufficient
individuals that make critically important environmental decisions. During interviews, it
was clear that the article bothered many of the farmers, many of which related the
numerous ways in which they engaged in conservation and had improved the watershed.
Others criticized what they perceived to be the one-sided nature of the article, which did
not include many farmers’ perspectives. Many of the quotes that I received during
interviews were of a similar nature, but one quote reflected the sentiments of what many
farmers and agency members expressed during interviews and meetings particularly well:
There was a lady who called me not too long ago who works for The Oregonian and
she asked for permission to take pictures. She had already taken pictures and was
trespassing, and she just called to apologize and I said, “Go ahead and use the
pictures.” And then I found out about two weeks later that it was pretty much an anti-
agriculture video in The Oregonian and on the computer, and so I changed my mind
and tried to press charges on her for trespassing. And the cop, he said I already gave
her permission so I couldn’t do anything about it. I was really upset, all the work like
you and I are talking about right now, like the no-till, the CREP program, and all we
are doing, and then she had videos and pictures of Fifteenmile and Eightmile creek
and how bad we’re doing. It just kicked us all the way down, I couldn’t believe it, the
Fish and Game are working at it, the NRCS, FSA, and us, and she pretty much said

147
that all the work we have been doing has been for nothing. I was very frustrated. (no-
till farmer, personal interview)
Comments like these and others point to the ever widening gap between what
conservation programs are intended to do, how they are actually borne out in the
environment, and who to hold responsible for environmental failures when they arise.
Although larger agri-environmental policies are developed by politicians and
agribusiness working together, much of the blame for inadequate implementation of a
conservation method and its environmental problems are placed on individual agencies at
a local level as well as the farmers themselves. It is clear in conversations and interviews
with people living and working in the watershed that they believe they have done as
much as they can to make conservation programs work, and that they have no recourse
when the failures of conservation practices are placed on them.
Regrettably, the success of no-till and the creation of the self-sufficient individual is
in large part also responsible for the rise in glyphosate use; both because it is culturally
more or less unacceptable to not participate in no-till and because most members of the
community think glyphosate is not causing environmental harm. This belief often
remains unchallenged in the watershed and, in some ways, is justified through the lack of
regulatory limitations on how much glyphosate can be used. Further, there are minimal
(if any) consequences to farmers when glyphosate is detected in environmental samples,
and farmers find that glyphosate is the only economical way to participate in no-till.
Beyond this, interviewees often related that the positive impacts and benefits of no-till
were greater than the negative effects that glyphosate could have on the watershed.
During meetings and conversations with various people in the community, I was often
told about how safe Roundup was and how it did not have persistent effects in the

148
environment. The following statements about Roundup’s safety and rapid degradation in
the environment were repeated to me by various individuals in the watershed:
Roundup is innocuous. They may have to use more herbicide, but so what? It’s
Roundup, you can drink the stuff. (former NRCS district conservationist, personal
interview)
Well, Roundup is made to dissolve quickly so it won’t stay around for long. (non-
regulatory agency employee, communication during public meeting)
My understanding is that it sticks to the soils, so I doubt you’ll find it in the water.
(regulatory agency employee, personal interview)
You won’t get Roundup out there. It degrades once it’s in the sun or water. Plus, it
shouldn’t be getting into the streams anyway. We don’t have that type of runoff
anymore. (non-regulatory agency employee, personal interview)
Although some elements of what people have said to me during various conversations
are reflective of glyphosate’s actual properties, much of the responses are reflective of the
way glyphosate is marketed by chemical representatives in the watershed. Industry
advertising that “Roundup is tough on plants, but no more toxic to people and animals
than table salt” (Monsanto Europe, December 1995) or “Roundup has been used
commercially for more than 20 years ... in more than 100 countries”, or “Glyphosate is
rapidly broken down in soil by naturally occurring soil microorganism” (Monsanto
Europe, undated but pre-1997) is quite clearly reflected in the above comments. While
glyphosate is supposed to have a half-life of 47 days in soils and a half-life of 91 days in
water (NPIC, 2015), a variety of soil conditions can affect the length of the half-life of
glyphosate and its availability in soils (Haney et al., 2000; Simonsen et al., 2008; Wardle

149
and Parkinson, 1990). Additionally, the length of time between applications of glyphosate
in the Fifteenmile Watershed are usually short (every 3 to 4 months). By the time that
glyphosate is even approaching its half-life rate, a new application of glyphosate is
generally being sprayed, so it effectively never leaves the environment.
During interviews, one of the questions that I asked was whether farmers had
received any instruction on how to manage herbicides in order to mitigate resistance and
runoff to streams. Most regulatory and non-regulatory managing agencies had thorough
responses on how to manage for herbicide resistance or runoff, but much of this
information did not seem to be actively being communicated to farmers. When I asked
farmers who helped them to make decisions on how to avoid herbicide resistance, most
stated that they made the decisions on their own and without involvement from agencies
such as SWCD, extension, or other regulatory or non-regulatory groups. One farmer
noted that much of his research was done through online research, while others generally
followed manufacturers’ recommendations. Some farmers noted that the former NRCS
district conservationist (who retired and became the main distributor of herbicide
technology around the time that the majority of the county converted to no-till) was their
main source of information. This individual would write chemical prescriptions for their
fields.
Even if there were more concern in the watershed about the risks glyphosate poses,
the responses during much of this research indicate that most farmers see no way of
participating in no-till without it and its supporting chemical technologies. This is largely
reflective of a national problem, whereby alternate technologies are not available to
farmers to do conservation tillage. There has been much research to show that the

150
development of non-toxic agrochemicals is needed (Eggen, 2004; Grandjean and
Landrigan, 2014; Schug et al., 2013; Woodhouse, 2006), but the ability to force
manufacturers of herbicides and consumers to use alternatives has been largely
unsuccessful thus far. Some federal regulating agencies, like the EPA, have a Green
Chemistry Program, but the chemicals in research have not been widely adopted by those
involved in the agricultural industry or in conservation management programs (Nelson,
2004).
Research and development of non-toxic chemicals research has also been slow and
has hampered the ability of state and federal agents to recommend alternatives to the
more commonly and long established agrochemicals of the past (e.g. glyphosate, 2,4-D,
and many other organochlorine pesticides). More generally, government officials in the
European Union, Japan, and the United States alike have little concept of how green
chemistry might be used to modify traditional approaches to environmental regulation,
and the top levels at EPA are not very knowledgeable about forefront science
(Woodhouse, 2006). Moreover, government regulatory procedures and laws are set up
negatively to limit the damage of brown chemicals (as opposed to green, non-toxic
chemicals) instead of positively and actively seeking the reconstruction of chemicals to
be benign by design (Eggen, 2004; Schug et al., 2006; Woodhouse, 2006).
Here, I find Woodhouse’s (2006) unthinkability argument particularly useful for
explaining why self-sufficient, individual farmers in the Fifteenmile Watershed and
across the U.S. persist in using a chemical that is gaining increasing public concern.
Woodhouse argues that the technoscience industry has played a large part in
manufacturing chemicals that are known to be harmful, and the chemists producing the

151
chemicals have been key in the propagation of the idea that the widespread use of
chemicals is safe. In doing so, producers of the wide variety of chemicals used in
agriculture have inadvertently helped teach humanity (including future chemists) that
unintended consequences are a normal part of technological innovation, part of what is
termed the price of progress. Woodhouse further elaborates that this cycle is perpetuated
as many people come to consider it unthinkable to "go back" to an earlier state of not
using chemicals because chemical engineering was so successful at producing chemicals
that were good at "combating pests" that it was unthinkable to require that chemicals be
proven safe prior to introducing megatons into the ecosystem. As Woodhouse argues,
creating the idea of “unthinkability” is the most subtle and most potent form of
technoscientific power. When these technological advances go hand in hand with new
advances in agricultural management systems, many of the negative consequences of
both systems may be overlooked.
In the Fifteenmile Watershed, since the farmers mostly self-educate themselves by
using manufacturers’ labels and recommendations, and environmental consequences
seem to occur whether they enroll in conservation programs or not, it appears that the
creation of the self-sufficient individual perpetuates many of the elements of
technoscientic power that generates the unthinkability of glyphosate not being safe to use
in the environment. Further, with few alternative technologies, and numerous incentives
to participate in conservation programs, most farmers are caught between deciding to
participate in conservation programs with questionable environmental outcomes while
receiving payments, or not participating in conservation programs and receiving no
payment. This predicament is of a complex nature and will not be easily resolved until

152
social policies driving environmental degradation are addressed at national and local
levels.
Conclusions
This chapter has covered myriad physical and socio-political reasons of why and how
no-till has impacted soil and water quality on a national and local level. However, what I
want to highlight most is this: no-till agriculture did not have to be the conservation
method of choice, but was ultimately the result of aligned agribusiness, policy makers,
and farm group interests that arose out of a context of increasing environmental
awareness in the midst of multiple processes of neoliberalization. These processes have,
and continue to, affect a large percentage of the U.S. Estimates vary but approximately
89 million acres of U.S. farmland is managed with no-till, which translates to
approximately 40% percent of land in the U.S. (USDA, 2015). While no-till has
addressed many issues across the U.S., this study has shown how the implementation of
no-till agriculture has also resulted in real physical impacts to the environment such as
increased glyphosate in the environment, and social consequences, such as reduced labor
opportunities on farms and divestment from environmental causes. No-till has also not
reduced soil erosion to its full potential, due to failures in its implementation.
Further, as mounting peer-reviewed literature on the harmful effects of glyphosate is
produced, land managers and agencies will need to critically evaluate how to practice no-
till without such large quantities of herbicide. Managers should also be prepared to offer
alternative farming methods that would minimize reliance on glyphosate and other
herbicides. The benefit of using no-till should not be solving one environmental problem
while making another one worse. Regulatory issues that could aid in shaping farm bill

153
polices need to be addressed as well. At present, many regulatory restrictions designed to
protect communities actually exacerbate pesticide exposures by prompting growers to
shift to less-persistent but more acutely toxic pesticides that pose a greater risk to workers
and people living near the site of production (Wright, 2005); restricting information
access to rates of herbicide use in communities; and incentivizing more chemical use than
less. These issues will have to be addressed in order to mitigate the growing impact of
glyphosate in no-tillage systems.
Presently, most regulators in the Fifteenmile Watershed are focused more on the
ecological health of streams as opposed to human health risks in the watershed. This
focus is not entirely negative. While studies on the effects of glyphosate are numerous, it
usually takes years before chemicals that have been shown to cause some type of harm
are regulated (Eggen 2004; Fagin, 2012), and it could take even more years before any
regulatory action is taken that would ultimately matter for human health. In addition,
since the community is so dependent on glyphosate to grow crops in no-till, it is unlikely
that most farmers would equate exposure to glyphosate with any health concerns in the
community. Although farmers are handling large amounts of glyphosate and are likely
exposed to it in various ways, the current focus on improving streams and protecting
sensitive species habitat may ultimately prove more useful for reducing the amount of
glyphosate that is used through increased measures to protect habitat in the Fifteenmile
Watershed. Many measures are already being considered as the watershed faces increased
scrutiny for what are perceived as failed implementations of practices.

154
Chapter 5: General Conclusions
As an original study design incorporating suites of natural and anthropogenic factors,
this study revealed the importance of considering both the social and physical
components of land management as they relate to conservation management programs
and techniques. Since most of this dissertation has been focused on the shortcomings of
ineffective conservation policies, especially as they relate to no-till, here, I do want to
relate the potential I think there still is for using conservation programs and improving
areas of the U.S. that face ongoing soil erosion issues, as well as elevated herbicide use.
Much has been said about problems with voluntary compliance and the pitfalls of
ineffective community implementation, but management can be effective and prevail
over socioeconomic and institutional challenges, especially with strong community
leadership, collaboration, and support. This is how no-till was even implemented in the
first place in many locations, including the study area of this research. Although there
were financial incentives involved, farmers and agencies did express genuine concern
about how to improve the environment around them. In order for these changes to take
place, though, there needs to be greater transparency and documentation about what
farmers are actually doing on the landscape. Bringing about this transparency would
require participation of actors at all levels of involvement in the watershed, from
regulatory to non-regulatory employees, as well as the farmers themselves.
While there are risks in being transparent about practices to the individual, especially
when these risks pertain to topics of a sensitive nature like mass erosion events and
herbicide use, to not disclose the information ultimately hurts the community in the long
term. To some degree, this has already occurred in the Fifteenmile Watershed as the

155
persistent narrative that participation in no-till is higher than it really is has led to
persistent stream sedimentation issues that could have been addressed if more were
known about how much erosion was coming from different properties. With this
knowledge, methods to address runoff areas could have been worked out in the
community collaboratively, which is what many of the policies in the watershed aim to
do, but ultimately fail in because of lack of transparency.
Even though top-down policy has affected the community through farm bills, there is
still a great amount of power that can be exercised on the local level that can challenge
the failings of aligned state and agribusiness interests, and being transparent about
motivations would bring some of these conflicts of interest into light. Advocating for
farm bill policies and environmental practices that are better than those that have been
previously offered could be one step towards bringing about change in failed policies.
Further, farmers and agency employees on local levels could highlight environmental
conditions that are likely to get worse if they participate in one program over the other
and thoughtfully consider what other management options might be best for their
communities. While there would be no one solution to the various environmental issues
caused by certain programs- as it has been reiterated throughout this dissertation that the
specificity of place matters and the complexities to agri-environmental problems are
many- this would at least be a starting point to engaging in voluntary practices that
ultimately end in frustration and new regulations because of new environmental issues.
On this note, incentives seem to work better than regulation. What ultimately made
no-till possible was not only the financial supports given, but the incentives to participate
in education that has improved erosion issues in the watershed, even if the improvements
156
have not achieved the results everyone hoped they would. Throughout this dissertation, I
have endeavored to illuminate that multiple laws and regulations have been put into place
to prevent what many might call government over-reach. Because of these institutional
barriers, regulation has very little power to enact significant change that addresses
widespread environmental problems. This is especially true of many regulatory policies
operated on thin budgets that do not permit for proper oversight. Although regulation is
definitely needed, it is not as much of a motivator as financial incentives or community
educational benefits, which beyond providing financial stability for long term sustainable
practices, also has the added benefit of fostering a sense of pride in conservation efforts
when they are practiced broadly in the community.
Finally, I wish to address some practices that would improve no-till’s implementation
in many locations. Future no-till farming will need to employ more diverse pest and weed
management strategies, including biological, physical and chemical measures to lessen
the threat of pesticide resistance (Huggins and Reganold, 2008). Practices from
successful organic farming systems may be instructive in that regard. One such
technique, crop rotation—in which farmers grow a series of different crops in the same
space in sequential seasons—is already helping no-till’s war on pests and weeds by
helping to break up the weed, pest and disease cycles that arise when one species is
continuously grown (Huggins and Reganold, 2008). Other techniques for weed
management include killing weeds when they are younger, which is easier than when
weeds are fully grown; maintaining soil residue cover with an organic mulch or live crop
to prevent weeds from sprouting up; avoiding the maturation and seedling of weeds in the
first place by not allowing weed growth in the first place during the off season; and

157
determining at which point weeds are actually hurting the crop. Even though many of
these techniques have been practiced in various locations of the country, these are rarely
expressed as an alternative option in the county of this research and are generally not as
promoted nationally (Philpott, 2013).
In this dissertation, I sought to expand the narrow focus of human impacts and
solutions to encompass more thorough explanation of the causation (both human and
natural) to explain why no-till has not been as effective as it has the potential to be in
both my study area and many locations throughout the U.S. I believe this research
succeeded in these goals and makes a substantial contribution to the knowledge that
could equip land managers with starting points and tools to assess the effectiveness of the
conservation management plans they intend to participate in. The unified study of social
and natural factors influencing no-till systems is essential to improving their
effectiveness. The synthesis of regulations and incentives relating to farm bill policies
from across the U.S. and comparisons of how different conservation methods have
affected landscapes over time also greatly furthers the conversation on best management
practices.
It is my hope that future studies will continue to explore and expound upon the social
forces that drive physical changes in the landscape, and that these will result in policy
changes that do not settle for improving one environmental condition while causing
others. As key areas upon which to focus research, I recommend that future studies
investigate communities that have successfully implemented no-till as it was designed to
be practiced, and for there to be given critical attention to the social and natural
community qualities that have likely resulted in its success. I also recommend

158
implementing long-term monitoring as the most compelling means to assess how well
conservation management techniques are performing. While this dissertation was able to
contribute much to the literature in methodologies for retracing historical impacts on the
landscape, having data physically available that already indicated that environmental
issues were not resolved was of extreme benefit and corroborated many of the findings in
this study. Further, long term monitoring gives context to how effectively practices work
and helps land managers evaluate whether environmental conditions become better,
worse, or stay the same.
Areas only briefly touched upon in this dissertation that require further investigation
include other co-, or even competing explanations, for self-sufficiency. As much as
policies and processes of neoliberalism have affected the Fifteenmile Watershed, there
are also other cultural dynamics that cause people to interact with the environment in the
way they do. Other alternatives to no-till agriculture or technologies that could improve it
are also largely missing, even though they are available. This dissertation only comprises
one component of various recommendations that could improve implementations of no-
till on both a local and national level, and I hope to continue in this research in the future.

159
References
Adkin, L.E. 1992. “Counter-hegemony and environmental politics in Canada.” In
Organizing Dissent: Contemporary Social Movements in Theory and Practice. W.K.
Carroll (ed.). Toronto: Garamond Press, pp. 247-63.
Armiliato, N., Ammar, D., Nezzi, L., Straliotto, M., Muller, Y.M., Nazari, E.M.,
2014. Changes in ultrastructure and expression of steroidogenic factor-1 in ovaries of
zebrafish Danio rerio exposed to glyphosate. J. Toxicol. Environ. Health A 77, 405e414.
Austin, A.P., Harris, G.E., and Lucey, W.P., 1991, "Impact of an organophosphate
herbicide (glyphosate) on periphyton communities developed in experimental streams."
Bulletin of Environmental Contamination and Toxicology, v. 47, 29-35.
Baker, B.P., 1988. Pest control in the public interest: crop protection in California.
Journal of Environmental Law and Policy 8, 31–77.
Bakker, Karen, 2010. “The Limits of ‘neoliberal Natures’: Debating Green
Neoliberalism.” Progress in Human Geography 34, no. 6: 715–35.
doi:10.1177/0309132510376849.
Basran, G. and Hay, D., 1988. The Political Economy of Agriculture in Western
Canada. Toronto: Garamond
Battaglin, William A., Karen C. Rice, Michael J. Focazio, Sue Salmons, and Robert
X. Barry., 2009. “The Occurrence of Glyphosate, Atrazine, and Other Pesticides in
Vernal Pools and Adjacent Streams in Washington, DC, Maryland, Iowa, and Wyoming,
2005–2006.” Environmental Monitoring and Assessment 155, no. 1–4: 281–307.
doi:10.1007/s10661-008-0435-y.
Battaglin, W.A., Meyer, M.t., Kuivila, K.M. and Dietze, J.E., 2014. “Glyphosate and
Its Degradation Product AMPA Occur Frequently and Widely in U.S. Soils, Surface
Water, Groundwater, and Precipitation.” JAWRA Journal of the American Water
Resources Association 50, no. 2: 275–90. doi:10.1111/jawr.12159.
Bellamy, P. Loveland, A., P. J., Bradley, R. I., Lark, R. M. and Kirk, G. J. D. 2005.
“Carbon losses from all soils across England and Wales 1978-2003.” Nature 437:245–
248.
Benbrook, C.M., 2012. “Impacts of Genetically Engineered Crops on Pesticide Use in
the U.S. -- the First Sixteen Years.” Environmental Sciences Europe 24, no. 1: 24.
doi:10.1186/2190-4715-24-24.
Benbrook, C.M., 2016. “Trends in Glyphosate Herbicide Use in the United States and
Globally.” Environmental Sciences Europe 28, no. 1: 3. doi:10.1186/s12302-016-0070-0.

160
Bergström, L., Börjesson, E. and Stenström, J., 2011. “Laboratory and Lysimeter
Studies of Glyphosate and Aminomethylphosphonic Acid in a Sand and a Clay Soil.”
Journal of Environmental Quality 40, no. 1: 98–108.
Blake, W.H., Ficken, K.J., Taylor, P. Russell, M.A. and Walling, D.E., 2012.
“Tracing Crop-Specific Sediment Sources in Agricultural Catchments.” Geomorphology
139–140: 322–29. doi:10.1016/j.geomorph.2011.10.036.
Boone, M. D., Bishop, C.A., Boswell, L.A., Brodman, R.D., Burger, J., Davidson, C.,
Gochfeld, M., et al., 2014. “Pesticide Regulation amid the Influence of Industry.”
BioScience. biu138. doi:10.1093/biosci/biu138.
Borggaard, O.K, and Gimsing, A.L., 2008. “Fate of Glyphosate in Soil and the
Possibility of Leaching to Ground and Surface Waters: A Review.” Pest Management
Science 64, no. 4: 441–56. doi:10.1002/ps.1512.
Brenner, N., Theodore, N., 2002. Cities and the geographies of ‘‘actually existing
neoliberalism. Antipode 34 (3), 349–379.
Brierley, G., Fryirs, K. and Jain, V., 2006. “Landscape Connectivity: The Geographic
Basis of Geomorphic Applications.” Area 38, no. 2: 165–74. doi:10.1111/j.1475-
4762.2006.00671.x.
Bridge, G., 2008. “Environmental economic geography: a sympathetic critique.”
Geoforum, 39(1): 76-81.
Brown A.G., Carey C., Erkens, G., Fuchs, M., Hoffman T., Macaire J.J.,
Moldenhauer, K.M., Walling, D., 2009. “From sedimentary records to sediment budgets:
multiple approaches to catchment sediment flux.” Geomorphology 108: 35–47.
Brown, L.R., 1981, World population growth, soil erosion, and food security:
Science, v. 214, p. 995–1002, doi: 10.1126/science.7302578.
Buttel, F.H., 2006. Sustaining the unsustainable: agro-food systems and environment
in the modern world. In: Cloke, P., Marsden, T., Mooney, P. (Eds.), Handbook of Rural
Studies. Sage, London, pp. 213–229.
Buttel, F.H., 1993. “Socioeconomic impacts and social implications of reducing
pesticide and agricultural chemical use in the United States.” The Pesticide Question:
Environment, Economics and Ethics. D. Pimenthal and H. Lehman (eds.). New York:
Chapman and Hall, pp. 153-81.
Byers, H.G., Miller, J.T., Williams, K.T., Lakin, H.W., 1938. Selenium occurrence in
certain soils in the United States III. U.S. Department of Agricultural Tech. Bull 60: 1-74.

161
Castree, N., 2010. “Neoliberalism and the Biophysical Environment 1: What
‘Neoliberalism’ Is, and What Difference Nature Makes to It.” Geography Compass 4, no.
12: 1725–33. doi:10.1111/j.1749-8198.2010.00405.x.
Canberra, 2000. Genie 2000. Basic Spectroscopy Software.
http://www.canberra.com/products/radiochemistry_lab/pdf/G2K-BasicSpect-SS-
C40220.pdf
Carson, R., 1962. Silent Spring. Houghton Mifflin, Boston.
Chang F., Simcik, M.F., Capel, P.D. 2011. “Occurrence and fate of the herbicide
glyphosate and its degradate aminomethylphosphonic acid in the atmosphere.” Environ
Toxicol Chem 30(3):548–555
Chiverrell R.C., Harvey, A.M., Hunter, S.Y., Millington, J., Richardson, N.J., 2008.
“Late Holocene environmental change in the Howgill Fells, northwest England.”
Geomorphology 100: 41–69.
Church M., Slaymaker O., 1989. “Disequilibrium of Holocene sediment yield in
glaciated British Columbia.” Nature 337: 452–454.
Clark, J. 2003. Fifteenmile Watershed Council and Wasco County Soil and Water
Conservation District
http://www.wasco.oacd.org/15mile%20Watershed%20Assessment.pdf
Clifford, N. J. 2002. “The future of geography: When the whole is less than the sum
of its parts.” Geoforum 33: 431-436.
Coupe, R.H., Kalkhoff S.J., Capel P.D., Gregoire, C, 2012. “Fate and transport of
glyphosate and aminomethylphosphonic acid in surface waters of agricultural basins.”
Pest Manag Sci. 2012;68(1):16–30. doi: 10.1002/ps.2212
Culpepper, A. S., 2006. “Glyphosate-Induced Weed Shifts.” Weed Technology 20,
no. 2: 277–81. doi:10.1614/WT-04-155R.1.
DEQ, 2010. Cost Estimate to Restore Riparian Forest Buffers and Improve Stream
Habitat in the Willamette Basin, Oregon.
http://www.deq.state.or.us/wq/tmdls/docs/WillametteRipCost030310.pdf
De Roos, A.J., Blair, A., Rusiecki, J.A., Hoppin, J.A., Svec, M., Dosemeci, M.,
Sandler, D.P., and Alavanja, M.C., 2005. “Cancer Incidence among Glyphosate-Exposed
Pesticide Applicators in the Agricultural Health Study.” Environmental Health
Perspectives 113, no. 1: 49–54.

162
de Rugy. V., 2012. “The History of Farm Bill Spending.” George Mason University.
Mercatus Center. George Mason University. http://mercatus.org/publication/updated-
history-farm-bill-spending
Dosseto, A., Hesse, P., Maher, K., Fryirs, K., Turner S.P., 2010. “Climate and
vegetation control on sediment dynamics during the last glacial cycle.” Geology 38(5):
395–398.
Dragović, S., N. Mihailović, and B. Gajić., 2008. “Heavy Metals in Soils:
Distribution, Relationship with Soil Characteristics and Radionuclides and Multivariate
Assessment of Contamination Sources.” Chemosphere 72, no. 3: 491–95.
doi:10.1016/j.chemosphere.2008.02.063.
Dudal, C. 2004. “The Sixth Factor of Soil Formation.” Paper Presented at the
International Conference on Soil Classification 2004. Petrozavodsk, Russia, August 3-5,
2004. http://www.itc.nl/~rossiter/research/siuma/Dudal_6thfactor.pdf
Eggen, R.I. L., Behra, R. Burkhardt-Holm, P., Escher, B.I., and Schweigert, N., 2004
“Peer Reviewed: Challenges in Ecotoxicology.” Environmental Science & Technology
38, no. 3: 58A–64A. doi:10.1021/es040349c.
Engel-Di Mauro, S., 2014. “Ecology, Soils, and the Left: An Ecosocial Approach.”
New York, NY: Palgrave Macmillan, (http://archive.org/details/saed2014_Ecology-Soils-
Left241
EPA, 1993a. “Reregistration Eligibility Decision (RED): Glyphosate; EPA-738-R-93-
014”; U.S Environmental Protection Agency, Office of Prevention, Pesticides, and Toxic
Substances, Office of Pesticide Programs, U.S. Government Printing Office: Washington,
DC, 1993.
EPA, 1993b. Reregistration Eligibility Decision (RED) Facts
http://www.epa.gov/oppsrrd1/reregistration/REDs/factsheets/0178fact.pdf
EPA, 1994. Eco Update. Field Studies for Ecological Risk Assessment.
https://www.epa.gov/sites/production/files/2015-09/documents/v2no3.pdf
EPA, 2012. “What is a 303(d) list of impaired waters?” Overview of impaired waters
and Total Maximum Daily Loads Program.
http://water.epa.gov/lawsregs/lawsguidance/cwa/tmdl/overview.cfm
EPA, 2015. “Impaired Waters and TMDLs in Region 10.” Overviews and Factsheets.
http://www.epa.gov/tmdl/impaired-waters-and-tmdls-region-10.
EPA, 2016. “Table of Regulated Drinking Water Contaminants.”
https://www.epa.gov/ground-water-and-drinking-water/table-regulated-drinking-water-

163
contaminants#one
EPA, 2017. Summary of the Toxic Substances Control Act.
https://www.epa.gov/laws-regulations/summary-toxic-substances-control-act
Estrin, S. “Drones And Their Positive Impact On Precision Agriculture.” Drone
Universities, September 15, 2015. http://www.droneuniversities.com/drones/drones-and-
their-positive-impact-on-precision-agriculture/.
EWG, 2017a.
https://conservation.ewg.org/whip_regions.php?fips=41000®ionname=Oregon
EWG, 2017b. Subtotal, Farming Subsidies in Wasco County, Oregon, 1995-2014
https://farm.ewg.org/top_recips.php?fips=41065&progcode=totalfarm&page=0
Evans, M., Slaymaker, O. 2004. “Spatial and temporal variability of sediment
delivery from alpine lake basins, Cathedral Provincial Park, southern British Columbia.”
Geomorphology 61: 209–224.
Fagin, D., 2012. “Toxicology: The Learning Curve.” Nature 490, no. 7421: 462–65.
doi:10.1038/490462a.
Fernandez-Cornejo, J. and Hallahan, C. 2013. “Conservation Tillage, Herbicide Use,
and Genetically Engineered Crops in the United States: The Case of Soybeans.” January
6, 2013. http://www.agbioforum.org/v15n3/v15n3a01-fernandez-cornejo.htm.
Florsheim, J. L., Pellerin, B. A. Oh, N. H., Ohara, N.. Bachand, P. A. M, Bachand, S.
M. Bergamaschi, B. A., Hernes, P. J and Kavvas. M. L., 2011. “From Deposition to
Erosion: Spatial and Temporal Variability of Sediment Sources, Storage, and Transport
in a Small Agricultural Watershed.” Geomorphology 132, no. 3–4: 272–86.
doi:10.1016/j.geomorph.2011.04.037.
Folmar, L.C., Sanders, H.O., Julin, A.M., 1979. "Toxicity of the herbicide glyphosate
and several of its formulations to fish and aquatic invertebrates." Archives of
Environmental Contamination and Toxicology, v 8, 269-278.
Fomsgaard, I.S., Spliid, N.H., and Felding, G., 2003. “Leaching of Pesticides through
Normal-Tillage and Low-Tillage Soil--a Lysimeter Study. II. Glyphosate.” Journal of
Environmental Science and Health. Part. B, Pesticides, Food Contaminants, and
Agricultural Wastes 38, no. 1: 19–35. doi:10.1081/PFC-120016603.
Friedrich, T., and Kassam. A., 2012. “No-till Farming and the Environment: Do No-
Till Systems Require More Chemicals?” Outlooks on Pest Management 23, no. 4: 153–
57. doi:10.1564/23aug02.

164
Fryirs, K., and Brierley, G.J., 2001. “Variability in sediment delivery and storage
along river courses in Bega catchment, NSW, Australia: implications for geomorphic
river recovery.” Geomorphology 38: 237–265.
Fryirs K., Brierley G.J., Preston N.J., Kasai, M., 2007. Buffers, barriers and blankets:
the (dis)connectivity of catchment-scale sediment cascades. Catena 70: 49–67.
Fryirs, K., 2013. “(Dis)Connectivity in Catchment Sediment Cascades: A Fresh Look
at the Sediment Delivery Problem.” Earth Surface Processes and Landforms 38, no. 1:
30–46. doi:10.1002/esp.3242.
Fu, G., Chen, S., and McCool, D.K., 2006. Modeling the impacts of no-till practice
on soil erosion and sediment yield with RUSLE, SEDD, and ArcView GIS. Soil and
tillage research, 85(1), 38-49.
Galbraith, J. M. 2006. “ICOMAND: International Committee on Anthrosol Soils.”
Available from Virginia Polytech and State University, Blacksburg, VA,
http://clic.cses.vt.edu/icomanth/.
Gale, F., 2013. U.S. Exports Surge as China Supports Agricultural Prices.
http://www.ers.usda.gov/amber-waves/2013-october/us-exports-surge-as-china-supports-
agricultural-prices.aspx#.VIijCzHF_iM
GAO, 2011. Drinking Water: Unreliable State Data Limit EPA's Ability to Target
Enforcement Priorities and Communicate Water Systems' Performance GAO-11-381:
Published: June 17, 2011. Publicly Released: Jul 19, 2011.
Gerzabek, M. H., G. Haberhauer, and H. Kirchmann. 2001. “Soil organic matter
pools and carbon-13 natural abundances in particle-size fractions of a long-term
agricultural field experiment receiving organic amendments.” Soil Sci. Soc. Am. J. 65:
352–358.
Giesy, J.P., Dobson, S. and Solomon, K., 2000. “Ecotoxicological Risk Assessment
for Roundup_ Herbicide”. Reviews of Environmental Contaminant Toxicology. no.
167:35-120.
Givens, W.A., Shaw, D.R., Johnson, W.G., Weller, S.C., Young, B.G, Wilson, R.G.,
Owen, M.D.K., and Jordan, D., 2009. “A Grower Survey of Herbicide Use Patterns in
Glyphosate-Resistant Cropping Systems.” Weed Technology 23, no. 1 (2009): 156–61.
Glenna, L., 1999. Systemic constraints to ecological well-being: the case of the 1985
food security act. Rural Sociology 64 (1), 133–157.
Goodman, D. and Redclift, M., 1991. Refashioning Nature: Food, Ecology and
Culture. New York: Routledge.

165
Gonzalez-de-Soto, M., Emmi, L., Benavides, C., Garcia, I. and Gonzalez-de-Santos,
P., 2016. “Reducing Air Pollution with Hybrid-Powered Robotic Tractors for Precision
Agriculture.” Biosystems Engineering 143: 79–94.
doi:10.1016/j.biosystemseng.2016.01.008.
Goudie, A. S. 1986. “The integration of human and physical geography.”
Transactions of the Institute of British Geographers 11(4): 454-458.
Grandjean, P., and Landrigan, P.J., 2014, “Neurobehavioural Effects of
Developmental Toxicity.” The Lancet. Neurology 13, no. 3: 330–38. doi:10.1016/S1474-
4422(13)70278-3.
Griffith, J.A., 2002. “Geographic Techniques and Recent Applications of Remote
Sensing to Landscape-Water Quality Studies.” Water, Air, and Soil Pollution 138, no. 1–
4: 181–97. doi:10.1023/A:1015546915924.
Grunewald, K., Schmidt, W., Unger, C. and Hanschmann, G., 2001., “Behavior of
Glyphosate and Aminomethylphosphonic Acid (AMPA) in Soils and Water of Reservoir
Radeburg II Catchment (Saxony/Germany).” Journal of Plant Nutrition and Soil Science
164, no. 1: 65–70. doi:10.1002/1522-2624(200102)164:1<65::AID-JPLN65>3.0.CO;2-G.
Hager, A.G., and Nordby, 2008. “Herbicide Persistence and How to Test for Residues
in Soils.” In Illinois Agricultural Pest Management Handbook, 279–86. University of
Illinois at Urbana-Champagne, Cooperative Extension Service.
Hall, P., 1998. “Sustainable agriculture and conservation tillage: managing the
contradictions.” The Canadian Review of Sociology and Anthropology 35, 221–251.
Harrison, J., 2008. “Abandoned Bodies and Spaces of Sacrifice: Pesticide Drift
Activism and the Contestation of Neoliberal Environmental Politics in California.”
Geoforum, Rethinking EconomyAgro-food activism in California and the politics of the
possible. Culture, nature and landscape in the Australian region, 39, no. 3: 1197–1214.
doi:10.1016/j.geoforum.2007.02.012.
Harrison, S., Massey, D., and Richards, K., 2006. “Complexity and emergence.”
Area, 38 (4), 465-471.
Harvey, A.M., 2002. “Effective timescales of coupling within fluvial systems.”
Geomorphology 44: 175–201.
Hedley, C., 2015. “The Role of Precision Agriculture for Improved Nutrient
Management on Farms.” Journal of the Science of Food and Agriculture 95, no. 1: 12–19.
doi:10.1002/jsfa.6734.

166
Hembree, K., and Shrestha, A., 2005. “Glyphosate‐Resistant Horseweed In
California.” University of California, Davis.
Henry, W. B., Shaw, D.R. Reddy, K.R., Bruce, L.M., and Tamhankar, H.D, 2004.
“Remote Sensing to Detect Herbicide Drift on Crops.” Weed Technology 18, no. 2: 358–
68. doi:10.1614/WT-03-098.
Higgins, V., Lockie, S., 2002. Re-discovering the social: neoliberalism and hybrid
practices of governing in rural natural resource management. Journal of Rural Studies
18, 419–428.
Hodge, E. T., 1932, Geological map of north central Oregon: Univ. Oregon Publ.,
Suppl. to Geology Series v. I, no. 5, 7 p., scale 1:250,000
Houben P., Wunderlich J., Schrott L., 2009. “Climate and long-term human impact
on sediment fluxes in watershed systems. Geomorphology 108: 1–7.
House, K., 2016. Draining Oregon: A creek in crisis.
http://www.oregonlive.com/environment/index.ssf/page/draining_oregon_day_3.html,
Accessed September 2016.
Huggins, D.R., and Reganold, J.P., 2008. “No-Till: The Quiet Revolution.” Scientific
American 299, no. 1 (July 2008): 70–77.
Hunt, E. R., Hively, W.D., Fujikawa, S.J., Linden, D.S., Daughtry, C.S.T, and
McCarty, G.W., 2010. “Acquisition of NIR-Green-Blue Digital Photographs from
Unmanned Aircraft for Crop Monitoring.” Remote Sensing 2, no. 1: 290–305.
doi:10.3390/rs2010290.
Hunter, 1907. Farm Practice in the Columbia Basin Uplands. USDA Farmers’
Bulletin 294.
https://naldc.nal.usda.gov/naldc/download.xhtml?id=ORC00000189&content=PDF
IARC, 2015. “IARC Monographs Volume 112: evaluation of five organophosphate
insecticides and herbicides” International Agency for Research on Cancer. World Health
Organization. https://www.iarc.fr/en/media-
centre/iarcnews/pdf/MonographVolume112.pdf
International Survey of Herbicide Resistant Weeds in Oregon, 2017.
http://www.weedscience.org/Details/USState.aspx?StateID=38. Accessed April 20, 2017.
Jessup, B. National Water Quality Initiative Technical Assistance for Fifteenmile
Creek (Oregon): Comparison of Substrate Measures through 2016. Tetra Tech, Inc. Final
Report. December 29.

167
Keeney, D. 2010. “Monsanto’s Round-Up Ready Crops Increasing Herbicide Use.”
Think Forward. http://www.tcdailyplanet.net/blog/iatp/monsantos-roundup-ready-crops-
increasing-herbicide-use
Kremer, R.J., and Means, N.E., 2009. “Glyphosate and Glyphosate-Resistant Crop
Interactions with Rhizosphere Microorganisms.” European Journal of Agronomy,
Glyphosate Interactions with Physiology, Nutrition, and Diseases of Plants: Threat to
Agricultural Sustainability? Mineral Nutrition and Disease Problems in Modern
Agriculture: Threats to Sustainability?, 31, no. 3: 153–61. doi:10.1016/j.eja.2009.06.004.
Koger, C.H., Poston, D.H., Hayes, R.M. and Montgomery, R.F, 2004. “Glyphosate-
Resistant Horseweed (Conyza Canadensis) in Mississippi.” Weed Technology 18, no. 3:
820–25.
Koiter, A.J., Owens, P.N., Petticrew, E.L., Labb, D.A., 2013. The behavioural
characteristics of sediment properties and their implications for sediment fingerprinting
as an approach for identifying sediment sources in river basins. Earth Sci. Rev. 125, 24–
42.
Lake, R.W., Disch, L., 1992. Structural constraints and pluralist contradictions in
hazardous waste regulation. Environment and Planning A 24, 663–681.
Lane S.N., Reid S.C., Tayefi, V., Yu,D., Hardy RJ., 2008. “Reconceptualising coarse
sediment delivery problems in rivers as catchment-scale and diffuse.” Geomorphology
98: 227–249.
Lane, S. N., 2001. "Constructive comments on D Massey - `Space-time, ``science''
and the relationship between physical geography and human geography'." Transactions of
the Institute of British Geographers 26(2): 243-256.
Lasier, P.J., Urich, M.L., Hassan, S.M., Jacobs, W.N., Bringolf, R.B., and Owens,
K.M., 2016. “Changing Agricultural Practices: Potential Consequences to Aquatic
Organisms.” Environmental Monitoring and Assessment 188, no. 12: 672.
doi:10.1007/s10661-016-5691-7.
Langdale, G.W., Leonard, R.A., and Thomas, A.W. 1985. “Conservation practice
effects on phosphorus losses from Southern Piedmont watersheds.” Journal of Soil and
Water Conservation, Vol. 40, no. 1: 157-61.
Lauer, J.W., and Parker, G., 2008. Net local removal of floodplain sediment by river
meander migration. Geomorphology 96:123–49.
Lave, R., Wilson, M.W., Barron, E., Biermann, C., Carey, M., Doyle, M. Duvall, C.,
Johnson, L., Lane, M., Lorimer, J., McClintock, N., Munroe, D., Pain, R., Proctor, J.,
Rhoads, B., Robertson, M.M., Rossi, J., Sayre, N.F, Simon, G., Tadaki, M., Van Dyke,

168
C., 2013. “Intervention: Critical Physical Geography.” The Canadian Geographer 58: 1-
10.
Lave, R. 2014. “Engaging within the Academy: A Call for Critical Physical
Geography.” ACME: An International E-Journal for Critical Geographies 13, no. 4:
508–15.
Lehrer, N. 2010. U.S. Farm Bills and Policy Reforms: Ideological Conflicts over
World Trade, Renewable Energy, and Sustainable Agriculture in Politics, Institutions,
and Public Policy.
Leitner, H., Sheppard, E.S., Sziarto, K., Maringanti, A., 2007b. Contesting urban
futures: decentering neoliberalism. In: Leitner, H., Peck, J., Sheppard, E.S. (Eds.),
Contesting Neoliberalism: Urban Frontiers. Guilford, New York.
Lenihan, M.H., and Brasier, K.J., 2010. “Ecological Modernization and the US Farm
Bill: The Case of the Conservation Security Program.” Journal of Rural Studies 26, no. 3:
219–27. doi:10.1016/j.jrurstud.2009.12.004.
Li, S., Lobb, D.A., Lindstrom, M.J., and Farenhorst, A., 2007. “Tillage and Water
Erosion on Different Landscapes in the Northern North American Great Plains Evaluated
Using 137Cs Technique and Soil Erosion Models.” CATENA 70, no. 3: 493–505.
doi:10.1016/j.catena.2006.12.003.
Majewski, M.S,, Coupe R.H., Foreman W.T., Capel P.D., 2014. “Pesticides in
Mississippi air and rain: a comparison between 1995 and 2007.” Environ Toxicol
Chem. 2014;33(6):1283–1293. doi: 10.1002/etc.2550.
Marshall, L. 2000. “Bad for Business”: Contextual Analysis, Race Discrimination,
and Fast Food, 34 J. MARSHALL L. REV. 207, 227.
McClintock, N., 2015. “A Critical Physical Geography of Urban Soil
Contamination.” Geoforum 65: 69–85. doi:10.1016/j.geoforum.2015.07.010.
McCool, D.K., Papendick, R.I., and Hammel, J.E., 1995. Surface residue
management. Pages 10-16 in R.I. Papendick and W.C. Moldenhauer (eds.). Crop Residue
Management to Reduce Erosion and Improve Soil Quality. USDA-Agricultural Research
Service, Conservation Report Number 40.
McCool, O.K., K.E. Saxron. and P.K. Kaliu, 2006 Winter Runoff and Erosion on
northwestern USA cropland, Paper No. 062190. 111 2006 Annual International Meeting
American Society of Agricultural and Biological Engineers. Portland, Oregon, USA, 9-12
July.
McGregor A.C., 1982. Counting Sheep: From Open Range to Agribusiness on the

169
Columbia Plateau. Seattle, WA: University of Washington Press
Mesnage, R., Defarge, N., Spiroux de Vendômois, J., and Séralini, G. E., 2015.
“Potential Toxic Effects of Glyphosate and Its Commercial Formulations below
Regulatory Limits.” Food and Chemical Toxicology 84: 133–53.
doi:10.1016/j.fct.2015.08.012.
Mesnage R, Bernay B, Seralini GE., 2013. “Ethoxylated adjuvants of glyphosate-
based herbicides are active principles of human cell toxicity. Toxicology.” 313(2–3):122–
8.
Montgomery, D.R., 2007. “Is Agriculture Eroding Civilization’s Foundation?” GSA
Today 17, no. 10: 4–9. doi:10.1130/GSAT01710A.1.
Motha, J.A., Wallbrink, P.J., Hairsine, P.B., Grayson, R.B., 2002. Tracer properties of
eroded sediment and source material. Hydrol. Process. 16, 1983–2000.
Myers, J.P., Antoniou, M.N., Blumberg, B., Carroll, L., Colborn, T., Everett, L.G.,
Hansen, M., Landrigan, P., Lanphear, B.P., Mesnage, R., Vandenburg, L.N., vom Saal,
F.S., Welshons, W.V., Benbrook, C., 2016. “Concerns over Use of Glyphosate-Based
Herbicides and Risks Associated with Exposures: A Consensus Statement.”
Environmental Health 15: 19. doi:10.1186/s12940-016-0117-0.
Nagle, G. N. and Ritchie, J. C., 2003. “Wheat Field Erosion Rates and Channel
Bottom Sediment Sources in an Intensively Cropped Northeastern Oregon Drainage
Basin.” Land Degradation & Development 15 (1): 15–26. doi:10.1002/ldr.587.
NASA, 2017. “Landsat Satellite Missions”. https://landsat.usgs.gov/landsat-data-
access. Accessed January 5, 2017.
Nash, L., 2004. The fruits of ill-health: pesticides and workers’ bodies in post-World
War II California. Osiris 19, 203–219.
Nelson, William M., 2004. “Green Chemistry and the Path to Sustainable
Agriculture.” In Agricultural Applications in Green Chemistry, 887:7–21. ACS
Symposium Series 887. American Chemical Society. http://dx.doi.org/10.1021/bk-2004-
0887.ch002.
Nelson, L., 2000. Fifteenmile Creek Subbasin Summary (including Oregon (including
Oregon Tributaries between Hood River and The Dalles Dam).
http://docs.streamnetlibrary.org/Subbasin_Plans/Columbia_Gorge/Fifteenmilesumm2000
NPIC, 2008. Glyphosate Technical Fact Sheet. Oregon State University, National
Pesticide Information Center, Corvallis, Oregon, 14 pp.

170
NPIC, 2015. Glyphosate technical Fact Sheet.
http://npic.orst.edu/factsheets/archive/glyphotech.html#toxbox. Accessed July 3, 2017.
NRCS, 1982. Soil Survey of Wasco County Oregon, Northern Part.
http://www.nrcs.usda.gov/Internet/FSE_MANUSCRIPTS/oregon/OR673/0/or673_text.p
df
NRCS, 2000. Technical Notes: Soil Disturbance in No-Till and Direct Seed Planting
Systems. Agronomy Technical Note No. 39.
http://www.nrcs.usda.gov/Internet/FSE_DOCUMENTS/nrcs142p2_042675.pdf
NRCS, 2006. Tillage Practice Guide. A Guide to USDA-NRCS Practice Standards
329 No Till/Strip Till/Direct Seed and 345 Mulch Till. Practice Standard 329-
NoTill/Strip Till/Direct Seed. U.S. Department of Agriculture Natural Resources
Conservation Service (August 2006).
NRCS, 2015a. “EQUIP Yourself with these conservation facts.”
http://www.nrcs.usda.gov/wps/portal/nrcs/detail/national/newsroom/features/?cid=stelprd
b1241401
NRCS, 2015b. Erosion Conservation Analysis. Lower Deschutes Agricultural Water
Quality Plan Assessment. Presentation October 2015.
NRCS, 2016. “Seeing Is Believing: How No-till Farming Transformed the Landscape
| NRCS Oregon.” Accessed January 23, 2017.
https://www.nrcs.usda.gov/wps/portal/nrcs/detail/or/newsroom/stories/?cid=nrcseprd130
3806.
New York Times (NYT), 2006. Editorial: Muzzling those pesky scientists. December
11.
ODA, 2017. Pesticide Drift.
https://www.oregon.gov/ODA/programs/Pesticides/RegulatoryIssues/Pages/PesticideDrif
t.aspx. Accessed May 1, 2017.
ODA, 2014. Oregon Agriculture: Facts and Figures.
http://www.nass.usda.gov/Statistics_by_State/Oregon/Publications/facts_and_figures/fact
s_and_figures.pdf
ODA, 2012. Oregon Agriculture Water Quality Report.
https://www.oregon.gov/ODA/shared/Documents/Publications/NaturalResources/ORAg
WaterQualityReport.pdf
Osteen, C.D., and Fernandez-Cornejo, J, 2013. “Economic and Policy Issues of U.S.

171
Agricultural Pesticide Use Trends.” Pest Management Science 69, no. 9: 1001–25.
doi:10.1002/ps.3529.
Peck, J., Tickell, A., 2002. Neoliberalizing Space. Antipode 34 (3), 380–404.
Peart, M.R. and Walling, D.E., 1988. “Techniques for establishing suspended
sediment sources in two drainage basins in Devon, U.K.: a comparative assessment.”
Sediment Budgets (ed. M.P. Bordas and D.E. Walling) (Proc. Porto Alegre Symp.,
December. 41-55 IAHA Publ. no 159
Public Employees for Environmental Responsibility (PEER), 2006.
http://www.peer.org/news/news_id.php?row_id=786.
Perkowski, M., 2014. “Farm regulators increase scrutiny of water quality.”
http://www.capitalpress.com/Water/20141222/farm-regulators-increase-scrutiny-of-
water-quality. Accessed May 12, 2016.
Philpott, T., 2013. “One Weird Trick to Fix Farms Forever.” Mother Jones..
http://www.motherjones.com/environment/2013/09/cover-crops-no-till-david-brandt-
farms. Accessed May 12, 2016
Polyakov, V. O., Nearing, M. A. and Shipitalo, M. J., 2004. “Tracking Sediment
Redistribution in a Small Watershed: Implications for Agro-Landscape Evolution.” Earth
Surface Processes and Landforms 29, no. 10: 1275–91. doi:10.1002/esp.1094.
Porter, W., 2010. “Literature Review on biological effects of Roundup herbicide and
evaluation of materials safety data sheet and use instructions for Aquamaster.”
Department of Zoology, University of Wisconsin, Madison.
Powles, S.B, 2008. “Evolved Glyphosate-Resistant Weeds around the World: Lessons
to Be Learnt.” Pest Management Science 64, no. 4: 360–65. doi:10.1002/ps.1525.
PRISM, 2017. Climate Group, Oregon State University, http://prism.oregonstate.edu,
created 4 Feb 2004. Accessed January 3, 2017.
Prudham, S, 2004. “Poisoning the Well: Neoliberalism and the Contamination of
Municipal Water in Walkerton, Ontario.” Geoforum, Themed issue on “Neoliberal nature
and the nature of neoliberalism,” 35, no. 3: 343–59. doi:10.1016/j.geoforum.2003.08.010.
Quindós, L. S., Sainz, C., Fuente, I., Nicolás, J., Quindós, L., and Arteche, J., 2006.
“Correction by Self-Attenuation in Gamma-Ray Spectrometry for Environmental
Samples.” Journal of Radioanalytical and Nuclear Chemistry 270, no. 2: 339–43.
doi:10.1007/s10967-006-0354-8.
Reid S.C., Lane S.N., Berney J.M., Holden J., 2007. “The timing and magnitude of

172
coarse sediment transport events within an upland, temperate gravel-bed river.”
Geomorphology 83: 152–182
Relyea, R.A., 2005. “The Lethal Impact of Roundup on Aquatic and Terrestrial
Amphibians.” Ecological Applications 15, no. 4: 1118–24. doi:10.1890/04-1291.
Rhoads, B.L., 1999. “Beyond Pragmatism: The Value of Philosophical Discourse for
Physical Geography.” Annals of the Association of American Geographers 89, no. 4:
760–71. doi:10.1111/0004-5608.00176.
Richter, D., 2007. “Humanity’s transformation of Earth’s soil: Pedology’s new
frontier.” Soil science. 172 (12):957–967.
Richter, D. and Markewitz, D., 2001. “Understanding soil change: soil sustainability
over millennia, centuries and decades.” Cambridge: Cambridge University Press.
Rigdon, K.C., 2011. “Stop the Planting! The 1985 Farm Bill, Conservation
Compliance, and America’s Agricultural Conservation Failure.” Drake Journal of
Agricultural Law 16, no. 3: 487–507.
Robbins, P., and Sharp, J.T., 2003. “Producing and Consuming Chemicals: The
Moral Economy of the American Lawn.” Economic Geography 79, no. 4: 425–51.
doi:10.1111/j.1944-8287.2003.tb00222.x.
Rull, R.P., Ritz, B., Shaw, G.M., 2006. “Neural tube defects and maternal residential
proximity to agricultural pesticide applications.” Am. J. Epidemiol. 163, 743e753.
Schaetzl, R., and S. Anderson. 2005. “Soils: Genesis and Geomorphology.”
Cambridge Univ. Press, UK.
Schinasi, L. and Leon, M.E, 2014. “Non-Hodgkin Lymphoma and Occupational
Exposure to Agricultural Pesticide Chemical Groups and Active Ingredients: A
Systematic Review and Meta-Analysis.” International Journal of Environmental Research
and Public Health 11, no. 4: 4449–4527. doi:10.3390/ijerph110404449.
Schreiber, J. D.,. Rebich, R. A, and Cooper, C.M, 2001. Dynamics of diffuse
pollution from US southern watersheds. Water Research, 35(10), 2534-2542.
Schug, T. T., Abagyan, R., Blumberg, B., Collins, T.J., Crews, D., DeFur, P.L.,
Dickerson, S.M., et al., 2012. “Designing Endocrine Disruption out of the next
Generation of Chemicals.” Green Chemistry 15, no. : 181–98.
doi:10.1039/C2GC35055F.
Service, R.F., 2007. “Glyphosate--The Conservationist’s Friend?” Science 316, no.
5828: 1116–17. doi:10.1126/science.316.5828.1116.

173
Showers, K. B. 2006. “A history of African soil: Perceptions, use and abuse”. Soils
and Societies. J. R. McNeill and V. Winiwarter (eds.). The White Horse Press, Isle of
Harris, UK. pp. 118 176.3390/ijerph110404449.
Shrestha, A., Hembree, K. J., and Va, N., 2007. “Growth stage influences level of
resistance in glyphosate‐resistant horseweed.” California Agriculture, 61(2), 67.
Simonsen, L., Fomsgaard, I.S., Svensmark, B. and Spliid, N.S., 2008. “Fate and
Availability of Glyphosate and AMPA in Agricultural Soil.” Journal of Environmental
Science & Health, Part B -- Pesticides, Food Contaminants, & Agricultural Wastes 43,
no. 5: 365–75. doi:10.1080/03601230802062000.
Small, L.F., McIntire, C.D., MacDonald, K.B., Lara-Lara, J.R., Frey, B.E.,
Amspoker, M.C., and Winfield, T, 1990. “Primary Production, Plant and Detrital
Biomass, and Particle Transport in the Columbia River Estuary.” Progress in
Oceanography 25, no. 1–4: 175–210. doi:10.1016/0079-6611(90)90007-O.
Sorenson, A., 1994. Agricultural Conservation Alternatives: The Greening og the
Farm Bill. American Farmland Trust Center for Agriculture in the Environment.
http://www.farmlandinfo.org/sites/default/files/AGRICULTURAL_CONSERVATION_
ALTERNATIVES_THE_GREENING_OF_THE_FARM_BILL_OCTOBER_1994_1.pd
f
Stout, J.C., Belmont, P., Schottler, S.P., and Willenbring, J.K, 2014. “Identifying
Sediment Sources and Sinks in the Root River, Southeastern Minnesota.” Annals of the
Association of American Geographers 104, no. 1: 20–39.
doi:10.1080/00045608.2013.843434.
Strachnov, V., LaRosa, J., Dekner, R., Zeisler, R. Fajgelj, A., 1996. Report on the
Intercomparison Run IAEA-375: Determination of Radionuclides in Soil Sample IAEA-
375, IAEA/AL/075. Analytical Quality Control Services International Atomic Energy
Agency, Vienna (1996)
Stroganova, M. N., Myagkova, A. D. and Prokofieva, T. V., 1997. “The role of soils
in urban ecosystems.” Eurasian Soil Sci. 30:82–86.
SWCD, 2015. “Our History”. http://wascoswcd.org/wcswcd_002.htm
SWCD, 2009. Wasco County Rural Living Handbook.
https://wascoswcd.org/linked/wasco_rlh.pdf. Accessed January 12, 2015.
Swidler, E.M., 2009. “The Social Production of Soil.” Soil Science: January 2009 -
Volume 174 - Issue 1 - pp 2-8 doi: 10.1097/SS.0b013e318194274d
Syvitski, J.P.M., Vorosmarty, C.J., Kettner A.J., Green, P., 2005. Impact of humans

174
on the flux of terrestrial sediment to the global coastal ocean. Science 308: 376–380.
Tadaki, Marc, Brierley, G., Dickson, M. Le Heron, R. and Salmond, J., 2015.
“Cultivating Critical Practices in Physical Geography.” The Geographical Journal 181,
no. 2: 160–71. doi:10.1111/geoj.12082.
Trimble, S.W., 1999. Decreased Rates of Alluvial Sediment Storage in the Coon
Creek Basin, Wisconsin, 1975-93. Science, 285(5431), 1244-1246.
Trivero, P., Borasi, M., Biamino, W., Cavagnero, M., Rinaudo, C., Bonansea, M., and
Lanfri, S., 2013. “River Pollution Remediation Monitored by Optical and Infrared High-
Resolution Satellite Images.” Environmental Monitoring and Assessment 185, no. 9:
7647–7658. doi:10.1007/s10661-013-3125-3.
Tsui, M.T. K., and Chu, L.M.., 2004. “Comparative Toxicity of Glyphosate-Based
Herbicides: Aqueous and Sediment Porewater Exposures.” Archives of Environmental
Contamination and Toxicology 46, no. 3: 316–23. doi:10.1007/s00244-003-2307-3.
University of Oregon Aerial Photograph Collection. Accessed June 2014.
http://library.uoregon.edu/map/orephoto/imagery.html
Urstadt, B., 2004. “A four-year plague: President Bush’s anti-environmental agenda
has succeeded not in leaps but in inches.” Harpers 38 (48), 81–83.
USDA NASS CDL, 2017. Published crop-specific data layer [Online]. Available at
https://nassgeodata.gmu.edu/CropScape/ (accessed January 3, 2017). USDA-NASS,
Washington, DC
USDA, 2017. Pesticide Use and Markets. https://www.ers.usda.gov/topics/farm-
practices-management/chemical-inputs/pesticide-use-markets.aspx
USDA, 2015. “Conservation Fact Sheet.” http://www.fsa.usda.gov/Assets/USDA-
FSA-Public/usdafiles/FactSheets/archived-fact-sheets/consv_reserve_program.pdf
USDA, 2012. “2012 Agricultural Wheat Use Survey.”
http://www.nass.usda.gov/Surveys/Guide_to_NASS_Surveys/Chemical_Use/ChemUseH
ighlights-Wheat-2012.pdf
U.S. Fish and Wildlife Service, 2009. CREP BO 2009_final.doc TS Number: 09-314
TAILS: 13420-2009-F-0047.
https://www.fsa.usda.gov/Internet/FSA_File/crepbo2009final.pdf
US Office of Management and Budget (US OMB), 2006. Budget of the United States
Government. Budget Authority for US Environmental Protection Agency.

175
Vera, M.S., Lagomarsino, L., Sylvester, M., Pérez, G.L., Rodríguez, P., Mugni, H.,
Sinistro, R. Ferraro, M., Bonetto, C., Zagarese, H., Pizarro, H., 2010. “New Evidences of
Roundup (Glyphosate Formulation) Impact on the Periphyton Community and the Water
Quality of Freshwater Ecosystems.” Ecotoxicology (London, England) 19, no. 4: 710–21.
doi:10.1007/s10646-009-0446-7.
Vogelmann, J. E, Helder, D. Morfitt, R., Choate, M.J., Merchant, J.W., and Bulley,
H., 2001. “Effects of Landsat 5 Thematic Mapper and Landsat 7 Enhanced Thematic
Mapper Plus Radiometric and Geometric Calibrations and Corrections on Landscape
Characterization.” Remote Sensing of Environment, Landsat 7, 78, no. 1–2: 55–70.
doi:10.1016/S0034-4257(01)00249-8.
Wainwright J., Turnbull L., Ibrahim T.G., Lexartza-Artza I., Thornton, S.F., Brazier
R.E., 2010. “Linking environmental regimes, space and time: interpretations of structural
and functional connectivity.” Geomorphology 126: 387–404
Wallbrink P.J., and Murray, A.S., 1996. “Distribution and variability of Be-7 in soils
under different surface cover conditions and its potential for describing soil redistribution
processes.” Water Resources Research 32: 467–476.
Wallbrink, P.J., Murray, A.S., Olley, J.M., 1998. “Determining sources and residence
time of suspended sediment in the Murrumbidgee River, New South Wales, Australia,
using fallout Cs-137 and Pb-210.” Water Resour. Res. 34, 879–997.
Walling D.E., Fang D., 2003. Recent trends in the suspended sediment loads of the
world’s rivers. Global and Planetary Change 39:111–126.
Walling, D.E., 2005. Tracing suspended sediment sources in catchments and river
systems. Sci. Total Environ. 344, 159–184.
Wasco County Soil and Water Conservation District, 2009. Wasco County Rural
Living Handbook. A Resource for Country Living and Land Stewardship.
http://wascoswcd.org/linked/wasco_rlh.pdf
Wasco County Planning Department (WCPD), 2017. Comprehensive Plan, Chapter 2.
http://www.co.wasco.or.us/Planning/Comp_Plan/02Physical_Characterist.pdf
Weier, J. and Herring, D., 2000. “Measuring Vegetation (NDVI & EVI) : Feature
Articles.” http://earthobservatory.nasa.gov/Features/MeasuringVegetation/. Accessed
December 15, 2016.
Wells, L. E., and J. S. Noller. 1999. “Holocene coevolution of the physical landscape
and human settlement in northern Coastal Peru.” Geoarchaeology 14:755–789.
Williams, J. D., Wuest, S. B., 2001 “No-Till Influence on Hydrology and Stream

176
Morphology in Dryland Crop Areas.” Columbia Basin Agricultural Research Annual
Report. Spec. Rpt. 1026, pp.84-95, 2001 Oregon State University in cooperation with
USDA-Agricultural Research Service, Pendleton, OR
Williams, J. D., S. B. Wuest, and D. S. Long, 2014. “Soil and Water Conservation in
the Pacific Northwest through No-Tillage and Intensified Crop Rotations.” Journal of
Soil and Water Conservation 69, no. 6: 495–504. doi:10.2489/jswc.69.6.495.
Winson, A. 1992. The Intimate Commodity. Toronto: Garamond Press.
Witmer, G., Sayler, R., Huggins, D. and Capelli, J., 2007. “Ecology and Management
of Rodents in No-till Agriculture in Washington, USA.” Integrative Zoology 2, no. 3:
154–64. doi:10.1111/j.1749-4877.2007.00058.x.
Woodhouse, E.J., 2006. “Nanoscience, Green Chemistry, and the Privileged Position
of Science” in The New Political Sociology of Science. Kelly Moore and Scott Frickel,
eds., University of Wisconsin Press.
Wright, A., 2005. The Death of Ramon Gonzalez. University of Texas Press, Austin.
WSU Extension, 2017. “High Residue Farming Under Irrigation.” Center for
Sustaining Agriculture and Natural Resources. http://csanr.wsu.edu/high-residue-
farming-under-irrigation/. Accessed March 10, 2017.
Wulder, Michael A., Jeffrey G. Masek, Warren B. Cohen, Thomas R. Loveland, and
Curtis E. Woodcock. “Opening the Archive: How Free Data Has Enabled the Science and
Monitoring Promise of Landsat.” Remote Sensing of Environment, Landsat Legacy
Special Issue, 122 (July 2012): 2–10. doi:10.1016/j.rse.2012.01.010.
Zapata, F., 2003. ed. Handbook for the Assessment of Soil Erosion and
Sedimentation Using Environmental Radionuclides. Dordrecht: Kluwer Academic
Publishers. http://link.springer.com/10.1007/0-306-48054-9.
Zhang, X. C., Zhang, G.H., Liu, B.L., and Liu, B., 2016. “Using Cesium-137 to
Quantify Sediment Source Contribution and Uncertainty in a Small Watershed.”
CATENA 140: 116–24. doi:10.1016/j.catena.2016.01.021.
Zitong, G., Ganlin, Z., and Guobao. L. 1999. “Diversity of Anthrosols in China.”
Pedosphere. 9:193–204.
Zuzel, J.F., and Pikul, Jr., J.L., 1987. “Infiltration into a seasonally frozen
agricultural soil.” Journal of Soil and Water Conservation 42(6):447-450.