Using Clinical Analytics to Optimize Care Coordination ... · Using Clinical Analytics to Optimize...
61
Using Clinical Analytics to Optimize Care Coordination Across Multiple Sites of Care
Transcript of Using Clinical Analytics to Optimize Care Coordination ... · Using Clinical Analytics to Optimize...
Using Clinical Analytics to Optimize Care Coordination Across
Multiple Sites of Care
© 2013 Humedica, Inc., All Rights Reserved 2
Delivering actionable data in ways
that are useful to care teams on the
front lines, helping to drive quality
and performance improvement
Goal
© 2013 Humedica, Inc., All Rights Reserved 3
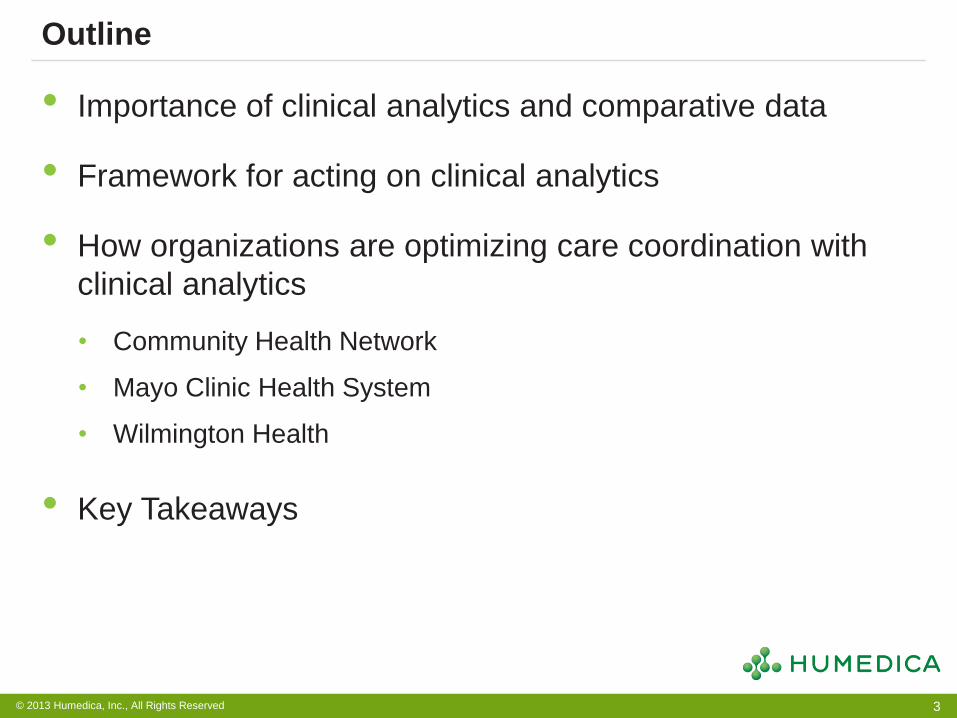
• Importance of clinical analytics and comparative data
• Framework for acting on clinical analytics
• How organizations are optimizing care coordination with
clinical analytics
• Community Health Network
• Mayo Clinic Health System
• Wilmington Health
• Key Takeaways
Outline
© 2013 Humedica, Inc., All Rights Reserved 4
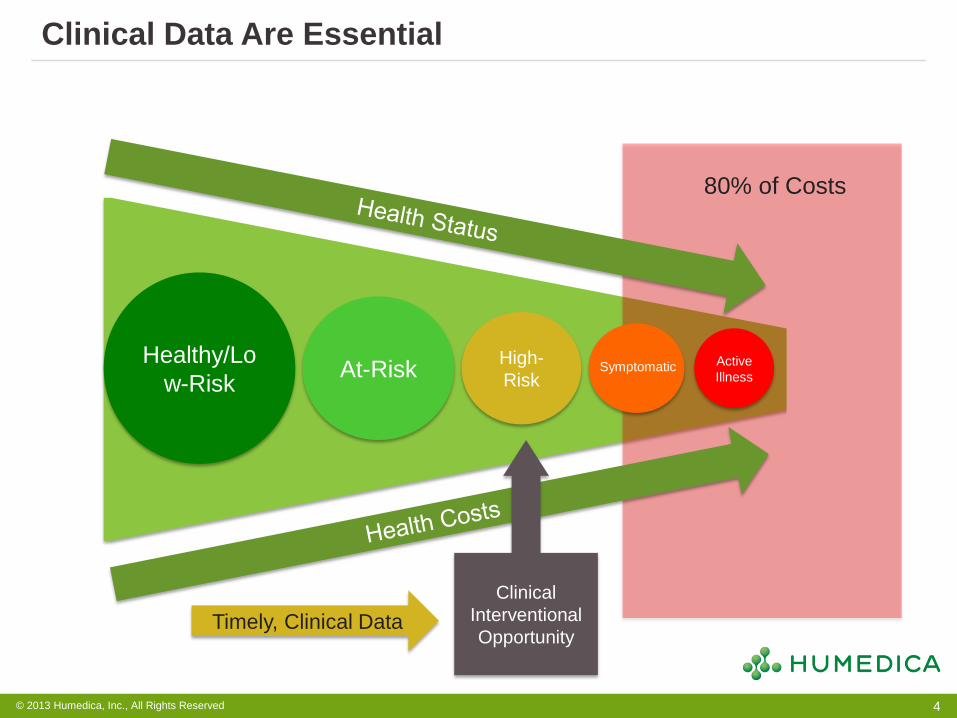
Clinical Data Are Essential
Healthy/Lo
w-Risk At-Risk
High-
Risk Symptomatic
Active
Illness
80% of Costs
Clinical
Interventional
Opportunity Timely, Clinical Data
© 2013 Humedica, Inc., All Rights Reserved 5
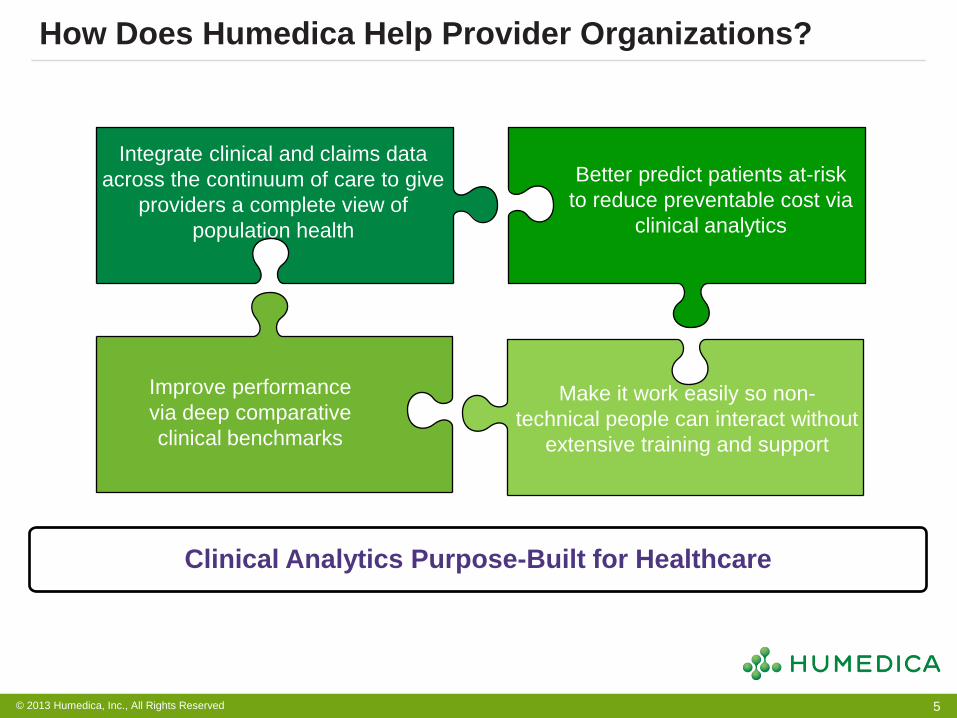
How Does Humedica Help Provider Organizations?
Clinical Analytics Purpose-Built for Healthcare
Integrate clinical and claims data
across the continuum of care to give
providers a complete view of
population health
Better predict patients at-risk
to reduce preventable cost via
clinical analytics
Make it work easily so non-
technical people can interact without
extensive training and support
Improve performance
via deep comparative
clinical benchmarks
© 2013 Humedica, Inc., All Rights Reserved 6
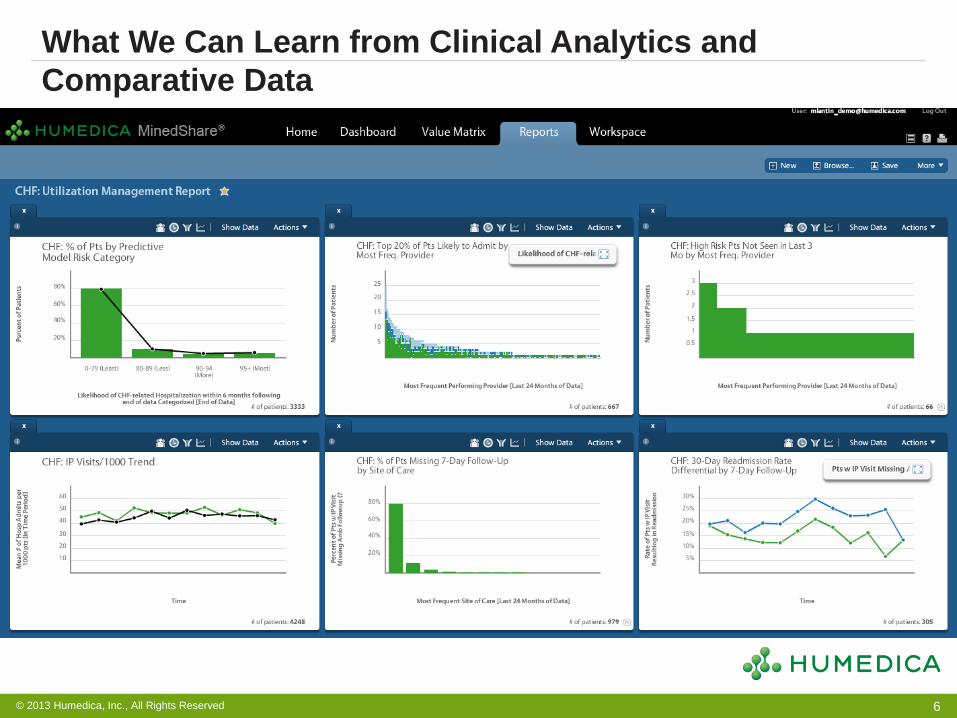
What We Can Learn from Clinical Analytics and
Comparative Data
© 2013 Humedica, Inc., All Rights Reserved 7
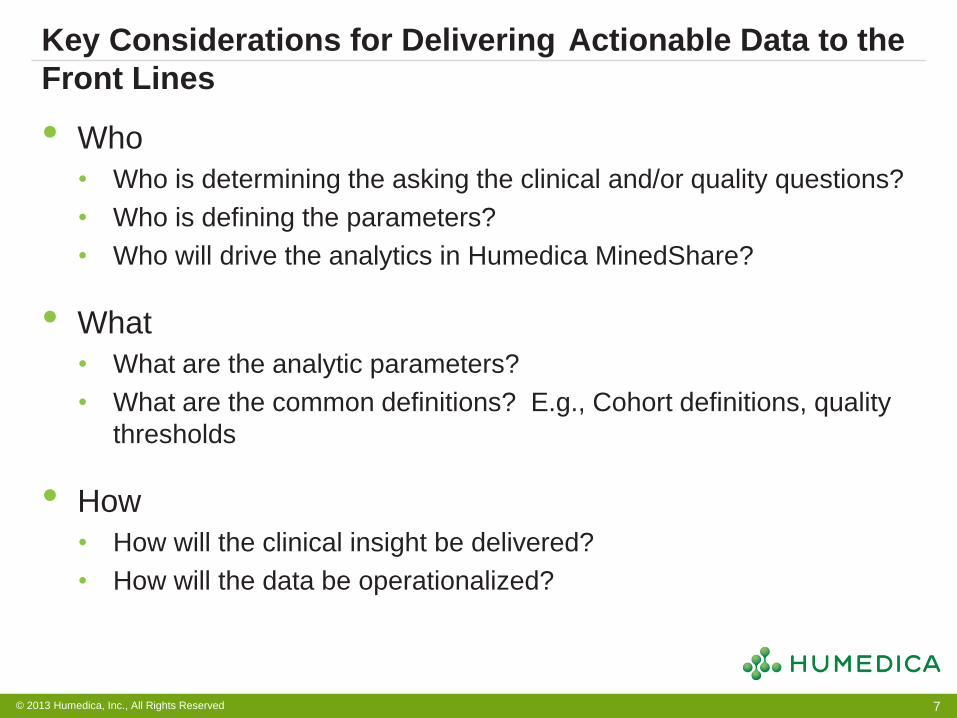
• Who
• Who is determining the asking the clinical and/or quality questions?
• Who is defining the parameters?
• Who will drive the analytics in Humedica MinedShare?
• What
• What are the analytic parameters?
• What are the common definitions? E.g., Cohort definitions, quality
thresholds
• How
• How will the clinical insight be delivered?
• How will the data be operationalized?
Key Considerations for Delivering Actionable Data to the
Front Lines
© 2013 Humedica, Inc., All Rights Reserved 8
Three Organizations Using Clinical Analytics to Optimize
Care Coordination
Using Clinical Analytics to Optimize Care Coordination at Community Health Network
Mary Jane Lowrance, RN, MSN, MBA Chief Nurse Executive Community Physician Network
• Established in 1956 as a not-for-profit hospital on the East side of Indianapolis
• 2013-over 200 sites of care, 8 hospitals and affiliates throughout Central Indiana
• Integrated multispecialty physician group, Community Physician Network, has more than 500 physicians providing comprehensive care at more than 100 locations
• >1,000,000 outpatient visits annually • New conversion to EPIC (April-November 2012) for
all sites of care, and 4 hospitals • Leader in Quality Health First measures
Community Health Network
10
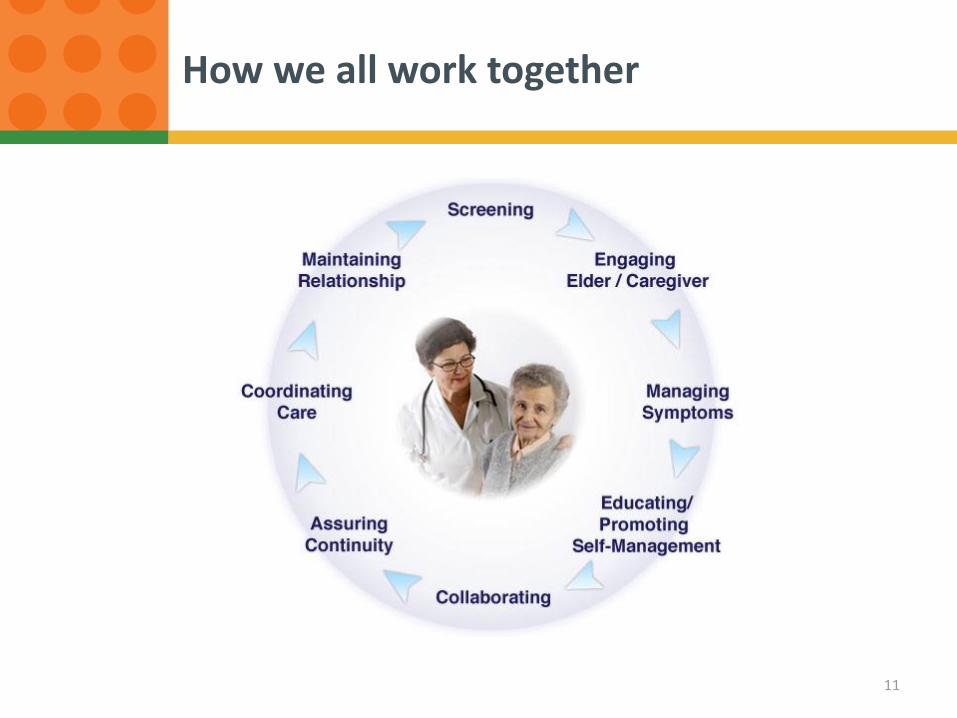
How we all work together
11
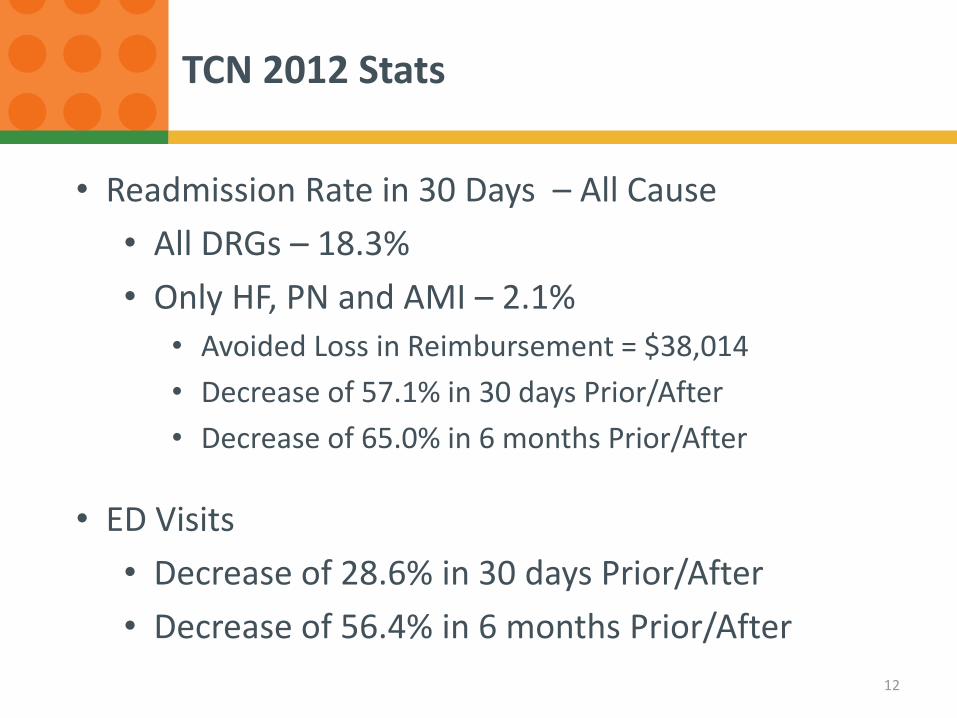
• Readmission Rate in 30 Days – All Cause
• All DRGs – 18.3%
• Only HF, PN and AMI – 2.1%
• Avoided Loss in Reimbursement = $38,014
• Decrease of 57.1% in 30 days Prior/After
• Decrease of 65.0% in 6 months Prior/After
• ED Visits
• Decrease of 28.6% in 30 days Prior/After
• Decrease of 56.4% in 6 months Prior/After
TCN 2012 Stats
12
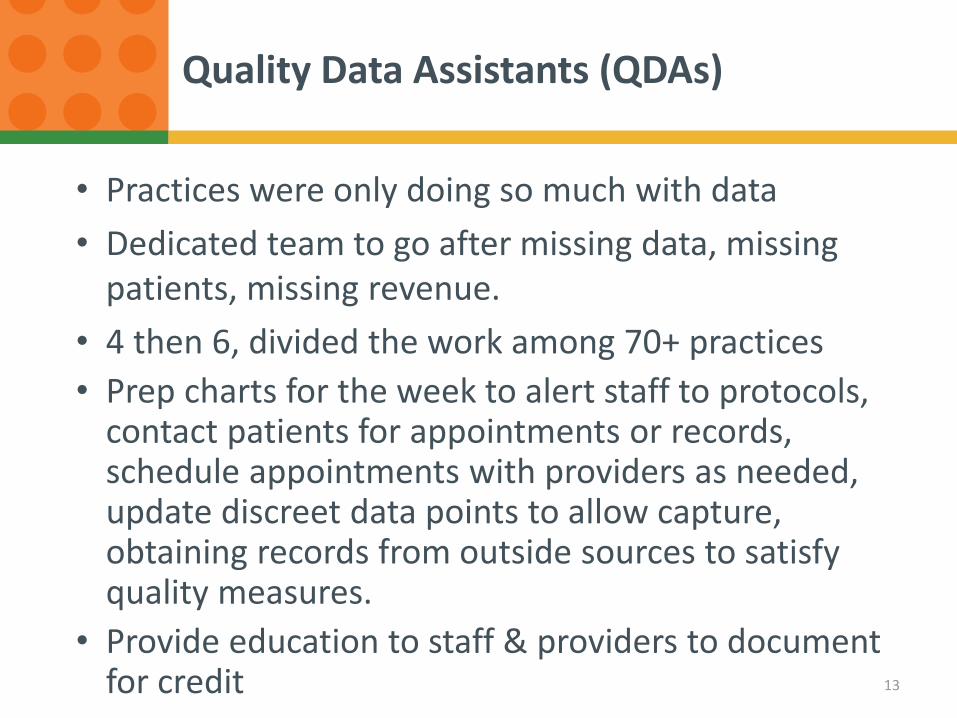
• Practices were only doing so much with data
• Dedicated team to go after missing data, missing patients, missing revenue.
• 4 then 6, divided the work among 70+ practices
• Prep charts for the week to alert staff to protocols, contact patients for appointments or records, schedule appointments with providers as needed, update discreet data points to allow capture, obtaining records from outside sources to satisfy quality measures.
• Provide education to staff & providers to document for credit
Quality Data Assistants (QDAs)
13
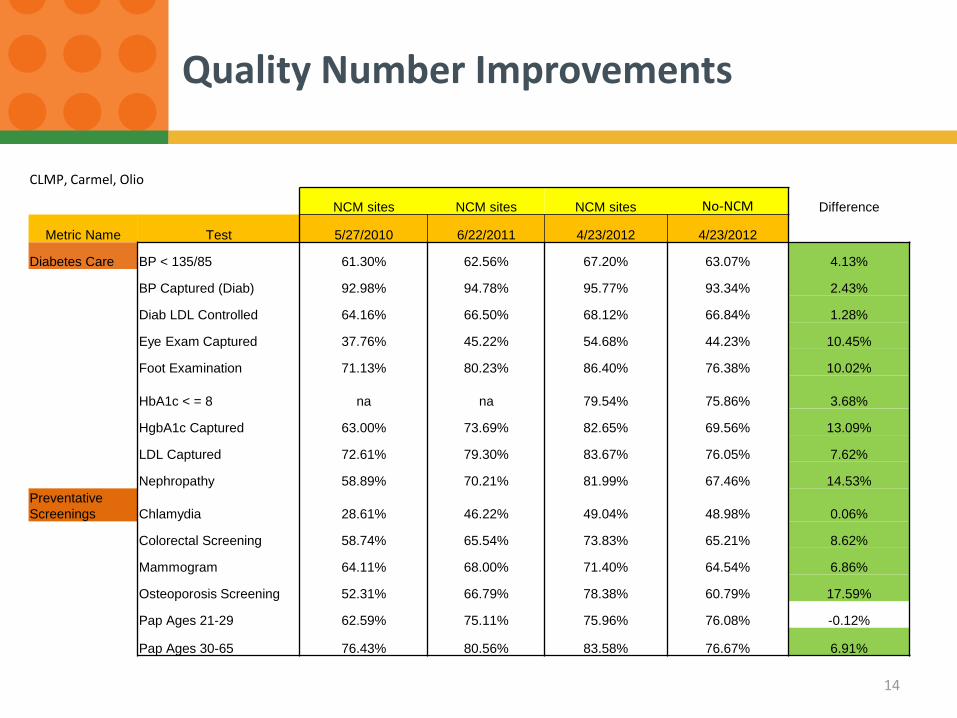
CLMP, Carmel, Olio
NCM sites NCM sites NCM sites No-NCM Difference
Metric Name Test 5/27/2010 6/22/2011 4/23/2012 4/23/2012
Diabetes Care BP < 135/85 61.30% 62.56% 67.20% 63.07% 4.13%
BP Captured (Diab) 92.98% 94.78% 95.77% 93.34% 2.43%
Diab LDL Controlled 64.16% 66.50% 68.12% 66.84% 1.28%
Eye Exam Captured 37.76% 45.22% 54.68% 44.23% 10.45%
Foot Examination 71.13% 80.23% 86.40% 76.38% 10.02%
HbA1c < = 8 na na 79.54% 75.86% 3.68%
HgbA1c Captured 63.00% 73.69% 82.65% 69.56% 13.09%
LDL Captured 72.61% 79.30% 83.67% 76.05% 7.62%
Nephropathy 58.89% 70.21% 81.99% 67.46% 14.53%
Preventative
Screenings Chlamydia 28.61% 46.22% 49.04% 48.98% 0.06%
Colorectal Screening 58.74% 65.54% 73.83% 65.21% 8.62%
Mammogram 64.11% 68.00% 71.40% 64.54% 6.86%
Osteoporosis Screening 52.31% 66.79% 78.38% 60.79% 17.59%
Pap Ages 21-29 62.59% 75.11% 75.96% 76.08% -0.12%
Pap Ages 30-65 76.43% 80.56% 83.58% 76.67% 6.91%
Quality Number Improvements
14
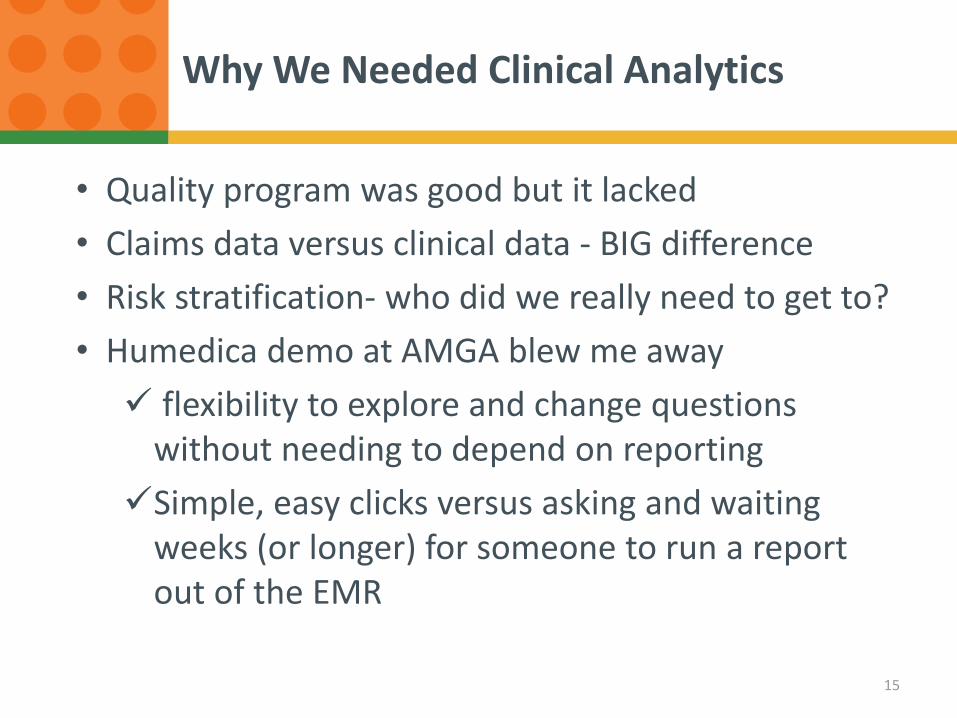
• Quality program was good but it lacked
• Claims data versus clinical data - BIG difference
• Risk stratification- who did we really need to get to?
• Humedica demo at AMGA blew me away
flexibility to explore and change questions without needing to depend on reporting
Simple, easy clicks versus asking and waiting weeks (or longer) for someone to run a report out of the EMR
Why We Needed Clinical Analytics
15
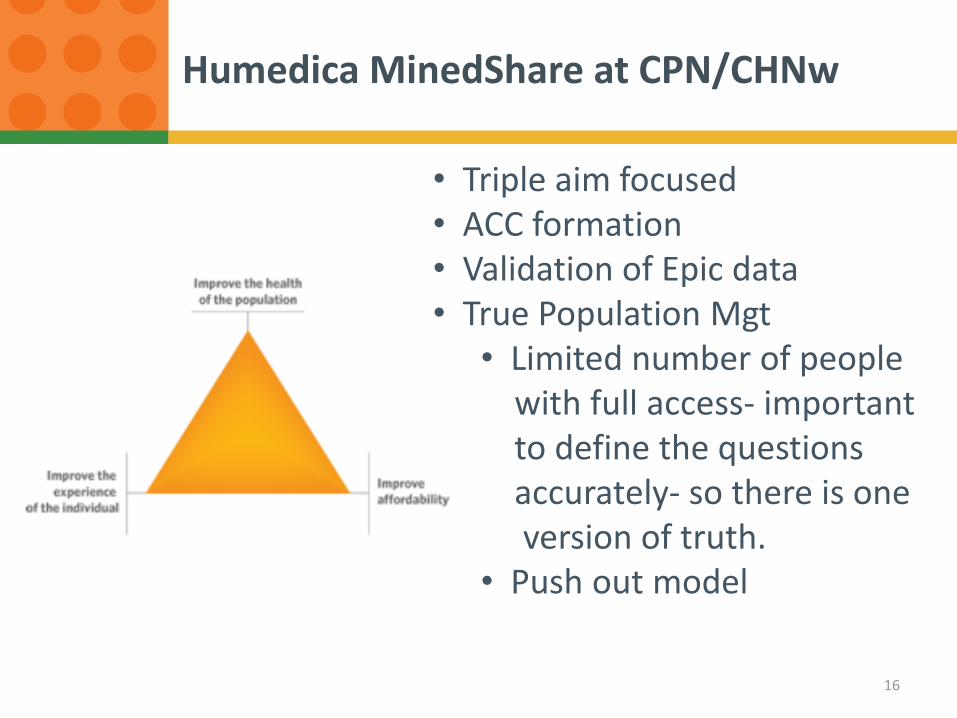
Humedica MinedShare at CPN/CHNw
16
• Triple aim focused • ACC formation • Validation of Epic data • True Population Mgt
• Limited number of people with full access- important to define the questions accurately- so there is one version of truth. • Push out model
17
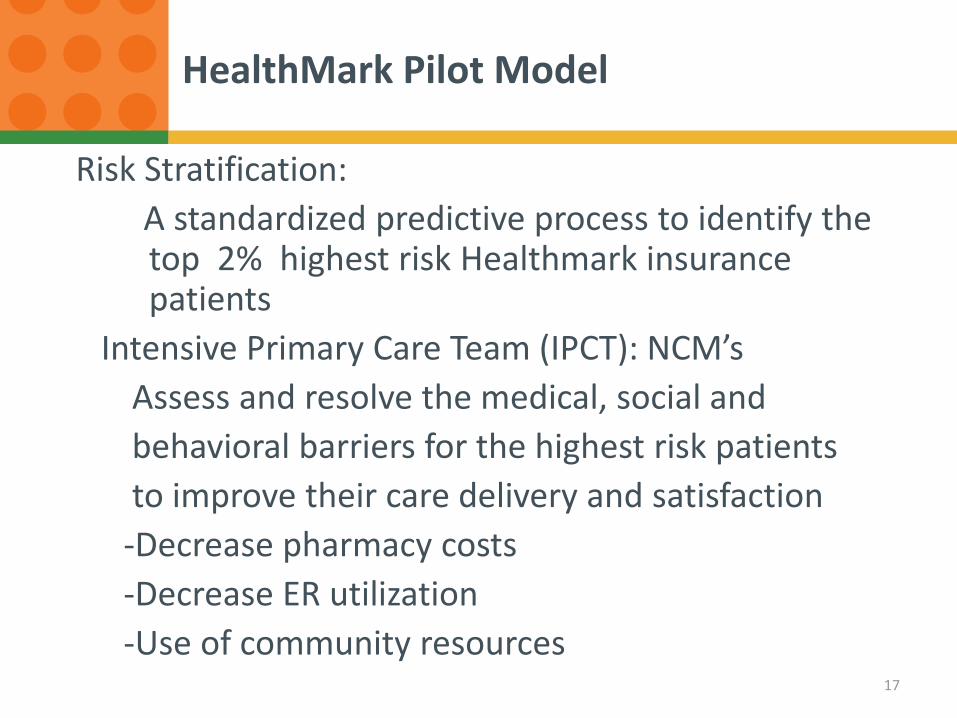
HealthMark Pilot Model
Risk Stratification:
A standardized predictive process to identify the top 2% highest risk Healthmark insurance patients
Intensive Primary Care Team (IPCT): NCM’s
Assess and resolve the medical, social and
behavioral barriers for the highest risk patients
to improve their care delivery and satisfaction
-Decrease pharmacy costs
-Decrease ER utilization
-Use of community resources
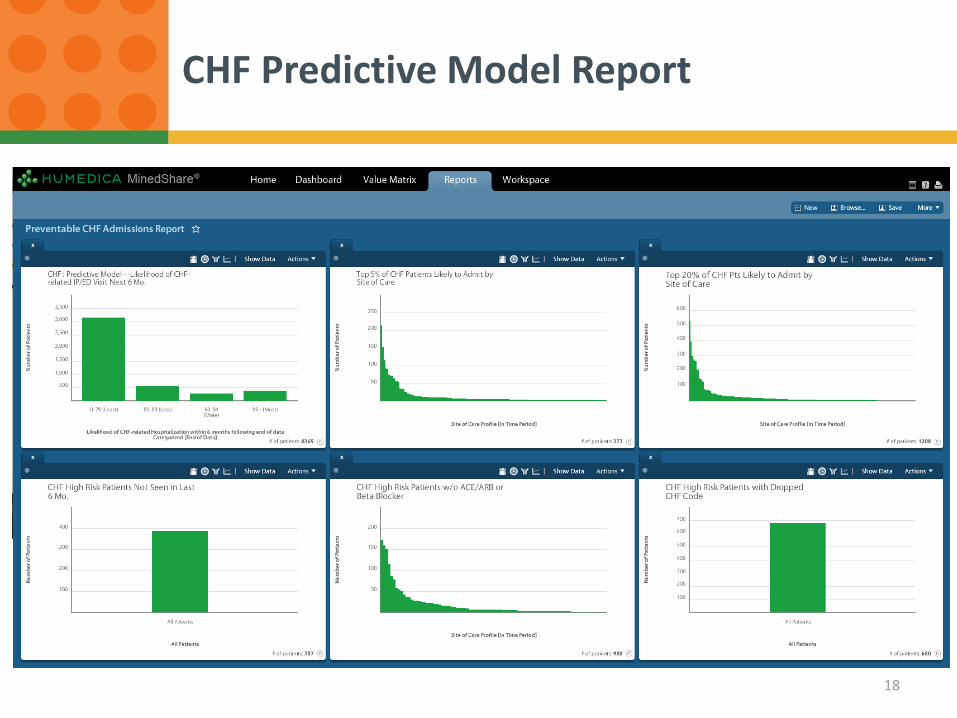
CHF Predictive Model Report
18
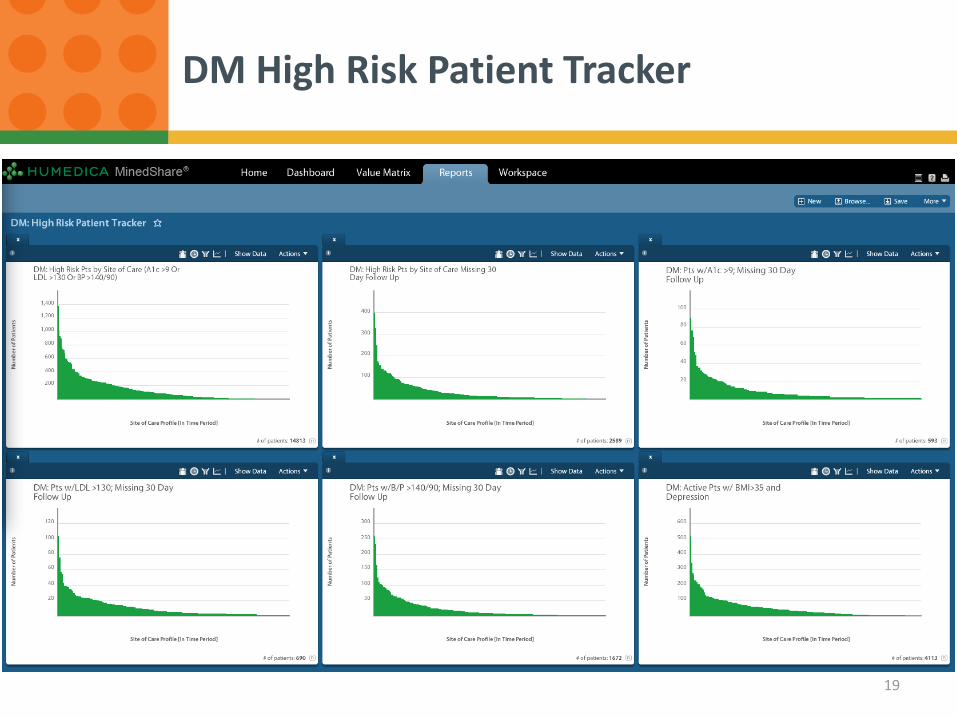
DM High Risk Patient Tracker
19
• Without the kind of data Mindshare can provide, you’re only getting part of the picture
Uncoded patients (way more than anticipated)
ER utilizers- $$
Cause and effect answers
Comparisons… how good or how bad
Can make physicians believers
Dedicated staff to pursue what is uncovered
Now to bigger populations
Lessons learned so far
20
Converting Data into Value in Care Coordination Efforts
Alan Krumholz MD, FAAP, DFACMQ
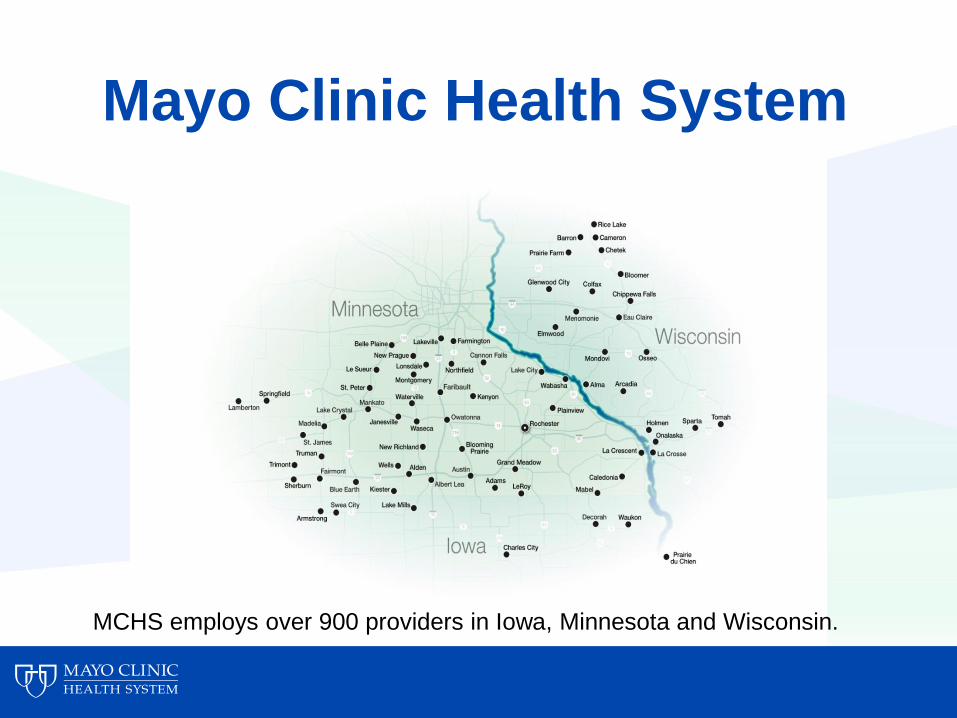
Mayo Clinic Health System
MCHS employs over 900 providers in Iowa, Minnesota and Wisconsin.
One System – Four Regions
• Moving from volume to value, but different approaches to contracting (commercial ACOs, employer contracts, no contracts)
• Focused on proactive patient management, but varied priorities and resourcing (PCMH, disease-specific outreach, etc.)
• Previously limited view of population and disparate access to claims data, but all looking for more sophisticated clinical analytics
©2011 MFMER | slide-23
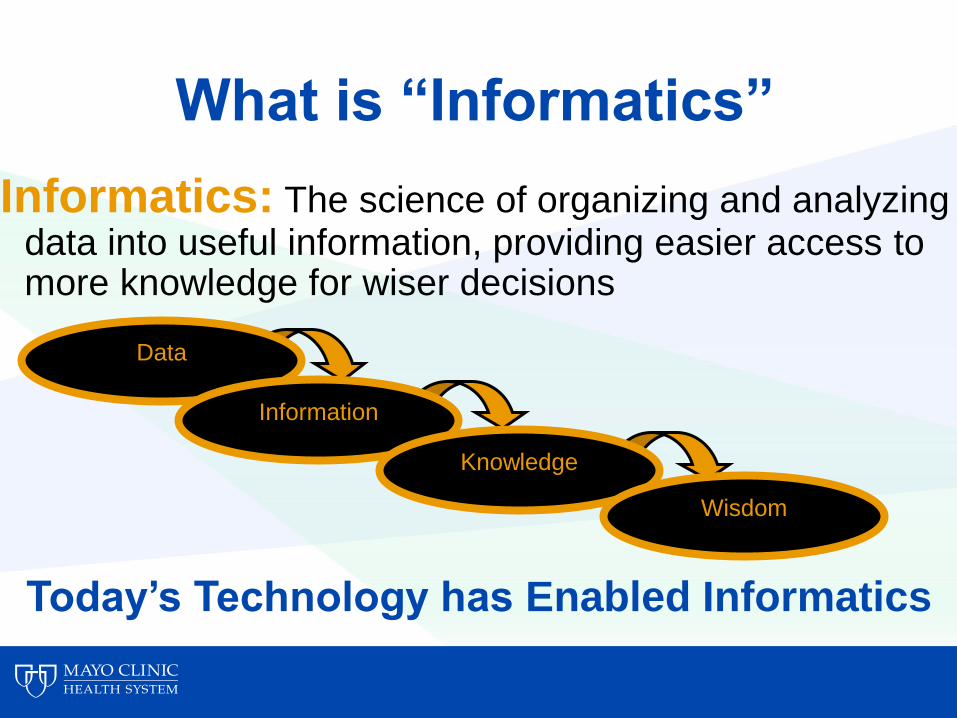
What is “Informatics”
Informatics: The science of organizing and analyzing data into useful information, providing easier access to more knowledge for wiser decisions
Data
Information
Knowledge
Wisdom
Today’s Technology has Enabled Informatics
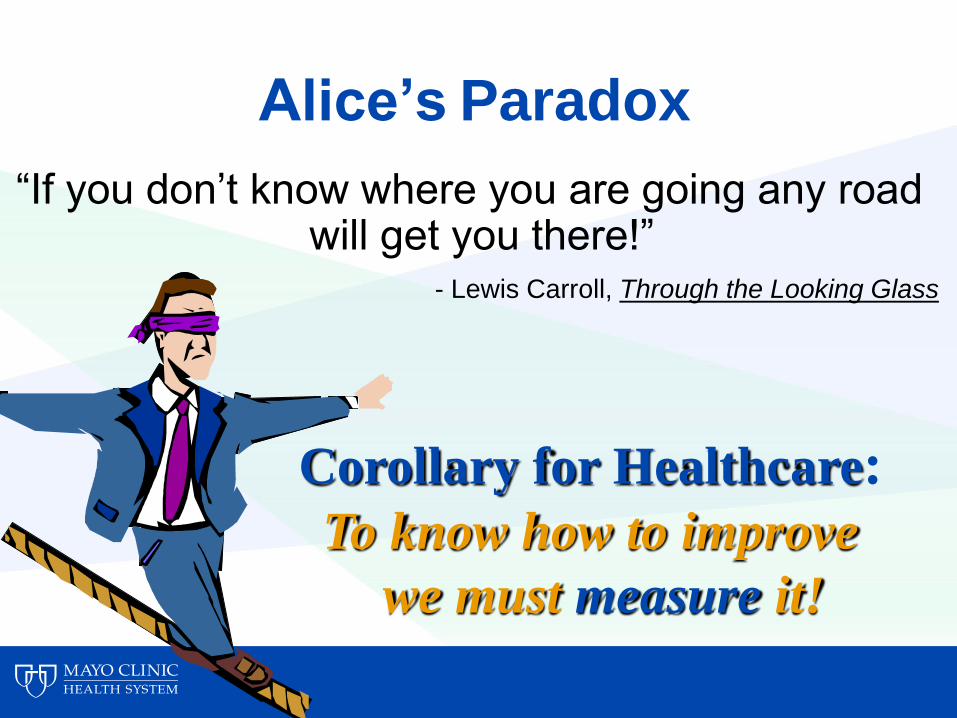
Corollary for Healthcare: To know how to improve
we must measure it!
Alice’s Paradox
“If you don’t know where you are going any road will get you there!”
- Lewis Carroll, Through the Looking Glass
Humedica MinedShare®
• Implemented in October 2012 to bring together clinical and cost data
• Governance and delivery focused on:
1. Education
• Weekly region-specific training sessions to analyze and discuss data trends
2. Adoption
• Formal request/review process that asks:
“What are you going to DO with the data?”
©2011 MFMER | slide-26

27
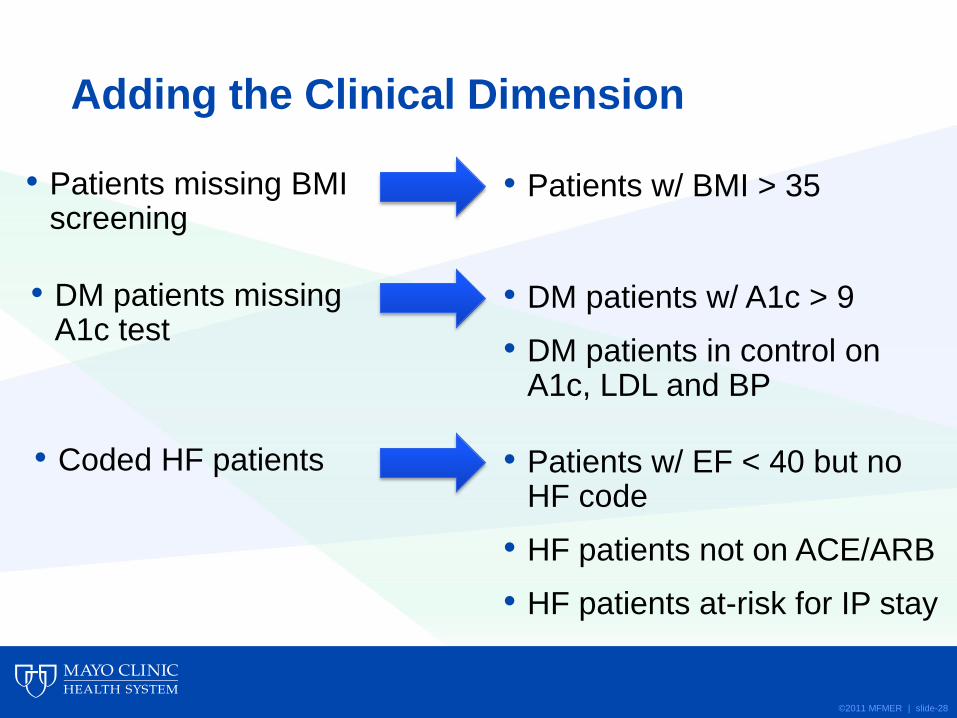
Adding the Clinical Dimension
• Patients missing BMI screening
©2011 MFMER | slide-28
• Patients w/ BMI > 35
• DM patients missing A1c test
• DM patients w/ A1c > 9
• DM patients in control on A1c, LDL and BP
• Coded HF patients
• Patients w/ EF < 40 but no HF code
• HF patients not on ACE/ARB
• HF patients at-risk for IP stay
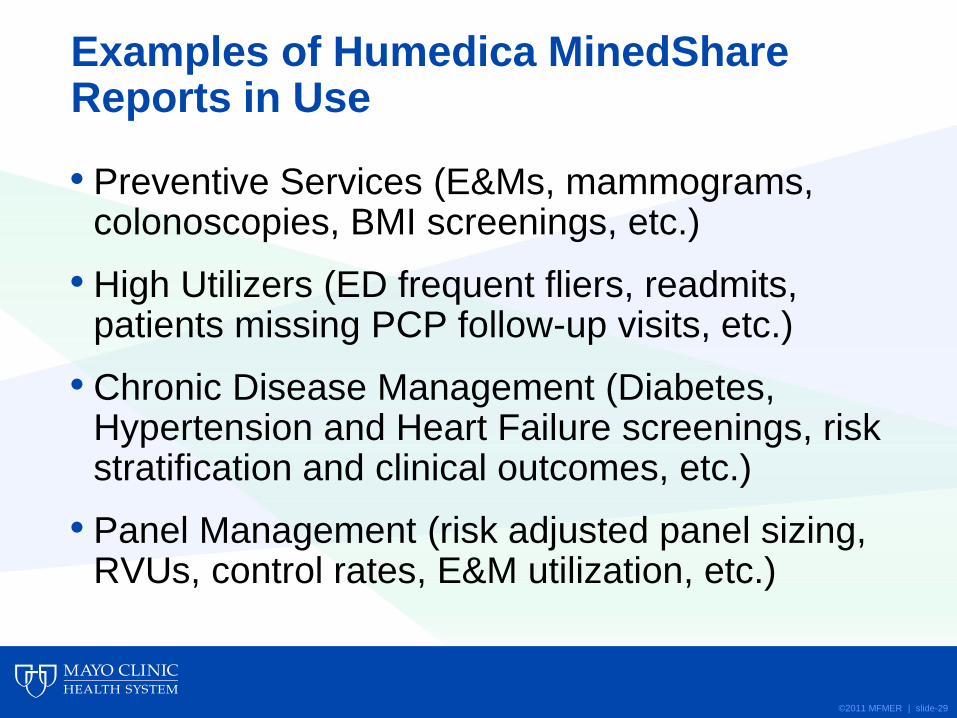
Examples of Humedica MinedShare Reports in Use
• Preventive Services (E&Ms, mammograms, colonoscopies, BMI screenings, etc.)
• High Utilizers (ED frequent fliers, readmits, patients missing PCP follow-up visits, etc.)
• Chronic Disease Management (Diabetes, Hypertension and Heart Failure screenings, risk stratification and clinical outcomes, etc.)
• Panel Management (risk adjusted panel sizing, RVUs, control rates, E&M utilization, etc.)
©2011 MFMER | slide-29
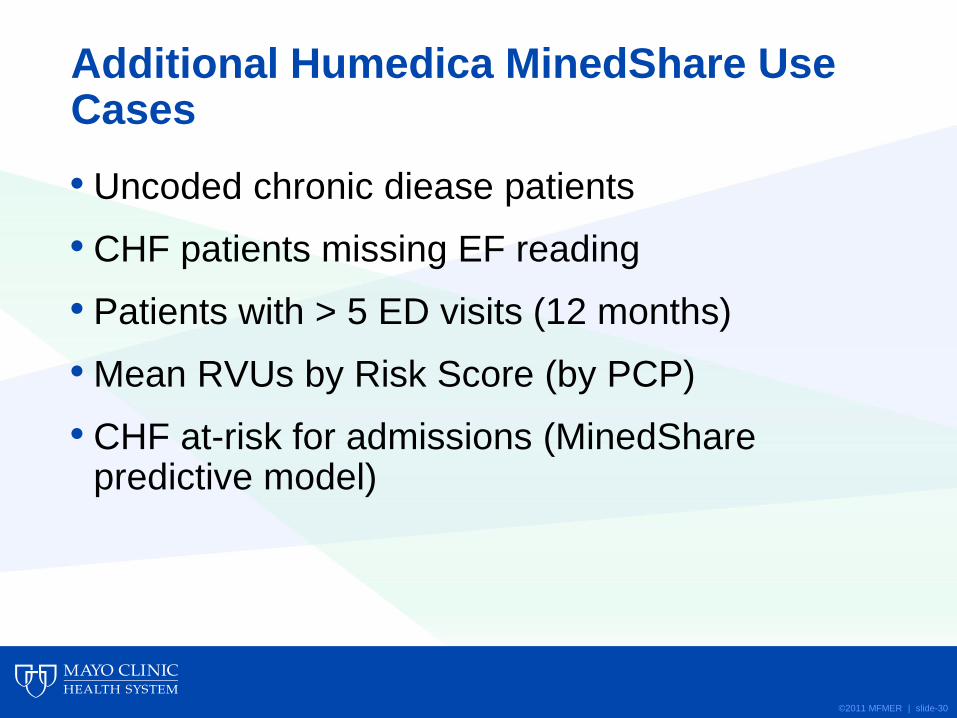
Additional Humedica MinedShare Use Cases
• Uncoded chronic diease patients
• CHF patients missing EF reading
• Patients with > 5 ED visits (12 months)
• Mean RVUs by Risk Score (by PCP)
• CHF at-risk for admissions (MinedShare predictive model)
©2011 MFMER | slide-30
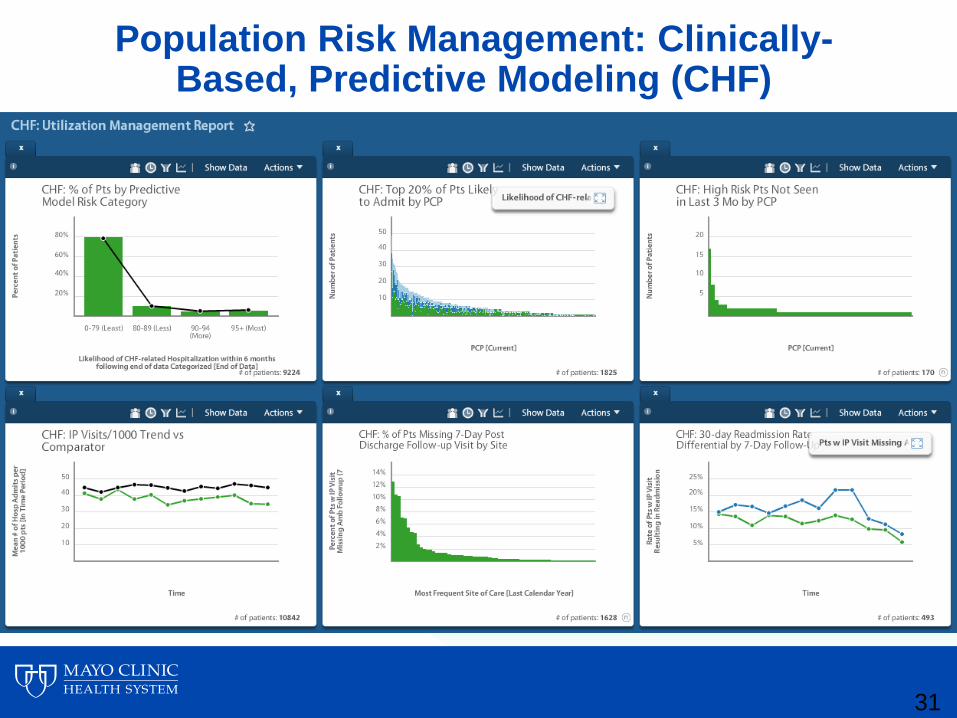
Population Risk Management: Clinically-Based, Predictive Modeling (CHF)
31
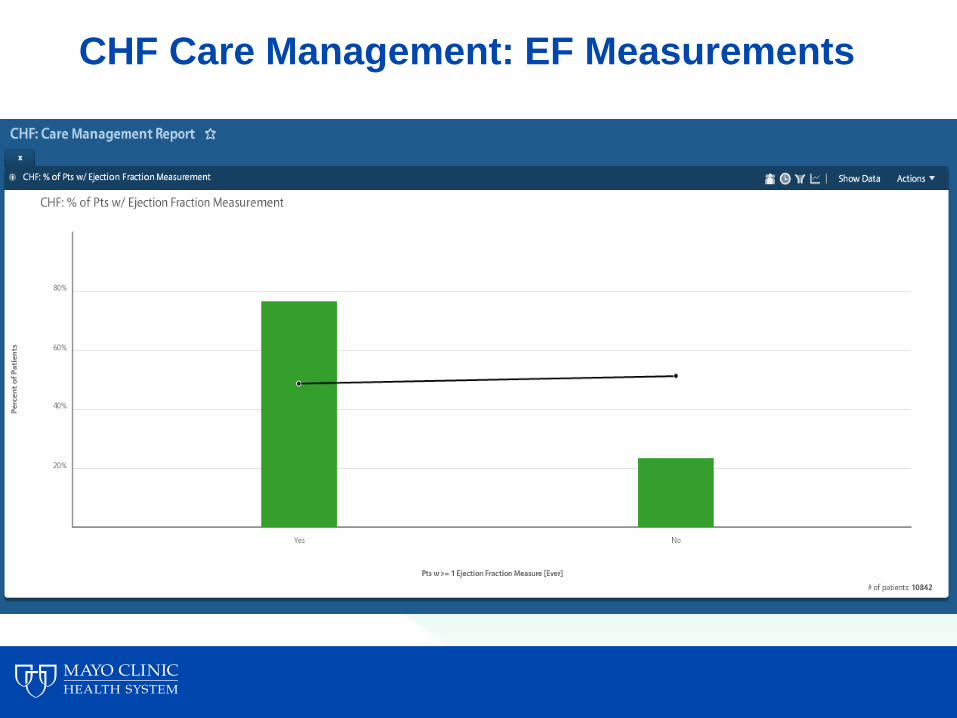
CHF Care Management: EF Measurements
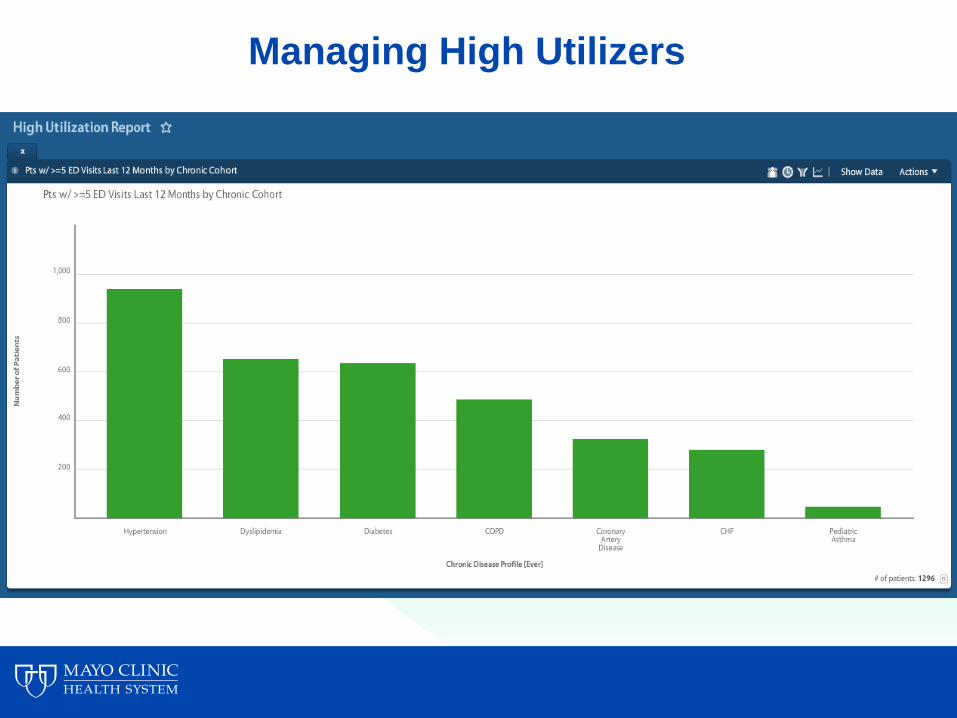
Managing High Utilizers
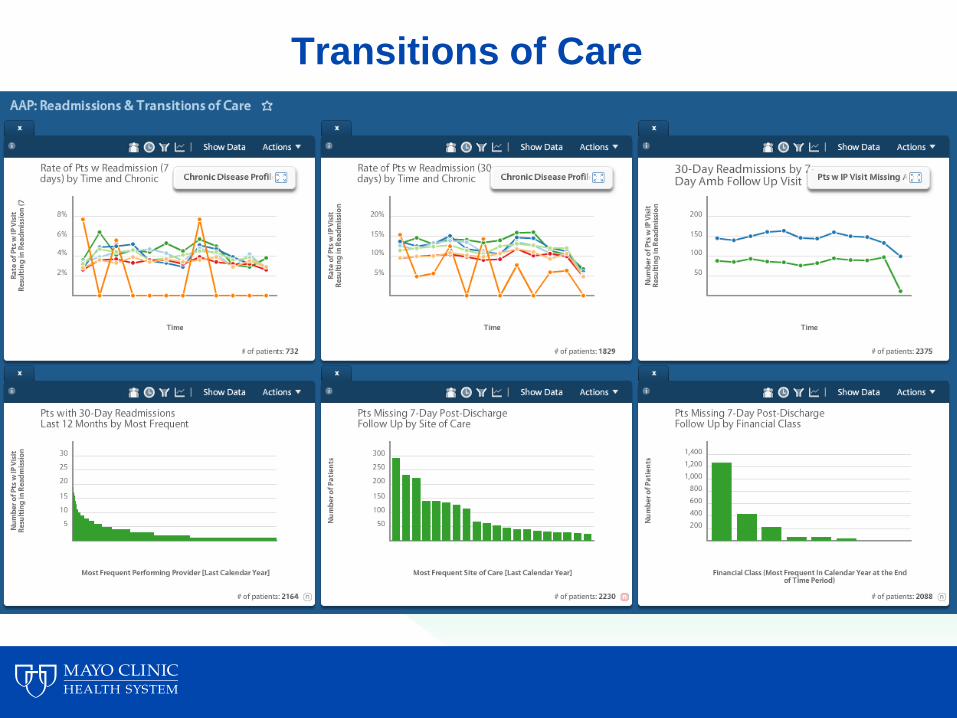
Transitions of Care
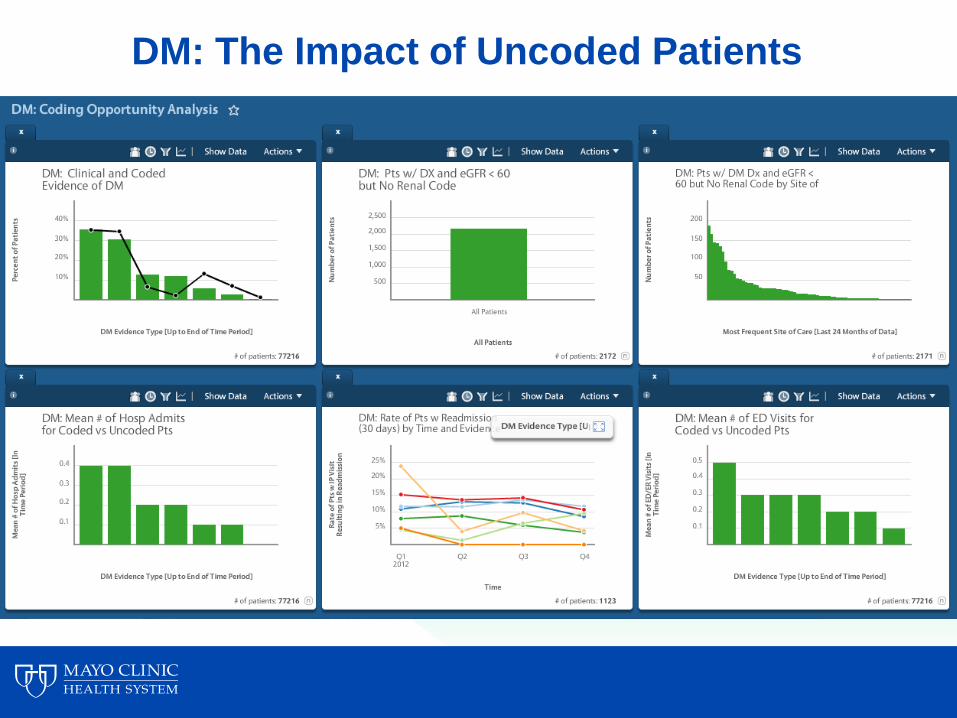
DM: The Impact of Uncoded Patients
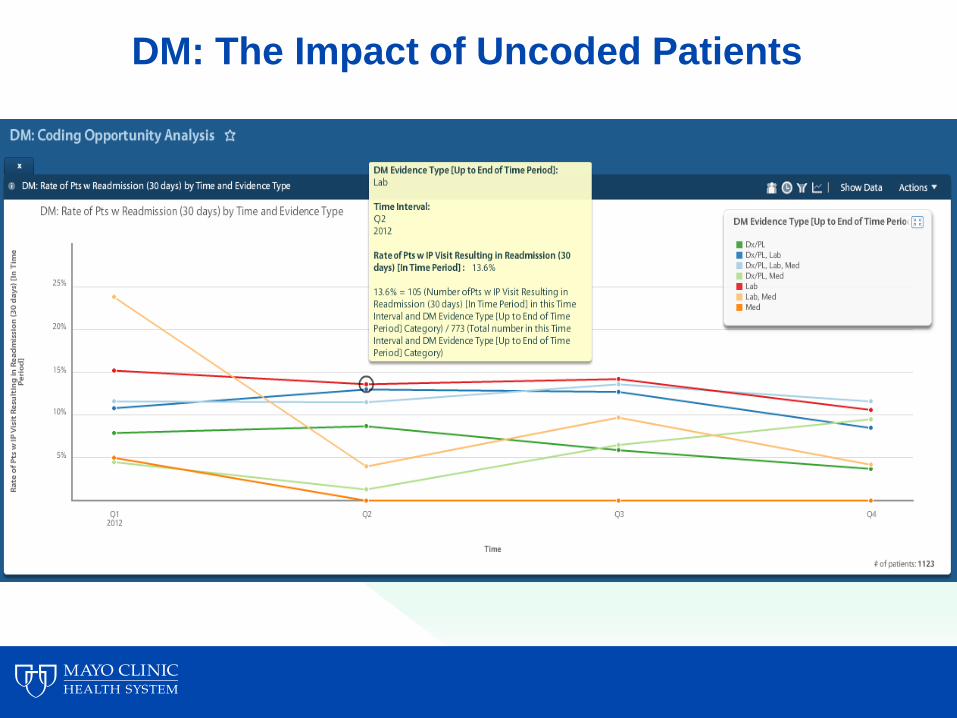
DM: The Impact of Uncoded Patients
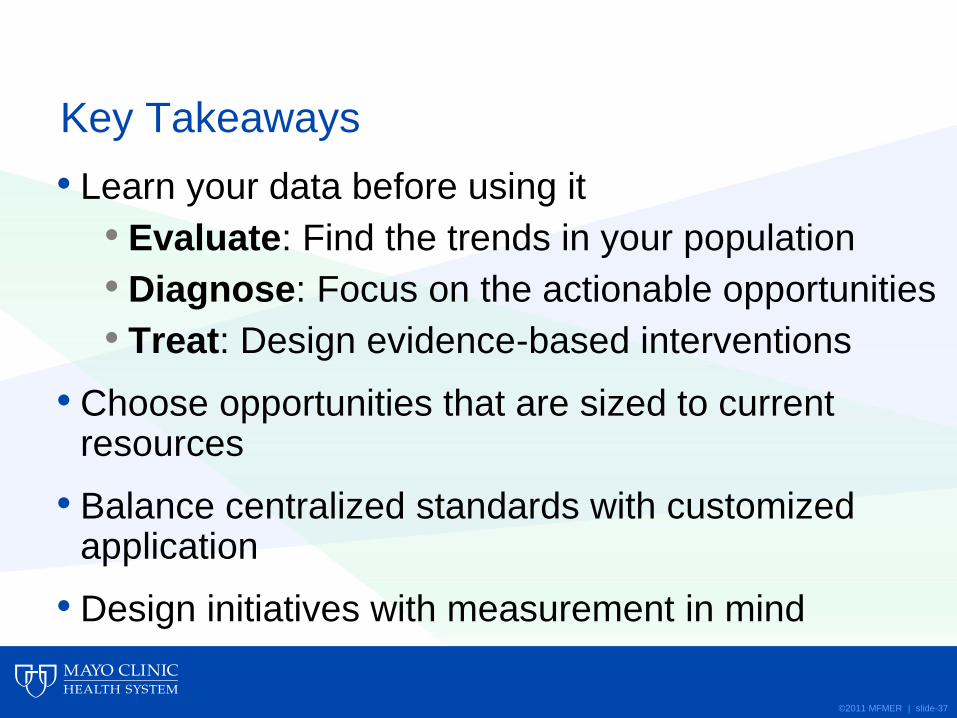
Key Takeaways
• Learn your data before using it
• Evaluate: Find the trends in your population
• Diagnose: Focus on the actionable opportunities
• Treat: Design evidence-based interventions
• Choose opportunities that are sized to current resources
• Balance centralized standards with customized application
• Design initiatives with measurement in mind
©2011 MFMER | slide-37
Clinical Analytics to Optimize Care, Improve Outcomes
AMGA Annual Conference March 15, 2013
Brittany Crye, MHA Jonathan Hines, MD
Wilmington Health
• 147 Providers
• 20 Locations
• Multispecialty group
WILMINGTON HEALTH
MISSION Wilmington Health is committed to using collaborative, evidence-based medicine in
providing the highest quality of care to the patients we serve.
VISION We aspire to be the most trusted partner in health care. We pledge to
transform the delivery system. We will continually develop collaborative and
innovative solutions that demonstrate quality, reduce the cost of care and
improve the patient experience.
GROWTH Grow our programs, services, and locations to meet the needs of and create value for our patients and community
CONTINUOUS IMPROVEMENT Foster a culture that embraces continuous improvement, learning, and willingness to change to benefit the patient, employee, and organization
PATIENT SATISFACTION Develop a patient-centric culture, ensuring that we surpass our patients’ expectations of their care and experiences
EMPLOYER OF CHOICE Commit to the professional development and growth of all team members and cultivate a sense of ownership and purpose throughout the organization
COMMUNITY COMMITMENT Be an active participant in building the communities we serve
FINANCIAL STRENGTH Strengthen the economic foundation of the organization to further our mission and vision
QUALITY Ensure and demonstrate the highest quality of care in all endeavors throughout the organization
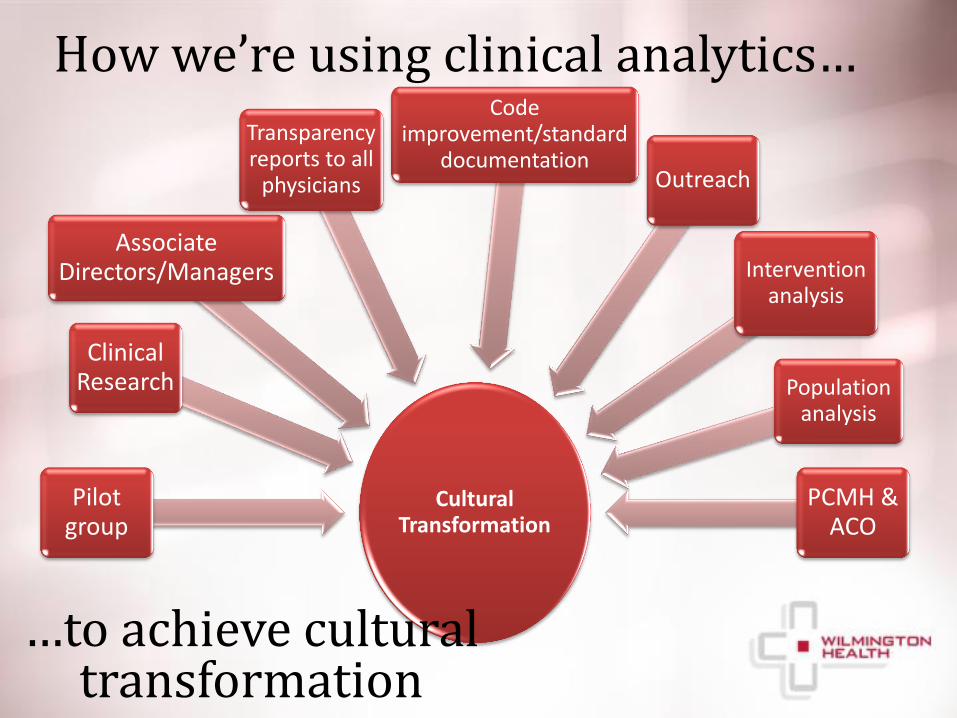
Cultural Transformation
Pilot group
Clinical Research
Associate Directors/Managers
Transparency reports to all
physicians
Code improvement/standard
documentation Outreach
Intervention analysis
Population analysis
PCMH & ACO
How we’re using clinical analytics…
…to achieve cultural transformation
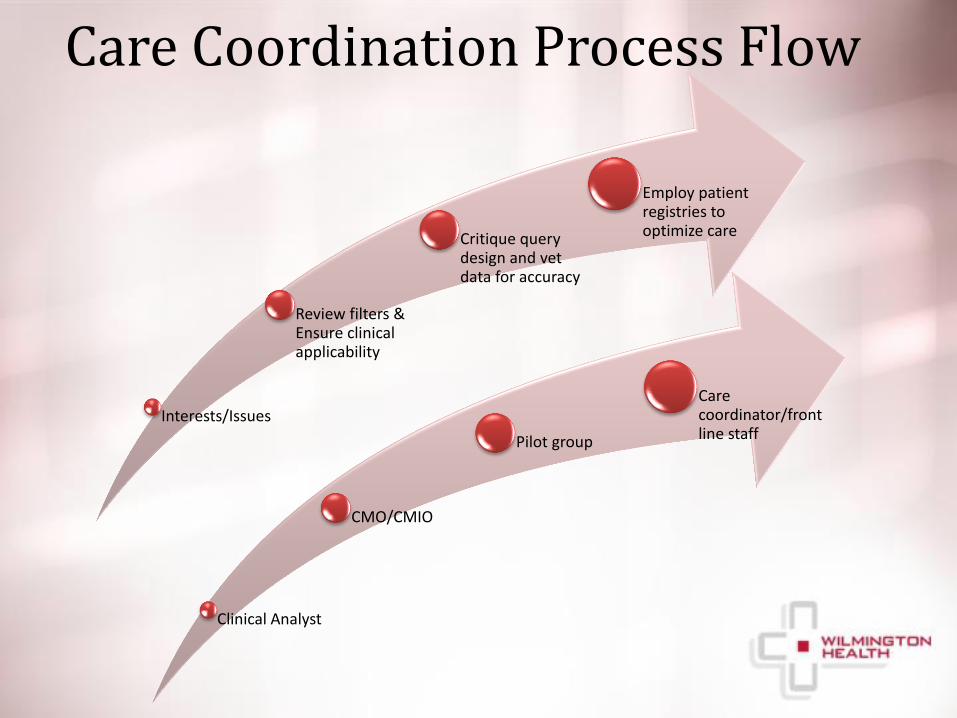
Care Coordination Process Flow
Clinical Analyst
CMO/CMIO
Pilot group
Care coordinator/front line staff
Interests/Issues
Review filters & Ensure clinical applicability
Critique query design and vet data for accuracy
Employ patient registries to optimize care
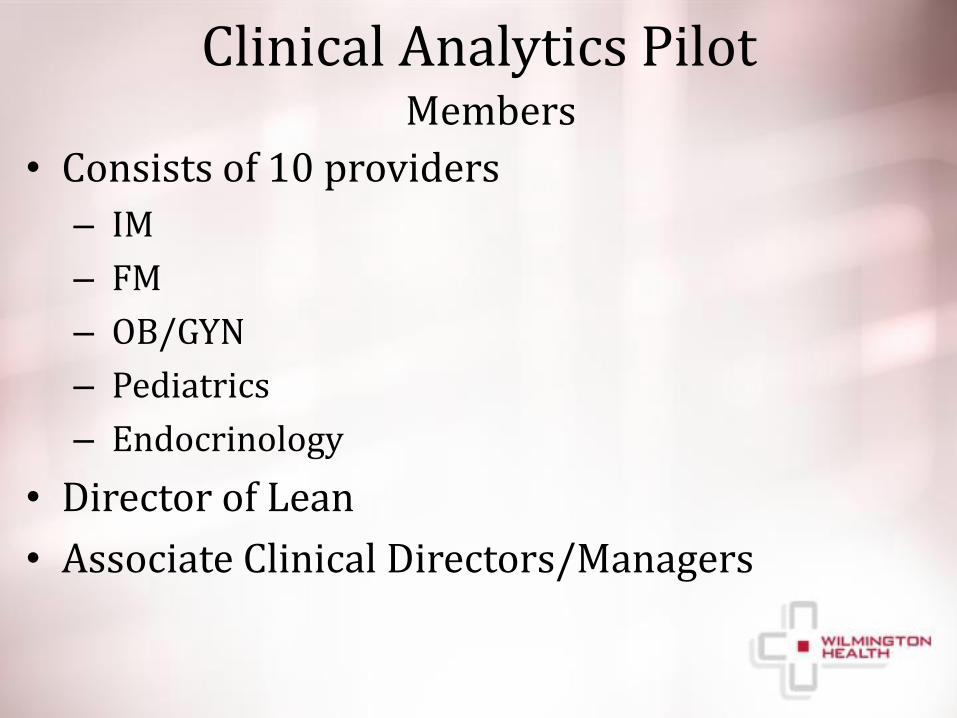
Clinical Analytics Pilot
• Consists of 10 providers
– IM
– FM
– OB/GYN
– Pediatrics
– Endocrinology
• Director of Lean
• Associate Clinical Directors/Managers
Members
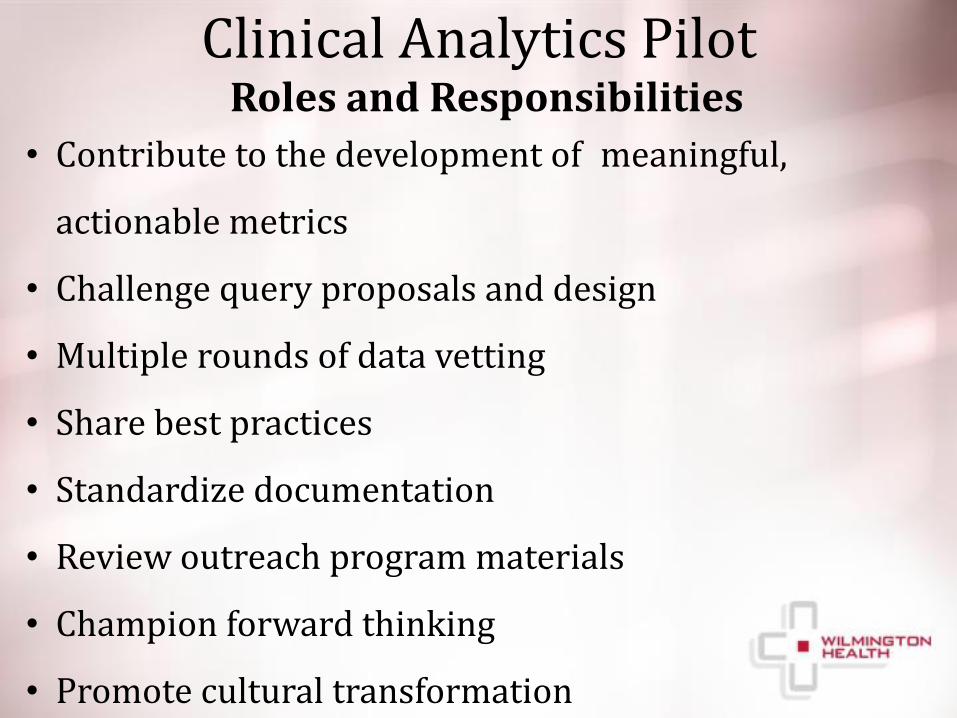
Clinical Analytics Pilot Roles and Responsibilities
• Contribute to the development of meaningful,
actionable metrics
• Challenge query proposals and design
• Multiple rounds of data vetting
• Share best practices
• Standardize documentation
• Review outreach program materials
• Champion forward thinking
• Promote cultural transformation
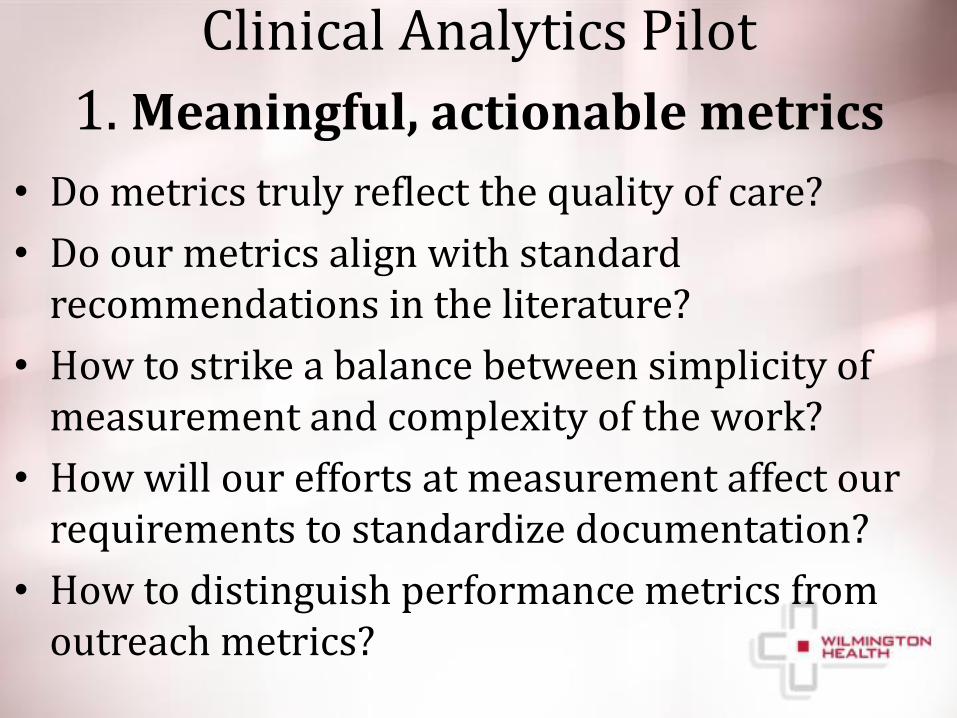
1. Meaningful, actionable metrics
• Do metrics truly reflect the quality of care?
• Do our metrics align with standard recommendations in the literature?
• How to strike a balance between simplicity of measurement and complexity of the work?
• How will our efforts at measurement affect our requirements to standardize documentation?
• How to distinguish performance metrics from outreach metrics?
Clinical Analytics Pilot
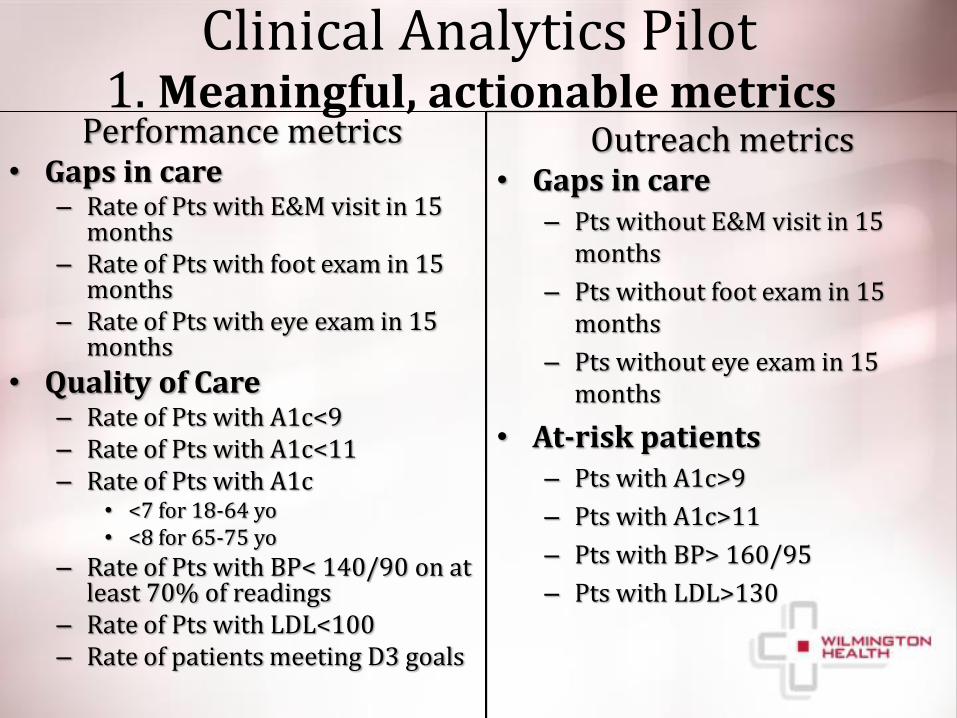
Outreach metrics • Gaps in care
– Pts without E&M visit in 15 months
– Pts without foot exam in 15 months
– Pts without eye exam in 15 months
• At-risk patients – Pts with A1c>9
– Pts with A1c>11
– Pts with BP> 160/95
– Pts with LDL>130
Performance metrics • Gaps in care
– Rate of Pts with E&M visit in 15 months
– Rate of Pts with foot exam in 15 months
– Rate of Pts with eye exam in 15 months
• Quality of Care – Rate of Pts with A1c<9 – Rate of Pts with A1c<11 – Rate of Pts with A1c
• <7 for 18-64 yo • <8 for 65-75 yo
– Rate of Pts with BP< 140/90 on at least 70% of readings
– Rate of Pts with LDL<100 – Rate of patients meeting D3 goals
1. Meaningful, actionable metrics Clinical Analytics Pilot
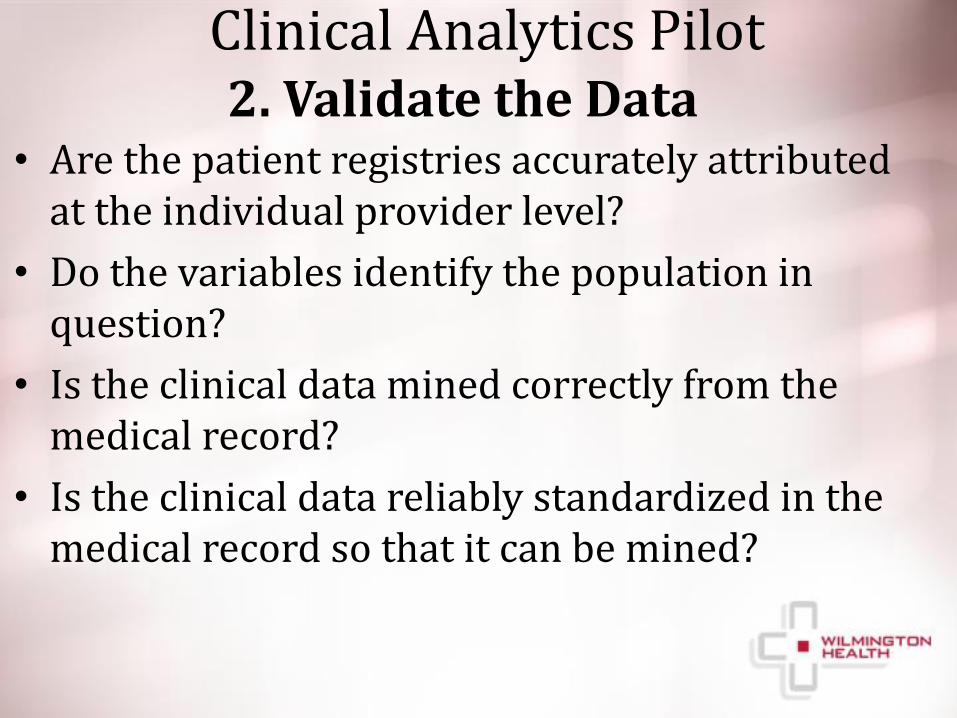
2. Validate the Data • Are the patient registries accurately attributed
at the individual provider level?
• Do the variables identify the population in question?
• Is the clinical data mined correctly from the medical record?
• Is the clinical data reliably standardized in the medical record so that it can be mined?
Clinical Analytics Pilot
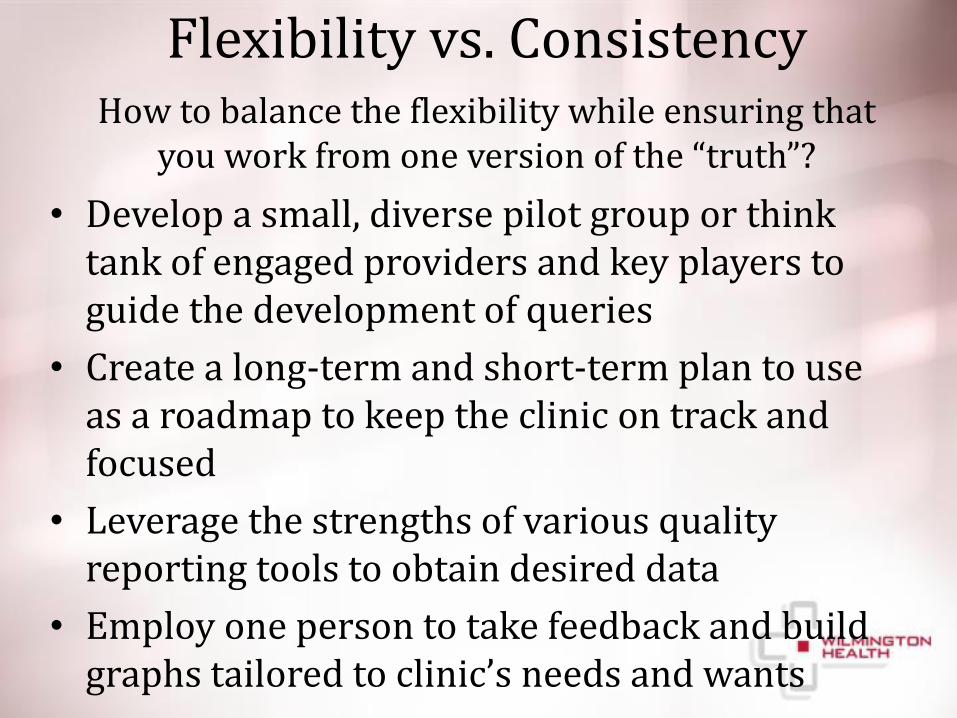
Flexibility vs. Consistency
• Develop a small, diverse pilot group or think tank of engaged providers and key players to guide the development of queries
• Create a long-term and short-term plan to use as a roadmap to keep the clinic on track and focused
• Leverage the strengths of various quality reporting tools to obtain desired data
• Employ one person to take feedback and build graphs tailored to clinic’s needs and wants
How to balance the flexibility while ensuring that you work from one version of the “truth”?
Control & Governance
• Full privileges
– Clinical Analyst
– CMO/CMIO
– COO
– Sr. Director of Lean
– Associate Director of Primary Care-PCMH
• Read-only
– Pilot
Quality Demonstration Project
• Systematic approach to organizational quality initiatives
• Design for multi-step “experiment” that will allow us to examine which components of our data extraction tools have the greatest impact on the quality and completeness of care given at WH.
• Utilizes Humedica MinedShare, CINA, and Allscripts reporting module
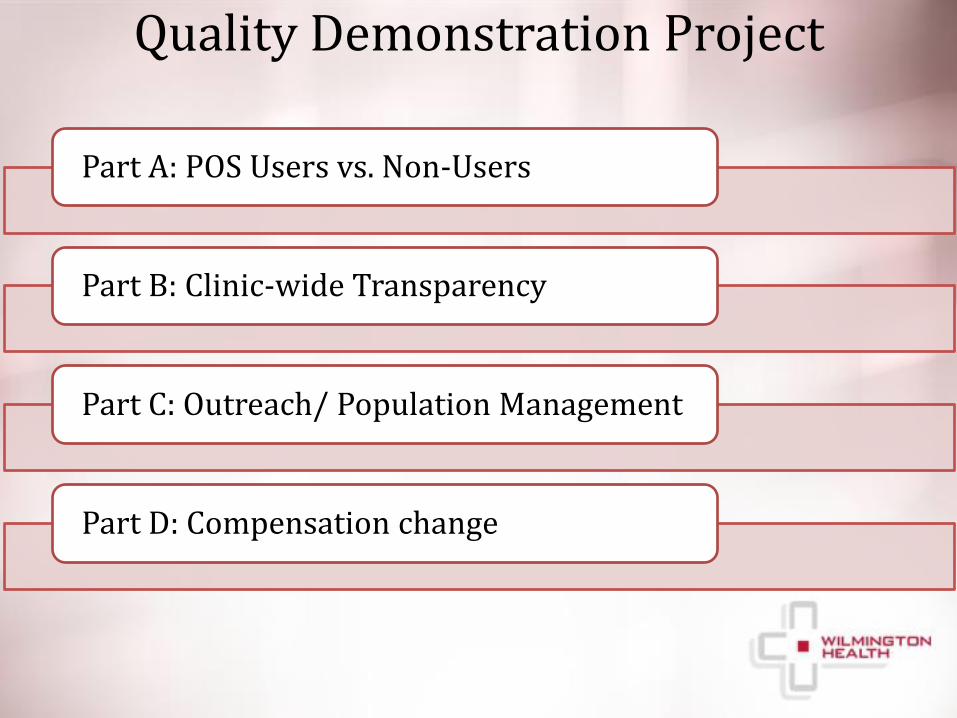
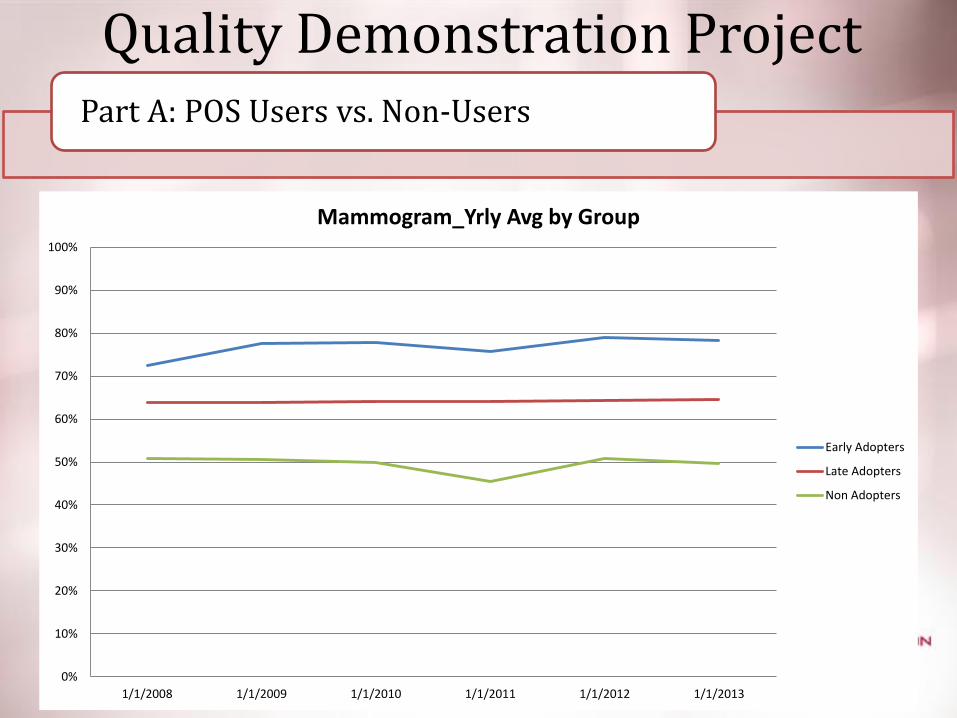
Part A: POS Users vs. Non-Users
Part B: Clinic-wide Transparency
Part C: Outreach/ Population Management
Part D: Compensation change
Quality Demonstration Project
Quality Demonstration Project
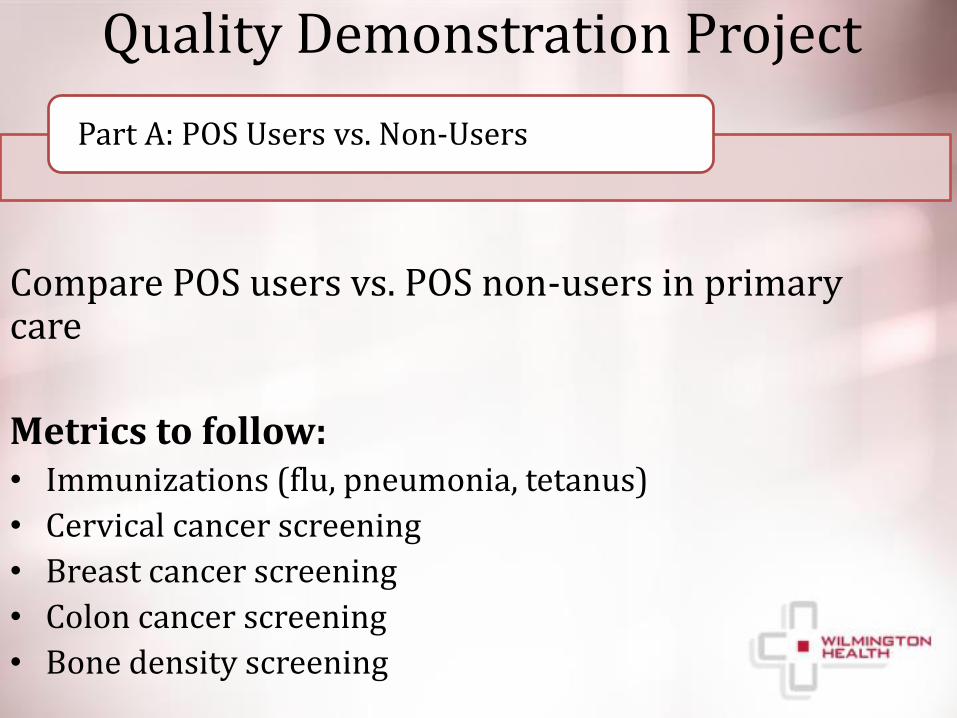
Compare POS users vs. POS non-users in primary care
Metrics to follow: • Immunizations (flu, pneumonia, tetanus)
• Cervical cancer screening
• Breast cancer screening
• Colon cancer screening
• Bone density screening
Part A: POS Users vs. Non-Users
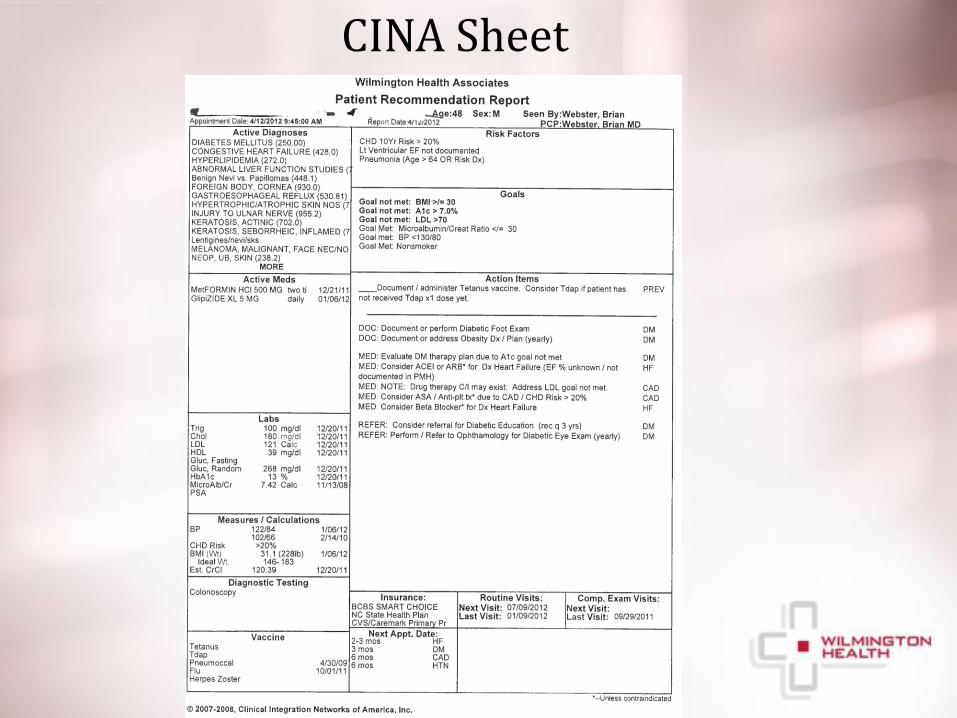
CINA Sheet
0%
10%
20%
30%
40%
50%
60%
70%
80%
90%
100%
1/1/2008 1/1/2009 1/1/2010 1/1/2011 1/1/2012 1/1/2013
Mammogram_Yrly Avg by Group
Early Adopters
Late Adopters
Non Adopters
Part A: POS Users vs. Non-Users
Quality Demonstration Project
Quality Demonstration Project
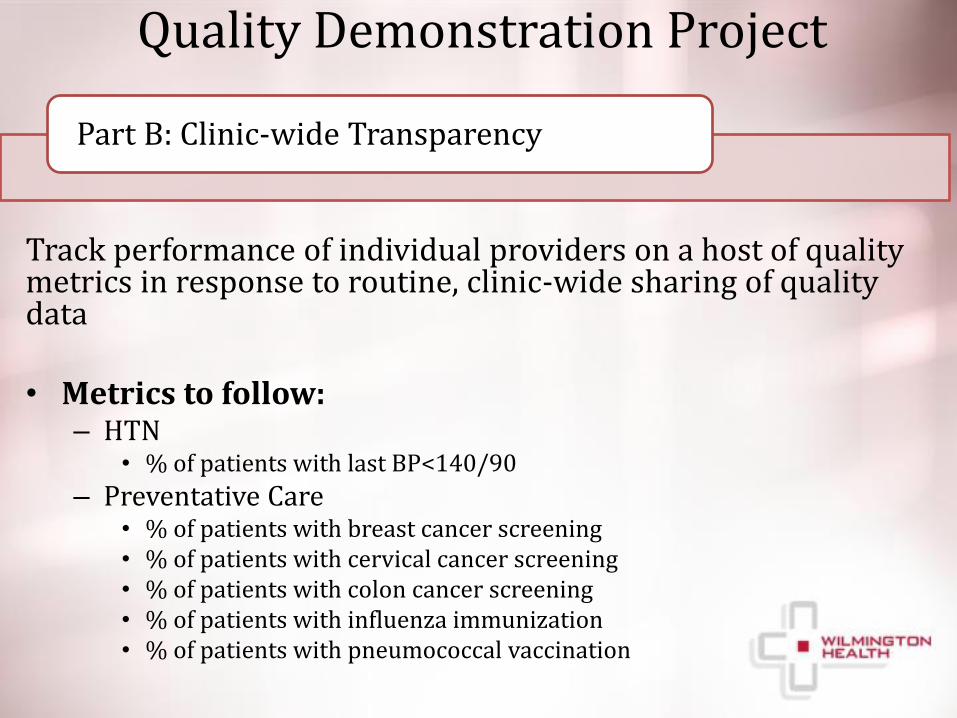
Track performance of individual providers on a host of quality metrics in response to routine, clinic-wide sharing of quality data • Metrics to follow:
– HTN • % of patients with last BP<140/90
– Preventative Care • % of patients with breast cancer screening • % of patients with cervical cancer screening • % of patients with colon cancer screening • % of patients with influenza immunization • % of patients with pneumococcal vaccination
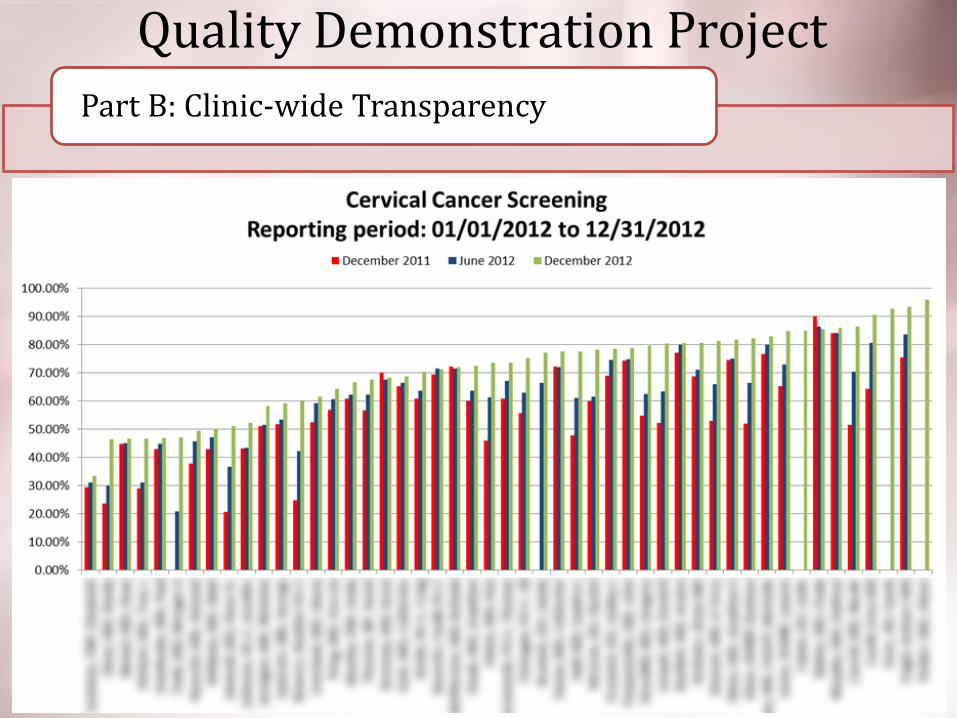
Part B: Clinic-wide Transparency
Quality Demonstration Project
Part B: Clinic-wide Transparency
Quality Demonstration Project
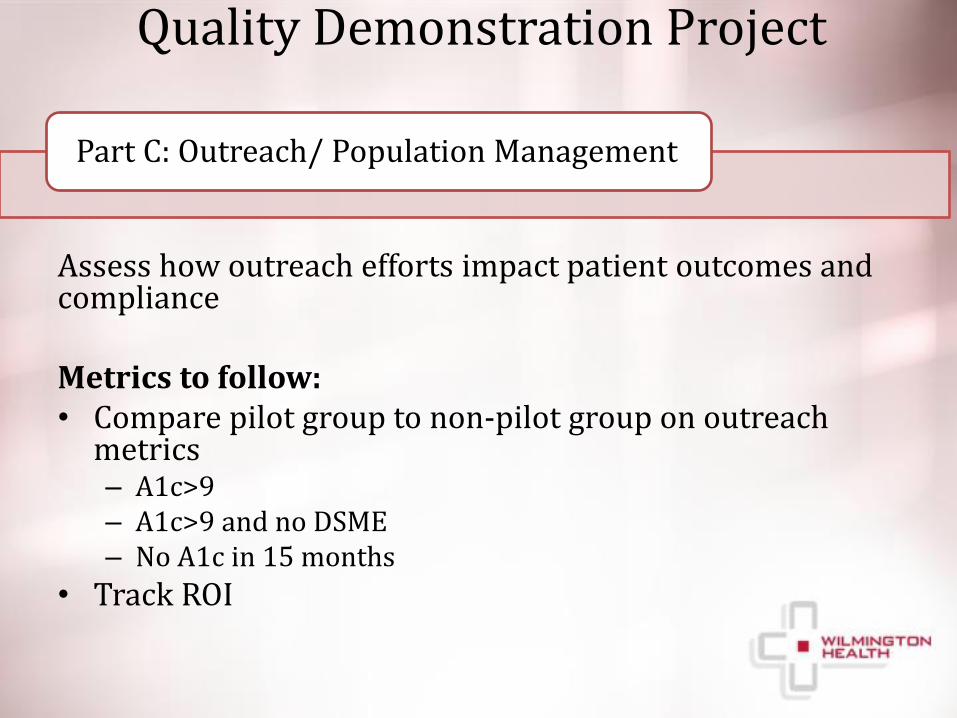
Assess how outreach efforts impact patient outcomes and compliance Metrics to follow: • Compare pilot group to non-pilot group on outreach
metrics – A1c>9 – A1c>9 and no DSME – No A1c in 15 months
• Track ROI
Part C: Outreach/ Population Management
0.00%
10.00%
20.00%
30.00%
40.00%
50.00%
60.00%
70.00%
80.00%
90.00%
100.00%
Jan 2011-March 2012 April 2011-June 2012 July 2011-September 2012 October 2011-December2012
% o
f p
atie
nts
Time
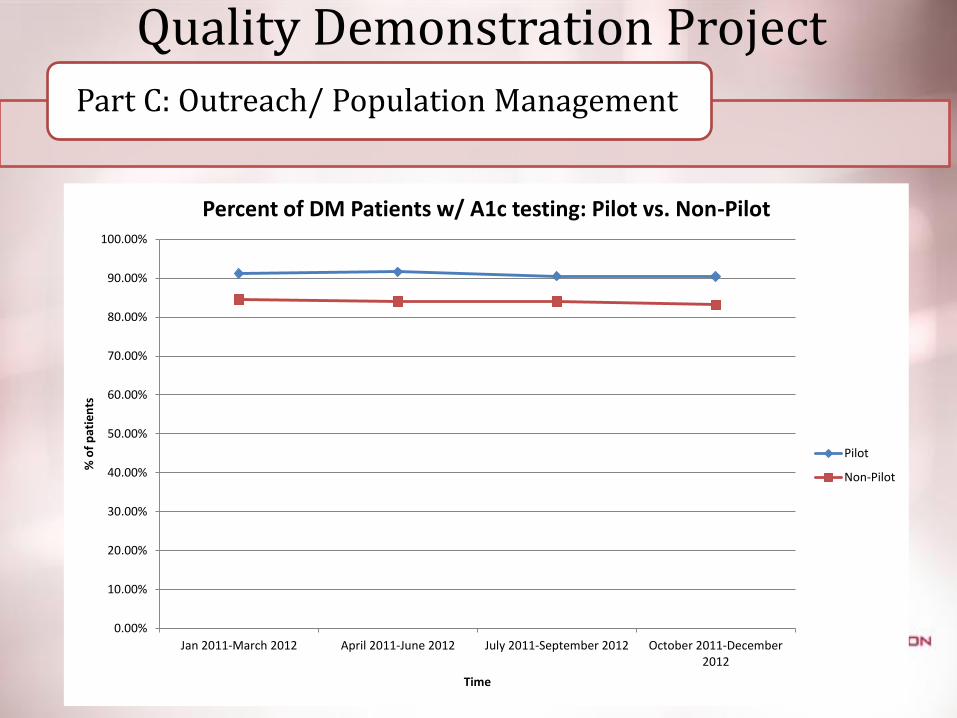
Percent of DM Patients w/ A1c testing: Pilot vs. Non-Pilot
Pilot
Non-Pilot
Quality Demonstration Project Part C: Outreach/ Population Management
Quality Demonstration Project
Track global and individual performance following initiation of a compensation change that ties a portion of compensation to quality metrics.
Metrics to follow:
• TBD
Part D: Compensation change
Quality Demonstration Project
• Will allow us to incrementally evaluate the effects of each variable and determine next steps
– POS tool (CINA)
– Clinic-wide Transparency
– Outreach
– Tie to compensation
Lessons Learned…
1. You can’t make everyone happy 2. The data will NEVER be PERFECT, but it must be
ACCEPTABLE and ACTIONABLE 3. Focus on a manageable number of cohorts,
meaningful metrics, and quantifiable process improvements, etc.
4. Set feasible goals and involve a leader from every affected department
5. Accurately and Precisely track the metrics and record changes in the clinic for future explanation
6. Take care to avoid any action or attitude that could be interpreted as judgmental or worse-punitive.
7. Have fun with this!

Questions?