1 Seasonal Forecasts and Predictability Masato Sugi Climate Prediction Division/JMA.

Lesson Plan
Using Climate Forecastsin Agriculture
SART Training Media

Using Climate Forecasts in AgricultureLesson Plan
Prepared by: Clyde Fraisse, Climate Extension Scientist, University of Florida, GainesvilleJohn Bellow, Climate Extension Specialist, Center for Ocean-Atmospheric
Prediction Studies, Florida State University, TallahasseeDavid Zierden, Assistant State Climatologist, TallahasseeCarol J. Lehtola, Associate Professor, University of Florida, GainesvilleSusan Williams, University of Florida, GainesvilleCharles M. Brown, University of Florida, Gainesville
Copyright 2005 by Florida Department of Agriculture and Consumer Services
SARSARSARSARSART TT TT TT TT Training Mediaraining Mediaraining Mediaraining Mediaraining Media are available for download from the Florida SART Web site<www.flsart.org>.
Development of Using Climate Forecasts in Agriculture was supported by a grant fromUSDA Risk Management Agency.

Using Climate Forecasts in Agriculture • Lesson Plan 3
Contents
About Florida SART 4
Introduction 5
Session Outline 5
Specific Learning Objectives 6
Learning Environment/Aids 6
Before the Workshop 7
Part 1 — Beginning the Session 7
Part 2 — Climate and Weather 8
Part 3 — The Value of Climate Forecasts to Agriculture 9
Part 4 — El Niññññño and La Niññññña 10
Part 5 — El Niññññño, La Niññññña and Rainfall 11
Part 6 — El Niññññño, La Niññññña and Temperature 12
Part 7 — El Niññññño, La Niññññña and Freezes 12
Part 8 — El Niññññño, La Niññññña and Hurricanes 13
Part 9 — El Niññññño, La Niññññña and Wild Fires 14
Part 10 — El Niññññño, La Niññññña and Crop Production 14
Part 11 — Degree-days 15
Part 12 — The AgClimate Web Site 16
Part 13 — Summary and Wrap-Up 17
Participant Evaluation 18
Pre- and Post-Tests and Answer Key 19
PowerPoint Slides Summary Pages 23
PowerPoint Slides — Full-Size 31
PowerPoint Slides — Handout Pages 119

Using Climate Forecasts in Agriculture • Lesson Plan4
About Florida SART
SART is a group of governmental and private agencies dedicated to effectively communicating and planningfor animal and agriculture emergencies and disasters in Florida.
SART operates at the local level through county SART organizations.
SART combines the skills and resources of many agencies, organizations and individuals.
SART supports county, regional, and state emergency management efforts.
SART Mission
Empower Floridians with training and resources to enhance animal and agriculture disaster response.
SART Goals
• Promote the establishment of a coordinator in each county responsible for all agriculturally relatedincidents
• Provide assistance in the development and writing of county ESF-17 plans• Promote the establishment of a County SART for each county• Provide annual training for all SART and agriculturally-related personnel• Identify county resources available for an emergency or disaster• Promote counties to work at a regional level for mutual aid
Using Climate Forecasts in Agriculture • Lesson Plan 5
Introduction
This lesson plan and its accompanying workbook are the basis for an introductory unit onthe use of climate forecasts in agriculture. The lesson plan guides the instructor or trainerin presenting the educational portion of the workshop. The mechanics of planning thetraining event or an entire workshop are covered in the companion manual, Make It
Happen! A Toolkit for Planning a Community-Based SART Training Event. The toolkit isavailable for download at the Florida SART Web site <www.flsart.org>.
A PowerPoint presentation has been created to accompany the lesson. Throughout thelesson plan, slide symbols indicate that a PowerPoint slide is available for that section.Slides are also reproduced in the back of this lesson plan for use as a flipbook with smallclasses or making overheads.
Session Outline
Part 1 - Beginning the Session (5-10 minutes)Part 2 - Climate and Weather (5-10 minutes)Part 3 - The Value of Climate Forecasts to Agriculture (5-10 minutes)Part 4 - El Niññññño and La Niññññña (5-10 minutes)Part 5 - El Niññññño and La Niññññña and Rainfall (5-10 minutes)Part 6 - El Niññññño and La Niññññña and Temperature (5-10 minutes)Part 7 - El Niññññño and La Niññññña and Freezes (5-10 minutes)Part 8 - El Niññññño and La Niññññña and Hurricanes (5-10 minutes)Part 9 - El Niññññño and La Niññññña and Wild Fires (5-10 minutes)Part 10 - El Niññññño and La Niññññña and Crop Production (5-10 minutes)Part 11 - Degree-days (5-10 minutes)Part 12 - The AgClimate Web Site (5-10 minutes)Part 13 - Summary and Wrap-Up (5-10 minutes)
Subject: Introduce basic concepts about climate, specifically the ElNiññññño and La Niññññña phenomena and their impact on thesoutheastern United States. Introduce participants to theAgClimate Web site and the tools it provides.

6
Specific Learning ObjectivesAt the end of this training module, participants will be able to:
1. Explain climatclimatclimatclimatclimateeeee and how it is different from wwwwweathereathereathereathereather.
2. Explain the value of climate forecasts to agriculture.
3. Explain ElElElElEl NiñoNiñoNiñoNiñoNiño and La Niña eLa Niña eLa Niña eLa Niña eLa Niña evvvvventsentsentsentsents and how knowing about these climate eventshelps agriculture?
4. Explain how El Niño and La Niña events affect rainfrainfrainfrainfrainfallallallallall.
5. Explain how El Niño and La Niña events affect tttttemememememperaturesperaturesperaturesperaturesperatures in the Southeast U.S.
6. Explain how El Niño and La Niña events affect freezesfreezesfreezesfreezesfreezes.
7. Explain how El Niño and La Niña events affect the chance of hurricaneshurricaneshurricaneshurricaneshurricanes hitting theU.S.
8. Explain how El Niño and La Niña events affect the risk of wild fwild fwild fwild fwild firesiresiresiresires.
9. Explain how El Niño and La Niña events affect crcrcrcrcrop prop prop prop prop productionoductionoductionoductionoduction in the Southeast U.S.
10. Explain degree-dadegree-dadegree-dadegree-dadegree-daysysysysys, grgrgrgrgrooooowing degree-dawing degree-dawing degree-dawing degree-dawing degree-daysysysysys and heat-stress degree-daheat-stress degree-daheat-stress degree-daheat-stress degree-daheat-stress degree-daysysysysys.
11. Describe the AAAAAgClimatgClimatgClimatgClimatgClimate We We We We Web siteb siteb siteb siteb siteeeee.
Learning Environment/AidsTo complete this lesson plan, you will need:
• The PowerPoint presentation “Using Clilmate Forecasts in Agriculture”
• Optional: Using Clilmate Forecasts in Agriculture Workbook. This participant workbookcontains copies of the PowerPoint slides and resource information.
• Optional: Make It Happen! Toolkit for Planning a Community-Based SART Training
Event. This publication is available to help you organize, plan and present an entireCART training event with multiple training modules.
• (See the Resources section of this publication to find out more about any of thematerials listed above.)
To conduct this training module, you will need:
• A means to show the PowerPoint presentation: a computer with a projector. (Note:Black-and-white copies of the slides are included in this manual if you prefer to usean overhead projector.)
• Sufficient seating for all participants.
Each participant will need:
• Pen or pencil
• Using Climate Forecasts in Agriculture Workbook, or paper for notes
Using Climate Forecasts in Agriculture • Lesson Plan

7
Before the Workshop
On the day of the workshop, check that all equipment needed is in place. Double-checkthat electronic media works on the equipment you have. Also, make certain that anymaterials, such as paper, workbooks, and pens/pencils for participants, are available insufficient numbers to cover all participants.
Part 1: Beginning the Session
Time: 5-1Time: 5-1Time: 5-1Time: 5-1Time: 5-10 minut0 minut0 minut0 minut0 minuteseseseses
FFFFFocus: Wocus: Wocus: Wocus: Wocus: Welcome parelcome parelcome parelcome parelcome participants and intrticipants and intrticipants and intrticipants and intrticipants and introduce unit objectivoduce unit objectivoduce unit objectivoduce unit objectivoduce unit objectiveseseseses
Once all participants have taken their seats, welcome them to the “UsingClimate Forecasts in Agriculture” workshop. Introduce yourself and anyother trainers. Tell them approximately how long the session will last.
At this point, you may elect to give particpants the pre-test provided in thismanul. Together with the post-test, this can be used to evaluate theknowledge participants gained during the session.
This workshop can be used with agricultural and non-agricultural audiences.The purpose of this lesson is to introduce concepts about climate andclimate forecasting, and how this knowledge can be useful to agriculturalproducers. Specifically, the AgClimate Web site will be introduced along withthe tools it provides. Details about using the AgClimate tools is beyond thescope of this introductory lesson.
The introduction should not last longer than 10 minutes. It is necessary forthe trainer to balance staying on time, explaining the unit content clearly,and allowing for and answering participant questions.
Introduce participants to the Southeast Climate Consortium. Six institutionsin Alabama, Florida, and Georgia participate in the Consortium and areworking to bring the latest climate forecasting research to agriculturalproducers in the form of practical tools. The primary way of providing thisinformation is through the AgClimate Web site at <www.agclimate.org>.
Take a moment to review the objectives for the workshop. This will helpparticipants focus on what they are going to learn about and recognizetopics as they come up in the workshop.
SLIDES
1-3
SLIDE
5
Using Climate Forecasts in Agriculture • Lesson Plan
SLIDE
4

8
Part 2: Climate and Weather
Time: 5-1Time: 5-1Time: 5-1Time: 5-1Time: 5-10 minut0 minut0 minut0 minut0 minuteseseseses
FFFFFocus: Explain climatocus: Explain climatocus: Explain climatocus: Explain climatocus: Explain climate and hoe and hoe and hoe and hoe and how it is difw it is difw it is difw it is difw it is difffffferent frerent frerent frerent frerent from wom wom wom wom weathereathereathereathereather
WWWWWeathereathereathereathereather is a familiar concept -- weather is what is happening in the atmo-sphere at any specific point in time, such as the day-to-day measurements oftemperature and rain.
Weather deals with short-term effects that result from the movement anddevelopment of particular weather systems (such as cold and warm fronts orhurricanes). Predicting the weather is a standard feature in news broadcastsand newspapers. These predictions are usually fairly accurate for one, two orthree days, but because the atmosphere changes very quickly, weatherpredictions for more than a few days into the future are not as reliable.
Examples of weather include thunderstorms with their heavy rain and strongwinds that might be caused by a cold front moving through a particular area.A lack of rain on any given day is also weather -- good weather for outdooractivities. A hard freeze is also a kind of weather.
Farmers, foresters and other agricultural managers can use weather todecide what activities are appropriate in the very near future, such as howmuch irrigation might be needed, whether to protect crops from freeze orfrost, and whether chemical spraying and fertilizing are advisable on a givenday.
ClimatClimatClimatClimatClimateeeee is a pattern of weather for one month or more in a certain region.When people discuss the total amount of rain for a month or a season, theyare discussing the results of a pattern of weather. When the average tem-perature during a particular month is consistently above average, that is apattern of weather, and therefore, climate.
Local climate can be influenced by remote conditions. For example, thetemperature of the ocean in the Pacific Ocean near the Equator has a defi-nite influence on the climate in the southeastern United States. A great dealof research has gone into this subject, and it has yielded many practicalresults.
Farmers, foresters and other agricultural managers now can know monthsahead of time if less rain or more rain than normal will happen during differ-ent seasons in a year. This knowledge may change what crops to plant, how
SLIDESLIDESLIDESLIDESLIDE
6
Using Climate Forecasts in Agriculture • Lesson Plan

9
SLIDESLIDESLIDESLIDESLIDE
7
The Value of Climate Forecasts to Agriculture
Time: 5-1Time: 5-1Time: 5-1Time: 5-1Time: 5-10 minut0 minut0 minut0 minut0 minuteseseseses
FFFFFocus: Explain the vocus: Explain the vocus: Explain the vocus: Explain the vocus: Explain the value of climatalue of climatalue of climatalue of climatalue of climate fe fe fe fe forecasts torecasts torecasts torecasts torecasts to agricultureo agricultureo agricultureo agricultureo agriculture
Climate influences production and pricing of food, feed and fiber. Most cropfailures in the United States are related to too little or too much rain. Differ-ences in climate among the seasons are related to other production risks,such as pests and disease. Knowing possible climate shifts in the comingseason helps farmers, foresters and other agricultural managers decideahead of time how to deal with these risks. Better information about climatechanges can help producers minimize climate-associated risks.
Examples of other production decisions that could be influenced by climateforecasts include:
• Choice of crop and variety• Whether to buy crop insurance and how much to buy• Amount and types of fertilizers and pesticides to buy
Part 3:
Using Climate Forecasts in Agriculture • Lesson Plan
much to irrigate and when to harvest.
For example, when equatorial waters in the Pacific are cooler than normal,the climate in south Florida is likely to be hotter and drier than normal withnight temperatures above 65°F. With this knowledge, tomato producersmight choose hot-set tomatoes as the variety that will produce best underthese conditions.

10 Using Climate Forecasts in Agriculture • Lesson Plan
SLIDES
8
El Niño and La Niña Events
Time: 5-1Time: 5-1Time: 5-1Time: 5-1Time: 5-10 minut0 minut0 minut0 minut0 minuteseseseses
FFFFFocus: Explain El Niño and La Niña and hoocus: Explain El Niño and La Niña and hoocus: Explain El Niño and La Niña and hoocus: Explain El Niño and La Niña and hoocus: Explain El Niño and La Niña and how know know know know knowing aboutwing aboutwing aboutwing aboutwing aboutthese climatthese climatthese climatthese climatthese climate ee ee ee ee evvvvvents helps agricultureents helps agricultureents helps agricultureents helps agricultureents helps agriculture
As mentioned earlier, sea surface temperatures near the equator in thePacific Ocean can influence the climate in the southeastern United States.Sea surface temperatures can either be higher than average, lower thanaverage, or they can be average. It takes months for the SST to change, sofor example, if it is higher than normal, it can be several months to a year ormore before it returns to normal or becomes lower than normal. The periodof time during which the SST is high, low or normal is called a “phase” orsometimes an “event.”
Normal SST is different depending on the time of year. During Decemberthrough February, the normal SST is 75°°°°°F - 80°°°°°F.
The warmer than normal phase is called “El Niño,” which refers to the infantJesus. The reason for this name is that the warmer than normal phase hasbeen known for hundreds of years to Peruvian fishermen, who often noticeddecreased catches when December waters were warmer than usual. Muchlater, it was discovered that the same waters can be colder than usual, and anatural name for this opposite condition was “La Niña.” When SST is normal,the phase is called “Neutral.” So, when reading about climate issues, onemight read about an “El Niño phase,” an “El Niño event,” or possibly just “ElNiño.”
SST is the most important surface condition that influences climate, particu-larly in the tropical parts of the world.***** El Niño and La Niña have strongeffects on climate patterns around the world.
Normally, trade winds blow from east to west near the Equator in the PacificOcean. These winds pile up warm water around Indonesia and Australia.During El Niño phases, trade winds die down and the warm water movesback towards the coast of South America. This makes the SST much warmerthan normal.
Part 4:
***** The tropical part of the world is the area around the world between the Tropic of Cancerand the Tropic of Capricorn. The Tropic of Cancer is 23.5 degrees north of the equator andruns through Mexico, the Bahamas, India and southern China. The Tropic of Capricorn is23.5 degrees south of the equator and runs through Australia, Chile, southern Brazil andnorthern South Africa.
SLIDES
9
SLIDES
10

11Using Climate Forecasts in Agriculture• Lesson Plan
During La Niña phases, stronger than usual trade winds bring up coolerwater from the depths of the Pacific Ocean. This makes the SST in theeastern tropical Pacific Ocean lower than normal.
El Niño and La Niña phases return every 2 to 7 years. One does not alwaysfollow the other. For example, a La Niña phase began in 1988 followed byNeutral phases during 1989 and 1990; then, in 1991, an El Niño phasedeveloped.
Most of the time, however, the tropical Pacific Ocean is in a Neutral phase ornear normal SST.
SLIDE
12-15
How El Niño, La Niña Affect Rainfall
Time: 5-1Time: 5-1Time: 5-1Time: 5-1Time: 5-10 minut0 minut0 minut0 minut0 minuteseseseses
FFFFFocus: Explain hoocus: Explain hoocus: Explain hoocus: Explain hoocus: Explain how El Niño and La Niña afw El Niño and La Niña afw El Niño and La Niña afw El Niño and La Niña afw El Niño and La Niña affffffect rainfect rainfect rainfect rainfect rainfallallallallall
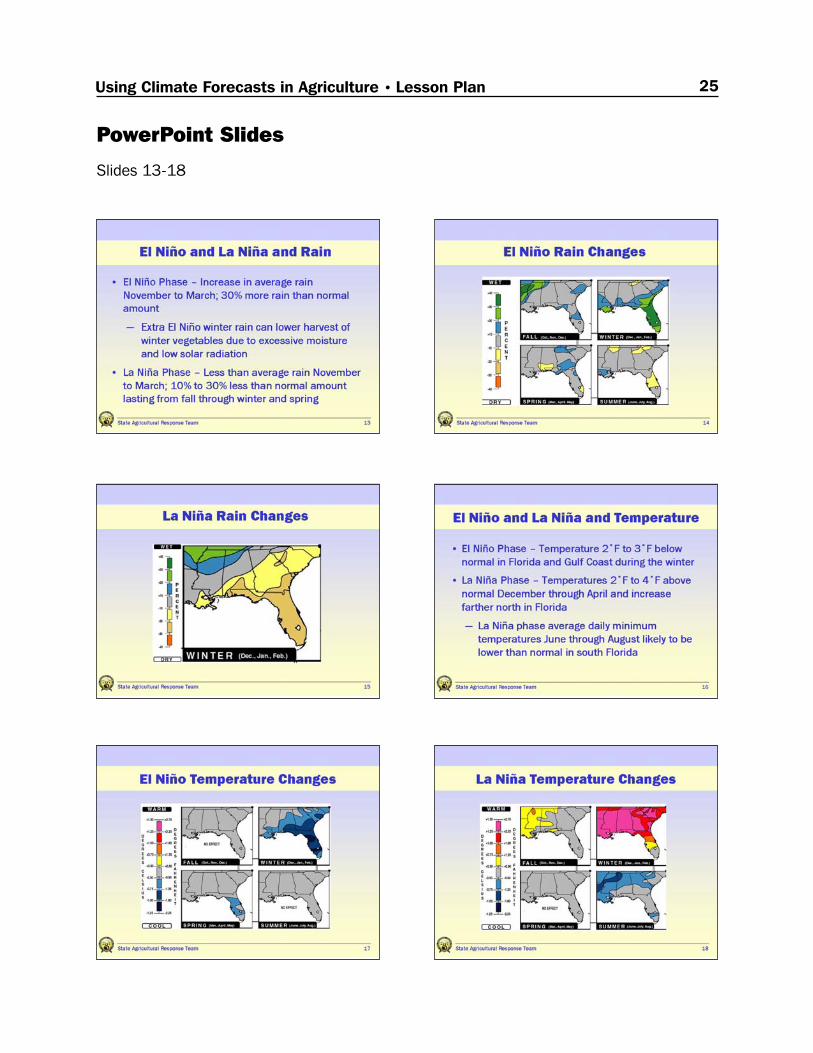
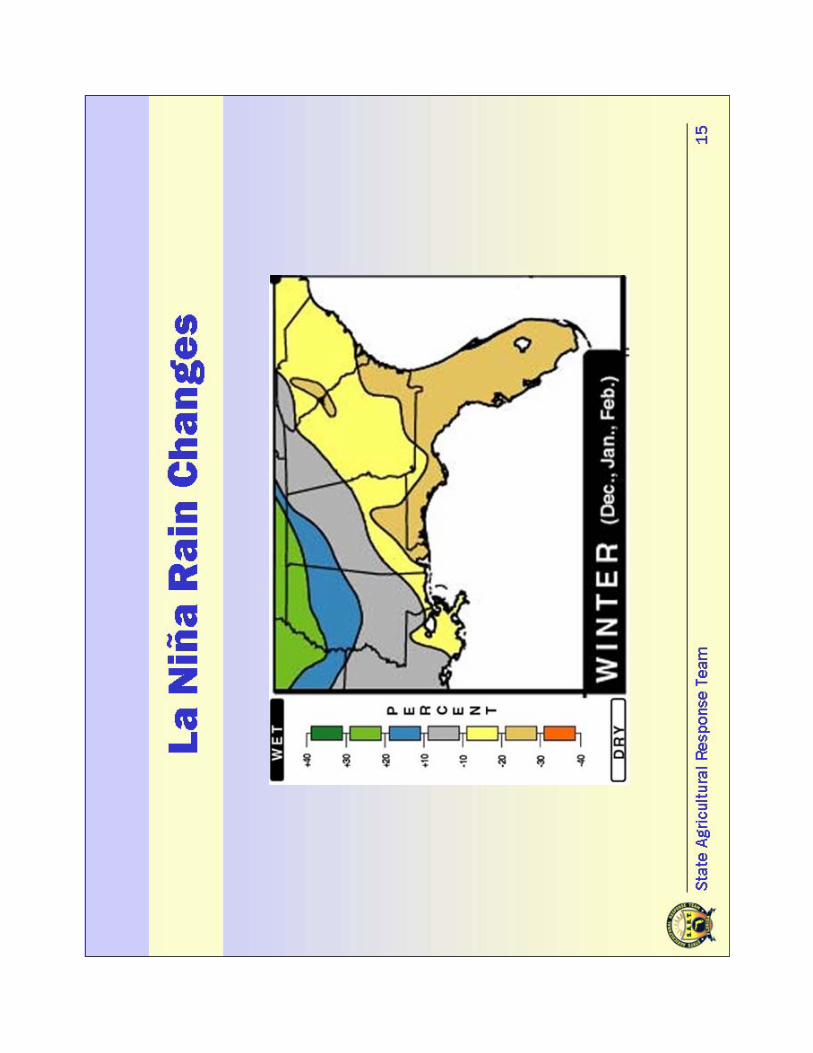
During El Niño phases, average winter rainfall increases all across Florida byover 30%, compared to normal winter totals.
La Niña phases have the opposite effect. Rainfall can be from 10% to 30%less than normal from fall through winter and spring.
El Niño’s influence on rainfall makes a difference in the production of sev-eral commodities in Florida, including winter vegetables, some citrus, sugar-cane and field corn. More clouds during cooler and wetter winters causeplants to get less energy from the sun. Weather patterns of El Niño in winteralso increase the possibility of disease which can affect the production ofwinter vegetables.
For example, in the winter of 1982-1983, one of the strongest La Niñaphases caused winter storms that beat up California and the Gulf Coast.....Average sea surface temperature decreased by as much as 4°F.
Part 5:
SLIDES
11
12 Using Climate Forecasts in Agriculture • Lesson Plan
SLIDE
16-18
El Niño, La Niña and Temperatures
Time: 5-1Time: 5-1Time: 5-1Time: 5-1Time: 5-10 minut0 minut0 minut0 minut0 minuteseseseses
FFFFFocus: Explain hoocus: Explain hoocus: Explain hoocus: Explain hoocus: Explain how El Niño and La Niña afw El Niño and La Niña afw El Niño and La Niña afw El Niño and La Niña afw El Niño and La Niña affffffect tect tect tect tect temememememperaturesperaturesperaturesperaturesperatures
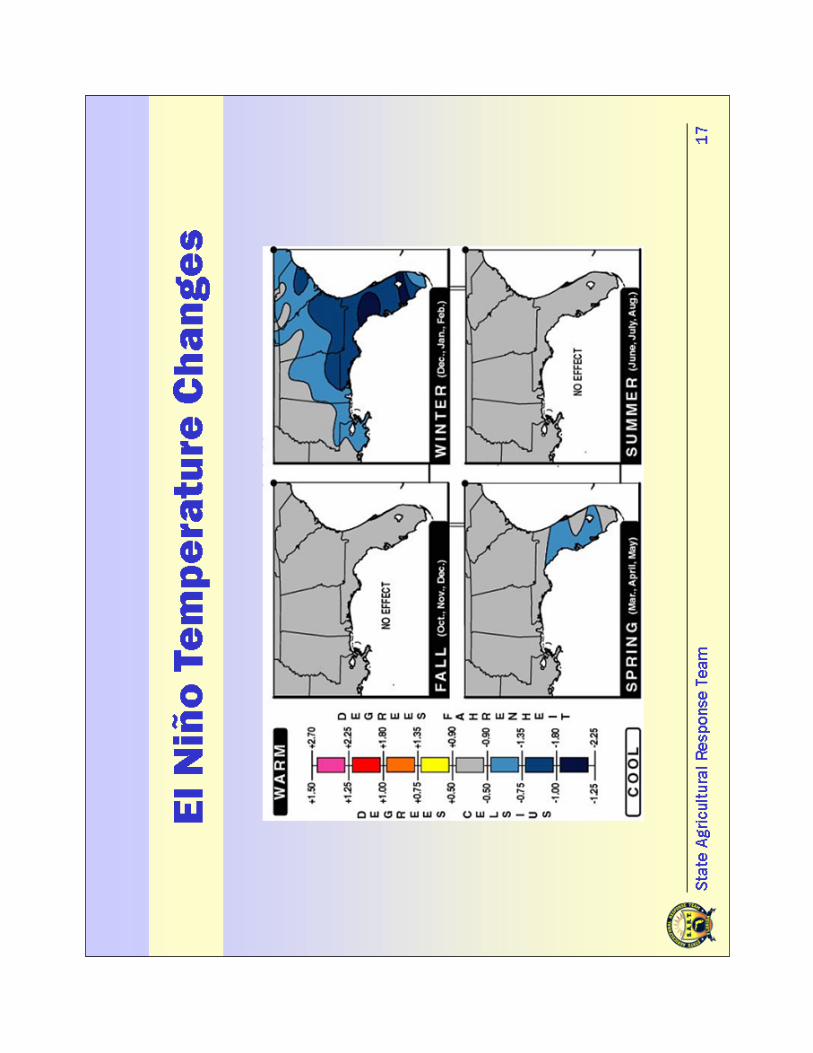
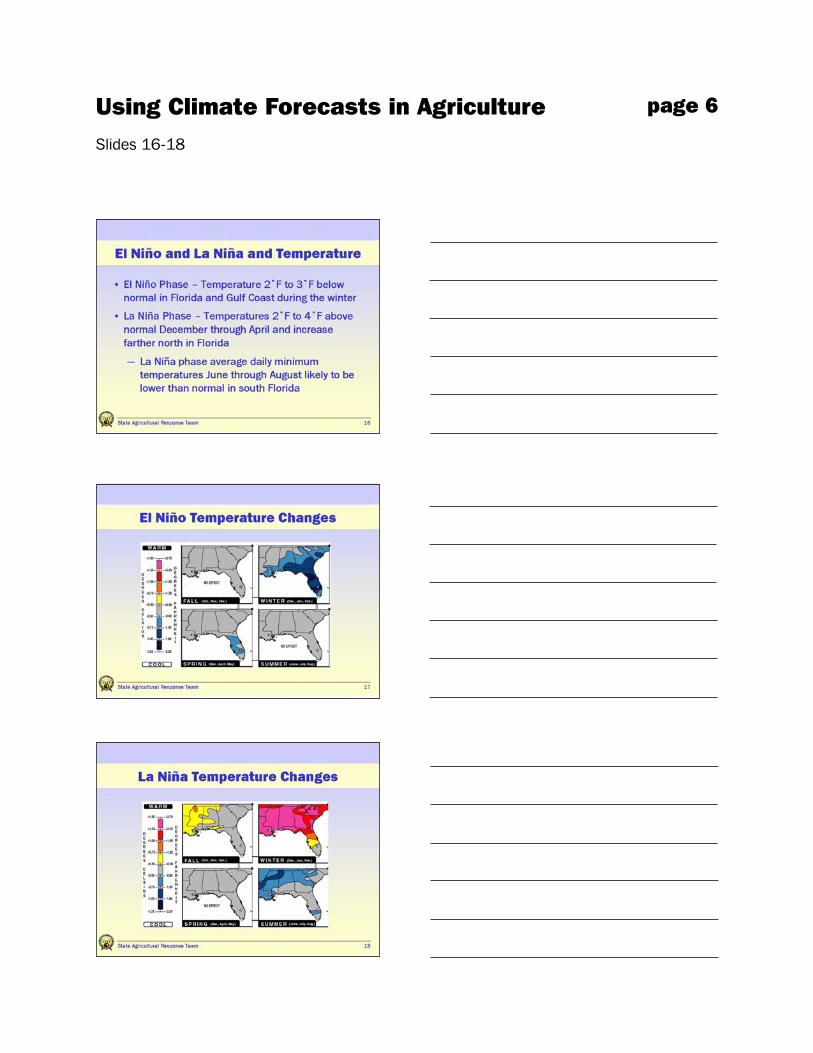
The differences between average temperatures from season to season aremuch greater than the average temperature change caused by El Niño or LaNiña. However, in Florida, any movement away from normal temperatures isimportant, especially during winter. During El Niño events, Florida and theGulf Coast have average temperatures 2 to 3°F below normal. During LaNiña events, winter temperatures are 2 to 4°F above normal. La Niña’saffect on temperature is more noticeable in north Florida, Alabama andMississippi.
For example, in 1998-2000, La Niña caused drier and warmer winters inFlorida. This caused an increase in wild fires in the state. Other parts of thecountry were drier and warmer than normal.
The effects of El Niño and La Niña phases on winter average daily minimumtemperatures are not as strong. In south Florida, however, average dailyminimum summer temperatures are likely to be lower than normal during LaNiña phases. Lower temperatures at night may be good for growth and yieldof some crops.
Higher average temperatures associated with La Niña can have an effect onlivestock. For example, dairy cows are sprayed with water several times a daywhen temperatures are high. Water keeps them cool and keeps up their milkproduction. Heat-stressed cows produce less milk than cool cows.
Part 6:
SLIDE
19-20
El Niño, La Niña and Freezes
Time: 5-1Time: 5-1Time: 5-1Time: 5-1Time: 5-10 minut0 minut0 minut0 minut0 minuteseseseses
FFFFFocus: Explain hoocus: Explain hoocus: Explain hoocus: Explain hoocus: Explain how El Niño and La Niña afw El Niño and La Niña afw El Niño and La Niña afw El Niño and La Niña afw El Niño and La Niña affffffect freezesect freezesect freezesect freezesect freezes
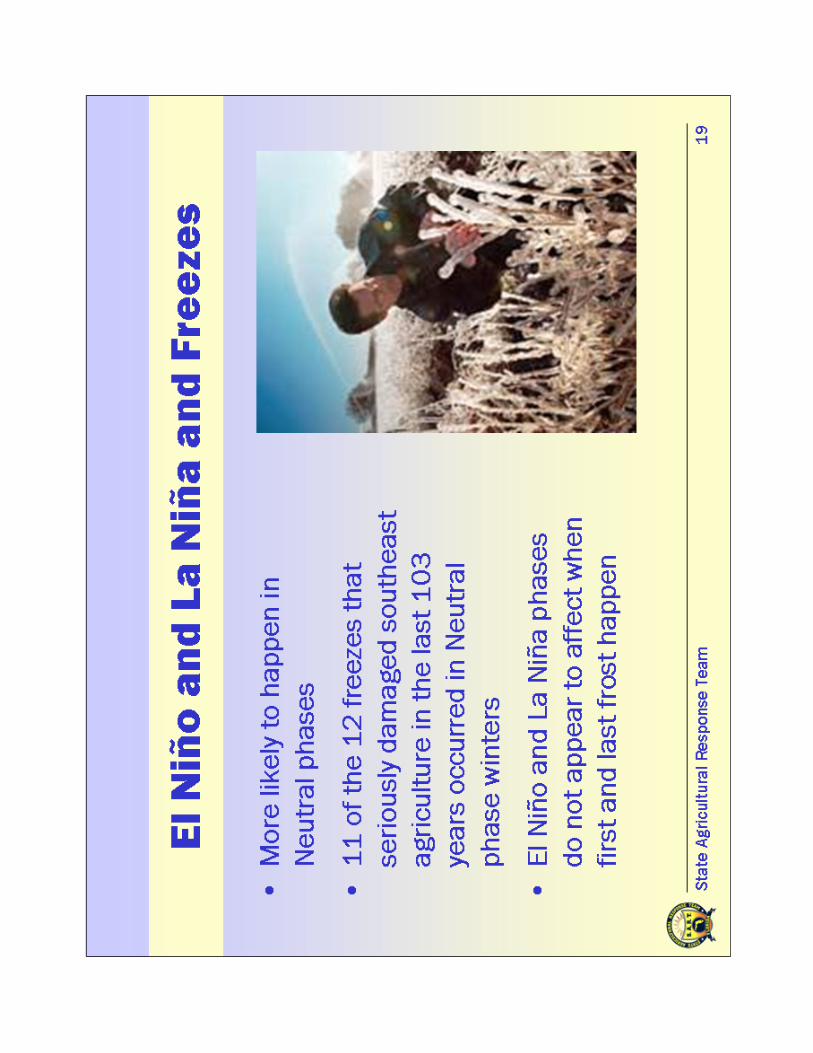
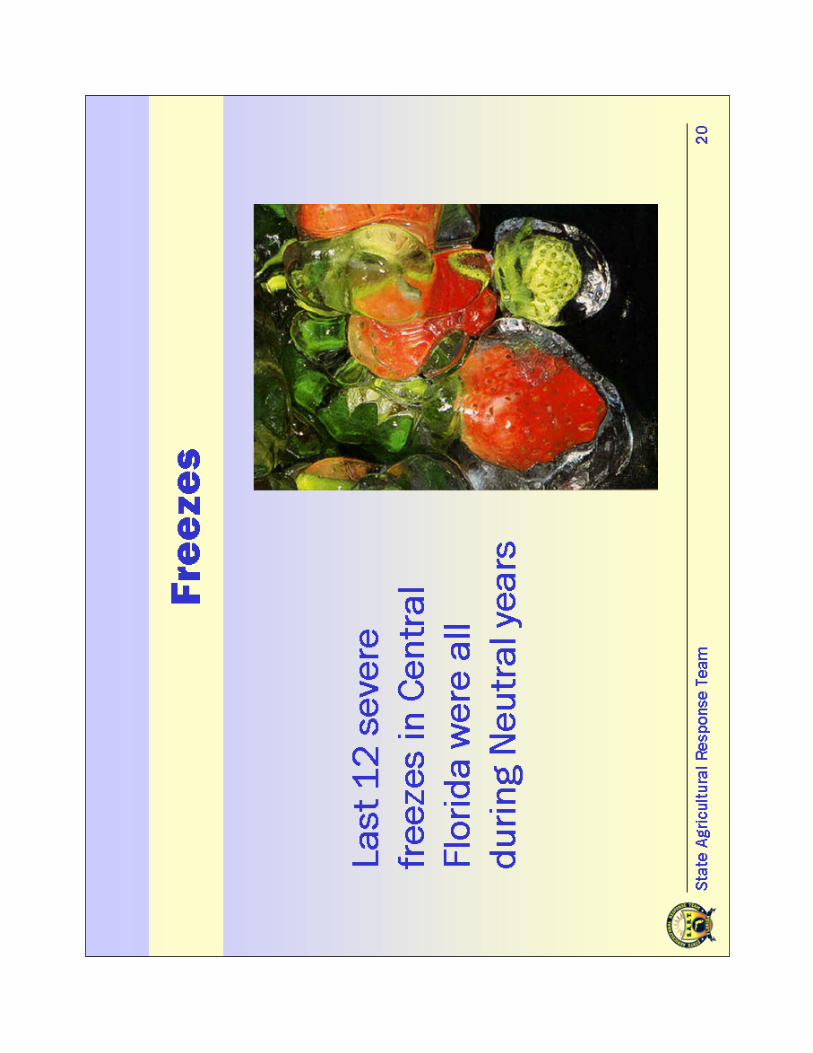
Eleven of the 12 freezes that seriously damaged agriculture over the last103 years (1894-1997) in the southeast happened during Neutral years.For example, very damaging freezes occurred in December 1962 and Janu-ary 1982 during Neutral years.
Part 7:

13Using Climate Forecasts in Agriculture• Lesson Plan
Depending on where you are in Florida, damaging freezes with temperaturesof 20°F or lower are up to 3 times more likely during Neutral years thanduring El Niño and La Niña events. Similar freezes may happen once everyfew years. For example, Alachua County may have a damaging freeze onceevery 5 years; south Florida may have over 20 years in between severefreezes.
Freezes that last longer than 2 nights are extended freezes, and they canseverely damage some agriculture enterprises, such as aquaculture incentral Florida. South Florida may have one extended freeze in 20 years, butCalhoun County in Florida’s Panhandle, on the other hand, may have twoextended freezes in a single year.
Another measure of the impact of freezing temperatures are the dates of thefirst frost and the last frost. For example, in Columbia County, there is a 50%chance that the first freeze will be between November 21 and November 30.Columbia County has a 50% probability that the last freeze will be betweenApril 21 and April 30. El Niño and La Niña do not appear to affect when thefirst or last frosts or freezes occur.
SLIDE
21-22
El Niño, La Niña and Hurricanes
Time: 5-1Time: 5-1Time: 5-1Time: 5-1Time: 5-10 minut0 minut0 minut0 minut0 minuteseseseses
FFFFFocus: Explain hoocus: Explain hoocus: Explain hoocus: Explain hoocus: Explain how El Niño and La Niña afw El Niño and La Niña afw El Niño and La Niña afw El Niño and La Niña afw El Niño and La Niña affffffect the chances ofect the chances ofect the chances ofect the chances ofect the chances ofhurricanes hitting the Uhurricanes hitting the Uhurricanes hitting the Uhurricanes hitting the Uhurricanes hitting the U.S..S..S..S..S.
Upper level winds over the Atlantic Ocean Basin are not suitable for thedevelopment of a lot of hurricanes during an El Niño phase. Fewer hurri-canes mean the chance for one to strike the U.S. is less likely. On the otherhand, La Niña helps hurricanes develop in the Atlantic Ocean Basin, whichmeans a greater chance one or more hurricanes may strike the U.S. Thechances of at least 2 hurricanes hitting the U.S. are 28% during El Niño,48% in Neutral phases, and 66% during La Niña.
Recent examples of hurricanes formed during Neutral phases include Hurri-cane Andrew, which struck Miami-Dade County in August 1992. This power-ful storm destroyed between 35% and 45% of 22,000 acres of commercialtropical fruit crops in Miami-Dade County. Hurricanes in the 2004 and 2005seasons also occurred during a Neutral phase. The many storms of thesetwo seasons caused extensive agricultural damage amounting to over $2billion in both years.
Part 8:

14 Using Climate Forecasts in Agriculture • Lesson Plan
SLIDE
23-24
El Niño, La Niña and Wild Fires
Time: 5-1Time: 5-1Time: 5-1Time: 5-1Time: 5-10 minut0 minut0 minut0 minut0 minuteseseseses
FFFFFocus: Explain hoocus: Explain hoocus: Explain hoocus: Explain hoocus: Explain how El Niño and La Niña afw El Niño and La Niña afw El Niño and La Niña afw El Niño and La Niña afw El Niño and La Niña affffffect the risk fect the risk fect the risk fect the risk fect the risk for wildor wildor wildor wildor wildfffffire in the southeast Uire in the southeast Uire in the southeast Uire in the southeast Uire in the southeast U.S..S..S..S..S.
La Niña causes below normal rainfall beginning in the fall and lastingthrough spring. The long dry period runs into April, one of the driest monthsof the year. As a result, soil and forests can be extremely dry. This can causean increased risk of fires the following spring and summer.
Fire records show that the number of acres burned in Florida each year ishighly related to El Niño and La Niña. The records show an increase in theacres burned during La Niña, especially in south Florida. For 1981-1998, onaverage over 500,000 acres burned in Florida. Neutral years average around200,000 acres burned. Wet El Niño winters seem to prevent forest fires. TheFlorida western Panhandle does not usually have a problem with forest firesbecause this area gets much more rainfall in a year than other parts of thestate.
Part 9:
SLIDE
25-29
El Niño, La Niña and Crop Production
Time: 5-1Time: 5-1Time: 5-1Time: 5-1Time: 5-10 minut0 minut0 minut0 minut0 minuteseseseses
FFFFFocus: Explain hoocus: Explain hoocus: Explain hoocus: Explain hoocus: Explain how El Niño and La Niña afw El Niño and La Niña afw El Niño and La Niña afw El Niño and La Niña afw El Niño and La Niña affffffect crect crect crect crect crop prop prop prop prop production inoduction inoduction inoduction inoduction inthe southeast Uthe southeast Uthe southeast Uthe southeast Uthe southeast U.S..S..S..S..S.
El Niño and La Niña events can influence crop production through theirinteractions with weather. Past studies have shown that yields of severalcrops in the Southeast U.S. are affected by El Niño and La Niña phases.
Environmental variables such as temperature, rainfall and solar radiationstrongly affect crop development and growth. Development refers to thetiming of critical events in a plant’s life. Growth refers to the increase inweight, volume, length, or area of part or all of the plant.
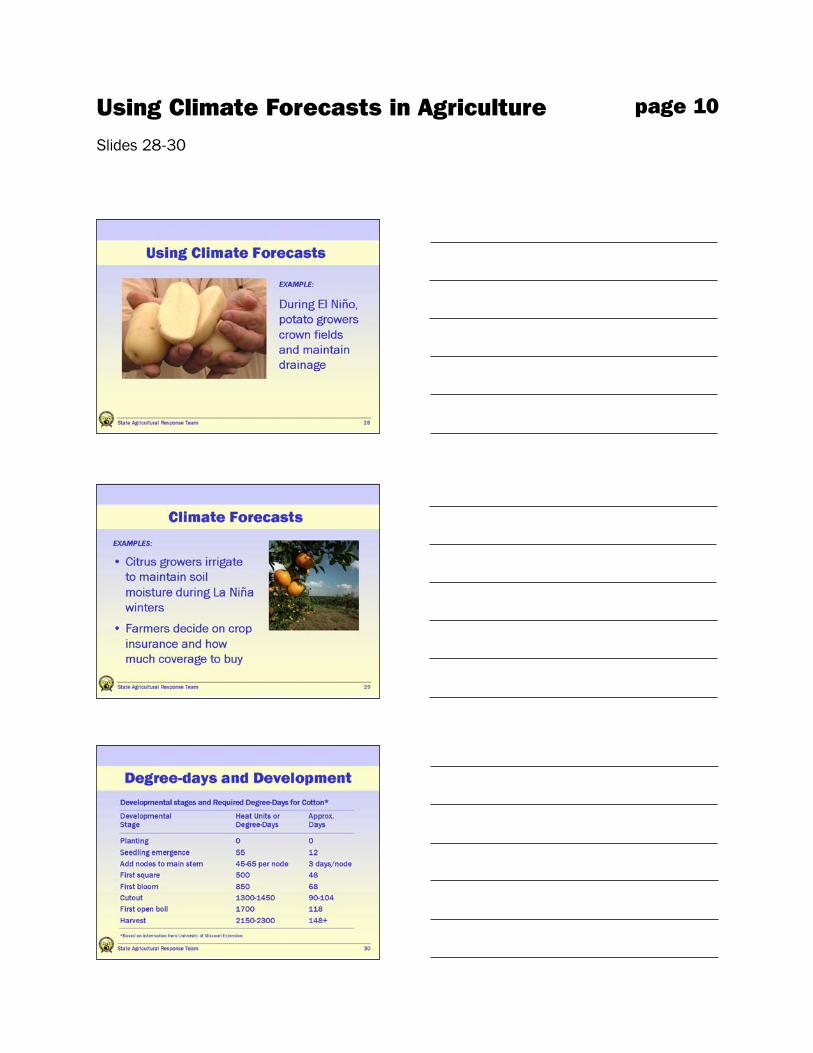
For example, the winter tomato yield is about 20% lower than average duringEl Niño events and about 8% higher during La Niña events. Field corn yieldsare 10% lower during El Niño events and almost 10% higher during La Niñaevents.
Part 10:

15Using Climate Forecasts in Agriculture • Lesson Plan
SLIDE
30
Degree-days: Measuring the Energy for Growth
Time: 5-1Time: 5-1Time: 5-1Time: 5-1Time: 5-10 minut0 minut0 minut0 minut0 minuteseseseses
FFFFFocus: Explain degree-daocus: Explain degree-daocus: Explain degree-daocus: Explain degree-daocus: Explain degree-days, grys, grys, grys, grys, grooooowing degree-dawing degree-dawing degree-dawing degree-dawing degree-days, and heatys, and heatys, and heatys, and heatys, and heatstress degree-dastress degree-dastress degree-dastress degree-dastress degree-daysysysysys
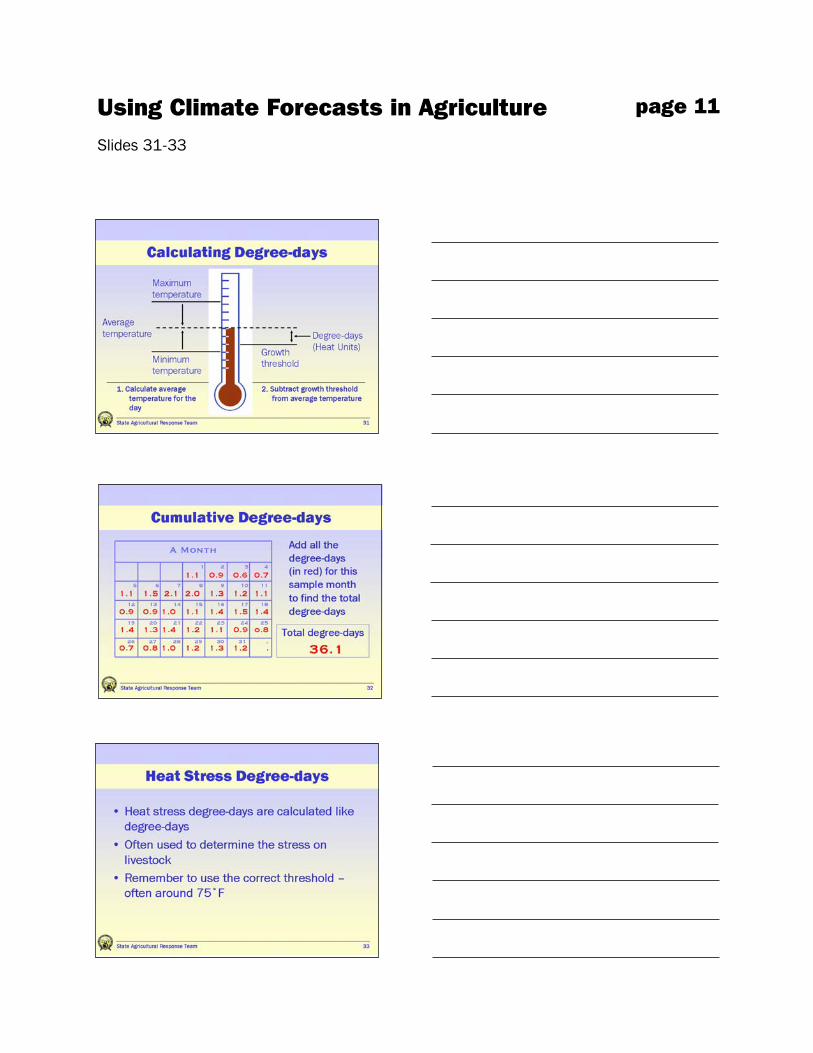
Degree-days are a way of measuring the amount of energy available forgrowth. Researchers have found that for each developmental stage of aplant, there is a temperature below which growth slows significantly. Thistemperature is called the threshold, and for crops to grow effectively, theremust be plenty of days during which the temperature is above this threshold.
There are several ways of calculating degree-days, but the most common isto find the average of a day’s high temperature and the low temperature,then subtract the threshold temperature. For example, if the threshold for aparticular crop is 60°F and the average temperature on a particular day is65°F, then that day provided 5 degree-days for the crop.
We can add all daily degree-days together to find out how many total degree-days have occurred since a certain day, for a particular month, or since aplanting date. Cumulative degree-days like this are often compared to pastyears to see if the current year is supplying more or less degree-days in thesame period of time. Higher numbers of degree-days in a given month causeearlier flowering and maturity. El Niño and La Niña affect growing degree-days mainly December through February.
For example, in the months December through February in South Florida,certain winter crops may grow 5% to 10% faster than normal during a LaNiña phase and 10% to 15% slower during an El Niño phase.
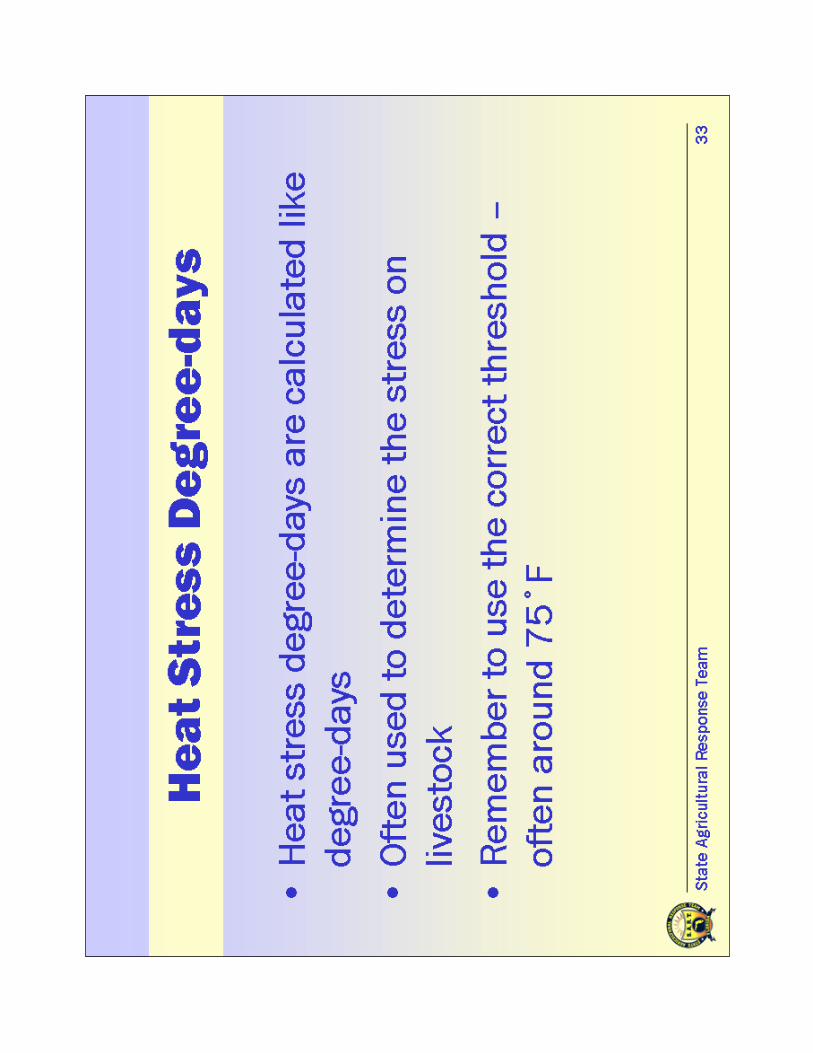
Degree-days can also be used as a way of measuring any above-normal heatthat animals must endure. This is called heat-stress degree-days. For ex-ample, cattle and hog weight gain and milk production are less when tem-peratures are higher than 77°F.
Use heat stress degree-days to figure out if livestock have heat stress. Actualloss of animals depends on other things, such as whether temperatures atnight are low enough for livestock to recover from the stress. During an ElNiño phase, heat stress degree-days tend to be slightly lower March throughMay and higher in the summer. La Niña reduces heat stress degree-days inJune and July. These differences are small compared to the total averageheat stress degree-days in spring and summer.
Part 11:
SLIDE
31
SLIDE
32
SLIDE
33

16 Using Climate Forecasts in Agriculture • Lesson Plan
SLIDE
34-40
The AgClimate Web Site
Time: 5-1Time: 5-1Time: 5-1Time: 5-1Time: 5-10 minut0 minut0 minut0 minut0 minuteseseseses
FFFFFocus: Descirbe the Aocus: Descirbe the Aocus: Descirbe the Aocus: Descirbe the Aocus: Descirbe the AgClimatgClimatgClimatgClimatgClimate We We We We Web siteb siteb siteb siteb site and the te and the te and the te and the te and the tools it prools it prools it prools it prools it prooooovidesvidesvidesvidesvidesfffffor pror pror pror pror produceroduceroduceroduceroducersssss
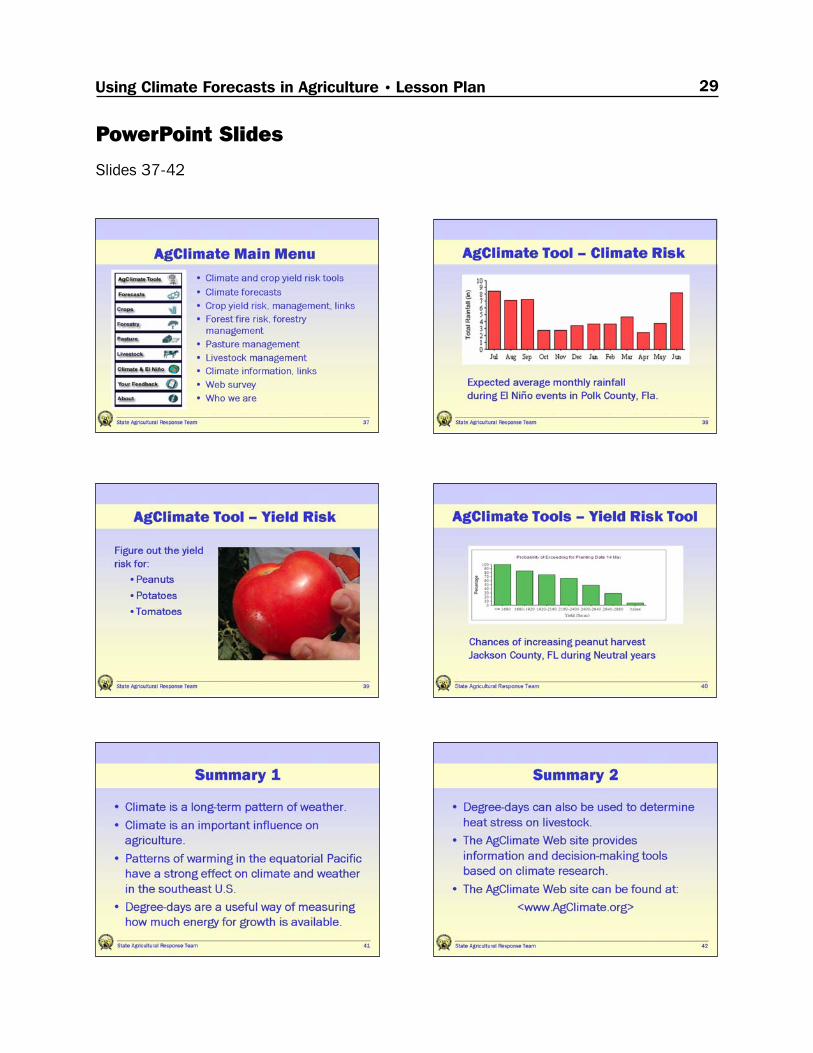
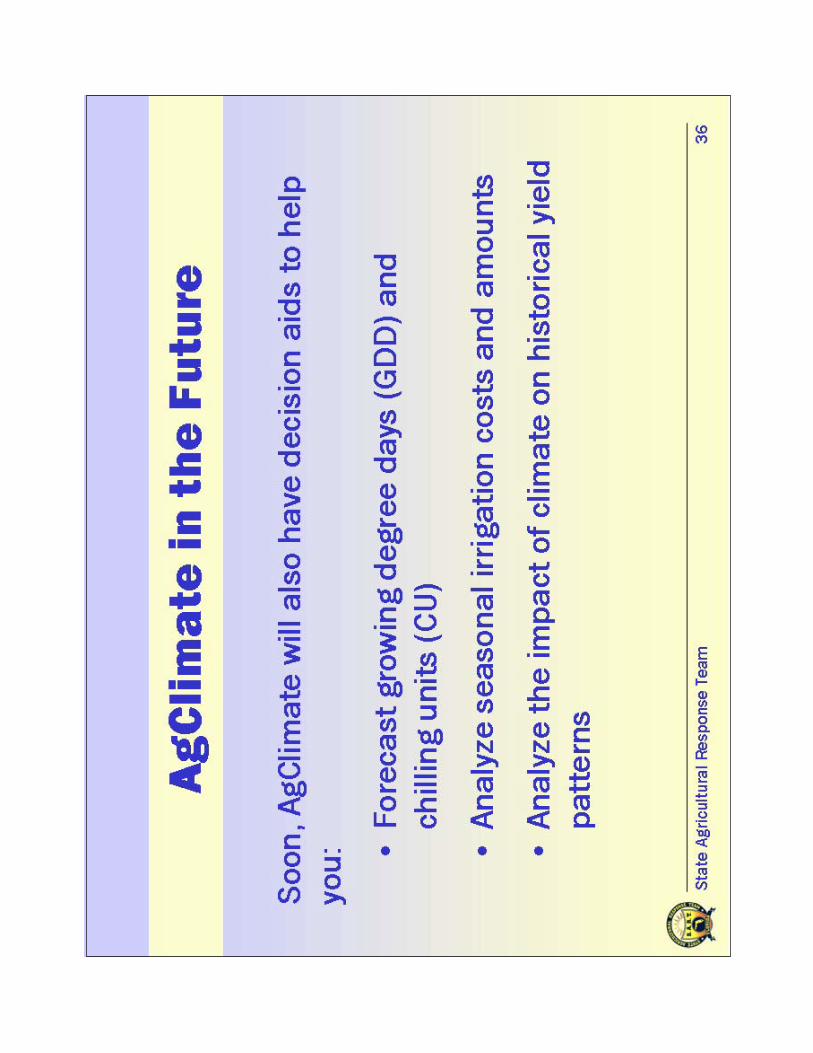
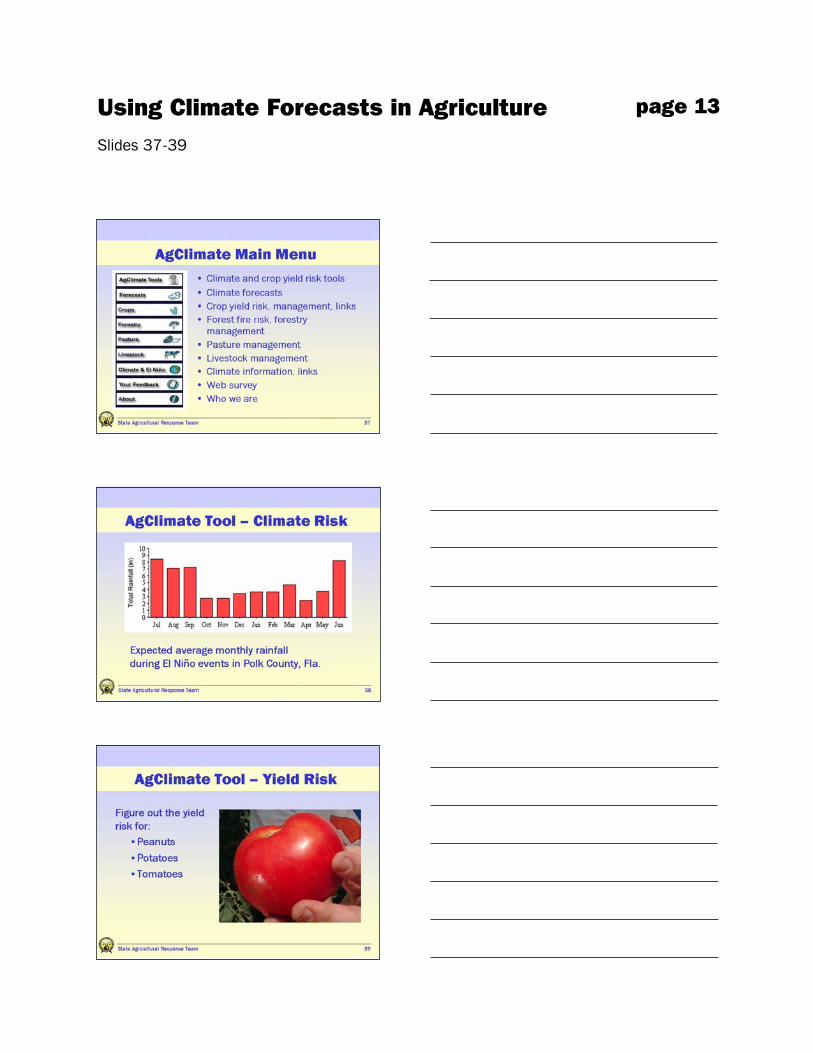
The AAAAAgClimatgClimatgClimatgClimatgClimateeeee Web site (http://www.agclimate.org) provides information andtools on how to deal with changing climate forecasts for each season in theSoutheast U.S. AAAAAgClimatgClimatgClimatgClimatgClimateeeee includes climate forecasts connected with riskmanagement tools and information for certain crops, forestry, pasture, andlivestock. The menu that helps you navigate the Web site has:
AAAAAgClimatgClimatgClimatgClimatgClimate Te Te Te Te Toolsoolsoolsoolsools: (a) ClimatClimatClimatClimatClimate Riske Riske Riske Riske Risk: Expected and past climate informa-tion, rain and average low and high temperatures for counties; and (b)HarHarHarHarHarvvvvvest Yield Riskest Yield Riskest Yield Riskest Yield Riskest Yield Risk: Expected yield based on soil type, planting date, andbasic management practices for peanuts, potatoes and tomatoes. Yieldforecasts exist for limited counties depending on the crop chosen.
ClimatClimatClimatClimatClimate Fe Fe Fe Fe Forecasts:orecasts:orecasts:orecasts:orecasts: Gives Southeast Climate Consortium (SECC) fore-casts and connections (links) to other Web sites for national and interna-tional climate forecasts. Also includes:
• County forecasts• Regional forecasts• National, linked to the National Oceanic Atmospheric Administration
(NOAA)• International, linking to the International Research Institute for Climate
Prediction (IRI)• El Niño Southern Oscillation (ENSO) forecast, reports current sea
surface temperature (SST) conditions and what ENSO condition isexpected to prevail during the next months
• Hurricane forecasts for current year and a summary of hurricaneforecasts from several sources
• Freeze forecasts
CrCrCrCrCrops:ops:ops:ops:ops: Gives producers management options and yield risk ratingsfitted to climate forecasts, in addition to links to extension resources,market information and commodity-related industry Web sites. Currently,peanuts, potatoes and tomatoes are in the system but are not finished.
FFFFForestrorestrorestrorestrorestry:y:y:y:y: Gives forest fire activity possibility forecast based on theKeetch-Byram Drought Index (KBDI). Also has management options forother climate scenarios as well as links to extension resources andindustry Web sites.
Part 12:

17Using Climate Forecasts in Agriculture • Lesson Plan
PPPPPasture and Livasture and Livasture and Livasture and Livasture and Livestestestestestock:ock:ock:ock:ock: Offers documentation of the effect of climatedifferences on pasture and hay and livestock production, such as plant-ing cool and warm season grasses, fertilization, grazing and stockingrates, forage quality and pasture improvement.
ClimatClimatClimatClimatClimate and El Niñoe and El Niñoe and El Niñoe and El Niñoe and El Niño: Provides background information about the El Niñoevent in the tropical Pacific and how it influences the climate of theSoutheast U.S., graphics and animation showing El Niño events’ impacton temperature and rain across the region. It also includes links togeneral climate and weather resources on the Worldwide Web.
“““““YYYYYour Four Four Four Four Feedback” eedback” eedback” eedback” eedback” and “ “ “ “ “AAAAAboutboutboutboutbout”: “Your Feedback” section collects knowl-edge, thoughts, attitudes, and possible use of seasonal climate forecastsfrom visitors to AgClimate. The “About” section covers AgClimate and theSECC.
SLIDE
41-43
Summary and Wrap-Up
Time: 5-1Time: 5-1Time: 5-1Time: 5-1Time: 5-10 minut0 minut0 minut0 minut0 minuteseseseses
Prior to answering your audience’s final questions or comment, provide asummary of key points from the training session:
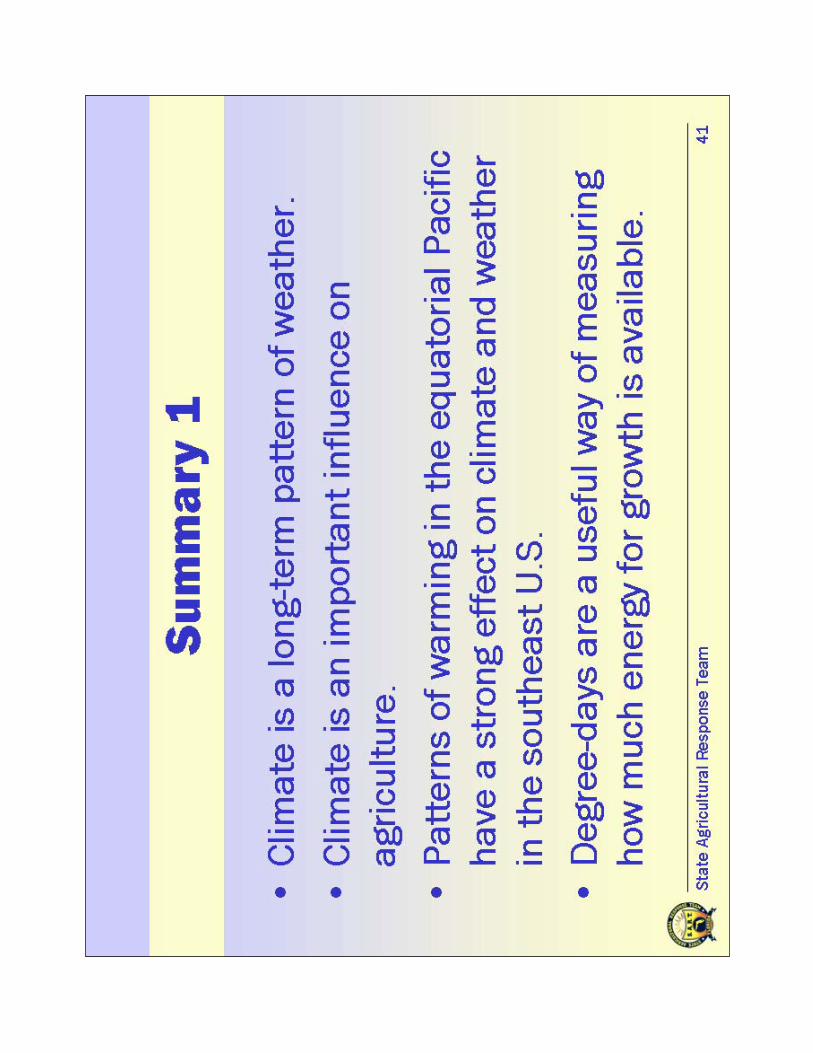
• Climate is a long-term pattern of weather.
• Climate is an important influence on weather.
• Patterns of warming in the equatorial Pacific have a strong effect onclimate and weather in the southeast U.S.
• Degree-days are a useful way of measuring how much energy for growth isavailable.
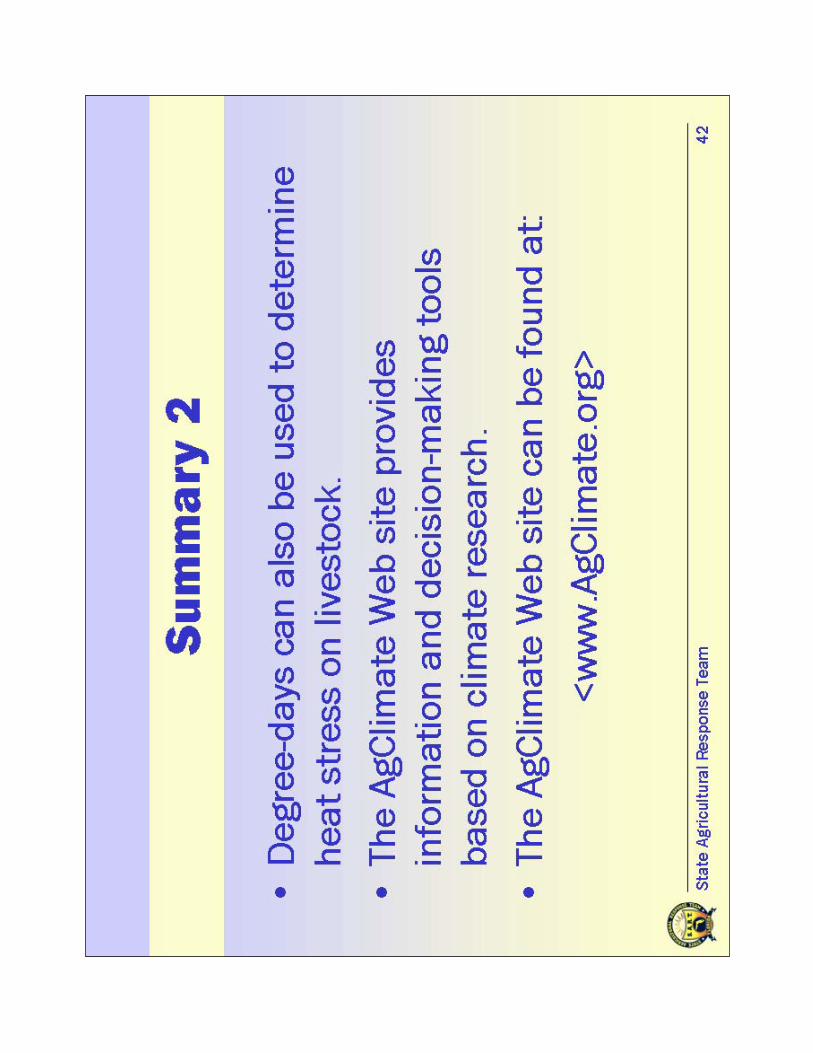
• Degree-days can also be used to determine heat stress in livestock.
• The AgClimate Web site provides information and decision-making toolsbased on climate research.
• The AgClimate Web site can be found at: <www.AgClimate.org>.
Thank your audience for their attention and participation. Encourage them tovisit the AgClimate Web site and learn more about the decision-making toolsit provides. Participants may wish to know about other training units relatedto climate. Visit the Florida SART Web site to find out more.
Part 13:

18
Participant’s Evaluation of Using Climate Forecasts in Agri-culture
Please circle the number that best expresses your opinions about the following statements.
Fully Dis- Neutral Agree FullyDis- Agree AgreeAgree
1. The training module’s format was appropriate.
2 The information presented is useful to me.
3. The time it took to complete this module wasacceptable.
4. The reasons that climate can pose risks toagriculture were explained.
5. The importance of climate forecastingwas explained in sufficient detail.
6. The climate phases -- El Niño, La Niña, andNeutral -- were adequately explained.
7. The influence of climate phases on rainfall,temperature, and several other factors wasadequately explained.
8. It was clearly explained that the AgClimateWeb site provides useful climate informationfor agricultural producers.
9. As a result of the session, you are likely tolook further into using the AgClimate Web site.
10. We welcome your comments about this program:
______________________________________________________________________________________________________________________________________
______________________________________________________________________________________________________________________________________
______________________________________________________________________________________________________________________________________
______________________________________________________________________________________________________________________________________
______________________________________________________________________________________________________________________________________
Please use the back of this sheet for any further comments.
Thank you for your time!
1 2 3 4 5
1 2 3 4 5
1 2 3 4 5
1 2 3 4 5
1 2 3 4 5
1 2 3 4 5
1 2 3 4 5
1 2 3 4 5
1 2 3 4 5
Using Climate Forecasts in Agriculture • Lesson Plan

19
Using Climate Forecasts in Agriculture Participant Pre-Test
This pre-test is intended to gauge the level of knowledge that you have before participating in the Using
Climate Forecasts in Agriculture training. Please answer all the following questions to the best of your ability.
1. What is the major difference between climate and weather?____________________________________________________________________
2. Climate forecasts can assist producers in what activity:____________________________________________________________________
3 Name the three important climate features caused by sea surface temperature:____________________________________________________________________________________________________________________________________________________________________________________________________________
4. The climate phases listed in question 3 affect Florida agriculture most strongly inwhat season? _____________
5. List six areas affected by the climate phases listed in question 3.________________________________ _________________________________________________________________ _________________________________________________________________ _________________________________
6. Which climate phase can cause winter temperatures to be lower than normal?_________________
7. However, damaging freezes are most likely during what climate phase?_________________
8. Degree-days are a measure of: _________________________________________________________________________________________________________________________________________________________________________________
9. List information items available through the AgClimate Web site that are most impor-tant to you.____________________________________________________________________________________________________________________________________________________________________________________________________________________________________________________________________________
Using Climate Forecasts in Agriculture • Lesson Plan

20 Using Climate Forecasts in Agriculture • Lesson Plan
Using Climate Forecasts in Agriculture Participant Post-Test
This post-test is intended to gauge the level of knowledge that you have after participating in the Using
Climate Forecasts in Agriculture training. Please answer all the following questions to the best of your ability.
1. What is the major difference between climate and weather?____________________________________________________________________
2. Climate forecasts can assist producers in what activity:____________________________________________________________________
3 Name the three important climate features caused by sea surface temperature:____________________________________________________________________________________________________________________________________________________________________________________________________________
4. The climate phases listed in question 3 affect Florida agriculture most strongly inwhat season? _____________
5. List six areas affected by the climate phases listed in question 3.________________________________ _________________________________________________________________ _________________________________________________________________ _________________________________
6. Which climate phase can cause winter temperatures to be lower than normal?_________________
7. However, damaging freezes are most likely during what climate phase?_________________
8. Degree-days are a measure of: _________________________________________________________________________________________________________________________________________________________________________________
9. List information items available through the AgClimate Web site that are most impor-tant to you.____________________________________________________________________________________________________________________________________________________________________________________________________________________________________________________________________________

21
Answer Key to Climate Forecasts in Agriculture Pre- andPost-Tests
11111..... What is the major difWhat is the major difWhat is the major difWhat is the major difWhat is the major difffffference beerence beerence beerence beerence betwtwtwtwtween climateen climateen climateen climateen climate and we and we and we and we and weather?eather?eather?eather?eather?long-term versus short-term; duration; length of time
2.2.2.2.2. ClimatClimatClimatClimatClimate fe fe fe fe forecasts can assist prorecasts can assist prorecasts can assist prorecasts can assist prorecasts can assist produceroduceroduceroduceroducers in what activity:s in what activity:s in what activity:s in what activity:s in what activity:planning; decision-making (some may list specific tasks, such as planting, etc.)
33333 Name the three imName the three imName the three imName the three imName the three imporporporporportant climattant climattant climattant climattant climate fe fe fe fe features caused beatures caused beatures caused beatures caused beatures caused by sea sury sea sury sea sury sea sury sea surfffffaceaceaceaceacetttttemememememperature:perature:perature:perature:perature:El Niño, La Niña, and Neutral
4.4.4.4.4. The climatThe climatThe climatThe climatThe climate phases liste phases liste phases liste phases liste phases listed in qed in qed in qed in qed in question 3 afuestion 3 afuestion 3 afuestion 3 afuestion 3 affffffect Florida agriculture most strect Florida agriculture most strect Florida agriculture most strect Florida agriculture most strect Florida agriculture most strongly inongly inongly inongly inongly inwhat season?what season?what season?what season?what season?winter
5.5.5.5.5. List six areas afList six areas afList six areas afList six areas afList six areas affffffectectectectected bed bed bed bed by the climaty the climaty the climaty the climaty the climate phases liste phases liste phases liste phases liste phases listed in qed in qed in qed in qed in question 3.uestion 3.uestion 3.uestion 3.uestion 3.rainfall , temperature, freezes, hurricanes, wild fires, crop production
6.6.6.6.6. Which climatWhich climatWhich climatWhich climatWhich climate phase can cause winte phase can cause winte phase can cause winte phase can cause winte phase can cause winter ter ter ter ter temememememperatures tperatures tperatures tperatures tperatures to be loo be loo be loo be loo be lowwwwwer than normal?er than normal?er than normal?er than normal?er than normal?El Niño
77777..... HoHoHoHoHowwwwweeeeevvvvvererererer, damaging freezes are most lik, damaging freezes are most lik, damaging freezes are most lik, damaging freezes are most lik, damaging freezes are most likely during what climately during what climately during what climately during what climately during what climate phase?e phase?e phase?e phase?e phase?Neutral
8.8.8.8.8. Degree-daDegree-daDegree-daDegree-daDegree-days are a measure of:ys are a measure of:ys are a measure of:ys are a measure of:ys are a measure of:the energy available for plant growht or development
9.9.9.9.9. List infList infList infList infList information itormation itormation itormation itormation items aems aems aems aems avvvvvailable thrailable thrailable thrailable thrailable through the Aough the Aough the Aough the Aough the AgClimatgClimatgClimatgClimatgClimate We We We We Web siteb siteb siteb siteb site that are moste that are moste that are moste that are moste that are mostimimimimimporporporporportant ttant ttant ttant ttant to yo yo yo yo you.ou.ou.ou.ou.(Answers will vary.)
Using Climate Forecasts in Agriculture • Lesson Plan

22 Using Climate Forecasts in Agriculture • Lesson Plan

23
PowerPoint Slides
Slides 1-6
Using Climate Forecasts in Agriculture• Lesson Plan

24
PowerPoint Slides
Slides 7-12
Using Climate Forecasts in Agriculture • Lesson Plan
25
PowerPoint Slides
Slides 13-18
Using Climate Forecasts in Agriculture • Lesson Plan

26
PowerPoint Slides
Slides 19-24
Using Climate Forecasts in Agriculture • Lesson Plan

27
PowerPoint Slides
Slides 25-30
Using Climate Forecasts in Agriculture • Lesson Plan

28
PowerPoint Slides
Slides 31-36
Using Climate Forecasts in Agriculture • Lesson Plan
29
PowerPoint Slides
Slides 37-42
Using Climate Forecasts in Agriculture • Lesson Plan

30 Using Climate Forecasts in Agriculture • Lesson Plan
PowerPoint Slides
Slides 43

31
PowerPoint Slides
The “Using Climate Forecasts in Agriculture”PowerPoint slides are reproduced full-size onthe following pages. You can use these pagesas a display or photocopy them onto plasticoverhead sheets for use with an overheadprojector.
Color versions of these slides can be down-loaded from the SART Web site:
<www.flsart.org>.
Using Climate Forecasts in Agriculture • Lesson Plan

[ SLID
E 1 ]
[ SLID
E 1 ]
[ SLID
E 1 ]
[ SLID
E 1 ]
[ SLID
E 1 ]

Slide 1

[ SLID
E 2 ]
[ SLID
E 2 ]
[ SLID
E 2 ]
[ SLID
E 2 ]
[ SLID
E 2 ]


[ SLID
E 3 ]
[ SLID
E 3 ]
[ SLID
E 3 ]
[ SLID
E 3 ]
[ SLID
E 3 ]


[ SLID
E 4 ]
[ SLID
E 4 ]
[ SLID
E 4 ]
[ SLID
E 4 ]
[ SLID
E 4 ]


[ SLID
E 5 ]
[ SLID
E 5 ]
[ SLID
E 5 ]
[ SLID
E 5 ]
[ SLID
E 5 ]


[ SLID
E 6 ]
[ SLID
E 6 ]
[ SLID
E 6 ]
[ SLID
E 6 ]
[ SLID
E 6 ]


[ SLID
E 7 ]
[ SLID
E 7 ]
[ SLID
E 7 ]
[ SLID
E 7 ]
[ SLID
E 7 ]


[ SLID
E 8 ]
[ SLID
E 8 ]
[ SLID
E 8 ]
[ SLID
E 8 ]
[ SLID
E 8 ]


[ SLID
E 9 ]
[ SLID
E 9 ]
[ SLID
E 9 ]
[ SLID
E 9 ]
[ SLID
E 9 ]


[ SLID
E 1[ S
LIDE 1
[ SLID
E 1[ S
LIDE 1
[ SLID
E 10
]0
]0
]0
]0
]

[ SLID
E 11
][ S
LIDE 1
1 ]
[ SLID
E 11
][ S
LIDE 1
1 ]
[ SLID
E 11
]


[ SLID
E 1[ S
LIDE 1
[ SLID
E 1[ S
LIDE 1
[ SLID
E 12
]2
]2
]2
]2
]


[ SLID
E 1[ S
LIDE 1
[ SLID
E 1[ S
LIDE 1
[ SLID
E 13
]3
]3
]3
]3
]


[ SLID
E 1[ S
LIDE 1
[ SLID
E 1[ S
LIDE 1
[ SLID
E 14
]4
]4
]4
]4
]


[ SLID
E 15
][ S
LIDE 1
5 ]
[ SLID
E 15
][ S
LIDE 1
5 ]
[ SLID
E 15
]

[ SLID
E 1[ S
LIDE 1
[ SLID
E 1[ S
LIDE 1
[ SLID
E 16
]6
]6
]6
]6
]


[ SLID
E 1[ S
LIDE 1
[ SLID
E 1[ S
LIDE 1
[ SLID
E 17 ]
7 ]
7 ]
7 ]
7 ]

[ SLID
E 1[ S
LIDE 1
[ SLID
E 1[ S
LIDE 1
[ SLID
E 18
]8
]8
]8
]8
]


[ SLID
E 19
][ S
LIDE 1
9 ]
[ SLID
E 19
][ S
LIDE 1
9 ]
[ SLID
E 19
]

[ SLID
E 20
][ S
LIDE 2
0 ]
[ SLID
E 20
][ S
LIDE 2
0 ]
[ SLID
E 20
]

[ SLID
E 2[ S
LIDE 2
[ SLID
E 2[ S
LIDE 2
[ SLID
E 21
]1
]1
]1
]1
]


[ SLID
E 22
][ S
LIDE 2
2 ]
[ SLID
E 22
][ S
LIDE 2
2 ]
[ SLID
E 22
]


[ SLID
E 23
][ S
LIDE 2
3 ]
[ SLID
E 23
][ S
LIDE 2
3 ]
[ SLID
E 23
]


[ SLID
E 2[ S
LIDE 2
[ SLID
E 2[ S
LIDE 2
[ SLID
E 24
]4
]4
]4
]4
]


[ SLID
E 25
][ S
LIDE 2
5 ]
[ SLID
E 25
][ S
LIDE 2
5 ]
[ SLID
E 25
]


[ SLID
E 26
][ S
LIDE 2
6 ]
[ SLID
E 26
][ S
LIDE 2
6 ]
[ SLID
E 26
]


[ SLID
E 2[ S
LIDE 2
[ SLID
E 2[ S
LIDE 2
[ SLID
E 27
]7
]7
]7
]7
]


[ SLID
E 28
][ S
LIDE 2
8 ]
[ SLID
E 28
][ S
LIDE 2
8 ]
[ SLID
E 28
]


[ SLID
E 29
][ S
LIDE 2
9 ]
[ SLID
E 29
][ S
LIDE 2
9 ]
[ SLID
E 29
]


[ SLID
E 30
][ S
LIDE 3
0 ]
[ SLID
E 30
][ S
LIDE 3
0 ]
[ SLID
E 30
]


[ SLID
E 3[ S
LIDE 3
[ SLID
E 3[ S
LIDE 3
[ SLID
E 31
]1
]1
]1
]1
]


[ SLID
E 32
][ S
LIDE 3
2 ]
[ SLID
E 32
][ S
LIDE 3
2 ]
[ SLID
E 32
]


[ SLID
E 33
][ S
LIDE 3
3 ]
[ SLID
E 33
][ S
LIDE 3
3 ]
[ SLID
E 33
]

[ SLID
E 34
][ S
LIDE 3
4 ]
[ SLID
E 34
][ S
LIDE 3
4 ]
[ SLID
E 34
]


[ SLID
E 35
][ S
LIDE 3
5 ]
[ SLID
E 35
][ S
LIDE 3
5 ]
[ SLID
E 35
]


[ SLID
E 36
][ S
LIDE 3
6 ]
[ SLID
E 36
][ S
LIDE 3
6 ]
[ SLID
E 36
]

[ SLID
E 3[ S
LIDE 3
[ SLID
E 3[ S
LIDE 3
[ SLID
E 37
]7
]7
]7
]7
]


[ SLID
E 38
][ S
LIDE 3
8 ]
[ SLID
E 38
][ S
LIDE 3
8 ]
[ SLID
E 38
]


[ SLID
E 39
][ S
LIDE 3
9 ]
[ SLID
E 39
][ S
LIDE 3
9 ]
[ SLID
E 39
]


[ SLID
E 40
][ S
LIDE 4
0 ]
[ SLID
E 40
][ S
LIDE 4
0 ]
[ SLID
E 40
]


[ SLID
E 4[ S
LIDE 4
[ SLID
E 4[ S
LIDE 4
[ SLID
E 41
]1
]1
]1
]1
]

[ SLID
E 42
][ S
LIDE 4
2 ]
[ SLID
E 42
][ S
LIDE 4
2 ]
[ SLID
E 42
]

[ SLID
E 43
][ S
LIDE 4
3 ]
[ SLID
E 43
][ S
LIDE 4
3 ]
[ SLID
E 43
]


119
PowerPoint Slides — Handout Pages
The “Using Climate Forecasts in Agriculture”PowerPoint slides are reproduced on the followingpages at reduced size with space for participantnotes.
Also included in Using Climate Forecasts in Agri-
culture Workbook, available on the SART Web site:
<www.flsart.org>
Introducing SART • Lesson Plan

Using Climate Forecasts in AgricultureSlides 1-3
page 1

Using Climate Forecasts in AgricultureSlides 4-6
page 2

Using Climate Forecasts in AgricultureSlides 7-9
page 3

Using Climate Forecasts in AgricultureSlides 10-12
page 4

Using Climate Forecasts in AgricultureSlides 13-15
page 5
Using Climate Forecasts in AgricultureSlides 16-18
page 6

Using Climate Forecasts in AgricultureSlides 19-21
page 7

Using Climate Forecasts in AgricultureSlides 22-24
page 8

Using Climate Forecasts in AgricultureSlides 25-27
page 9
Using Climate Forecasts in AgricultureSlides 28-30
page 10
Using Climate Forecasts in AgricultureSlides 31-33
page 11

Using Climate Forecasts in AgricultureSlides 34-36
page 12
Using Climate Forecasts in AgricultureSlides 37-39
page 13

Using Climate Forecasts in AgricultureSlides 40-42
page 14

Using Climate Forecasts in AgricultureSlides 43
page 15