Using Circuit-Level Power Measurements in Household Energy ...
6
Using Circuit-Level Power Measurements in Household Energy Management Systems * Alan Marchiori and Qi Han Department of Mathematical and Computer Sciences Colorado School of Mines {amarchio,qhan}@mines.edu Abstract The first requirement for any intelligent household energy management system is to be able to accurately measure en- ergy usage in the home. Measuring energy usage is not dif- ficult, however we must decide what to measure. Whole- home energy measurement is cheap and easy to setup be- cause only one sensor is placed where the home connects to the power grid. The collected data can provide useful in- formation for large appliances. However, the only way to monitor the energy usage of smaller devices is to install an energy meter on every device of interest. This creates a very detailed picture of household energy consumption, but re- quires a lot of additional hardware–one meter per device in the home. This paper explores an alternative, more practi- cal, approach to monitor household energy usage including small devices. Our approach uses circuit-level power mea- surements and a new method to separate aggregate data into device-level estimates. Our initial evaluation resulted in an average error less than 5.35% for three devices with good response to changing device state. We therefore believe that this approach, coupled with a device-level control system, would create an ideal architecture for the next generation of household energy management systems. Categories and Subject Descriptors J.2 [Physical Sciences and Engineering]: Engineering Keywords household energy management, nonintrusive load moni- toring * This work was supported in part by the U. S. Department of Energy (through the National Renewable Energy Laboratory under contract number DE-AC36-08GO28308). Permission to make digital or hard copies of all or part of this work for personal or classroom use is granted without fee provided that copies are not made or distributed for profit or commercial advantage and that copies bear this notice and the full citation on the first page. To copy otherwise, to republish, to post on servers or to redistribute to lists, requires prior specific permission and/or a fee. BuildSys’09, November 3, 2009, Berkeley, CA, USA. Copyright 2009 ACM 978-1-60558-824-7 ...$5.00 1 Introduction We believe the first step towards reducing energy con- sumption in buildings is a practical way to monitor detailed energy consumption. There are two existing approaches to household energy monitoring: 1) nonintrusive load monitor- ing (NILM) where aggregate energy usage is measured by a single meter as power enters the home and 2) complex in- strumentation systems where each device’s energy consump- tion is individually metered. NILM is attractive because it is easy; only one energy meter is required to monitor whole- house energy consumption. The whole-house data is an- alyzed and step changes in power usage are matched to a database of loads (e.g. a 500 watt step might represent a refrigerator turning on). This approach works remarkably well for large (over 150 watt) loads that operate as simple ON/OFF devices or with very simple operating states such as high/medium/low [4]. Low powered loads and those with a large number of device states, such as a dishwasher, or con- tinuously variable energy usage, such as an electric stove, are very difficult to extract from whole-house measurements. The other approach is to measure every load of interest in the home. ACme is a high-fidelity AC metering network that uses a wireless sensor node equipped with a digital energy meter to provide very accurate energy measurements of sin- gle devices [5]. This provides very accurate data for each device but would require a significant investment in equip- ment to monitor every device in a home. In this paper we propose circuit-level energy measure- ments as a compromise between these two approaches. In residential buildings power enters the building and is dis- tributed through the house at an electrical service panel. This provides a good location to measure circuit-level energy con- sumption. From these energy measurements we can apply a disaggregation algorithm inspired by NILM to identify and separate the individual device’s energy usage. By measuring energy usage at the circuit level we can overcome the inabil- ity of whole-house NILM to monitor small or variable power devices. This is because a) there are fewer devices on each circuit, and b) high-powered devices (stove, hot water heater, air conditioner, clothes dryer, etc) each receive dedicated cir- cuits and will not interfere with lower-powered devices (TV, radios, cell phone charger, etc). A complete household energy management system is be- yond the scope of this paper, however, we believe that such a system would integrate both measurement and control func- 7
Transcript of Using Circuit-Level Power Measurements in Household Energy ...

Using Circuit-Level Power Measurements in Household EnergyManagement Systems!
Alan Marchiori and Qi HanDepartment of Mathematical and Computer Sciences
Colorado School of Mines{amarchio,qhan}@mines.edu
AbstractThe first requirement for any intelligent household energy
management system is to be able to accurately measure en-ergy usage in the home. Measuring energy usage is not dif-ficult, however we must decide what to measure. Whole-home energy measurement is cheap and easy to setup be-cause only one sensor is placed where the home connects tothe power grid. The collected data can provide useful in-formation for large appliances. However, the only way tomonitor the energy usage of smaller devices is to install anenergy meter on every device of interest. This creates a verydetailed picture of household energy consumption, but re-quires a lot of additional hardware–one meter per device inthe home. This paper explores an alternative, more practi-cal, approach to monitor household energy usage includingsmall devices. Our approach uses circuit-level power mea-surements and a new method to separate aggregate data intodevice-level estimates. Our initial evaluation resulted in anaverage error less than 5.35% for three devices with goodresponse to changing device state. We therefore believe thatthis approach, coupled with a device-level control system,would create an ideal architecture for the next generation ofhousehold energy management systems.
Categories and Subject DescriptorsJ.2 [Physical Sciences and Engineering]: Engineering
Keywordshousehold energy management, nonintrusive load moni-
toring
!This work was supported in part by the U. S. Department ofEnergy (through the National Renewable Energy Laboratory undercontract number DE-AC36-08GO28308).
Permission to make digital or hard copies of all or part of this work for personal orclassroom use is granted without fee provided that copies are not made or distributedfor profit or commercial advantage and that copies bear this notice and the full citationon the first page. To copy otherwise, to republish, to post on servers or to redistributeto lists, requires prior specific permission and/or a fee.BuildSys’09, November 3, 2009, Berkeley, CA, USA.Copyright 2009 ACM 978-1-60558-824-7 ...$5.00
1 IntroductionWe believe the first step towards reducing energy con-
sumption in buildings is a practical way to monitor detailedenergy consumption. There are two existing approaches tohousehold energy monitoring: 1) nonintrusive load monitor-ing (NILM) where aggregate energy usage is measured bya single meter as power enters the home and 2) complex in-strumentation systems where each device’s energy consump-tion is individually metered. NILM is attractive because it iseasy; only one energy meter is required to monitor whole-house energy consumption. The whole-house data is an-alyzed and step changes in power usage are matched to adatabase of loads (e.g. a 500 watt step might represent arefrigerator turning on). This approach works remarkablywell for large (over 150 watt) loads that operate as simpleON/OFF devices or with very simple operating states such ashigh/medium/low [4]. Low powered loads and those with alarge number of device states, such as a dishwasher, or con-tinuously variable energy usage, such as an electric stove,are very difficult to extract from whole-house measurements.The other approach is to measure every load of interest inthe home. ACme is a high-fidelity AC metering network thatuses a wireless sensor node equipped with a digital energymeter to provide very accurate energy measurements of sin-gle devices [5]. This provides very accurate data for eachdevice but would require a significant investment in equip-ment to monitor every device in a home.
In this paper we propose circuit-level energy measure-ments as a compromise between these two approaches. Inresidential buildings power enters the building and is dis-tributed through the house at an electrical service panel. Thisprovides a good location to measure circuit-level energy con-sumption. From these energy measurements we can apply adisaggregation algorithm inspired by NILM to identify andseparate the individual device’s energy usage. By measuringenergy usage at the circuit level we can overcome the inabil-ity of whole-house NILM to monitor small or variable powerdevices. This is because a) there are fewer devices on eachcircuit, and b) high-powered devices (stove, hot water heater,air conditioner, clothes dryer, etc) each receive dedicated cir-cuits and will not interfere with lower-powered devices (TV,radios, cell phone charger, etc).
A complete household energy management system is be-yond the scope of this paper, however, we believe that such asystem would integrate both measurement and control func-
7
!"#$%&'()%#*+,%)-#.+/0&1%-#
&23#4)%5(%267
8"#9+):&/;<%
="#>)%&0%#?;'0+1)&:
>+//%60#:&27#
'&:@/%'
A%@%&0#
B+)#%&6C#
3%D;6%
E"#>/('0%)
F"#>+:@(0%#$&G;:(:#
H;I%/;C++3#>/&'';B;%)
J"#$%)1%#>/&'';B;%)'
(a) Training
!"#$%&'()%#*+,%)-#.+/0&1%-#
&23#4)%5(%267
8"#9+):&/;<%
="#>/&'';?7="#>/&'';?7
@"#4;23#$&A;:(:#B;C%/;D++3
E+/(0;+2
F"#GHH/7#B;2%&)#E:++0D;21
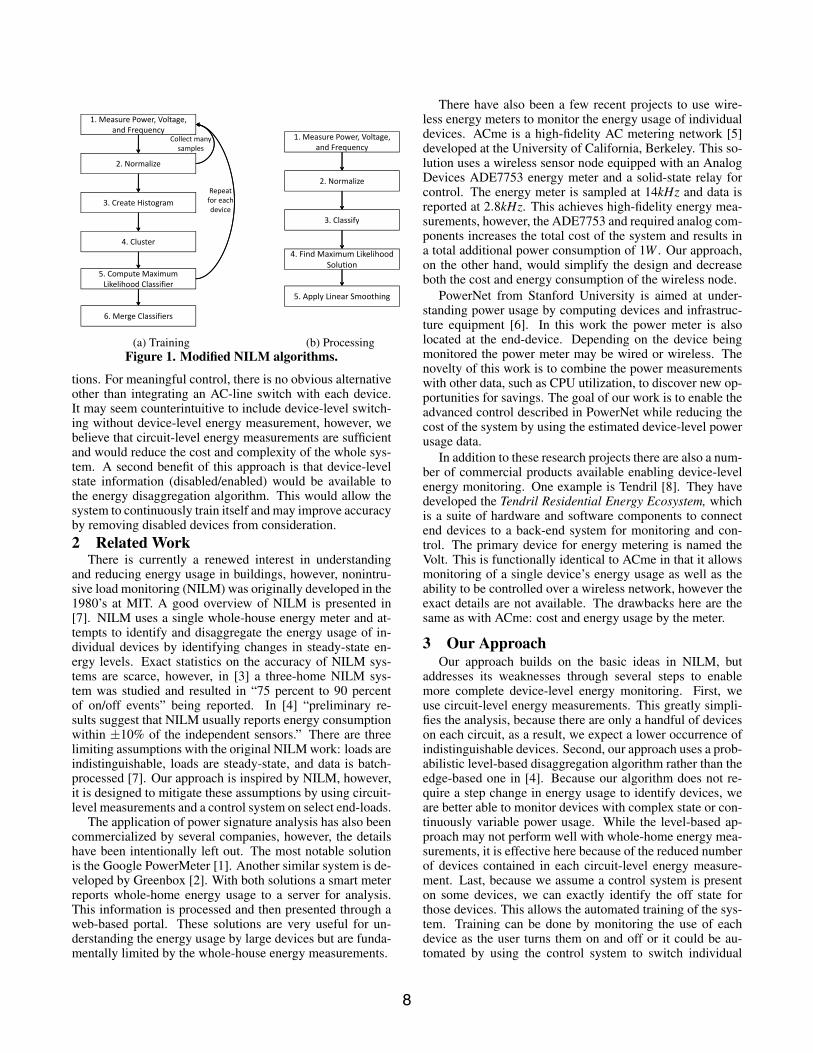
(b) ProcessingFigure 1. Modified NILM algorithms.
tions. For meaningful control, there is no obvious alternativeother than integrating an AC-line switch with each device.It may seem counterintuitive to include device-level switch-ing without device-level energy measurement, however, webelieve that circuit-level energy measurements are sufficientand would reduce the cost and complexity of the whole sys-tem. A second benefit of this approach is that device-levelstate information (disabled/enabled) would be available tothe energy disaggregation algorithm. This would allow thesystem to continuously train itself and may improve accuracyby removing disabled devices from consideration.2 Related Work
There is currently a renewed interest in understandingand reducing energy usage in buildings, however, nonintru-sive load monitoring (NILM) was originally developed in the1980’s at MIT. A good overview of NILM is presented in[7]. NILM uses a single whole-house energy meter and at-tempts to identify and disaggregate the energy usage of in-dividual devices by identifying changes in steady-state en-ergy levels. Exact statistics on the accuracy of NILM sys-tems are scarce, however, in [3] a three-home NILM sys-tem was studied and resulted in “75 percent to 90 percentof on/off events” being reported. In [4] “preliminary re-sults suggest that NILM usually reports energy consumptionwithin ±10% of the independent sensors.” There are threelimiting assumptions with the original NILM work: loads areindistinguishable, loads are steady-state, and data is batch-processed [7]. Our approach is inspired by NILM, however,it is designed to mitigate these assumptions by using circuit-level measurements and a control system on select end-loads.
The application of power signature analysis has also beencommercialized by several companies, however, the detailshave been intentionally left out. The most notable solutionis the Google PowerMeter [1]. Another similar system is de-veloped by Greenbox [2]. With both solutions a smart meterreports whole-home energy usage to a server for analysis.This information is processed and then presented through aweb-based portal. These solutions are very useful for un-derstanding the energy usage by large devices but are funda-mentally limited by the whole-house energy measurements.
There have also been a few recent projects to use wire-less energy meters to monitor the energy usage of individualdevices. ACme is a high-fidelity AC metering network [5]developed at the University of California, Berkeley. This so-lution uses a wireless sensor node equipped with an AnalogDevices ADE7753 energy meter and a solid-state relay forcontrol. The energy meter is sampled at 14kHz and data isreported at 2.8kHz. This achieves high-fidelity energy mea-surements, however, the ADE7753 and required analog com-ponents increases the total cost of the system and results ina total additional power consumption of 1W . Our approach,on the other hand, would simplify the design and decreaseboth the cost and energy consumption of the wireless node.
PowerNet from Stanford University is aimed at under-standing power usage by computing devices and infrastruc-ture equipment [6]. In this work the power meter is alsolocated at the end-device. Depending on the device beingmonitored the power meter may be wired or wireless. Thenovelty of this work is to combine the power measurementswith other data, such as CPU utilization, to discover new op-portunities for savings. The goal of our work is to enable theadvanced control described in PowerNet while reducing thecost of the system by using the estimated device-level powerusage data.
In addition to these research projects there are also a num-ber of commercial products available enabling device-levelenergy monitoring. One example is Tendril [8]. They havedeveloped the Tendril Residential Energy Ecosystem, whichis a suite of hardware and software components to connectend devices to a back-end system for monitoring and con-trol. The primary device for energy metering is named theVolt. This is functionally identical to ACme in that it allowsmonitoring of a single device’s energy usage as well as theability to be controlled over a wireless network, however theexact details are not available. The drawbacks here are thesame as with ACme: cost and energy usage by the meter.
3 Our ApproachOur approach builds on the basic ideas in NILM, but
addresses its weaknesses through several steps to enablemore complete device-level energy monitoring. First, weuse circuit-level energy measurements. This greatly simpli-fies the analysis, because there are only a handful of deviceson each circuit, as a result, we expect a lower occurrence ofindistinguishable devices. Second, our approach uses a prob-abilistic level-based disaggregation algorithm rather than theedge-based one in [4]. Because our algorithm does not re-quire a step change in energy usage to identify devices, weare better able to monitor devices with complex state or con-tinuously variable power usage. While the level-based ap-proach may not perform well with whole-home energy mea-surements, it is effective here because of the reduced numberof devices contained in each circuit-level energy measure-ment. Last, because we assume a control system is presenton some devices, we can exactly identify the off state forthose devices. This allows the automated training of the sys-tem. Training can be done by monitoring the use of eachdevice as the user turns them on and off or it could be au-tomated by using the control system to switch individual
8

! "! #! $! %! &!
'
("%
("#
("!
()
(*
(%
(#
!
+
(a) Measured Data
! "! #! $! %! &!
'
("%
("#
("!
()
(*
(%
(#
!
+
(b) Histogram
! "! #! $! %! &!
'
("%
("#
("!
()
(*
(%
(#
!
+
(c) Thinned HistogramFigure 2. Training data for a low-power computer.
devices and monitor the measured effect on power usage.Both proposed training methods are autonomous and gen-erate samples of each individual device’s power usage.
Figure 1 shows the steps in our NILM algorithm forcircuit-level measurements. Step (1): Training (Figure 1a)and processing (Figure 1b) both begin by measuring the real(P) and reactive (Q) power along with the line voltage andfrequency once per second. Step (2): The power measure-ments are then normalized to a 120V line voltage as in [4].We are currently not using the frequency information, but itis collected in case it is later found to be useful.
Step (3): Continuing the training process, we then con-struct a 2-dimensional histogram in P"Q space. Step (4):From this histogram we create clusters that correspond to thedifferent states of the device. Our clustering approach usesthinning of the histogram to compute the location and num-ber of clusters. The thinning process first discards outlierswith less than 0.1 percent of the data. The next step is to findlocal peaks, where all the adjacent cells have lower value.It then increases the value of the peak while decreasing thevalue of the neighboring cells. The peak thinning process re-peats until every neighboring cell of the local peak has neigh-bors that are all zero. The number of peaks determines thenumber of states, K. To classify a point we compute the costto move from the unknown point in P"Q space to each peak.The (non-thinned) histogram value at each peak is the heightof the peak. If we walk from the unknown point in a straightline towards the peak, the cost is the sum of the steps neededto reach the peak. If the height decreases we know there isa different peak that is closer, so we can eliminate the cur-rent class as a solution. If we reach a point with zero heightwe immediately disregard that peak. The lowest cost solu-tion determines which cluster the unknown point belongs toand if there are no peaks reachable from the current loca-tion, the point does not belong to any of the device’s classes.Step (5): We use this process to classify each cell of the his-togram we compute a pdf for each of the K classes. The pdfhas the same dimensions as the histogram and represents theprobability of being in that cell conditioned on the devicebeing in the state identified by the classifier. The pdf is usedin the merge process to compute the maximum likelihoodmerged classifier. Step (6): The merging process creates aclassifier by computing all possible combinations of individ-ual device states and their probability. When there is overlapin the merged classifier the set of classes that maximizes thejoint probability is used. One thing to note is that the mergedclassifier appears blurred when compared to the individual
classifiers. This is due to quantization error in the combinedmeasurements. For example, if we have two classifiers witha 1Watt2 cell size the points in the rectangle with corners at(0,0) and (1,1) are placed in the first histogram cell. Whenwe merge the classifier we must account for the fact that thisrange of values is possible, so the resulting merged range in-cludes the four cells contained by the rectangle with cornersat (0,0), (2,2).
After the combined classifier is created, we can use itto decompose the circuit-level energy measurement intodevice-level energy estimates using the process shown inFigure 1b. After measuring and normalizing the power datathe next step is to use the combined classifier to classify themost likely state for each device (Step 3). Next, we go backto the individual devices’ histograms and find the most likelyenergy usage of each individual device that results in thesame total energy as was measurement (Step 4). The resultis limited to the resolution of the histograms, so we lineallysmooth the result so that the sum equals the measured value(Step 5). An example of this process is given in Section 4.
4 Initial ResultsTo explore our approach for circuit-level non-intrusive
load monitoring we have setup an experiment using threeWattNotes from Continental Control Systems, LLC. EachWattNode measures power, voltage, and frequency once persecond with ±1.0% accuracy while using less than 2 Wattsof power. One WattNode acts as the circuit-level power me-ter monitoring three devices: a low-power PC, an LCD, anda desk lamp. The low-power PC and LCD are also individu-ally monitored with a WattNode to record actual device-levelenergy usage. The desk lamp’s actual power usage is com-puted by subtracting the PC and LCD usage from the total.The power used by the WattNodes themselves are not in-cluded in the measured values.
The measurements and computational steps in creatingthe PC classifier are shown in Figure 2. Figure 2a showsthe raw power data plotted in P"Q space. The few sam-ples between the two clusters represent the transient createdby switching between standby and active mode. The outlierdetection step in the thinning process successfully identifiedand removed these samples. Figure 2b shows the histogramof the raw data using a bin size of 1 Watt in each dimension.The histogram is then thinned to determine the number of de-vice states. Figure 2c shows the computed peaks where eachpeak represents the most likely measurement in each state.This process is repeated for each device (PC, LCD, and desk
9

! "! #! $! %! &!
'
("%
("#
("!
()
(*
(%
(#
!
+
,-- ./01234 56/" 56/# 56/$
56/%
(a) PC Classifier
! " #! #" $! $"
%
&#!
&'
&(
&)
&*
&"
&+
&,
&$
&#
!
-
./01234 566 51
(b) LCD Classifier
! " # $ % &! &" &#
'
()
(#
(*
("
(&
!
+
,-- ,.
(c) Lamp ClassifierFigure 3. Computed Classifiers.
! "! #! $! %! &! '! (! )!
*
+#!
+"&
+"!
+&
!
,
*-./00123-4.56789:;1237<=./00 *-./00123-4./001237<=./00 *-.56789:;123-4.56789:;1237<=./00
*-.56789:;123-4./001237<=./00 *-./00123-4.56789:;1237<=./8 *-./00123-4./001237<=./8
*-.56789:;123-4.56789:;1237<=./8 *-.56789:;123-4./001237<=./8 *-./00123-4.>?6@AB1237<=./00
*-.56789:;123-4.>?6@AB1237<=./00 *-./00123-4.>?6@AB1237<=./8 *-.>?6"123-4.56789:;1237<=./00
*-.>?6"123-4./001237<=./00 *-.>?6#123-4.56789:;1237<=./00 *-.56789:;123-4.>?6@AB1237<=./8
*-.>?6#123-4./001237<=./00 *-.>?6$123-4./001237<=./00 *-.>?6$123-4.56789:;1237<=./00
*-.>?6%123-4.56789:;1237<=./00 *-.>?6%123-4./001237<=./00 *-.>?6"123-4.56789:;1237<=./8
*-.>?6"123-4./001237<=./8 *-.>?6"123-4.>?6@AB1237<=./00 *-.>?6#123-4.56789:;1237<=./8
*-.>?6#123-4./001237<=./8 *-.>?6$123-4./001237<=./8 *-.>?6$123-4.56789:;1237<=./8
*-.>?6%123-4.56789:;1237<=./8 *-.>?6%123-4./001237<=./8 *-.>?6#123-4.>?6@AB1237<=./00
*-.>?6$123-4.>?6@AB1237<=./00 *-.>?6%123-4.>?6@AB1237<=./00 *-.>?6"123-4.>?6@AB1237<=./8
*-.>?6#123-4.>?6@AB1237<=./8 *-.>?6$123-4.>?6@AB1237<=./8 *-.>?6%123-4.>?6@AB1237<=./8
Figure 4. Combined Classifierlamp) and each maximum likelihood classifier is computed.Figure 3 shows the resulting classifier for each device.
The output of the classifier can now be used to determinewhich state the device is in. Once the state is known theoriginal histogram is used as an estimate of the pdf withineach state. We could use the histogram as an estimate of thepdf without constraining the state, however this would biasthe estimate to favor the most common state thus make un-common states highly unlikely. The next step is to combinethese three classifiers to create a classifier for the combinedenergy consumption. This is done by computing every pos-sible combination of the three devices. The resulting poweris summed and the pdf for each device is used to compute thejoint probability of the combined solution. The set of classesthat maximize the joint probability is saved as the final clas-sification for each cell in the combined classifier.
For example, if we measure (72.1,"15.6) as the total en-ergy usage we first classify this value which results in thestates PC: active3, LCD: active, and Lamp: on. To disaggre-gate this value into individual energy estimates we first com-pute the joint probability of every combination where the set(active3, active, on) sums to within ±1.0 of (72.1,"15.6)in each dimension. The best solution is shown in Table 1and given our training data has pr = 0.3196. Although thecomputed solution at (73,"15) is not the nearest solution to(72.1,"15.6) in P"Q, it is within our bound of±1.0; in thiscase the probability of the solution at (72,"16) was 0.1395.Finally, we smooth the result to achieve the measured total.This is done simply by taking the error and adjusting each en-ergy value equally so the sum matches the measured value.
In this case !P ="0.3 and !Q = 0.2.
P Q SmoothedP SmoothedQPC 40 -9 39.7 -9.2
LCD 21 -3 20.7 -3.2Lamp 12 -3 11.7 -3.2Total 73 -15 72.1 -15.6
Table 1. Example power disaggregation.To explore the accuracy of the energy estimates we have
collected and examined two sets of recorded data. First, a24-hour period was monitored with all three devices on. Tosimulate a load on the PC we used a random screensaver. Asthe name implies the random screensaver selects a screen-saver randomly and after a random delay chooses anotherscreensaver. This causes the CPU load to vary from 0 to 50%and the measured power to vary by more than 10 Watts. Theresults from this experiement are shown in Figure 5. Fig-ure 5a shows the measured power used by each device andFigure 5b shows the estimated power decomposition usingonly the total measurements. Figure 5c shows the error inthe decomposed power estimates and Figure 5d shows thecumulative error using the power estimates. Our algorithmstrictly enforces the constraint that the sum of the power es-timates must equal exactly the total measured power, so thetotal power lines are identical in both charts and the sum ofall the error values is always equal to zero. The large spikesin error, most pronounced between hours 9 and 10, are dueto misclassification of the desk lamp state. This is becuasewhen the PC and LCD are both near their minimum activeenergy states with the desk lamp on it is nearly the same totalenergy usage as the PC and LCD in their high energy stateswith the desk lamp off. In this case edge detection would beeffictive to prevent oscilaltion between these two edge cases.Table 2 shows the actual and estimated total energy usageby each device over the 24-hour experiment. These resultsshow that the classification error is infrequent enough to stillachieve good results over a long period.
Actual Estimate % ErrorPC 896.7 Wh 897.8 Wh 0.13%
LCD 490.2 Wh 505.4 Wh 3.10%Lamp 305.6 Wh 289.2 Wh -5.35%Total 1692.5 Wh 1692.5
Table 2. Summary results over 24-Hour data.The goal of the first experiment was to determine the long
term accuracy of our energy decomposition without devices
10

! " #! #" $!
%&'()
!
#!
$!
*!
+!
"!
,!
-!
.!
/!
0122)
3&21456&78( 69 :9; :1<=
:1<=
:9;
69
3&21456&78(
(a)
! " #! #" $!
%&'()
!
#!
$!
*!
+!
"!
,!
-!
.!
/!
0122)
3&21456&78( 69 :9; :1<=
:1<=
:9;
69
3&21456&78(
(b)
! " #! #" $!
%&'()
*#"
*#!
*"
!
"
#!
#"
+,--)
./ 0/1 0,23
(c)
! " #! #" $!
%&'()
*$!
*#!
!
#!
$!
+,--./.%
&'(
01 213 2,45
2,45
213
01
(d)Figure 5. Results from 24-hour monitoring.
turning on or off. Now we will look at the accuracy in thepresence of more dynamic loads. Figure 6 shows the ac-tual and estimated power for the same setup over 10 minuteswith the events listed in Table 3. The state change eventsare clearly evident in the instantaneous error graph, how-ever most transients were only present in a single sample.Because the transients were generally short, they had littleeffect on the average accuracy shown in Table 3.
Time (Minutes) Event1.2 Lamp off4.1 LCD off6.4 LCD on7.0 PC off7.2 LCD off7.8 Lamp on
Table 3. Event list.
Actual Estimate % ErrorPC 4.87 Wh 4.83 Wh -0.69%
LCD 1.77 Wh 1.79 Wh 1.13%Lamp 0.79 Wh 0.81 Wh 1.72%Total 7.43 Wh 7.43
Table 4. Summary results over dynamic data.5 Discussion
From the initial evaluation we have made some interestingobservations. Looking closely at the PC Classifier in Figure3a there are six identified states. For the analysis we namedthem: Off, Standby, Act1, Act2, Act3, and Act4. It is possi-
ble to merge the Act1-4 states into one larger active state; sowe tried it. Surprisingly, reducing the PC Classifier to threestates (Off, Standby, and Active) caused the error to increaseto well over 10%. This suggests that these states are dis-tinct and just happen to be adjacent. With one large activestate when we find the maximum-likelihood solution there isa large range of possible values each with low probability.
A second interesting result is the classification error forthe PC was always the best and the desk lamp was alwaysthe worst. This is the opposite of what we expected becausethe desk lamp has a constant power usage while the PC canvary by more than 10 Watts in its active states. This is due inpart to the absolute power usage of each device. Over the 24-hr period the average power consumption was 37, 20, and 13Watts for the PC, LCD, and desk lamp respectively. Becausewe use 1-Watt by 1-Watt bins in the histograms we shouldexpect ±0.5 Watt of error due to quantization. For each de-vice this results in an errors of ±1.35%, ±2.5%, and ±3.8%respecitvely. We could combat this effect by selecting a binsize in that limits the expected quantization error.
Lastly, by using reactive power we are making the as-sumption that the reactive power measurements combine lin-eally. Due to the definition of reactive power1 it is not nec-essarily true that the reactive power for arbitrary devices willadd linearly. The error induced by this assumption is relatedto how non-sinusoidal the device’s energy usage is. In ourexperiments this was not a problem, however, more devicesneed to be analyzed to better quantify this issue.
1Q =#
S2"P2
11

! " # $ % &!
'()*+,-
!
&!
"!
.!
#!
/!
$!
0!
%!
1!
23++-
45+367859,: 8; <;= <3>?
<3>?
<;=
8;
45+367859,:
(a)
! " # $ % & ' ( ) * "!
+,-./01
!
"!
#!
$!
%!
&!
'!
(!
)!
*!
23//1
45/3678590: 8; <;= <3>?
<3>?
<;=
8;
45/3678590:
(b)
! " # $ % & ' ( ) * "!
+,-./01
2"&
2"!
2&
!
&
"!
"&
34//1
56 768 749:
(c)
! " # $ % & ' ( ) * "!
+,-./01
2!3!'
2!3!%
2!3!#
!3!!
!3!#
!3!%
!3!'
!3!)
!3"!
45//6768
9.:
;< =<> =5?@
=5?@
=<>
;<
(d)Figure 6. Results from dynamic loads.
6 Conclusions and Future WorkThere are two existing options for household energy mon-
itoring: whole-home and device specific. In the case ofwhole-home energy measurement it is very difficult, if notimpossible, to monitor small devices or separate energy us-age from identical devices in two different locations. On theother hand, it may not be practical to use a dedicated en-ergy meter for every device in the home. Our solution to thisproblem is to use circuit-level energy measurements. We be-lieve this will enable more robust low-power device monitor-ing when compared to whole-home measurements. In addi-tion, circuit-level measurements inherently separate the theenergy usage by locality (e.g. kitchen, bathroom, bedroom,etc.). As with whole-home measurements, we must first trainthe system to recognize the individual devices on the cir-cuit before we can separate their energy usage. To automatethis process we propose to use a network of load-controllingdevices on the end-devices we are interested in monitoringand controlling. This combination will enable a fully au-tonomous training phase and allow the development of in-telligent household energy management systems. We thenproposed a new method to separate the circuit-level energymeasurements into device-level energy estimates. Our initialevaluation resulted in an average error less than 5.35% forthree devices with good response to changing device state.
These initial results are promising; the next step is to de-ploy our solution in a household environment. This will al-low us to validate our basic assumption that circuit-level en-ergy measurements are separable using our level-based algo-
rithm. If the results fail to meet our expectations, there areseveral opportunities for improvement such as adaptive binsizes and using step changes in measured power to constrainthe classifier. On the other hand, we may have good resultswith the current algorithm. In this case we could experimentwith measuring multiple circuits with a single aggregate sen-sor. By combining several circuits we would further lowerthe total hardware cost of the system. Once the disaggrega-tion algorithm has been fine tuned, we will need to integrateit with a control system and implement the logic required forautomatic training and intelligent control.7 References[1] Google Inc. Google PowerMeter Website. http://www.google.org/
powermeter/index.html.
[2] Greenbox Technology Inc. Greenbox website. http://getgreenbox.com/.
[3] G. Hart. Residential energy monitoring and computerized surveillance via utilitypower flows. Technology and Society Magazine, IEEE, 8(2):12–16, Jun 1989.
[4] G. Hart. Nonintrusive appliance load monitoring. In Proceedings of the IEEE,1992.
[5] X. Jiang, S. Dawson-Haggerty, P. Dutta, and D. Culler. Design and implementa-tion of a high-fidelity ac metering network. In Proceedings of the 8th ACM/IEEEInternational Conference on Information Processing in Sensor Networks (IPSN’09), 2009.
[6] M. Kazandjieva, B. Heller, D. Gal, P. Levis, C. Kozyrakis, and N. McKeown.PowerNet: A magnifying glass for computing system energy. In Stanford En-ergy & Feedback Workshop: End-Use Energy Reductions through Monitoring,Feedback, and Behavior Modification, 2008.
[7] C. Laughman, K. Lee, R. Cox, S. Shaw, S. Leeb, L. Norford, and P. Armstrong.Power signature analysis. Power and Energy Magazine, IEEE, 1(2):56–63, Mar-Apr 2003.
[8] Tendril Networks, Inc. Tendril consumer website. http://www.tendrilinc.com/.
12