
Using chloride and chlorine-36 as soil-water tracers to estimate
76
;ing Chloride and Chlorine-36 Soil-Water Tracers to Estimate ep Percolation at Selected ications on the U.S. Department Energy Hanf ord Site, Washington J.S. Department of the Interior U.S. Geoloqical Survey YatetrSt&pty Paper
-
Upload
vuongthuan -
Category
Documents
-
view
221 -
download
1
Transcript of Using chloride and chlorine-36 as soil-water tracers to estimate
;ing Chloride and Chlorine-36 Soil-Water Tracers to Estimate ep Percolation at Selected
ications on the U.S. Department Energy Hanf ord Site, Washington
J.S. Department of the Interior U.S. Geoloqical Survey YatetrSt&pty Paper
Using Chloride and Chlorine-36 as Soil-Water Tracers to Estimate Deep Percolation at Selected Locations on the U.S. Department of Energy Hanford Site, Washington
By EDMUND A. PRYCH
U.S. Geological Survey Water-Supply Paper 2481
U.S. DEPARTMENT OF THE INTERIOR
BRUCE BABBITT, Secretary
U.S. GEOLOGICAL SURVEY
Thomas J. Casadevall, Acting Director
The use of firm, trade, and brand names in this report is for identification purposes only and does not constitute
endorsement by the U.S. Government.
1998
Library of Congress Cstsloging in Publications Data
Prych, Edmund A.Using chloride and chlorine-36 as soil-water tracers to estimate deep percolation at selected locations on the U.S. Depart
ment of Energy Hanford site, Washington / by Edmund A. Prych.p. cm. (U.S. Geological Survey water-supply paper; 2481)
ISBN 0-607-89780-5 *sbnI. Groundwater Pollution Washington (State) Richland. 2. Seepage Wyoming Washington (State) Richland. 3. Radioactive tracers in water pollution research Washington (State) Richland. 4. Hanford Works (Wash.) I. Titie.II. Series.
TD224.WSP78 1998648.1'68 dc21 98-2584
CIP
For sale by U.S. Geological Survey, Branch of Information Services Box 25286, Federal Center
Denver, CO 80225
CONTENTS
Abstract ............................................................................................................................................................................. 1Introduction ............................................................................................................................................................................. 2
Purpose and scope....................................................................................................................................................... 2Previous work ............................................................................................................................................................. 4Acknowledgments....................................................................................................................................................... 5
Chloride in the environment................................................................................................................................................. 5Derivations of estimation equations ..................................................................................................................................... 7
Atmospheric chloride deposition ................................................................................................................................ 8Chloride mass-balance method................................................................................................................................... 9
Deep-percolation rate ........................................................................................................................................ 9Age of soil water ............................................................................................................................................... 10
Chlorine-36 bomb-pulse method ................................................................................................................................ 10Descriptions of the Hanford Site and sampling areas .......................................................................................................... 11
Geology....................................................................................................................................................................... 11Surficial soils .............................................................................................................................................................. 12Climate and hydrologic setting ................................................................................................................................... 12Vegetation ................................................................................................................................................................... 13Descriptions of sampling areas ................................................................................................................................... 13
Area F01, Benson Springs................................................................................................................................. 13Area F02, McGee Ranch................................................................................................................................... 13Area C01, Liquid Effluent Recovery Facility ................................................................................................... 14AreaC02, Grass Site ......................................................................................................................................... 15Area C03, 200-BP-l Operable Unit.................................................................................................................. 15Area C04, C-018H Characterization ................................................................................................................. 15
Methods of sample collection and analysis .......................................................................................................................... 15Sampling methods....................................................................................................................................................... 16
Areas F01 and F02 ............................................................................................................................................ 16Areas C01 and C04 ........................................................................................................................................... 17AreaC03 ........................................................................................................................................................... 20Area C02 ........................................................................................................................................................... 20
Analyses of samples.................................................................................................................................................... 21Matric potential................................................................................................................................................. 21Water content..................................................................................................................................................... 22Chloride concentration...................................................................................................................................... 22Particle-size distribution.................................................................................................................................... 23Chlorine-36 to total-chloride ratio..................................................................................................................... 23
Estimatesof deep-percolation rates...................................................................................................................................... 24Atmospheric chloride deposition ................................................................................................................................ 24Deep percolation estimated by the chloride mass-balance method ............................................................................ 27
Areas F01 and F02 ............................................................................................................................................ 27Areas C01,C03, and C04.................................................................................................................................. 32AreaC02 ........................................................................................................................................................... 36
Deep percolation estimated by the chlorine-36 bomb-pulse method.......................................................................... 37Estimated rates .................................................................................................................................................. 40Inventoried amounts of anthropogenic chlorine-36 .......................................................................................... 40Differences between depths to centroid of anthropogenic chlorine-36 and peak of 36C1/C1 ratio.................... 41
Contents III
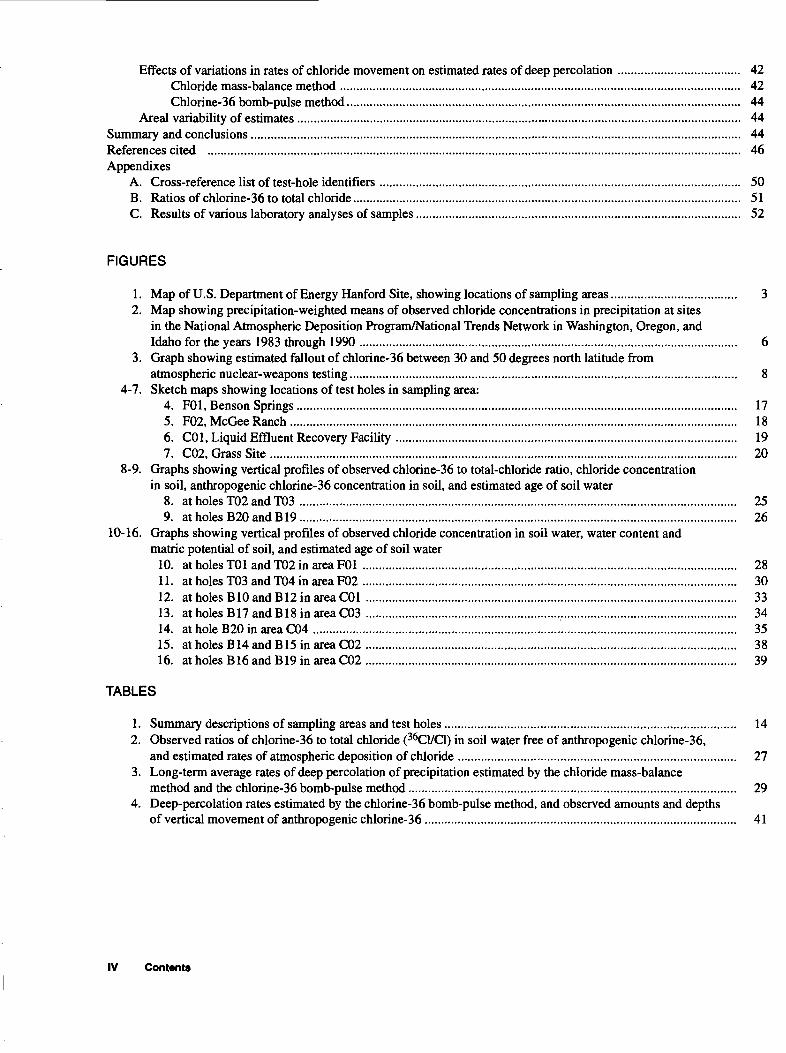
Effects of variations in rates of chloride movement on estimated rates of deep percolation ..................................... 42Chloride mass-balance method ......................................................................................................................... 42Chlorine-36 bomb-pulse method....................................................................................................................... 44
Area! variability of estimates ...................................................................................................................................... 44Summary and conclusions.................................................................................................................................................... 44References cited ................................................................................................................................................................. 46Appendixes
A. Cross-reference list of test-hole identifiers ............................................................................................................. 50B. Ratios of chlorine-36 to total chloride..................................................................................................................... 51C. Results of various laboratory analyses of samples.................................................................................................. 52
FIGURES
1. Map of U.S. Department of Energy Hanford Site, showing locations of sampling areas...................................... 32. Map showing precipitation-weighted means of observed chloride concentrations in precipitation at sites
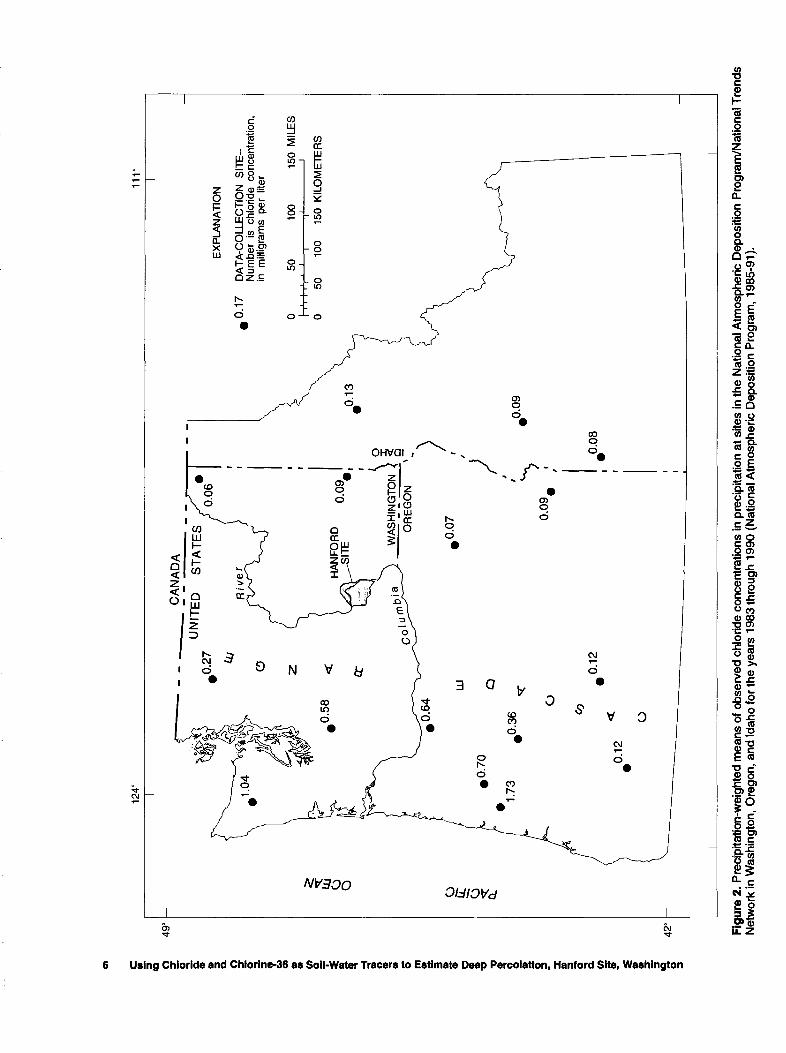
in the National Atmospheric Deposition Program/National Trends Network in Washington, Oregon, and Idaho for the years 1983 through 1990 .................................................................................................................. 6
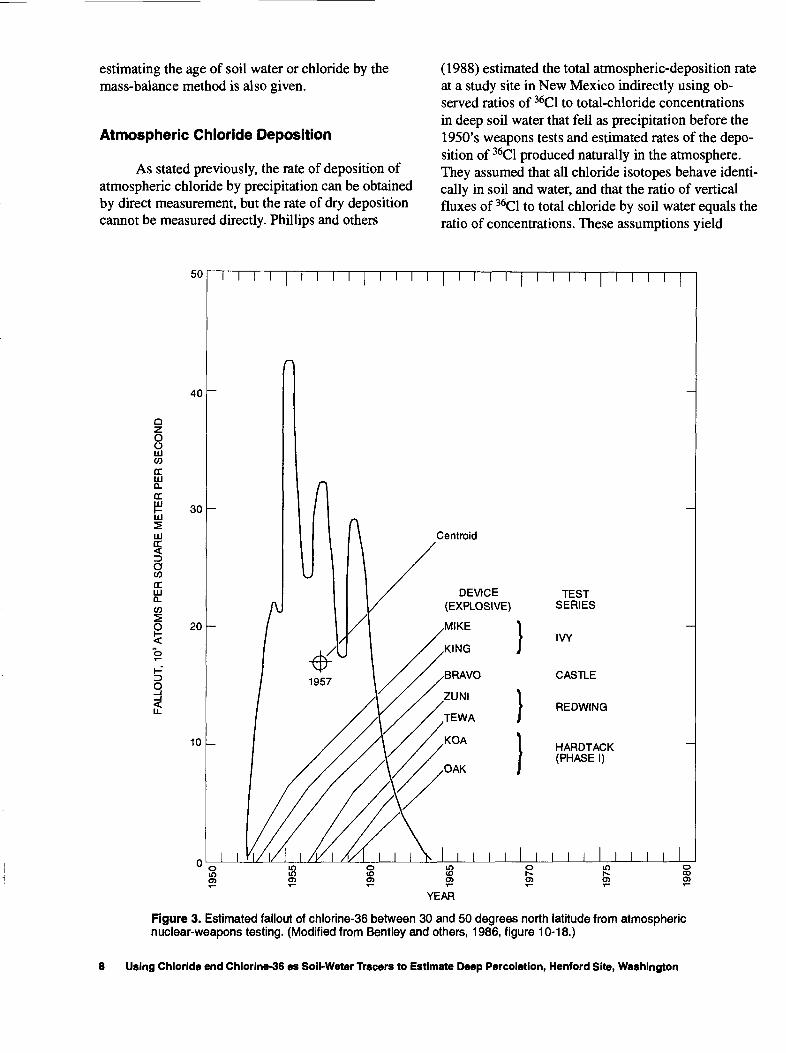
3. Graph showing estimated fallout of chlorine-36 between 30 and 50 degrees north latitude fromatmospheric nuclear-weapons testing..................................................................................................................... 8
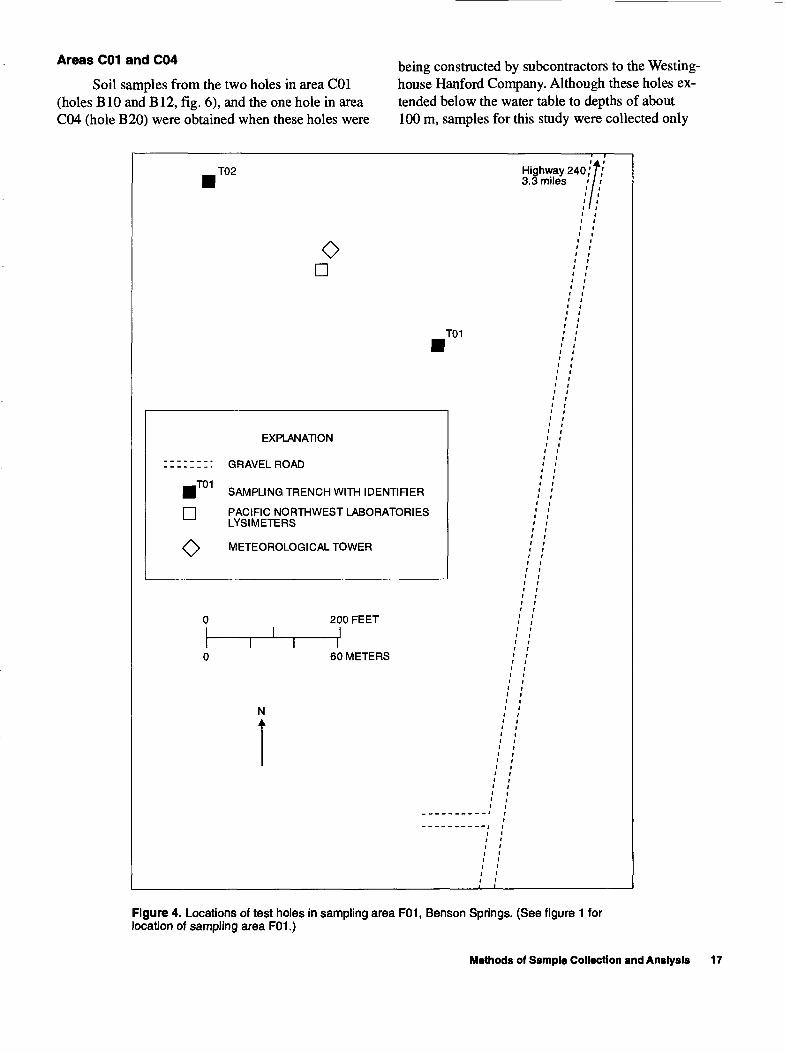
4-7. Sketch maps showing locations of test holes in sampling area:4. F01,Benson Springs..................................................................................................................................... 175. F02,McGee Ranch ....................................................................................................................................... 186. C01, Liquid Effluent Recovery Facility ....................................................................................................... 197. C02, Grass Site ............................................................................................................................................. 20
8-9. Graphs showing vertical profiles of observed chlorine-36 to total-chloride ratio, chloride concentration in soil, anthropogenic chlorine-36 concentration in soil, and estimated age of soil water
8. at holes T02 and T03 .................................................................................................................................... 259. at holes B20 and B19.................................................................................................................................... 26
10-16. Graphs showing vertical profiles of observed chloride concentration in soil water, water content and matric potential of soil, and estimated age of soil water
10. at holes T01 and T02 in area F01 ................................................................................................................. 2811. at holes T03 and T04 in area F02 ................................................................................................................. 3012. at holes BIO and B12 in area C01 ................................................................................................................ 3313. at holes B17 and B18 in area C03 ................................................................................................................ 3414. at hole B20 in area C04 ................................................................................................................................ 3515. at holes B14 and B15 in area C02 ................................................................................................................ 3816. at holes B16 and B19 in area C02 ................................................................................................................ 39
TABLES
1. Summary descriptions of sampling areas and test holes........................................................................................ 142. Observed ratios of chlorine-36 to total chloride (36C1/C1) in soil water free of anthropogenic chlorine-36,
and estimated rates of atmospheric deposition of chloride .................................................................................... 273. Long-term average rates of deep percolation of precipitation estimated by the chloride mass-balance
method and the chlorine-36 bomb-pulse method................................................................................................... 294. Deep-percolation rates estimated by the chlorine-36 bomb-pulse method, and observed amounts and depths
of vertical movement of anthropogenic chlorine-36.............................................................................................. 41
IV Contents
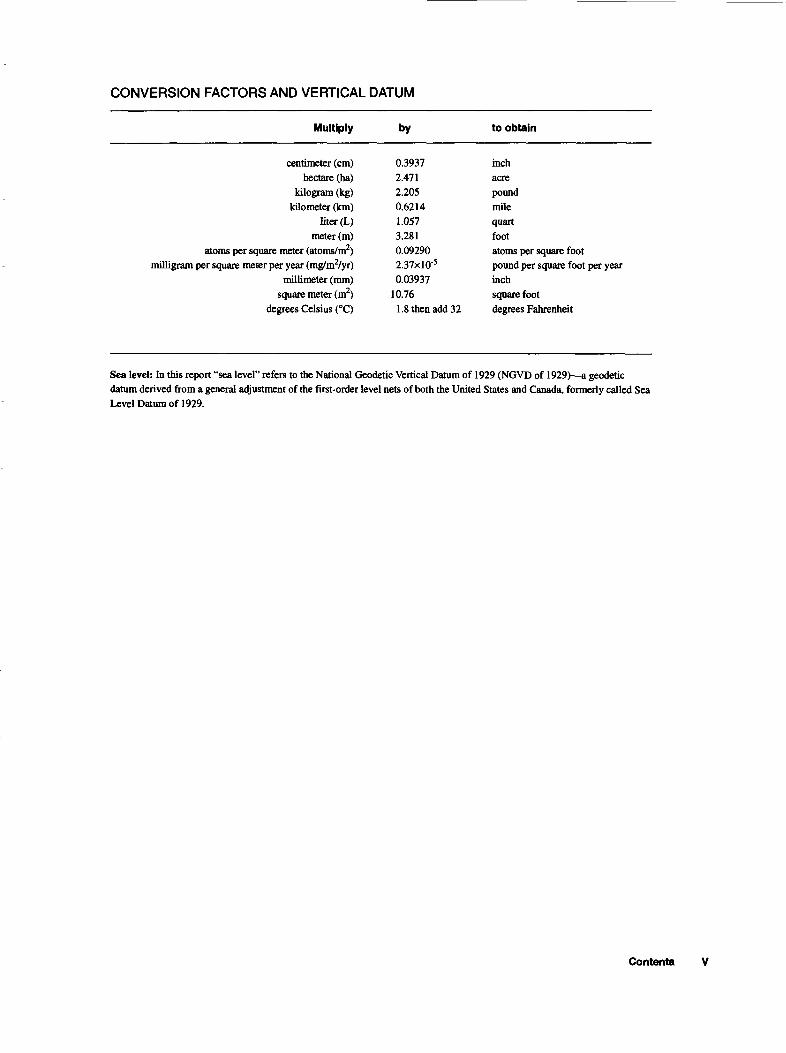
CONVERSION FACTORS AND VERTICAL DATUM
Multiply by to obtain
centimeter (cm)hectare (ha)
kilogram (kg)kilometer (km)
liter (L)meter (m)
atoms per square meter (atoms/m2)milligram per square meter per year (mg/m2/yr)
millimeter (mm)square meter (m2)
degrees Celsius (°C)
0.39372.4712.2050.62141.0573.2810.092902.37xlQ-50.03937
10.761.8 then add 32
inchacrepoundmilequartfootatoms per square footpound per square foot per yearinchsquare footdegrees Fahrenheit
Sea level: In this report "sea level" refers to the National Geodetic Vertical Datum of 1929 (NGVD of 1929) a geodetic datum derived from a general adjustment of the first-order level nets of both the United States and Canada, formerly called Sea Level Datum of 1929.
Contents
Using Chloride and Chlorine-36 as Soil-Water Tracers to Estimate Deep Percolation at Selected Locations on the U.S. Department of Energy Hanford Site, Washington
By Edmund A. Prych
Abstract
Knowledge of rates at which water from precip itation percolates through soils and sediments at the U.S. Department of Energy Hanford Site is critical for assessing the environmental risks of buried waste and for selecting appropriate strategies for storage and re mediation. Two methods, a chloride mass-balance method and a chlorine-36 (36C1) isotope bomb-pulse method, were tested for estimating long-term average rates of deep percolation at the site. Deep-percolation rates were estimated by the chloride mass-balance method at 13 locations in 6 areas with natural vegeta tion, and by the bomb-pulse method at 1 location in each of 4 of the areas. Estimated rates are a small fraction of precipitation. Mean annual precipitation on the test areas of the Hanford Site, which is located in semiarid south-central Washington, ranges from about 160 to 210 mm/yr (millimeters per year). Because the bomb-pulse method typically gives an upper limit of the deep-percolation rate and the mass-balance meth od may underestimate the rate, the estimates by the two methods probably bracket actual rates.
Estimates of deep percolation by the mass-bal ance method range from 0.008 to 0.11 mm/yr at four locations in two areas covered with more than 4 meters of silt-loam soils and vegetated with sagebrush and other deep-rooted plants and sparse shallow-rooted grasses. Estimated upper limits by the bomb-pulse method at one location in each of these same two ar eas are 2.1 and 3.4 mm/yr. Rates estimated by the mass-balance method range from 0.012 to 0.30 mm/yr at five locations in three areas where the soils consist of about 0.6 meter of loamy sand or sandy loam over
lying tens of meters of sand and gravel and which have vegetal covers similar to the two areas with deep silt-loam soils. The upper limit estimated by the bomb-pulse method for one location in one of these three areas is 2.6 mm/yr. Estimates of deep percola tion by both methods for the two areas with deep silt- loam soils are within the range of estimates by previous investigators that used independent methods and data for areas at Hanford with similar soil and vegetal covers. However, the estimates for the three areas with loamy sand or sandy loam soils are less than estimates by previous investigators.
Rates estimated by the mass-balance method at four locations in an area with 0.6 meter of loamy sand overlying about 9 meters of sand and with a vegetal cover consisting of only sparse shallow-rooted grasses range from 0.39 to 2.0 mm/yr. These estimates are higher than estimates by this method for locations in the five areas with deep-rooted plants; however, they still are at the lower end of the range of estimates for this area by other investigators. The 36C1 data collected at one location in this area were not from sufficient depth to define the entire anthropogenic 36C1 profile. These data, when used with the bomb- pulse method, were sufficient only to determine that the upper limit of deep percolation probably is greater than 5.1 mm/yr.
Estimated atmospheric chloride deposition rates, which are obtained from observed ratios of nat ural chlorine-36 to total-chloride (36C1/C1) (ratios in deep soil water older than the oldest anthropogenic 36C1), range from 33 to 39 milligrams per square meter per year. These rates are equal to or greater than twice that due to precipitation alone. Average natural
Introduction
36C1/C1 ratios in profiles at different locations ranged from 735xlO-15 to 876xlQ-15 .
Inventoried amounts of anthropogenic 36C1 sug gest that most of the anthropogenic 36C1 that was ob served in this study is from 1950's nuclear-weapons tests in the Pacific Ocean, as is assumed when using the bomb-pulse method, and not from operations at Hanford. Inventoried amounts at the three locations where the entire anthropogenic 36C1 profile was de fined range from I.lxl012 to 2.5xl012 atoms per square meter. These amounts are similar to amounts found by other investigators at sites in the arid south western United States that are not near local anthropo genic sources of 36C1.
Observed depths to the centroids of mass of an thropogenic 36C1 ranged from 1.06 to 1.50 meters at the three locations with deep-rooted vegetation, and the depth was greater than 3.46 meters at the location with only shallow-rooted grass vegetation. At each of the former three locations, depths to the centroid and the peak 36C1 concentration were greater than the depth at which the 36C1/C1 ratio was a maximum; the age of soil water (estimated using chloride mass-bal ance calculations) at the depth of the centroid was much older than the period of bomb testing. These in consistencies may be caused by differences in the rate of vertical movement of water and chloride within different flow paths at a given depth. Because of these differences the mass-balance method probably under estimates percolation rates at some locations.
INTRODUCTION
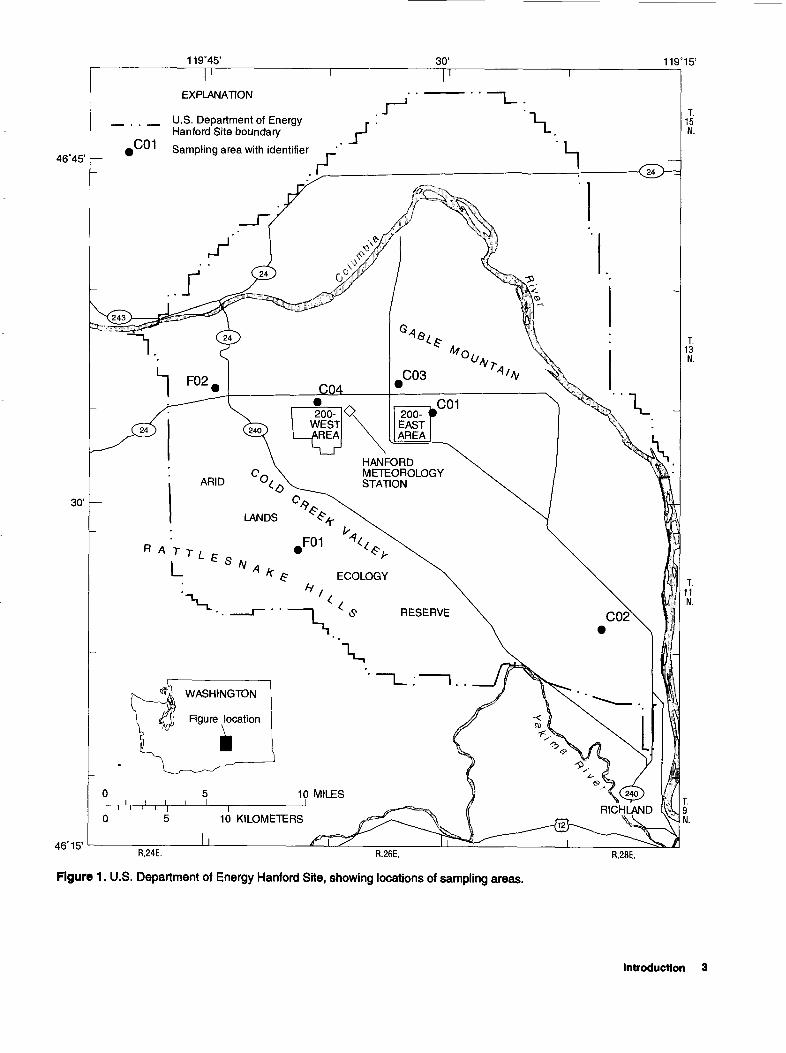
Radioactive materials for military or civilian applications have been processed, stored, used, or dis posed of at the U.S. Department of Energy Hanford Site (fig. 1) in semiarid south-central Washington since 1944. Former names for this facility include Hanford Works, Hanford Reservation, and Hanford Nuclear Reservation. As a result of activities at this facility, the soils and unsaturated sediments at the Hanford Site contain a wide variety of radioactive and other inorganic and organic wastes. A fundamental concern influencing plans for environmental remedia tion and designs of storage facilities for hazardous materials at the Hanford Site is that water from pre cipitation percolating through the soils and sediments may transport hazardous materials to the underlying
unconfined aquifer, which discharges to the Columbia River. Quantifying the rates at which water from pre cipitation on the land surface moves vertically down ward through the soils and sediments toward the water table is critical for assessing environmental risks posed by existing wastes, and for selecting ap propriate isolation or treatment strategies for storage and remediation. Because of the long life of some of the waste materials at Hanford, quantifying percola tion rates less than 1 mm/yr may be necessary.
In 1990 the U.S. Geological Survey (USGS) be gan a 3-year study to test the applicability of two methods, the chloride mass-balance and chlorine-36 isotope bomb-pulse methods, for estimating deep-per colation rates at the Hanford Site. These methods, which use total chloride and the chlorine-36 isotope as soil-water tracers, have been used for estimating deep-percolation rates at other arid and semiarid sites in the western United States (Phillips and others, 1988) where deep percolation is only a fraction of a millimeter per year.
In this report the term "deep percolation" means the movement of water from the surface to sufficient depths, usually below the root zone, so that the water is no longer subject to evapotranspiration. This water eventually will reach the water table and recharge the saturated ground-water system. However, the time for this water to become recharge can vary from a frac tion of a year to thousands of years, depending on the percolation rate and the depth to the water table.
Purpose and Scope
This report presents the results of a study of the use of a chloride mass-balance method and a chlorine- 36 isotope bomb-pulse method for estimating local long-term average rates of deep percolation of water from precipitation at selected locations on the Han ford Site. Deep percolation was estimated using the mass-balance method at a total of 13 locations in 6 ar eas. The bomb-pulse method was used for estimates at one location in each of four of the areas.
The report describes the theory and assumptions upon which the two methods are based. The different areas at Hanford where soil samples were collected to obtain data for making estimates are described along with the methods used to collect and analyze the sam ples. The data needed to make the estimates and sup plemental data are presented in graphical form and in
2 Using Chloride and Chlorine-36 as Soil-Watar Tracers to Estimate Deep Percolation, Hanford Site, Washington
119°45'
46°45'
U.S. Department of Energy .Hanford Site boundary , «
Sampling area with identifier '
HANFORDMETEOROLOGYSTATION
WASHINGTON
Rgure location
10 KILOMETERS
R.24E. R.26E.
Figure 1. U.S. Department of Energy Hanford Site, showing locations of sampling areas.
R.28E.
Introduction 3
tables. These data include vertical profiles of chloride concentration in soil water, ratios of chlorine-36 to to tal chloride, concentration of chlorine-36 in soil, wa ter content, and matric potential. The report uses the chlorine-36 data to estimate deep percolation by the bomb-pulse method, and to estimate atmospheric- chloride deposition rates, which are necessary for use of the chloride mass-balance method. The chloride- concentration data are used to estimate deep-percola tion rates and ages of soil water by the mass-balance method. The report also discusses some anomalies in the data and possible errors in the estimated percola tion rates that could be introduced by assumptions upon which the estimation methods are based.
Previous Work
Gee and others (1992), Rockhold and others (1990), and Gee (1987) have summarized information about previous investigations of deep percolation, or recharge, at the Hanford Site. Previous estimates of deep percolation were based on direct measurements with lysimeters, vertical-flux calculations using ob served or estimated hydraulic conductivities and wa ter-potential gradients, soil-water accounting methods, or combinations of these methods. The soil-water ac counting methods either used field measurements of the water content of soil and observed meteorological data in the calculations, or used only meteorological data and hydraulic properties of the soil. The deep- percolation rates that were estimated by these various methods ranged from zero for areas with a thick surfi- cial layer of fine-grained soil and deep-rooted vegeta tion, to nearly all of the annual precipitation (about 160 mm/yr) for areas with coarse-grained soils cov ered with a layer of gravel and without vegetation. The following paragraphs describe some of the previ ous studies of deep percolation at Hanford. Additional information on estimates for specific areas on the Hanford Site is given in the section "Descriptions of the Hanford Site and Sampling Areas."
Smoot and others (1989) used a numerical mod el that simulates evaporation at the soil surface and movement of water in liquid and vapor form in unsat- urated soil to estimate the quantity of precipitation that would percolate to depths greater than 2 m. Input data for the simulations included estimated hydraulic properties of soil and 10 years of observed daily mete orological data. The calculated 10-year average rates of water movement to a depth of 2 m ranged from 1.8
mm/yr when the soil consisted of a 0.15-m-thick surf- icial layer of silt loam on top of silty sandy gravel to 155 mm/yr when the surficial layer was clean gravel instead of silt loam.
Bauer and Vaccaro (1990) used 22 years of dai ly meteorological data and soil-moisture accounting to compute daily changes in water content of soil within the root zone. They equated changes in water content to rain plus snowmelt less evapotranspiration and precipitation intercepted directly by plants. All soil water in excess of the water-holding capacity of the soil in the root zone was assumed to become deep- percolation water. Computed deep percolation was sporadic and did not occur every year. The 22-year averages of computed local values of deep percola tion, which depended on topography, vegetal cover, water-holding capacity of the soil, and other factors, ranged from less than 0.01 to 46 mm/yr (H.H. Bauer, U.S. Geological Survey, Tacoma, Washington, oral commun., 1992). The estimated deep percolation was smallest for deep fine-grained soils with vegetation and was largest for coarse-grained soils without vege tation. The computed average value for the Hanford Site was about 10 mm/yr.
Rockhold and others (1990) described work done to estimate recharge in an area on the Hanford Site that they refer to as the 300 Area Grass Site. This area, which will be called the Grass Site in this report, has a sandy soil with only a sparse grass vegetal cov er. (See the section "Descriptions of the Hanford Site and Sampling Areas" for a more extensive description of this area.) Vertical profiles of soil moisture in 25 holes were monitored for a number of years at this site using neutron probes. Deep percolation was esti mated by a variety of methods. One estimate, ob tained from observed changes in soil moisture during a 12-month period beginning in July 1988, was 8.1 mm/yr. Another estimate, which was obtained by mul tiplying an estimated vertical hydraulic conductivity by an assumed unit gradient in the water potential and was based on the assumption that percolation rates are steady at depths greater than about 1.2 m, was be tween 0.06 and 28 mm/yr. The large uncertainty in this estimate was a result of the sensitivity of the cal culation to the unsaturated hydraulic conductivity, which could not be estimated with a high degree of certainty.
Gee and others (1992) summarized results of in vestigations at the Hanford Site that have used lysim eters. Observed or calculated deep-percolation rates in these investigations ranged from zero (less than mea-
4 Using Chloride and Chlorlna-36 as Soil-Water Tracers to Estimate Deep Parcolation, Hanford Sita, Washington
surable) to more than 100 mm/yr. Deep percolation was greatest in lysimeters with coarse-textured soils without plants and was least in lysimeters with fine- textured soils with and without plants. At least five different groups of lysimeters have been constructed at different locations using various soils and surface covers. Sizes of the lysimeters ranged from 0.3 to 3 m in diameter, and 1.5 to 18 m in depth. In some lysime ters deep percolation was estimated by collecting the drainage at the bottoms of the lysimeters. Other lysimeters were weighed continuously or periodically, and percolation rates were obtained from the history of weight changes and precipitation. In other lysime ters water contents were measured periodically with neutron probes.
An advantage of using lysimeters to estimate deep percolation is that lysimeters can yield direct measurements of percolation. Some disadvantages are that they must be continually operated and maintained for long periods and the cost can be high. Measured deep percolation is also only representative of the period in which the lysimeters are operated; extreme events that result in unusually large amounts of deep percolation may not occur during the period of oper ation.
Acknowledgments
The author thanks K. Michael Thompson of the U.S. Department of Energy and Steven P. Reidel of the Westinghouse Hanford Company for the support of this study within their respective organizations. Thanks are also due to other personnel and contrac tors to the Westinghouse Hanford Company for col lecting samples for use in this study while drilling wells for other purposes. The author expresses his ap preciation to many on the staff of Pacific Northwest Laboratories (PNL) of the Battelle Memorial Institute; to Glendon W. Gee for valuable discussions regarding this study and the long history of recharge investiga tions at Hanford in which he has played and continues to play an important part; to Ellen M. Murphy for making available preliminary data from two sites at Hanford prior to publication; to Michael J. Payer for permitting the author to collect samples at PNL's Grass Site; and to Steven O. Link for information on vegetation at Hanford. Ratios of 36C1/C1 were deter mined at the University of Rochester's Nuclear Struc ture Research Laboratory, Rochester, New York. Pankaj Sharma of that laboratory was responsible for
determining ratios in samples from this study. The au thor also thanks Thomas M. Beasley of the U.S. De partment of Energy, New York, for his advice on methods for purifying the silver chloride precipitates in which the 36C1/C1 ratios were determined and for removing organic matter from one difficult sample. A drill used to auger holes for collecting many samples was loaned to the USGS by the Othello, Wash., office of the U.S. Bureau of Reclamation. Three USGS em ployees performed many of the tasks necessary for collecting and analyzing samples. Kathleen A. Greene performed or assisted with many of the laboratory procedures; Theresa D. Olsen precipitated and puri fied the silver chloride for 36C1/C1 analyses; and John Bowlby operated machinery and solved problems in the field.
CHLORIDE IN THE ENVIRONMENT
Naturally occurring chloride, the ionic form of chlorine, consists mostly of the two stable isotopes 35C1 and 37C1. Their natural abundances are 75.53 and 24.47 percent, respectively. The atomic weight of this mixture of isotopes is 35.453 (Weast, 1975, p. B-12). Most chloride salts are highly soluble in water. Major sources of chloride dissolved in shallow ground wa ters are atmospheric deposition, minerals in soil and rocks, and in some places anthropogenic sources such as road salts and agricultural chemicals. Atmospheric chloride can be the predominant source at locations where sufficient time has passed for water to remove the chloride from the minerals in the rock and soil and where there are no anthropogenic sources. The major source of chloride in the atmosphere is entrainment from the surface of the ocean. This chloride is re turned to the Earth's surface in precipitation and dry deposition.
The precipitation-weighted concentration of chloride in precipitation at the Hanford Site, as esti mated from data collected at sites in the National At mospheric Deposition Program (National Atmospheric Deposition Program, 1985-91) is about 0.09 mg/L (fig. 2). Although annual rates of the com ponent of atmospheric deposition by precipitation can be computed by multiplying the observed concentra tion of chloride in precipitation by the precipitation amount, there is no convenient reliable method for di rectly determining the dry-deposition component or the total deposition rate. However, Phillips and others (1988) described an indirect method that utilizes
Chloride in the Environment
124°
111°
3
(O O
49°
O. a a
O o" o I I o*
m i T3 o s s a. (0 I 3; I o
42°
8 o Q: o
CA
NA
DA
EX
PLA
NA
TIO
N
0.1
7
DA
TA
-CO
LLE
CT
ION
S
ITE
--N
umbe
r is
ch
lorid
e co
ncen
trat
ion,
in
m
illig
ram
s pe
r lit
er
150
MIL
ES
50
100
150
KIL
OM
ET
ER
S
UN
ITE
D
ST
AT
ES
0.2
7
J 0
.06
Figu
re 2
. P
reci
pita
tion-
wei
ghte
d m
eans
of o
bser
ved
chlo
ride
conc
entra
tions
in p
reci
pita
tion
at s
ites
in th
e N
atio
nal A
tmos
pher
ic D
epos
ition
Pro
gram
/Nat
iona
l Tre
nds
Net
wor
k in
Was
hing
ton,
Ore
gon,
and
Idah
o fo
r the
yea
rs 1
983
thro
ugh
1990
(N
atio
nal A
tmos
pher
ic D
epos
ition
Pro
gram
, 19
85-9
1).
chlorine-36 isotope data for estimating the total depo sition rate. This method is described in the section ti tled "Atmospheric Chloride Deposition."
Chlorine-36 (36C1) is a rarely occurring radioac tive isotope with a half life of about 300,000 years (Bentley and others, 1986). The typical abundance of this isotope in shallow ground water is only about one atom in 1012 . It is produced naturally in the atmo sphere by the interaction of cosmic rays and argon, and in the lithosphere by radiochemical processes (Bentley and others, 1986). The atmosphere is the dominant source of 36C1 in most shallow ground wa ters. Andrews and Fontes (1992, fig. 1) modified esti mates by Bentley and others (1986) of the rate of atmospheric production and deposition of 36C1 as a function of latitude. The estimated rate for the geo magnetic latitude of the Hanford Site (north 53 de grees) is 15.5 atoms/m2/s.
Andrews and others (1989) stated that neutron activation of 35C1 is the only in-situ reaction that pro duces significant 36C1 in a rock matrix. They found good agreement between observed neutron fluxes in Stripa granite and fluxes calculated from concentra tions of uranium-238 and thorium-232 in the granite, and between observed concentrations of 36C1 and cal culations based on the neutron flux and observed con centrations of 35C1. An estimated upper limit on the ratio of the concentration of in-situ-produced 36C1 to total chloride at the Hanford Site can be calculated us ing a formula given by Andrews and Fontes (1992, eq. 6) with a neutron flux equal to that in Stripa granite and a maximum age of the soil water at Hanford of 20,000 years (see the section "Descriptions of the Hanford Site and Sampling Areas"). This calculated ratio is 12xlO~15 . It is an upper limit because concen trations of uranium-238 and thorium-232 in Stripa granite (44 and 33 mg/kg, respectively) and there fore neutron fluxes are a factor of 10 greater than in most other rocks (Andrews and others, 1989, table 3). Concentrations in Stripa granite are also considerably larger than concentrations in most soil samples col lected at the Hanford Site. (Concentrations in Hanford soils were retrieved from the data base described by Westinghouse Hanford Company, 1991.)
In addition to the naturally produced 36C1, rela tively large amounts of this isotope were created and introduced into the atmosphere by nuclear-bomb tests in the Pacific Ocean during the 1950's. Bentley and others (1986, fig. 10-18) estimated the time history of 36C1 fallout from these tests (fig. 3). The centroid of this temporal distribution of fallout is in the year
1957. During the late 1950's and early 1960's the at mospheric deposition of 36C1 from the bomb tests was about 1,000 times that from natural atmospheric pro duction. Phillips and others (1988, fig. 2) estimated the total 36C1 fallout as a function of latitude. (Al though not explicitly stated, it appears that in this case geographic rather than geomagnetic latitude was used.) The estimated fallout for the geographic lati tude of the Hanford Site, north 46.5 degrees, is 2.0xl012 atoms/m2 . However, Phillips and others (1988) pointed out that an estimate for a particular lo cation is only a rough approximation because "fallout is known to vary greatly as a function of position, weather, and other factors."
Measurable amounts of 36C1 have also been pro duced and released to the environment from nuclear- materials processing facilities. Beasely and others (1992) collected data on 36C1 in surface water and ground water near the U.S. Department of Energy Sa vannah River Site, South Carolina. They concluded that the amount of 36C1 deposited on an area within 200 km of the site as a result of past operations at that site was equal to about half that deposited as a result of the 1950's bomb tests. Beasley and others (1993) also found relatively large 36C1 concentrations in ground water on and near the Idaho National Engi neering Laboratory and attributed them to activities at the facility. Abnormally large relative 36C1 concentra tions have also been observed in recent snow samples downwind from the Idaho facility (L. Dewayne Cecil, U.S. Geological Survey, Idaho Falls, Idaho, oral com- mun., 1993). Murphy and others (1991a) summarized the small amount of available information on the pro duction and releases of 36C1 at the Hanford Site. They stated that the amount of 36C1 that was released to the environment can be estimated, but that most of it was discharged to the Columbia River or leaked to the ground-water system from detention ponds. The only discharge to the atmosphere would have been from surfaces of the ponds. They suspected that this amount was small, but they gave no quantitative esti mates.
DERIVATIONS OF ESTIMATION EQUATIONS
This section derives equations for estimating deep-percolation rates by the mass-balance and bomb-pulse methods, and for estimating the rate of atmospheric deposition of chloride. An equation for
Derivations of Estimation Equstions ^
estimating the age of soil water or chloride by the mass-balance method is also given.
Atmospheric Chloride Deposition
As stated previously, the rate of deposition of atmospheric chloride by precipitation can be obtained by direct measurement, but the rate of dry deposition cannot be measured directly. Phillips and others
(1988) estimated the total atmospheric-deposition rate at a study site in New Mexico indirectly using ob served ratios of 36C1 to total-chloride concentrations in deep soil water that fell as precipitation before the 1950's weapons tests and estimated rates of the depo sition of 36C1 produced naturally in the atmosphere. They assumed that all chloride isotopes behave identi cally in soil and water, and that the ratio of vertical fluxes of 36C1 to total chloride by soil water equals the ratio of concentrations. These assumptions yield
50
40
O OHI<f) CC HIQ. CC
P HI5 HI
CC HI Q.0)
1
1-
30
20
10 -
I I I I I I I I
Centroid
DEVICE (EXPLOSIVE)
MIKE
KING
BRAVO
ZUNI
JEWA
KOA
OAK
TEST SERIES
IVY
CASTLE
REDWING
HARDTACK (PHASE I)
I I I I I I I I I I I I Io <o en £
YEAR
o oo en
Figure 3. Estimated fallout of chlorine-36 between 30 and 50 degrees north latitude from atmospheric nuclear-weapons testing. (Modified from Bentley and others, 1986, figure 10-18.)
8 Using Chloride end Chlorine-36 es Soil-Weter Trscers to Estimate Deep Percoletion, Henford Site, Washington
(1)
where<7C1 is atmospheric flux of total chloride, in units
of mass per unit area per unit time; q36cl is atmospheric flux of 36C1, in units of mass
per unit area per unit time; [Cl]w is concentration of total chloride in soil water,
in units of mass per unit volume; and 36Cl/Clis the ratio [ 36 Cl]w /[Cl]w .
Substituting 15.5 atoms/m2/s, the value of q36 for the Hanford Site, into equation 1 gives
_(l5.5 atoms/m2 /s)x(35.5xl03 mg/mole)x(31.536xlQ6 s/yr)
?C1 ~ (6.03xl023 atoms/mole)x( 36 Cl/Cl)
which reduces to
28.8xlQ-'2 mg/m2 /yr 36 C1/C1 (2)
This equation is used later in this report with observed values of 36C1/C1 to estimate total atmo spheric fluxes of chloride at locations on the Hanford Site, which in turn are used to estimate deep-percola tion rates by the chloride mass-balance method. Note that the vertical flux of chloride in the soil may differ from the deposition rate, qcl, if the deposited chloride is redistributed by overland flow of precipitation be fore it infiltrates.
Chloride Mass-Balance Method
Eriksson and Khunakasem (1969) demonstrated how an equation for the mass balance of chloride, to gether with data on chloride concentrations in ground water and long-term average rates of atmospheric deposition of chloride by precipitation, can be used to estimate long-term average rates of recharge to an aquifer. Since then, others (see, for example, Vacher and Ayers, 1980; Claassen and others, 1986; and Det- tinger, 1989) have used this method for many differ ent types of areas ranging from small oceanic islands to mountainous drainage basins that range in size from tens to thousands of square kilometers. Others (see, for example, Allison and Hughes, 1978; Mattick
and others, 1987; Scanlon, 1991; and Stone, 1987 and 1992) have adapted the method by using chloride con centrations in ground water within the unsaturated zone (soil water) to estimate deep percolation of pre cipitation on a local scale. Here and elsewhere this re port uses the broad engineering definition of soils; it includes all unconsolidated sediments in addition to the chemically and physically modified top 1 or 2 m.
Deep-Percolation Rate
The chloride mass-balance method for estimat ing the local rate of deep percolation of precipitation is based on the hypothesis that all or a known fraction of chloride in precipitation and dry atmospheric depo sition is transported from land surface to the water ta ble by the downward flow of liquid water. As water percolates downward, some evaporates directly or is taken up and transpired by plants. Where this occurs the concentration of chloride in soil water increases with depth because little or no chloride is lost by these processes. At greater depths, where no evapotranspi- ration occurs, the chloride concentration should be uniform if climate, soil, and other conditions near the surface have been steady for a sufficiently long time. Chloride concentrations and fluxes of chloride and liquid water are related through the equation for chlo ride flux,
(3)
where the local downward flux of chloride per unit area is assumed to equal the total atmospheric chlo ride flux, #cl ; and #w is the local downward flux of liquid water per unit area. This equation can be re arranged to yield an expression for liquid water flux,
(4)
To estimate the long-term average deep-perco lation rate of water, one needs only to substitute into equation 4 the long-term average chloride flux and the concentration of chloride in soil water at a depth greater than that at which evapotranspiration occurs. Chloride concentrations can be obtained by laboratory analyses of soil samples. One may note that if the chloride flux for equation 4 is obtained by using equa tion 1, then the precipitation quantity is not explicitly used in the computation of the percolation rate.
Implicit in the derivation and uses of equation 4 is the assumption of so-called plug flow. More
Derivations of Estimation Equations 9
specifically, it is assumed that (1) the direction of wa ter flow and chloride transport is vertical and down ward, (2) areal distributions of the rate of percolation of water and of chloride on the local scale (a few tenths of a meter) are uniform (no preferred path ways), (3) all chloride is dissolved in soil water, and the distribution of the dissolved chloride in the soil water is relatively uniform within a pore (no solid chloride phase, sorption by soil, or anion exclusion), and (4) advection is the dominant mode of chloride transport, and diffusion is relatively unimportant. The last assumption is valid when either the diffusion co efficient or the vertical gradient of the chloride con centration is sufficiently small. Additional assumptions are that (5) minerals in the soil are not a source of chloride, and the only source is precipitation and dry atmospheric deposition, and (6) observed chloride concentrations are at depths great enough so that seasonal variations in concentration are small. The method may still be valid if chloride is taken up by growing vegetation as long as it is also released by decaying vegetation at the same rate.
One should note that water flux, #w, that is cal culated with equation 4 does not include the compo nent of water flux in vapor form because chloride is not volatile and will not move in the vapor phase. Consequently, equation 4 may underestimate or over estimate the net flux of water, depending on the direc tion of net vapor flux. However, because it is the movement of water in liquid form that transports sol utes through the soil profile, often it is this liquid component that is most important for assessing the risks associated with buried wastes.
Age of Soil Water
An average age of chloride or water, a, at any depth z l can be estimated by dividing the mass of chloride in soil water above that depth by the atmo spheric-chloride deposition rate,
a = -Ljz'(lW100)[Cl]w St dz, (5) tfci °
where
W is water content of the soil, in percent of dryweight;
Sb is bulk density of dry soil divided by the density of water; and
z is depth below land surface.
Assumptions implicit in equation 5 are the same as in equation 4.
Chlorine-36 Bomb-Pulse Method
The bomb-pulse method for estimating deep percolation uses as a tracer the relatively large amounts of 36C1 fallout from nuclear-weapons testing in the Pacific Ocean during the 1950's. When 36C1 is dissolved in precipitation that infiltrates the land sur face, the anomalously large concentration of 36C1 in soil water provides a time marker on the downward percolating water. The quantity of water in the soil profile shallower than some depth to where concentra tions of 36C1 are elevated is the quantity of water that has infiltrated the ground since the time when the fall out occurred and has not yet been lost by evapotrans- piration. Therefore, an upper limit on the average rate of deep percolation of precipitation from the period between the time of fallout and the time of sampling can be calculated as
f (W/100) Sb dz(6)
where
zm is the depth to some characteristic point on theprofile of elevated 36C1 concentrations;
t0 is the time when the vertical profile wasobserved; and
tm is some characteristic time on the temporaldistribution of 36C1 fallout from the bombtests.
The calculated value is an upper limit because soil water near the surface may be subject to addition al evapotranspiration before moving deeper (see Tyler and Walker, 1994). Although 36C1 is radioactive and its decay properties have been used to date ground waters more than 50,000 years old (see, for example, Bentley and others, 1986), the half life of 36C1 (about 300,000 years) is so much greater than time scales in the present investigation that 36C1 is treated as a con servative substance and the decay properties of the isotope are not used.
Previous investigators who have used bomb- 36C1 in studies of deep percolation include Trotman (1983), Norris and others (1987), Phillips and others (1988), and Scanlon and others (1990). Typically, these investigators have used the depth to where
10 Using Chloride end Chlorine-36 ss Soil-Water Trscere to Estlmste Deep Percolation, Hsnford Site, Washington
36C1/C1 is a maximum or the depth to the centroid (center of mass) of bomb-36Cl for zm as a measure of the distance that water has percolated since the bomb tests. Centroids are used for both zm and tm in the cur rent study. However, one should be aware that al though the use of peaks, centroids, or medians may have intuitive appeal, the general use of none of these measures of central tendency can be justified theoreti cally, especially when there is diffusion or when the percolation velocity is a function of depth. A nearly certain (and larger) estimate of the upper limit of deep percolation can be obtained if the maximum observed depth of bomb-36Cl is used for zm. However, use of this maximum depth probably would produce an ex cessively high upper limit.
Phillips and others (1988; see also Mattick and others, 1987) used data on the vertical distributions of 36C1 as well as tritium from bomb tests and of total chloride to deduce information on the vertical move ment of water through desert soils. They found that most of the 36C1 from bomb tests was in the upper 2 m of the soil profile but that the tritium from bomb tests had moved deeper than 36C1 even though the bomb tests that produced most of the tritium took place about 10 years after the tests that produced the 36C1. Scanlon (1992) also obtained vertical profiles of 36C1, tritium, and total chloride in soil water at a site in an arid environment. She found that most 36C1 from bomb tests was in the upper 1 m of soil and that tri tium had moved downward nearly twice as far. Several possible reasons for the differences in rates
of movement for tritium and 36C1 have been suggested by Scanlon (1992) and by others. One is that there is a net downward flux of water in vapor form, which transports tritium but not chloride.
An important assumption in the bomb-pulse method is that the 1950's bomb tests are the prime source of anthropogenic 36C1. As was mentioned in a previous section, releases of 36C1 to the atmosphere from operations at Hanford are suspected to have been small; however, elevated concentrations of 36C1 in the environment near two other nuclear-material processing facilities have been attributed to operations at those facilities. Consequently, 36C1 data collected at the Hanford Site must be examined to determine if they are affected by fallout from operations at Han ford. Fortunately, most of the activities at Hanford that might have resulted in releases of 36C1 probably took place during approximately the same period as the bomb tests and therefore probably would not af fect deep-percolation estimates made by this method.
DESCRIPTIONS OF THE HANFORD SITE AND SAMPLING AREAS
The Hanford Site occupies 1,450 km2 of land adjacent to the Columbia River in semiarid south- central Washington (fig. 1). The site is adjacent to and northwest of the city of Richland. The southwestern border of the site is along the ridge of the Rattlesnake Hills. Nearly all activities relating to radioactive ma terials on the Hanford Site have been limited to the 900-km2 area south of the river and east of Cold Creek Valley (State Route 240). Lands north and east of the river, but within the site boundaries, are wildlife areas that are managed by Federal and State agencies, and land southwest of State Route 240 is designated as the Arid Lands Ecology Reserve (ALE). The de scriptions that follow are mostly of the area south and west of the Columbia River.
The topography of the Hanford Site between Cold Creek Valley and the Columbia River is that of a terraced plain with land-surface altitudes that range from about 100 m above sea level at the river to about 250 m in the northwestern part of the Site. Gable Mountain, a basalt ridge, protrudes about 150 m above the terrace surface. Southwest of Cold Creek Valley, land-surface altitude increases from about 160 m in the valley up to about 1,000 m on the ridges of the Rattlesnake Hills.
Geology
Numerous reports on the geology of the Han ford Site have been written to provide information to the operators and overseers of the site. Among them are the reports by Newcomb and others (1972) and by Delaney and others (1991). Much of the following de scription is taken from these two reports.
The Hanford Site lies in the Pasco Basin, a broad syncline in the Columbia River Basalts of Mi ocene age. In some places the upper surface of these rocks is as much as 240 m below land surface, but they are exposed at land surface in the ridge that pro trudes above the terraces and in the hills along the southwestern and western boundaries of the site.
The basalts are overlain in most places by the Ringold Formation, a sequence of late Miocene to Pliocene unconsolidated sedimentary strata consisting largely of silt, sand, gravel, and volcanic ash. This for mation is exposed on the Hanford Site only on the
Descriptions of ths Hanford Site and Sampling Areas 11
north side of the Columbia River. The upper surface of this formation is as much as 65 m below the sur face of the terraced plain, and locally its maximum thickness is about 180 m.
The informally named Hanford formation of Brown and Isaacson (1977), hereafter referred to sim ply as the Hanford formation, is the predominant for mation exposed at land surface on the site. Units in this formation consist mostly of unconsolidated sedi ments deposited by the Columbia River during a se ries of catastrophic floods that occurred when upstream ice dams breached during the middle to late Pleistocene. The last of these floods occurred about 13,000 years ago. The Pasco gravels, an informally named unit within the Hanford formation, consists of upper Pleistocene glaciofluvial and fluvial sands and gravels. In most places they overlie the Ringold For mation and are exposed at land surface on most of the terraced lands between the Columbia River and Cold Creek Valley. The river terraces were formed in the Hanford formation. The material of this formation is usually reworked by wind where it is exposed, and in some places the material is formed into sand dunes. The Pasco gravels are commonly 15 to 30 m thick but may be as much as 60 m thick in some places. Both the Pasco gravels and the Ringold Formation termi nate where they butt against the Rattlesnake Hills. In the vicinity of the 200-West Area (fig. 1) other sedi mentary units separate the Pasco gravels and Ringold Formation.
The Touchet beds of Flint (1938), another infor mally named unit within the Hanford formation, con sist of silt and fine-sand glaciolacustrine deposits. These sediments mantle the slopes of the Rattlesnake Hills up to altitudes of about 350 m. Alluvial and col- luvial deposits of Holocene age are found at land sur face along the Columbia River and in Cold Creek Valley.
Surficial Soils
The surficial soils of an area that includes the present Hanford Site were described and mapped by Kocher and Strahorn (1919). Hajek (1966) used this information plus areal photographs and information from more recent soil surveys of adjacent areas to pre pare a map of soils on that part of the Hanford Site that is south of the Columbia River. Most of the soils southwest of Cold Creek Valley are silt loams formed on deposits of the Touchet beds of Hint (1938) or
fine-grained wind-blown deposits. Most of the surfi cial soils in the area between Cold Creek Valley and the Columbia River are sandy loams, loamy sands, or sands formed on materials derived from the Pasco gravels.
Climate and Hydrologic Setting
Stone and others (1983) gave an extensive de scription of the climate at Hanford. Much of the fol lowing description is from their report. Long-term annual average precipitation at the Hanford Meteoro logical Station, which is located on the terraced lands near the 200-West Area (fig. 1), is about 160 mm/yr. Precipitation at Richland, approximately 50 km to the southeast, is about 170 mm/yr (calculated with data in National Oceanic and Atmospheric Administration, 1990). Precipitation on the slopes of the southwest- bordering Rattlesnake Hills increases with land-sur face altitude to a maximum of about 280 mm/yr. About 44 percent of the annual precipitation on the terraced plains falls during the three months Novem ber through January, while only 12 percent occurs in the months July through September. About 38 percent of the precipitation from December through February is snow. The monthly mean daily temperature for July, the warmest month, is 24.7°C (degrees Celsius), and the monthly mean for January, the coldest month, is -1.5°C. Daily maximum temperatures exceed 32°C on more than half the days in both July and August. The mean annual potential evapotranspiration at the Han ford Site exceeds 1,000 mm/yr (Bauer and Vaccaro, 1990), which is many times precipitation.
Except for the Columbia River, flow in most stream channels on the Hanford Site is ephemeral. Perennial flow occurs in a few locations downstream from springs on the slopes and at the base of the Rat tlesnake Hills; however, this water seeps into the channel bottoms, and the channels are normally dry within 2 or 3 km downstream of the springs. Runoff of precipitation into most stream channels occurs only sporadically and does not occur every year. Most peri ods of runoff are the result of rapidly melting snow or short, intense summer storms on rocky land in the southwestern bordering hills. Even during most peri ods of runoff the water in the channels seeps into the ground before or a short distance after the channels reach the terraced plain.
Depth to ground water typically is about 30 m over much of the terraced plain, but it is as much as
12 Using Chloride and Chlorine-36 as Soil-Weter Tracers to Estimate Deep Percoietion, Hanford Site, Weshington
100 m below land surface at the west end of the plain and reduces to near 0 m along the Columbia River.
Vegetation
The natural vegetal cover over the Hanford Site consists mostly of small shrubs with an understory of grasses. The most common shrubs are sagebrush (Ar- temesia tritentata), bitterbrush (Purshia tridentata), and rabbitbrush (Chrysothamnus nauseouses), with some hopsage (Grayia spinosa). The common grasses are cheatgrass (Bromus tectorum), an annual species that was introduced into eastern Washington during the 1800's, and Sandberg bluegrass (Poa sandbergif), a native perennial bunchgrass (U.S. Department of Energy, 1987, p. 4.23). Root depths of grasses tend to be relatively shallow, a few tenths of a meter, whereas the roots of shrubs, such as sagebrush, can extend a few meters below land surface.
Descriptions of Sampling Areas
This section gives brief descriptions of each of the six sampling areas. Their locations are shown on figure 1, and information about each area is summa rized in table 1. Additional information about these areas and the methods of collecting samples in them is given in the section "Methods of Sample Collection and Analysis." Each sampling area is given a local name, such as Benson Springs, and a three-character identifier, such as F01. The local name relates the sampling area to previously named features or study areas on the Hanford Site. The three-character identi fier is unique to this study and is used on most figures and tables. The letter F or C indicates the predominant texture of the subsurface soil in the area, fine or coarse, respectively, and the number that follows is a sequence number.
All study areas were in a nearly natural state, were only minimally affected by anthropogenic activi ties, and were populated with natural vegetation. However, the vegetation on one of the areas once had been killed by wildfire.
Area F01, Benson Springs
The Benson Springs sampling area (fig. 1, F01) is on an alluvial fan on the lower slopes of the Rattle snake Hills at an altitude of about 300 m. Precipita
tion on this area, estimated from the data in Stone and others (1983), is about 210 mm/yr. This quantity is about one-third greater than on each of the other sam pling areas because of the higher altitude of this area. Land surface in the vicinity of the area has a slope of about 5 percent; however, the sampling locations in this study were on local flats. The vegetation consists mostly of sagebrush, with other deep-rooted plants plus sparse grass. The soils are silt loams. Details on the maps of Hajek (1966) and of Kocher and Strahorn (1919) are sufficient only to determine that the soils are one or more of the following series: Lickskillet silt loam, Ritzville silt loam, Scooteny stoney silt loam, or Warden silt loam. The parent materials for these soils are the lacustrine deposits of the Touchet beds of Flint (1938), but the surface has been reworked by wind and water. The thickness of these deposits and the depth to the water table in the area are unknown. However, rocks prevented augering deeper than about 4.5 m at three locations, and water was not encoun tered in any of the sampling holes, the deepest of which was 4.8 m. A map by Kasza and others (1991) shows the water table in the vicinity of this area to be below the top of the basalts that underlie the sedi ments.
This area is also the location of a pair of lysime- ters (referred to as the ALE lysimeters by Gee and others, 1992) that were operated by Pacific Northwest Laboratories. Both lysimeters were cubes approxi mately 1.5 m on a side. Each contained undisturbed local soil, but one was vegetated with sagebrush and the other with bunchgrass. No drainage was observed from the bottom of either lysimeter during the 4 years that they were monitored. The deep percolation esti mated for this area by Bauer and Vaccaro (1990) was less than 0.1 mm/yr (H.H. Bauer, U.S. Geological Survey, Tacoma, Wash., oral commun., 1993).
Area F02, McGee Ranch
The McGee Ranch sampling area (fig. 1, F02) is near the base of the Rattlesnake Hills on the west ern border of the terraced lands. Land-surface altitude is about 245 m. Data from Stone and others (1983) in dicate that precipitation on this area is about the same as at the Hanford Meteorological Station (160 mm/ yr). The soil is Warden silt loam (Hajek, 1966), and the underlying sediments are the Touchet beds of Flint (1938). The land surface at the sampling locations is uneven, with sagebrush plants on 0.3-m-high hum mocks. The soil between the hummocks is populated
Descriptions of the Hanford Site and Sampling Areas 13
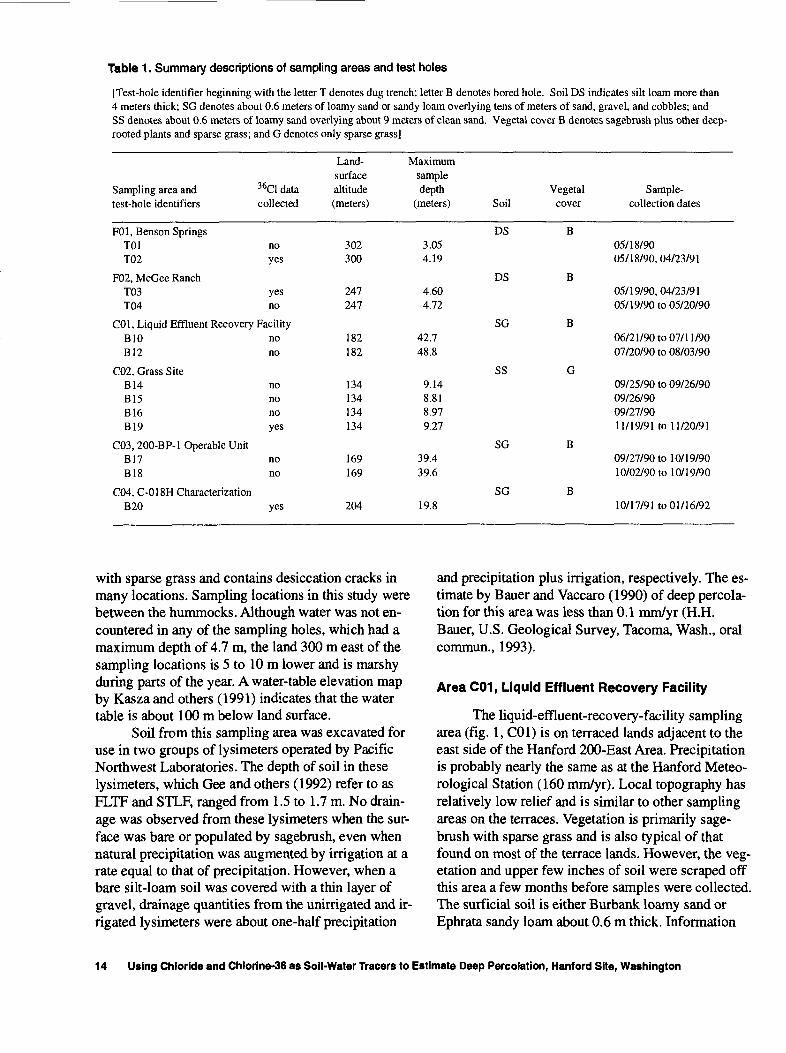
Table 1. Summary descriptions of sampling areas and test holes
[Test-hole identifier beginning with the letter T denotes dug trench; letter B denotes bored hole. Soil DS indicates silt loam more than 4 meters thick; SG denotes about 0.6 meters of loamy sand or sandy loam overlying tens of meters of sand, gravel, and cobbles; and SS denotes about 0.6 meters of loamy sand overlying about 9 meters of clean sand. Vegetal cover B denotes sagebrush plus other deep- rooted plants and sparse grass; and G denotes only sparse grass]
Sampling area and test-hole identifiers
F01, Benson SpringsT01T02
F02, McGee RanchT03T04
C01, Liquid Effluent RecoveryBIOB12
C02, Grass SiteB14B15B16B19
C03, 200-BP-l Operable UnitB17B18
C04, C-018H CharacterizationB20
36C1 data collected
noyes
yesno
Facilitynono
nononoyes
nono
yes
Land- surface altitude (meters)
302300
247247
182182
134134134134
169169
204
Maximum sample depth
(meters) Soil
DS3.054.19
DS4.604.72
SG42.748.8
SS9.148.818.979.27
SG39.439.6
SG19.8
Vegetal Sample- cover collection dates
B05/18/9005/18/90,04/23/91
B05/19/90,04/23/9105/19/90 to 05/20/90
B06/21/90 to 07/1 1/9007/20/90 to 08/03/90
G09/25/90 to 09/26/9009/26/9009/27/9011/19/91 toll/20/91
B09/27/90 to 10/19/9010/02/90 to 10/1 9/90
B10/17/91 to 01/16/92
with sparse grass and contains desiccation cracks in many locations. Sampling locations in this study were between the hummocks. Although water was not en countered in any of the sampling holes, which had a maximum depth of 4.7 m, the land 300 m east of the sampling locations is 5 to 10 m lower and is marshy during parts of the year. A water-table elevation map by Kasza and others (1991) indicates that the water table is about 100 m below land surface.
Soil from this sampling area was excavated for use in two groups of lysimeters operated by Pacific Northwest Laboratories. The depth of soil in these lysimeters, which Gee and others (1992) refer to as FLTF and STLF, ranged from 1.5 to 1.7 m. No drain age was observed from these lysimeters when the sur face was bare or populated by sagebrush, even when natural precipitation was augmented by irrigation at a rate equal to that of precipitation. However, when a bare silt-loam soil was covered with a thin layer of gravel, drainage quantities from the unirrigated and ir rigated lysimeters were about one-half precipitation
and precipitation plus irrigation, respectively. The es timate by Bauer and Vaccaro (1990) of deep percola tion for this area was less than 0.1 mm/yr (H.H. Bauer, U.S. Geological Survey, Tacoma, Wash., oral commun., 1993).
Area C01, Liquid Effluent Recovery Facility
The liquid-effluent-recovery-facility sampling area (fig. 1, C01) is on terraced lands adjacent to the east side of the Hanford 200-East Area. Precipitation is probably nearly the same as at the Hanford Meteo rological Station (160 mm/yr). Local topography has relatively low relief and is similar to other sampling areas on the terraces. Vegetation is primarily sage brush with sparse grass and is also typical of that found on most of the terrace lands. However, the veg etation and upper few inches of soil were scraped off this area a few months before samples were collected. The surficial soil is either Burbank loamy sand or Ephrata sandy loam about 0.6 m thick. Information
14 Using Chloride and Chlorine-36 as Soil-Water Tracers to Estimate Deep Percolation, Hanford Site, Washington
given by Connelly and others (1992) indicates that the geologic sequence consists of about 60 m of sand and gravels of the Hanford formation (Pasco gravels) di rectly overlying basalt. In December 1991 the water table was only a few meters above the top of the ba salt (Connelly and others, 1992). However, about 300 m south of the sampling locations an open channel drains waste water from the 200-East Area to a pond about 1 km to the east. Water-surface elevations in the channel and pond are about 2 to 10 m lower than the altitude of land surface in the sampling area
Bauer and Vaccaro (1990) estimated that long- term deep-percolation rates for sagebrush-covered areas on the terraced lands, such as sampling areas C01, C03, and C04, range from about 2.5 to 10 mm/yr (H.H. Bauer, U.S. Geological Survey, Tacoma, Wash ington, oral commun., 1993). Rates varied with esti mated water-holding capacity of the surficial soil.
Area C02, Grass Site
The Grass Site sampling area (fig. 1, C02) is on the terraced lands in the southeastern part of the Han ford Site at an altitude of about 135 m. Precipitation on this area is probably more similar to that at Rich- land (170 mm/yr) than at the Hanford Meteorological Station. The soil in this area was classified by Hajek (1966) as Rupert sand, but since then this soil has been renamed Quincy sand. The soil profile consists of about 0.6 m of loamy sand underlain by about 9 m of relatively clean sands. Gravel was encountered at a depth of about 9 m in each of four holes that were au- gered at this site as part of the current study. However, gravel was not encountered at a depth of 3.4 m as re ported by Rockhold and others (1990).
The topography in the vicinity of the sampling area is rolling but is relatively flat at the sampling lo cations. Present vegetation consists of annual and pe rennial grasses with an absence of shrubs or other deep-rooted plants. Gee (G.W. Gee, Pacific Northwest Laboratories, Richland, Wash., oral commun., 1993) suggested that sagebrush likely vegetated the area at one time but was killed by a wildfire at some un known date before December 1982, when PNL began to monitor soil moisture at the site, but has not grown back as it has in other places. A wildfire in August 1984 removed all surface vegetation from the area; however, grasses reestablished themselves within a few months, and the area has been grass covered to the present (1993). A water-table elevation map by
Kasza and others (1991) indicates that depth to the water table is about 15 m.
Estimates of recharge in this area by personnel of Pacific Northwest Laboratories (Rockhold and oth ers, 1990) were discussed in the "Introduction" sec tion. These estimates ranged from 0.06 to 28 mm/yr. Bauer and Vaccaro (1990) estimated that the long- term average deep-percolation rate for an area on the terraced lands with sandy soil, and vegetated only with grass, is 23 mm/yr.
Area C03,200-BP-1 Operable Unit
The 200-BP-l Operable-Unit sampling area (fig. 1, C03) is on terraced lands north of the Hanford 200-East Area. Topography, surficial soil, vegetation, and precipitation are similar to those at sampling area C01. Information given by Connelly and others (1992) indicates that the surficial soil is underlain by 50 m or more of coarse-grained deposits of the Han ford formation (Pasco gravels), and in December 1991 the water table was about 48 m below land sur face.
Area C04, C-018H Characterization
The C-018H Characterization sampling area (fig. 1, C04) is on the terraced lands north of the Han ford 200-West Area. Topography and vegetation are similar to those at sampling areas C01 and C03. The surficial soil in this area was classified by Hajek (1966) as either Burbank loamy sand or Ephrata sandy loam. Precipitation is probably the same as at the Meteorological Station (160 mm/yr). Information given by Trent (1992), who describes the area adja cent to and south of this area, suggests that the under lying sedimentary deposits are about 140 m thick and that the water table is about 65 m below land surface.
METHODS OF SAMPLE COLLECTION AND ANALYSIS
Data necessary for using the chloride mass- balance method were obtained by collecting and ana lyzing samples of soil from several depths in each of 13 test holes. Depths of holes ranged from about 4 to 50 m. One to four test holes were located in each of six different areas. Data for the chlorine-36 bomb- pulse method were obtained from 4 of the 13 holes 1 in each of 4 of the areas. Soil samples were
Methods of Sample Collection end Anelysis 15
collected by a variety of methods that ranged from manually coring in the sides of trenches that were dug with a backhoe, to power driving a split-spoon sam pler in the bottom holes that were constructed by ca ble-tool machines. Laboratory analyses performed on all the samples included determinations of gravimetric water content, chloride concentration, and matric po tential. Particle-size distributions of selected samples were also determined. Ratios of 36C1/C1 were deter mined for selected samples from those holes used to test the applicability of the bomb-pulse method.
Sampling Methods
Samples from the Benson Springs (F01), Mc- Gee Ranch (F02), and Grass Site (C02) areas were collected by USGS personnel from test holes con structed specifically for this study. Samples from holes in the other three areas (C01, COS, and C04) were obtained from holes being constructed for other purposes by subcontractors to the Westinghouse Hanford Company, the operations contractor for the Hanford Site. These samples were collected by per sonnel of Westinghouse Hanford Company or its sub contractors according to instructions provided by the USGS. Although the land surface in some of the sam pling areas is sloped or rolling, each of the sampling holes was constructed on a local flat to minimize sur face runoff of precipitation onto or off of the sam pling-hole location. Each sampling hole is referred to in this report by an identifier (such as T01 or BIO). The letter T or B identifies the hole as a dug trench or bored hole, respectively. The number that follows is a sequence number. These hole identifiers are refer enced to other identifiers in Appendix A. Sample- collection dates are listed in table 1.
Areas F01 and F02
Samples were collected from two trenches in each of the areas F01 and F02 (holes T01 through T04, figs. 4 and 5). These trenches, which were exca vated with a backhoe, were about 1 m wide, 4 m deep, and 8 m long. A continuous soil core consisting of a series of segments, each 55 mm in diameter and 100 mm long, was collected from each trench by repeated ly hammering a short, thin-walled, stainless-steel tube vertically into the soil along a vertical line about
0.1 m from the edge of the trench. After each core segment was obtained, the soil in a 0.2-m by 0.2-m square area surrounding the location from which the core segment was taken was removed with a square- ended shovel to create an open flat surface for starting the next core segment. In this way a 0.2-m by 0.2-m square notch with a depth equal to that of the trench was excavated in one of the trench walls. In addition to the samples collected from the walls of the trench es, soil samples from the bottom of the trench down to about 0.6 m below the bottom were collected with a hand auger.
Immediately after each core segment was col lected, the soil in the thin-walled tube or auger was emptied into a 0.3-L glass jar with a water-tight gas- keted metal lid, and an additional seal was made by wrapping the edge of the lid with plastic electrical tape. The sample jars then were placed in an insulated cooler for storage and eventual transportation to the laboratory for the various analyses. All laboratory de terminations except for 36C1/C1 ratios were performed on these samples. The latter determination required a larger size sample than was obtained with the thin- walled tube or hand auger.
Because relatively large sample volumes are sometimes required for determining 36C1/C1 ratios, separate samples in 25-cm-long intervals were col lected for these determinations. These samples were dug with a shovel out of the side of each trench along a vertical line adjacent to the 20-cm by 20-cm notch where the other samples were collected. Each of these samples, which had a mass of 10 to 20 kg, was placed in a plastic bag, which in turn was placed in a metal container along with other similar samples from the same trench. When these samples were processed it was found that samples of the upper three intervals from holes T02 and T03 did not yield sufficient chlo ride for determining 36C1/C1 ratios. (These ratios were not determined for samples from holes T01 and T04.) Consequently, the sampling sites were revisited 11 months later to collect an additional 30 kilograms of soil from each of these intervals. The additional mate rial was collected within about 3 m of the original sample-collection location.
Samples were also collected from three augered holes in area F01 and another three in area F02. Samples from these holes, which ranged in depth from about 4 to 6 m, were never analyzed because the samples had dehydrated while being stored in plastic liners, and consequently, original water contents could not be determined.
16 Using Chloride and Chlorine-36 as Soil-Watar Tracers to Estimate Deep Percolation, Hanford Site, Washington
Areas C01 and C04
Soil samples from the two holes in area C01 (holes BIO and B12, fig. 6), and the one hole in area C04 (hole B20) were obtained when these holes were
being constructed by subcontractors to the Westing- house Hanford Company. Although these holes ex tended below the water table to depths of about 100 m, samples for this study were collected only
T02 Highway 240,'; 3.3 miles
o
T01
-T01
D
O
EXPLANATION
GRAVEL ROAD
SAMPLING TRENCH WITH IDENTIFIER
PACIFIC NORTHWEST LABORATORIES LYSIMETERS
METEOROLOGICAL TOWER
200 FEET
I 60 METERS
Figure 4. Locations of test holes in sampling area F01, Benson Springs. (See figure 1 for location of sampling area F01.)
Methods of Sample Collection and Analysis 17
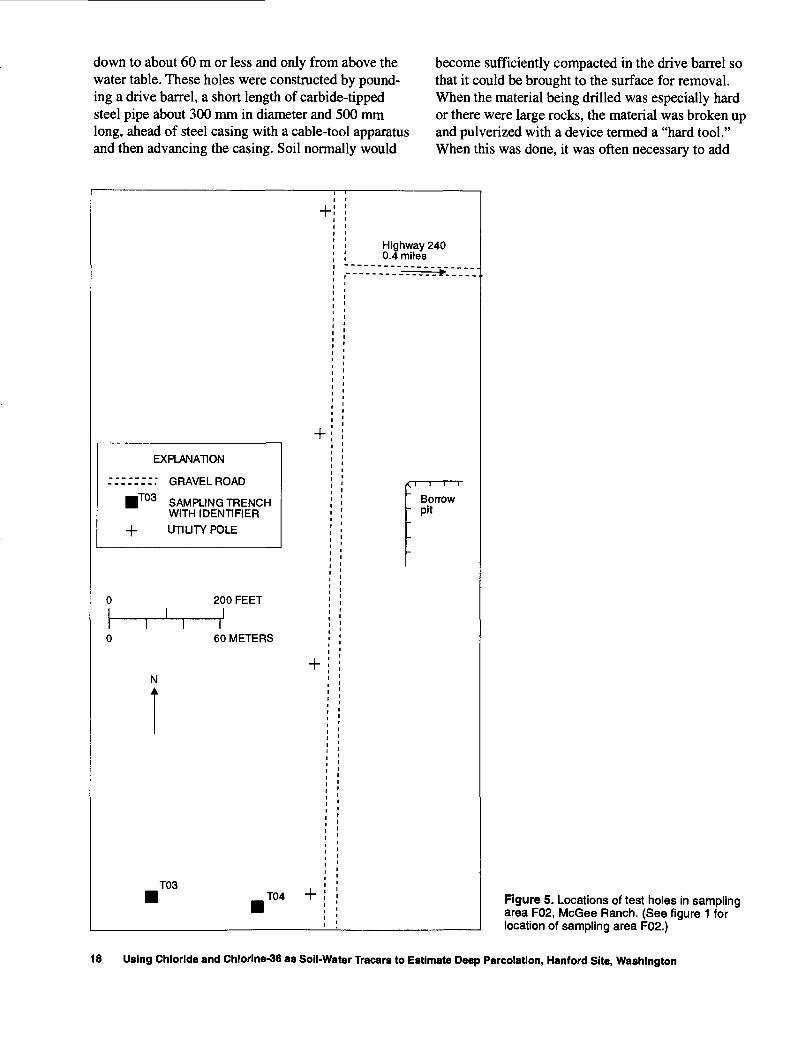
down to about 60 m or less and only from above the water table. These holes were constructed by pound ing a drive barrel, a short length of carbide-tipped steel pipe about 300 mm in diameter and 500 mm long, ahead of steel casing with a cable-tool apparatus and then advancing the casing. Soil normally would
become sufficiently compacted in the drive barrel so that it could be brought to the surface for removal. When the material being drilled was especially hard or there were large rocks, the material was broken up and pulverized with a device termed a "hard tool." When this was done, it was often necessary to add
EXPLANATION
:: GRAVEL ROAD
T03 SAMPLING TRENCH WITH IDENTIFIER
UTILITY POLE
200 FEET
\ 60 METERS
T03T04 +
Highway 240 0.4 miles
Borrow - pit
Figure 5. Locations of test holes in sampling area F02, McGee Ranch. (See figure 1 for location of sampling area F02.)
18 Using Chloride and Chlorine-36 as Soil-Water Tracers to Estimate Deep Percolation, Hanford Site, Washington
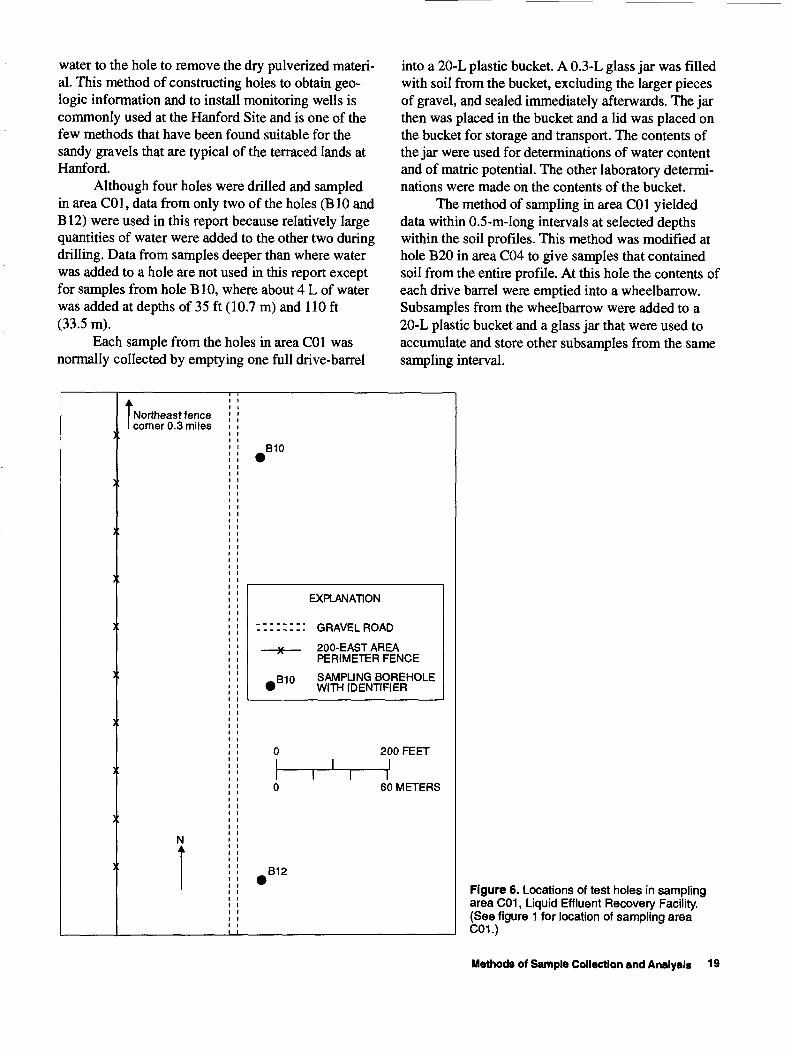
water to the hole to remove the dry pulverized materi al. This method of constructing holes to obtain geo logic information and to install monitoring wells is commonly used at the Hanford Site and is one of the few methods that have been found suitable for the sandy gravels that are typical of the terraced lands at Hanford.
Although four holes were drilled and sampled in area C01, data from only two of the holes (BIO and B12) were used in this report because relatively large quantities of water were added to the other two during drilling. Data from samples deeper than where water was added to a hole are not used in this report except for samples from hole BIO, where about 4 L of water was added at depths of 35 ft (10.7 m) and 110 ft (33.5 m).
Each sample from the holes in area C01 was normally collected by emptying one full drive-barrel
into a 20-L plastic bucket. A 0.3-L glass jar was filled with soil from the bucket, excluding the larger pieces of gravel, and sealed immediately afterwards. The jar then was placed in the bucket and a lid was placed on the bucket for storage and transport. The contents of the jar were used for determinations of water content and of matric potential. The other laboratory determi nations were made on the contents of the bucket.
The method of sampling in area C01 yielded data within 0.5-m-long intervals at selected depths within the soil profiles. This method was modified at hole B20 in area C04 to give samples that contained soil from the entire profile. At this hole the contents of each drive barrel were emptied into a wheelbarrow. Subsamples from the wheelbarrow were added to a 20-L plastic bucket and a glass jar that were used to accumulate and store other subsamples from the same sampling interval.
Northeast fence I comer 0.3 miles
B10
EXPLANATION
k B10
GRAVEL ROAD
200-EAST AREA PERIMETER FENCE
SAMPLING BOREHOLE WITH IDENTIFIER
200 FEET
I 60 METERS
B12
Figure 6. Locations of test holes in sampling area C01, Liquid Effluent Recovery Facility. (See figure 1 for location of sampling area C01.)
Methods of Sample Collection and Analysis 19
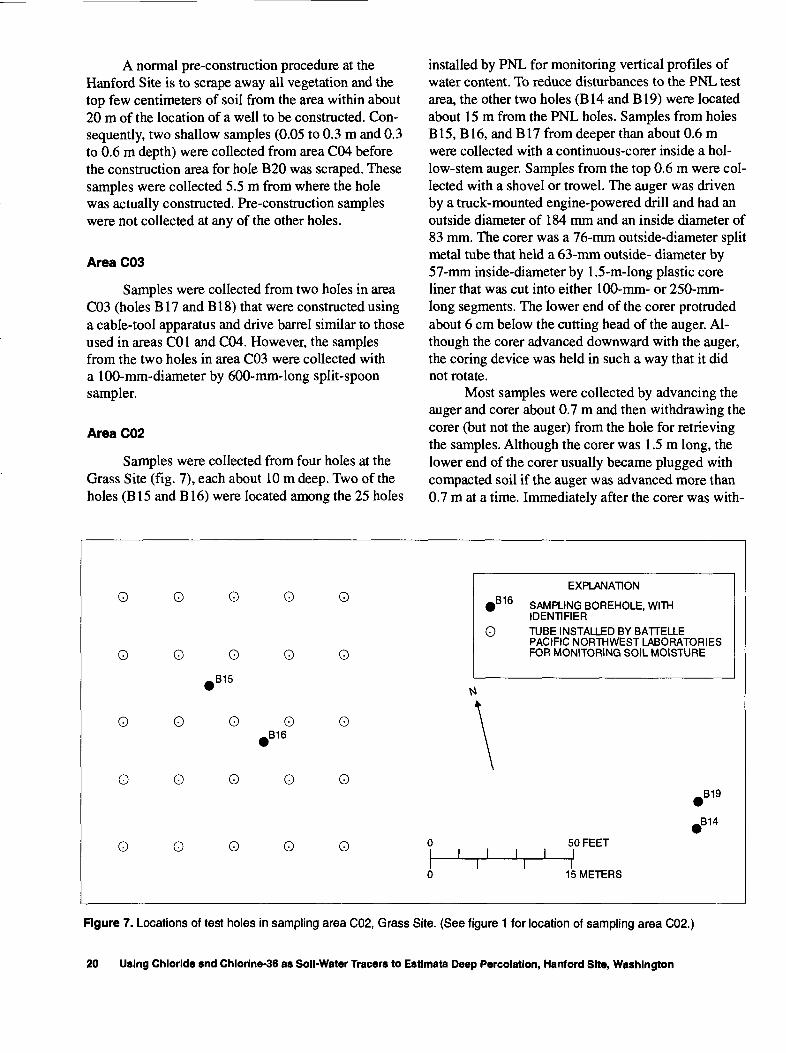
A normal pre-construction procedure at the Hanford Site is to scrape away all vegetation and the top few centimeters of soil from the area within about 20 m of the location of a well to be constructed. Con sequently, two shallow samples (0.05 to 0.3 m and 0.3 to 0.6 m depth) were collected from area C04 before the construction area for hole B20 was scraped. These samples were collected 5.5 m from where the hole was actually constructed. Pre-construction samples were not collected at any of the other holes.
Area COS
Samples were collected from two holes in area C03 (holes B17 and B18) that were constructed using a cable-tool apparatus and drive barrel similar to those used in areas C01 and C04. However, the samples from the two holes in area C03 were collected with a 100-mm-diameter by 600-mm-long split-spoon sampler.
Area C02
Samples were collected from four holes at the Grass Site (fig. 7), each about 10 m deep. Two of the holes (B15 and B16) were located among the 25 holes
installed by PNL for monitoring vertical profiles of water content. To reduce disturbances to the PNL test area, the other two holes (B14 and B19) were located about 15 m from the PNL holes. Samples from holes B15, B16, and B17 from deeper than about 0.6 m were collected with a continuous-corer inside a hol low-stem auger. Samples from the top 0.6 m were col lected with a shovel or trowel. The auger was driven by a truck-mounted engine-powered drill and had an outside diameter of 184 mm and an inside diameter of 83 mm. The corer was a 76-mm outside-diameter split metal tube that held a 63-mm outside- diameter by 57-mm inside-diameter by 1.5-m-long plastic core liner that was cut into either 100-mm- or 250-mm- long segments. The lower end of the corer protruded about 6 cm below the cutting head of the auger. Al though the corer advanced downward with the auger, the coring device was held in such a way that it did not rotate.
Most samples were collected by advancing the auger and corer about 0.7 m and then withdrawing the corer (but not the auger) from the hole for retrieving the samples. Although the corer was 1.5 m long, the lower end of the corer usually became plugged with compacted soil if the auger was advanced more than 0.7 m at a time. Immediately after the corer was with-
Q Q Q Q Q
Q Q O Q Q
.615
Q O O O O B16
Q Q Q Q Q
Q Q Q Q Q
.616EXPLANATION
SAMPLING 6OREHOLE, WITH IDENTIFIER
O TUBE INSTALLED BY BATTELLEPACIFIC NORTHWEST LABORATORIES FOR MONITORING SOIL MOISTURE
'
619
J___I50 FEET
i r15 METERS
Figure 7. Locations of test holes in sampling area C02, Grass Site. (See figure 1 for location of sampling area C02.)
20 Using Chloride snd Chiorine-36 as Soii-Water Tracers to Estimate Deep Percolation, Hanford Site, Washington
drawn from the hole, soil samples were removed from the liners and placed in sealed 0.3-L glass jars. If the total length of the core sample was less than the dis tance that the coring device was advanced, it was as sumed that the core came from the top of the interval.
Because analyses of the samples from these holes indicated that the samples did not contain suffi cient chloride for determining 36C1/C1 ratios, larger samples were collected from a fourth hole, B19, 14 months later. Samples from this hole down to a depth of about 2.5 m were obtained by pushing a 250-mm- diameter thin-walled metal pipe into the ground with the hydraulic power system of the truck-mounted drill and excavating from the inside of the tube with shov els and a manual auger-type post-hole digger. Samples from depths between 2.5 and 7.8 m were collected by pushing a 70-mm-diameter thin-walled steel tube ahead of a hollow-stem auger. Typically, the thin- walled tube was pushed a distance of about 0.4 m into the soil below the bottom of the auger and then with drawn from the hole to retrieve the sample. The auger was then advanced the same distance, and the process was repeated. Measurements of the hole depth inside the auger confirmed that action of the cutting teeth on the bottom of the auger allowed little soil to enter the hollow auger when the auger was advanced. Samples from the depth interval 7.8 m to the bottom of the hole were obtained with the coring device that was used for collecting samples from holes B14, B15, and B16. The samples collected from hole B19 were placed in 20-L plastic buckets, and a representative subsample of each sampling interval was placed in a sealed 0.3-L glass jar.
Analyses of Samples
The samples collected for this study were ana lyzed to determine matric potential, water content, chloride concentration, particle-size distribution, and the 36C1/C1 ratio. The first of the three determinations was performed on nearly all soil samples, and the lat er two were performed on only selected samples.
Matric Potential
Matric potential, the negative value of a quanti ty that is sometimes called soil suction, is a measure of how strongly the water is held by the soil. The mat ric potential is one component of the total soil-water potential. The gradient of the total potential, which
can have osmotic, gravitational, and other compo nents in addition to the matric component, determines the rate and direction of movement of soil water. In dry soils the matric component often dominates.
In this study a relative measure of the matric potential of each sample was determined using the fil ter-paper method (McQueen and Miller, 1968, and Hamblen, 1981). This was the first determination made on each sample. Whatman No. 42 paper filters, 55 mm in diameter, were treated to prevent biological activity by soaking in a solution of 3 percent pen- tachlorophenol in methanol and drying overnight at 105°C. The soil samples in the 0.3-L glass jars were brought to thermal equilibrium by placing them in a thermostatically controlled constant-temperature lock er (a refrigerator with heating as well as cooling capa bilities) for 7 days or more at 20°C. To reduce possible effects of hysteresis, the treated filters were dried again for 1 hour at 30°C shortly before they were used. A filter then was placed in each jar on top of the soil; the jar was resealed and then placed in verted in the constant-temperature locker for an addi tional 7 days or more for the water content of the filter to come into equilibrium with the soil. The equilibri um water content of each filter was determined by re moving it from the sample jar, shaking or brushing off soil particles, weighing the filter, drying the filter in an oven overnight at 105°C, and weighing again.
A relative matric potential of the soil sample was calculated from the water content of the filter us ing the formula
= -1.122F-3683 , (7)
where
P is the matric potential, in meters of water; and F is the equilibrium water content of the filter as
a fraction of its dry weight.
Equation 7 is a corrected and modified form of an equation given by Hamblen (1981, p. 357). (The algebraic sign of the first term on the right hand side of Hamblen's equation should be plus not minus.) Matric potentials that were calculated with this formu la should be considered to be only relative rather than absolute values because equation 7 was not verified for the particular batch of filters used in this study or for the soils that were being analyzed. Also, because the samples were disturbed the matric potentials of some samples may differ from those of in-place soils. The matric potentials presented graphically in the
Methods of Sample Collection and Analysie 21
following section and in tables in the appendix are in units of meters of water. To convert to other common ly used units, the following approximate relations may be used:
0.1 bar ~ 0.1 atmosphere ~ 1 meter of water ~ 10 kilo- pascals.
These are accurate to within 5 percent.
Water Content
Water contents were determined by analyzing all or parts of the samples stored in the 0.3-L glass jars. Water contents of samples from areas with soil that contained only particles smaller than 2 mm in di ameter (areas F01, F02, and C02) were determined by analyzing 100-g subsamples. These were obtained by removing cores of soil from the jars with either a 20- mm- or a 15-mm-diameter metal tube. The subsam ples were placed in a pre-weighed glass container, weighed, dried for 2 days in an oven at 105°C, and weighed again. Water content, in percent by weight, was computed as 100 times the weight of water lost by drying divided by the weight of dried soil.
Water contents of samples from areas with soil that contained some particles with diameters larger than 2 mm (areas C01, C03, and C04) were deter mined by weighing and drying the entire subsamples contained in the 0.3-L jars. However, these water con tents needed to be adjusted because the samples in these jars contained less than a representative amount of large-size particles. Wet and dry weights of these samples were obtained as described in the previous paragraph. Each sample then was sieved to determine the weight of the fraction of the sample with particle sizes smaller than 2 mm (sand, silt, and clay). It was assumed that most of the water was associated with the soil particles in this size fraction; therefore, water content of the actual soil was computed by multiply ing the laboratory-determined water content of the subsample in the 0.3-L jar by the ratio of percentages of less-than-2-mm material in the 0.3-L jar to that in the entire sample collected in a 20-L bucket. (See the footnote of table A3.) These adjusted water contents are shown on the graphs of the next chapter. In addi tion, a water content based on only the less-than-2- mm fraction was computed for use in calculating chloride concentrations in soil water. These were cal culated by dividing the water content of the sample in
the 0.3-L jar by the fraction in the jar of material that was less than 2 mm.
Chloride Concentration
The concentration of chloride in soil water was obtained by determining the amount of chloride per unit weight of dry soil and dividing that concentration by the original water content. The method used to ex tract chloride from a sample was similar to methods used by other investigators and is described in the fol lowing paragraphs.
Concentrations of chloride in soil from areas where the soil consists only of particles smaller than 2 mm were determined by analyzing 100-g subsamples taken from the glass jars. The subsamples were ob tained by removing cores of soil from the jars in the same way that subsamples were obtained for water content. Chloride concentrations in soil from areas where the soil contains some particles larger than 2 mm were determined by analyzing 100-g subsamples of only the less-than-2-mm size fraction. This sub- sample was obtained by sieving the entire contents of the 20-L sample bucket to remove all material larger than 2 mm and repeatedly passing the less-than-2-mm size fraction through a sample splitter to obtain a rep resentative subsample of the desired weight.
To extract the chloride, a subsample was put into a 0.18-L wide-mouth jar and dried in an oven overnight at 105°C. After the subsample had cooled, a quantity of deionized water equal in weight to that of the dried soil was added, and the jar with the soil and water mixture was rotated end over end at one revolu tion per second for 3 hours. The mixture was then al lowed to stand for 1 to 24 hours, after which the water extract was decanted and passed through a 0.45-mi- cron filter. The specific electrical conductivity of the extract was then measured, and the extract was sent to the USGS's National Water-Quality Laboratory in Ar- vada, Colo., where the chloride concentration was de termined by ion chromatography (Fishman and Friedman, 1985).
In addition, chloride concentrations in most of the soil samples were also determined by a commer cial laboratory (Northwest Agricultural Consultants, Kennewick, Wash.) using a different method. Instead of using deionized water, this other method used a so lution of 1.5 g CaSO4.2H2O per liter of water to ex tract the chloride from the soil. The soil to solution ratio was 1 to 2.5, and the mixture was shaken at 180
22 Using Chloride end Chlorine-36 es Soll-Water Trecers to Estimate Deep Percoletlon, Henford Site, Weshington
cycles per minute in a reciprocating shaker for 30 min. Calcium sulfate in the solution enhanced floccu- lation of soil particles, and the solution clarified by settling, so filtering was not required. Chloride con centrations in the extracts were determined by a ferric thiocyanate colorimetric method (Fishman and Fried- man, 1985).
Although concentrations determined by the two methods nearly always agreed well when the chloride content of the soil was greater than about 25 mg/kg, concentrations sometimes differed by a factor of two or more when the chloride content of the soil sample was less than about 5 mg/kg. Because the reason for the differences in concentrations determined by the two methods could not be determined, only concen trations determined using distilled water and ion chro- matography are given and used in this report in order to be consistent with the methods used in other studies of this type.
Particle-Size Distribution
Distributions of particle sizes larger than 0.062 mm were determined by sieving, and distributions of those smaller than 0.062 mm were determined with a device called a SediGraph 5100 (manufactured by the Micrometrics Corporation, Norcross, Ga, see for ex ample Lara and Mathes, 1986). This device uses X-rays to automatically determine concentrations of sediment as functions of time at various depths in a water-filled settling column, and then uses these data to calculate particle-size distributions in a manner similar to that done in the commonly used pipet meth od (see, for example, Guy, 1977).
Particle-size distributions in fractions less than 2 mm were determined by analyzing 30- to 100-g sub- samples. For areas in which nearly all soil particles were less than 2 mm in size (areas F01, F02, and C02), the subsamples were obtained by removing cores of soil from the 0.3-L sample jars. For areas with larger sized particles, subsamples were obtained by repeatedly splitting all the less-than-2-mm material in the 20-L sample buckets. Particle-size distributions in the fractions larger than 2 mm were determined by analyzing the entire contents of the 20-L buckets.
Determinations of distributions of particle sizes with the SediGraph and by sieving the less-than-2- mm fractions were done at the Sediment Analysis Laboratory in the USGS Cascades Volcano Observa tory in Vancouver, Wash. Sieving to obtain particle-
size distributions in fractions larger than 2 mm was done by project personnel.
Chlorine-36 to Total-Chloride Ratio
The 36C1/C1 ratio in a sample was determined by extracting the chloride from a sample with deionized water, precipitating the chloride as silver chloride (AgCl), purifying the precipitate, and analyzing the AgCl by mass spectrometry using a tandem mass ac celerator.
The procedure for extracting chloride from samples for this analysis was nearly the same as for the determination of chloride concentration, the only difference being the sizes of the samples and the ap paratus employed. To obtain at least 5 mg of chloride needed to determine the 36C1/C1 ratio, the sizes of the soil samples processed ranged from 1 to about 30 kg. For sample sizes from 1 to 5 kg, 1-kg subsamples of dry soil with equal quantities of water were mixed in 3-L plastic bottles by rotating the bottles end over end at one revolution per second for 3 hours. For larger samples, the entire amount to be processed was mixed with water in a 50-L plastic carboy by rotating for 3 hours at one-half revolution per second. The carboy was rotated by strapping it to a steel frame welded to a portable concrete mixer.
After mixing, the soil and water were allowed to stand for about an hour until some of the solids set tled, and then the liquid was decanted and centrifuged at about 3,000 revolutions per minute for 30 minutes to settle additional solids. The liquid was then decant ed again, filtered through a 0.45-micron filter, and re duced in volume to about 0.2 L by evaporating at about 90°C.
Chloride was extracted from the concentrated solution by adding silver nitrate (AgNO3) to precipi tate silver chloride (AgCl) and filtering through a 0.22-micron filter. Because the 36S isotope interferes with the analysis for 36C1, sulfur contaminants in the AgCl were removed by repeating a process (Sharon Tullai, University of Rochester, Rochester, N.Y., writ ten commun., May 30, 1989) that included washing and dissolving the precipitate in a sodium hydroxide (NHOH4) solution, adding barium nitrate (BaNO3) to precipitate barium sulphate (BaSO4), filtering the so lution to remove the BaSO4, adding nitric acid (HNO3) to the solution to reprecipitate the AgCl, and recovering the AgCl by filtering again. This process was repeated until the filter for removing the BaSO4
Methode of Sample Collection and Analysis 23
looked clean (about four times). The purified AgCl samples were dried in an oven, placed in glass vials, and kept in the dark until analyzed.
The 36C1/C1 ratios in the AgCl extracts were de termined by mass spectrometry in the Nuclear Struc ture Research Laboratory at the University of Rochester. The methodology is described by Elmore and Phillips (1987).
To check for possible contamination of samples with 36C1 during processing, two blank samples of Weeks Island halite dissolved in water were prepared and processed the same way as were the soil and wa ter mixtures. (Weeks Island halite is an old material in which most of the 36C1 has decayed and consequently has a low 36C1/C1 ratio.) The 36C1/C1 ratios for both blanks were less than 1 percent of the lowest ratio de termined for any sample (Appendix B), indicating that contamination during processing was insignificant.
ESTIMATES OF DEEP-PERCOLATION RATES
Long-term average rates of deep percolation were estimated by the chloride mass-balance method using observed profiles of chloride concentration in soil water at 13 locations in 6 areas with natural vege tation. Deep-percolation rates at 4 of these 13 loca tions, one in each of four of the areas, were estimated by the 36C1 bomb-pulse method using observed pro files of the 36C1/C1 ratio. These ratios were also used to estimate total atmospheric chloride deposition rates, which are necessary for the use of the chloride mass-balance method. Basic data are listed in Appen dices B and C.
Atmospheric Chloride Deposition
Long-term average rates of deposition of chlo ride from the atmosphere to the land surface by pre cipitation and dry deposition can be computed using estimates of the rate of deposition of 36C1 that is pro duced naturally in the atmosphere, and determinations of the natural 36C1/C1 ratio [the ratio in deep soil water that fell as precipitation before any anthropogenic production of 36C1 (eq. 2)]. Samples from three of the four locations (holes T02, T03, and B20, figs. 8 and 9) were from depths great enough for estimating 36C1/C1 ratios in soil waters that predate both the 1950's bomb tests and any other production of anthropogenic 36C1.
Average natural values of ratios for individual holes range from 735xlQ- 15 to 876X10' 15 (table 2, and figs. 8 and 9), and ratios in individual samples are given in Appendix B. The deepest sample from hole B19 in area C02 for which 36C1/C1 data are available appears to contain anthropogenic 36C1. However, 36C1/C1 ratios in the two samples from between 0.6 and 1.4 m depth are less than ratios at greater depths at this location and are about the same as ratios in the deepest sam ples from locations in areas F01, F02, and C04. Therefore, the average ratio in the 0.6 to 1.4 m depth interval (748xlO~15) is assumed not to be affected by anthropogenic 36C1.
The estimated atmospheric-chloride deposition rates for the four locations range from 33 to 39 mg/m2/yr (table 2). These rates are two or more times the rates computed for precipitation alone, which implies that the atmospheric flux by dry depo sition is at least as large as by precipitation. (An atmospheric chloride flux of 35 mg/m2/yr is equiva lent to a chloride concentration of 0.22 mg/L in pre cipitation when precipitation is 160 mm/yr.) These estimated deposition rates are used in the following section to estimate deep percolation by the chloride mass-balance method. The 36C1 data for the shallow zone, where 36C1/C1 ratios are elevated, will be used in a later section to estimate deep percolation by the 36C1 bomb-pulse method.
The observed natural 36C1/C1 ratios in deep soil water at T02, T03, and B20 are about five times the value for this location (about 150xlO~ 15) shown on a map of calculated natural ratios in the conterminous United States by Bentley and others (1986, fig. 10-2). This difference is not surprising, considering the steep gradient in the calculated ratio for the area around Hanford and the sparse data available for making the map. The observed ratios at Hanford are also about three times the average ratio (280xlO~15) in deep soil water observed by Cecil and others (1992) at one lo cation on the Idaho National Engineering Laboratory. However, observed ratios at Hanford are only about one-third larger than ratios near the Idaho facility in stream and ground-water samples that are believed to be free of anthropogenic 36C1 (Beasley and others, 1993). The Idaho facility is about 500 km southeast of the Hanford Site and also has a semiarid climate. The ratios observed at Hanford are also a little higher than the range (lOOxlO' 15 to 700xlQ- 15 ) observed in arid areas of the southwestern United States (Trotman, 1983; Norris and others, 1987; Mattick and others
24 Using Chloride and Chiorine-36 as Soii-Watsr Tracsrs to Estimsts Deep Psrcolstion, Hsnford Site, Wsshington
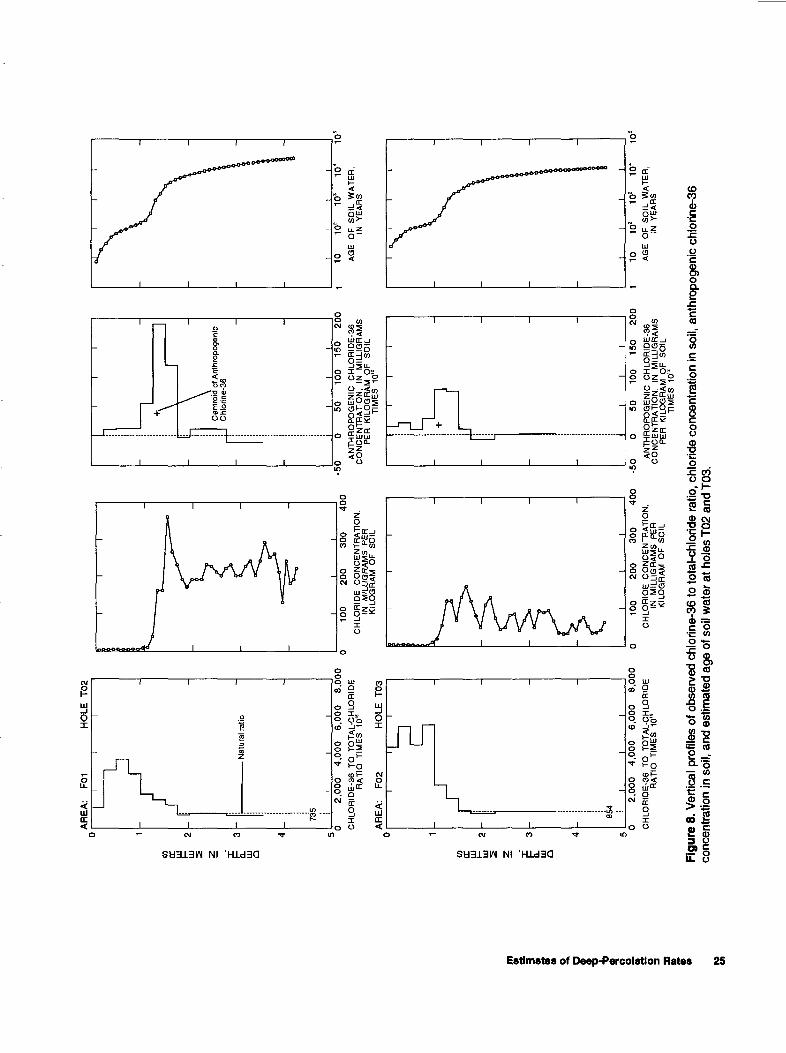
AR
EA
: F0
1H
OLE
T
02
<r U!
UJ 5 UJ O 0) <r UJ UJ o
- Nat
ural
rat
io
735
0 2,
000
4,00
0 6,
000
8,00
0C
HLO
RID
E-3
6
TO
T
OT
AL-
CH
LOR
IDE
R
AT
IO
TIM
ES
1
0"
Cen
troi
d of
Ant
hrop
ogen
ic
Chl
orin
e-36
100
200
300
400
-50
50
100
150
200
1010
" 10
3 10
' 10
s
AR
EA
: F
02H
OLE
T
03
CH
LO
RID
E
CO
NC
EN
TR
AT
ION
, IN
M
ILU
QR
AM
S
PE
R
KIL
OQ
RA
M
OF
S
OIL
AN
TH
RO
PO
GE
NIC
C
HLO
RID
E-3
6C
ON
CE
NT
RA
TIO
N,
IN
MIL
UQ
RA
MS
PE
R
KIL
OQ
RA
M
OF
S
OIL
TIM
ES
1
0"
AG
E
OF
S
OIL
W
AT
ER
, IN
Y
EA
RS
854
II
I
Ti
ii
ii
0 2,
000
4,00
0 6,
000
8,00
0C
HLO
RID
E-3
6
TO
T
OT
AL-
CH
LOR
IDE
R
AT
IO
TIM
ES
10"
100
200
30
04
00
-5
050
10
0 15
0 20
0C
HLO
RID
E
CO
NC
EN
TR
AT
ION
, IN
M
ILLI
GR
AM
S
PE
R
KIL
OG
RA
M
OF
S
OIL
AN
TH
RO
PO
GE
NIC
C
HLO
RID
E-3
6C
ON
CE
NT
RA
TIO
N,
IN
MIL
LIG
RA
MS
PE
R
KIL
OG
RA
M
OF
S
OIL
TIM
ES
10"
10
10s
103
10'
10s
AG
E
OF
S
OIL
W
AT
ER
, IN
Y
EA
RS
Figu
re 8
. Ver
tical
pro
files
of o
bser
ved
chlo
rine-
36 to
tota
l-chl
orid
e ra
tio, c
hlor
ide
conc
entra
tion
in s
oil,
anth
ropo
geni
c ch
lorin
e-36
co
ncen
tratio
n in
soi
l, an
d es
timat
ed a
ge o
f soi
l wat
er a
t hol
es T
02 a
nd T
03.
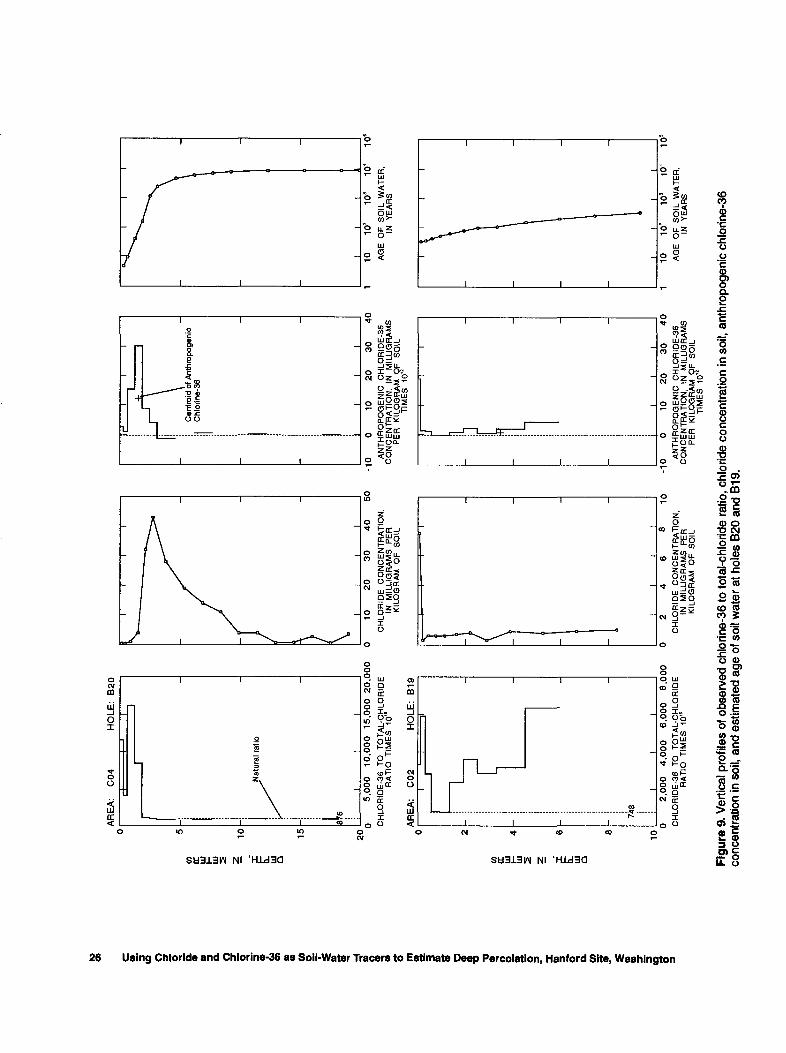
CO or 111
O
AR
EA
: C
04
HO
LE:
B20
CO or in i- ui 5 ^
10
0. Ill O
15
20
latu
ral r
atio
5,0
00
10,0
00
15,0
00
20,0
00
CH
LOR
IDE
-36
TO
T
OT
AL-C
HLO
RID
E
RA
TIO
T
IME
S
10'"
Cen
troi
d of
Ant
hrop
ogen
ic
Chl
orin
e-36
I I
I
II
-10
1020
30
40
10
10
' 1
0a
10
4 10
s
CH
LOR
IDE
C
ON
CE
NT
RA
TIO
N,
IN
MIL
LIG
RA
MS
P
ER
K
ILO
GR
AM
O
F
SO
IL
AR
EA
: C
02H
OLE
: B
19
AN
TH
RO
PO
GE
NIC
C
HLO
RID
E-3
6C
ON
CE
NT
RA
TIO
N,
IN
MIL
LIG
RA
MS
PE
R
KIL
OG
RA
M
OF
S
OIL
TIM
ES
1
0"
AG
E
OF
S
OIL
WA
TE
R,
IN
YE
AR
S
10
74
8
I
0 2,0
00
4,0
00
6,0
00
8,0
00
CH
LOR
IDE
-36
TO
T
OT
AL-C
HLO
RID
E
RA
TIO
T
IME
S
10's
10
-10
10
20
304
010
10*
10"
104
10
sC
HLO
RID
E
CO
NC
EN
TR
AT
ION
, IN
M
ILLI
GR
AM
S
PE
R
KIL
OG
RA
M
OF
S
OIL
AN
TH
RO
PO
GE
NIC
C
HLO
RID
E-3
6C
ON
CE
NT
RA
TIO
N,
IN
MIL
LIG
RA
MS
PE
R
KIL
OG
RA
M
OF
S
OIL
TIM
ES
10"
AG
E
OF
S
OIL
WA
TE
R,
IN
YE
AR
S
Figu
re 9
. Ver
tical
pro
files
of o
bser
ved
chlo
rine-
36 to
tota
l-chl
orid
e ra
tio, c
hlor
ide
conc
entra
tion
in s
oil,
anth
ropo
geni
c ch
lorin
e-36
co
ncen
tratio
n in
soi
l, an
d es
timat
ed a
ge o
f soi
l wat
er a
t hol
es B
20 a
nd B
19.
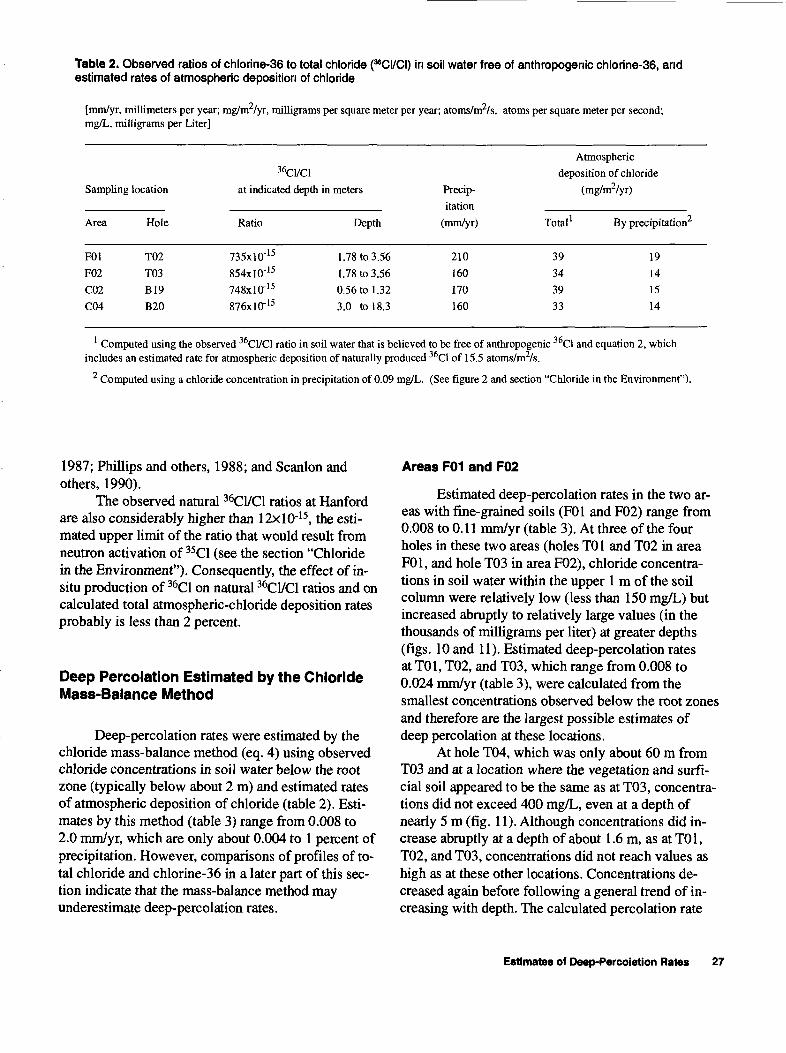
Table 2. Observed ratios of chlorine-36 to total chloride (^CI/CI) in soil water free of anthropogenic chlorine-36, and estimated rates of atmospheric deposition of chloride
[mm/yr, millimeters per year; mg/m2/yr, milligrams per square meter per year; atoms/m2/s, atoms per square meter per second; mg/L, milligrams per Liter]
36,'C1/C1Atmospheric
deposition of chlorideSampling location
Area
F01F02C02C04
Hole
T02T03B19B20
at indicated depth in meters
Ratio
735xl045854xlO' 15748xlO' 15876xlO' 15
Depth
1.78 to 3.561.78 to 3.560.56 to 1.323.0 to 18.3
Precipitation
(mm/yr)
210160170160
(mg/rrr/yr)
Total1
39343933
By precipitation2
19141514
Computed using the observed 36C1/C1 ratio in soil water that is believed to be free of anthropogenic 36C1 and equation 2, which includes an estimated rate for atmospheric deposition of naturally produced 36C1 of 15.5 atoms/m2/s.
2 Computed using a chloride concentration in precipitation of 0.09 mg/L. (See figure 2 and section "Chloride in the Environment").
1987; Phillips and others, 1988; and Scanlon and others, 1990).
The observed natural 36C1/C1 ratios at Hanford are also considerably higher than 12xlO~ 15, the esti mated upper limit of the ratio that would result from neutron activation of 35C1 (see the section "Chloride in the Environment"). Consequently, the effect of in- situ production of 36C1 on natural 36C1/C1 ratios and on calculated total atmospheric-chloride deposition rates probably is less than 2 percent.
Deep Percolation Estimated by the Chloride Mass-Balance Method
Deep-percolation rates were estimated by the chloride mass-balance method (eq. 4) using observed chloride concentrations in soil water below the root zone (typically below about 2 m) and estimated rates of atmospheric deposition of chloride (table 2). Esti mates by this method (table 3) range from 0.008 to 2.0 mm/yr, which are only about 0.004 to 1 percent of precipitation. However, comparisons of profiles of to tal chloride and chlorine-36 in a later part of this sec tion indicate that the mass-balance method may underestimate deep-percolation rates.
Areas F01 and F02
Estimated deep-percolation rates in the two ar eas with fine-grained soils (F01 and F02) range from 0.008 to 0.11 mm/yr (table 3). At three of the four holes in these two areas (holes T01 and T02 in area F01, and hole T03 in area F02), chloride concentra tions in soil water within the upper 1 m of the soil column were relatively low (less than 150 mg/L) but increased abruptly to relatively large values (in the thousands of milligrams per liter) at greater depths (figs. 10 and 11). Estimated deep-percolation rates at T01, T02, and T03, which range from 0.008 to 0.024 mm/yr (table 3), were calculated from the smallest concentrations observed below the root zones and therefore are the largest possible estimates of deep percolation at these locations.
At hole T04, which was only about 60 m from T03 and at a location where the vegetation and surfi- cial soil appeared to be the same as at T03, concentra tions did not exceed 400 mg/L, even at a depth of nearly 5 m (fig. 11). Although concentrations did in crease abruptly at a depth of about 1.6 m, as at T01, T02, and T03, concentrations did not reach values as high as at these other locations. Concentrations de creased again before following a general trend of in creasing with depth. The calculated percolation rate
Estimates of Deep-Percoietion Rates 27
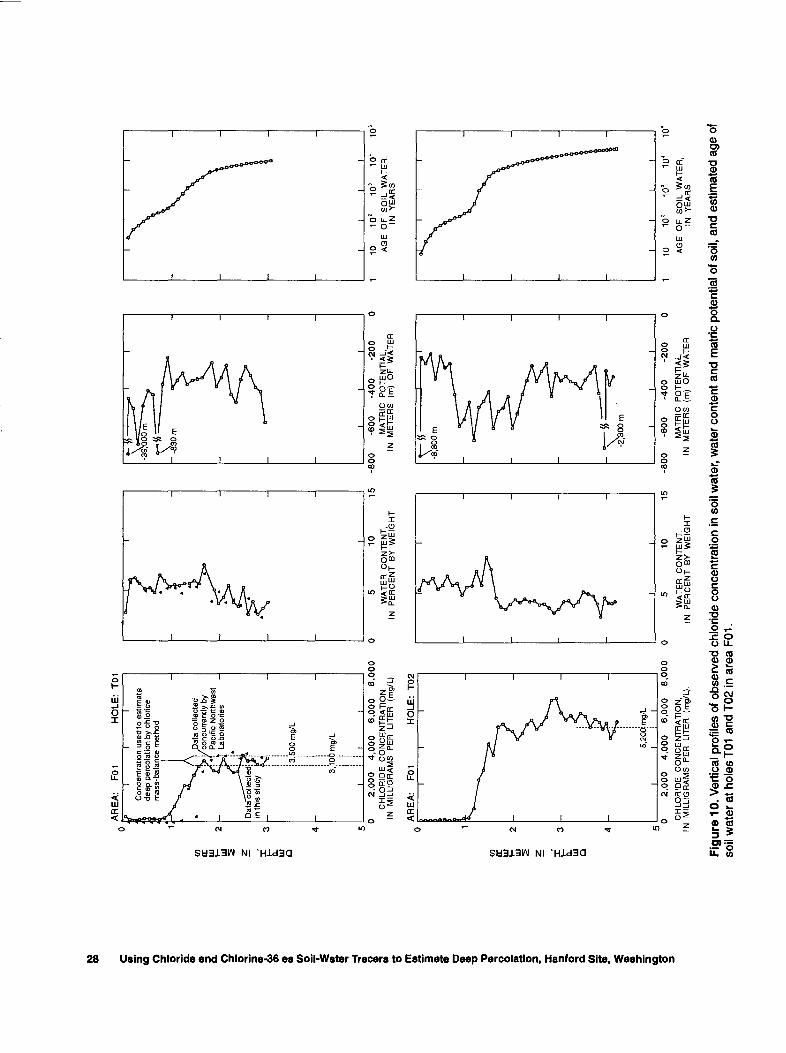
AR
EA
: F0
1H
OLE
: T0
1
CO or UJ UJ Q CO or UJ UJ
Q
IC
once
ntra
tion
used
to e
stim
ate
deep
per
cola
tion
by c
hlor
ide
mas
s-ba
lanc
e m
etho
d
'ata
col
lect
ed
conc
urre
ntly
by
Paci
fic N
orth
wes
t La
bora
torie
s
3 50
0 m
g/L
10 )
mg/
L
I2,
000
4,00
0 6,
000
8,0
00
CH
LOR
IDE
C
ON
CE
NT
RA
TIO
N,
IN
MIL
LIG
RA
MS
P
ER
LI
TE
R
(mg/
L)
5 10
WA
TE
R
CO
NT
EN
T,
IN
PE
RC
EN
T
BY
W
EIG
HT
15
-800
II
-600
-4
00
-200
MA
TR
IC
PO
TE
NT
IAL,
IN
M
ET
ER
S
(m)
OF
W
AT
ER
10
102
10s
10*
10s
AG
E
OF
S
OIL
W
AT
ER
, IN
Y
EA
RS
AR
EA
: F0
1H
OLE
: T
02
5,20
amg/
L I
__I
-2)3
00 m I
IJ_
0 2.
000
4,00
0 6,
000
8,0
00
0C
HLO
RID
E
CO
NC
EN
TR
AT
ION
, IN
M
ILLI
GR
AM
S
PE
R
LIT
ER
(m
g/L)
.
10
WA
TE
R
CO
NT
EN
T,
IN
PE
RC
EN
T
BY
W
EIG
HT
15
-800
-6
00
-400
-2
00M
AT
RIC
P
OT
EN
TIA
L,
IN
ME
TE
RS
(m
) O
F
WA
TE
R
1010
* 10
*10
'10
*
AG
E
OF
S
OIL
W
AT
ER
, IN
Y
EA
RS
Figu
re 1
0. V
ertic
al p
rofil
es o
f obs
erve
d ch
lorid
e co
ncen
tratio
n in
soi
l wat
er, w
ater
con
tent
and
mat
ric p
oten
tial o
f soi
l, an
d es
timat
ed a
ge o
f so
il w
ater
at h
oles
T01
and
T02
in a
rea
F01.
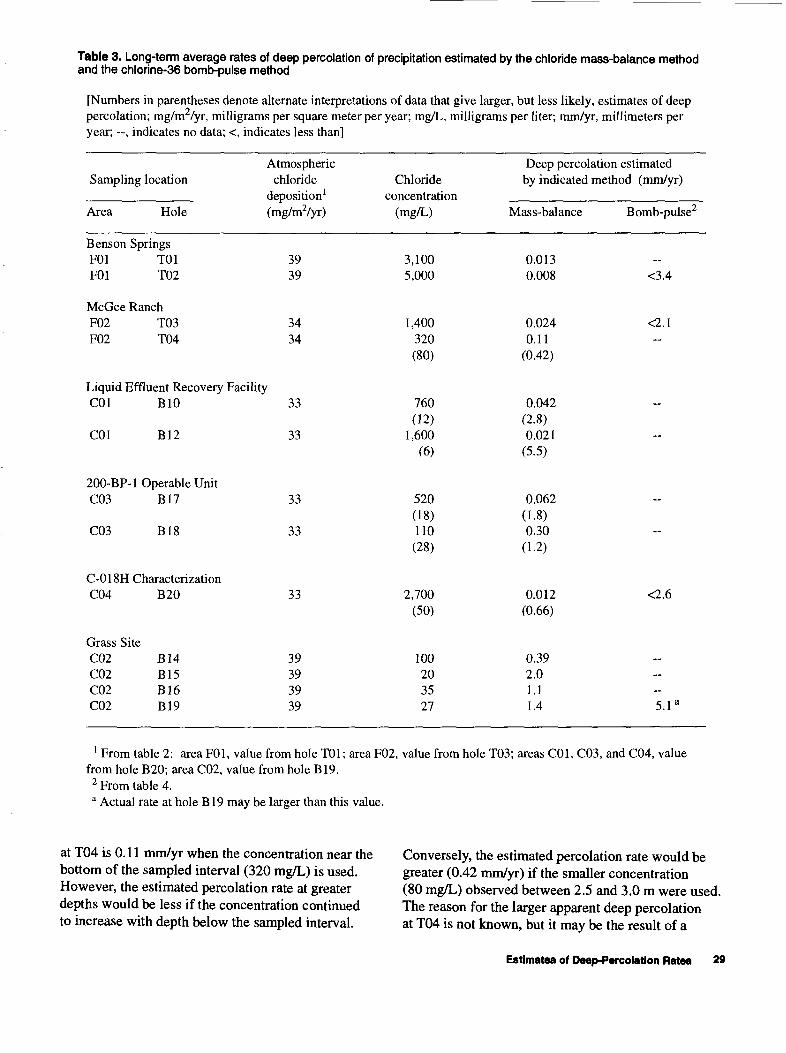
Table 3. Long-term average rates of deep percolation of precipitation estimated by the chloride mass-balance method and the chlorine-36 bomb-pulse method
[Numbers in parentheses denote alternate interpretations of data that give larger, but less likely, estimates of deep percolation; mg/m /yr, milligrams per square meter per year; mg/L, milligrams per liter; mm/yr, millimeters per year; , indicates no data; <, indicates less than]
Sampling location
Area Hole
Benson Springs F01 T01 F01 T02
Atmospheric chloride
deposition 1 (mg/m2/yr)
39 39
Chloride concentration
(mg/L)
3,100 5,000
Deep percolation estimated by indicated method (mm/yr)
Mass-balance Bomb-pulse2
0.013 0.008 <3.4
McGee Ranch F02 T03 F02 T04
C01 B12
200-BP-l Operable Unit C03 B17
C03 B18
C-018H Characterization C04 B20
Grass Site C02 B14 C02 B15 C02 B16 C02 B19
3434
Liquid Effluent Recovery Facility C01 BIO 33
33
33
33
33
39393939
1,400 320 (80)
760(12)
1,600(6)
520 (18) 110
(28)
2,700 (50)
100203527
0.024 0.11
(0.42)
0.042 (2.8)0.021
(5.5)
0.062 (1.8)0.30
(1.2)
0.012 (0.66)
0.39 2.0 1.1 1.4
<2.6
5.1'
1 From table 2: area F01, value from hole T01; area F02, value from hole T03; areas C01, C03, and C04, value from hole B20; area C02, value from hole B19.
2 From table 4.a Actual rate at hole B19 may be larger than this value.
at T04 is 0.11 mm/yr when the concentration near the bottom of the sampled interval (320 mg/L) is used. However, the estimated percolation rate at greater depths would be less if the concentration continued to increase with depth below the sampled interval.
Conversely, the estimated percolation rate would be greater (0.42 mm/yr) if the smaller concentration (80 mg/L) observed between 2.5 and 3.0 m were used. The reason for the larger apparent deep percolation at T04 is not known, but it may be the result of a
Estimates of Deep-Percolation Ratea 29
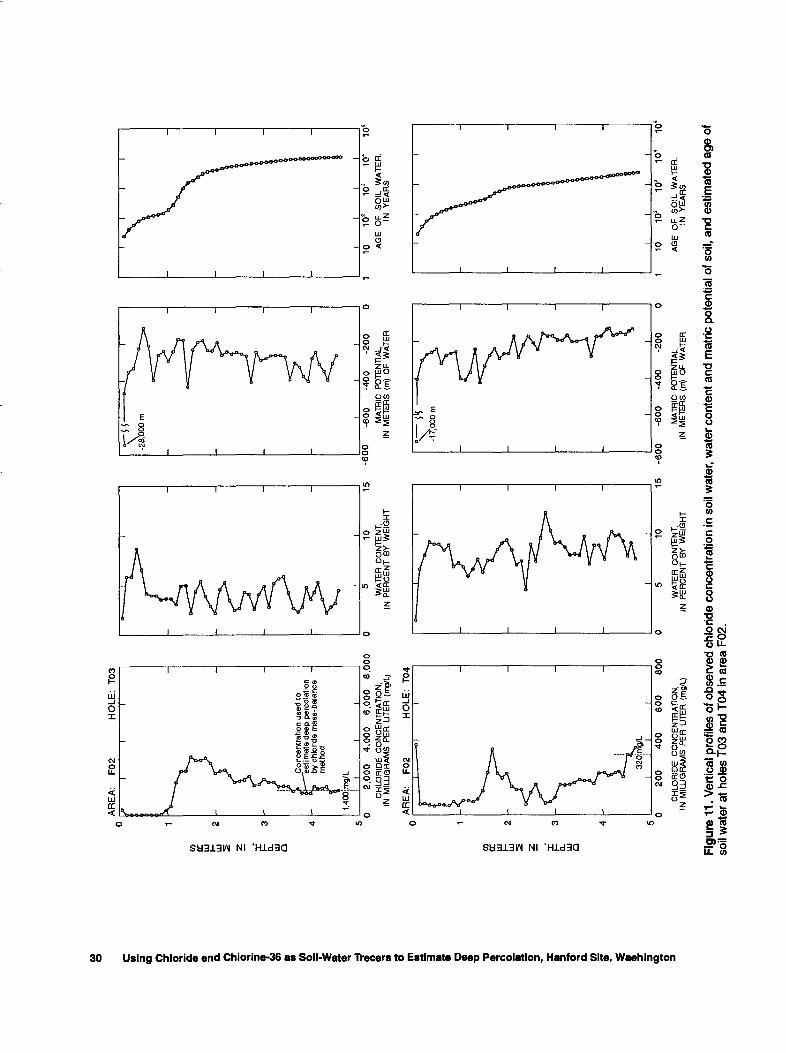
AR
EA
: F
02H
OLE
: T
03
* i o Q.
<0 S a
o m M o o m a. o_
5" a.
w S i
w ec
111 LU Q LU
t-
LJJ
UJ
Q
Con
cent
ratio
n us
ed t
o
estim
ate
deep
per
cola
tion
by c
hlor
ide
mas
s-ba
lanc
e m
etho
d
1,40
0;m
g/L
2,00
0 4,0
00
6,0
00
8,00
0C
HLO
RID
E
CO
NC
EN
TR
AT
ION
, IN
M
ILLI
GR
AM
S
PE
R L
ITE
R (
mg/
L)
10W
AT
ER
CO
NT
EN
T,
IN P
ER
CE
NT
BY
WE
IGH
T
A
RE
A:
F02
0 i
n:
HO
LE:
T04
320:
n
200
400
60
08
00
CH
LOR
IDE
C
ON
CE
NT
RA
TIO
N,
IN M
ILLI
GR
AM
S P
ER
LIT
ER
(m
g/L)
WA
TE
R C
ON
TE
NT
, IN
P
ER
CE
NT
BY
WE
IGH
T
15
-600
-6
00
-400
-2
00M
ATR
IC
PO
TEN
TIA
L,
IN
ME
TE
RS
(m
) O
F W
AT
ER
101
0'
103
10
'10
s
AG
E
OF
S
OIL
W
AT
ER
, IN
Y
EA
RS
II
I-6
00
-600
-4
00
-200
MA
TRIC
P
OTE
NTI
AL,
IN
M
ETE
RS
(m
) O
F W
AT
ER
10
1
02
10
s 10
4 10
s
AG
E
OF
S
OIL
W
AT
ER
, IN
Y
EA
RS
Figu
re 1
1. V
ertic
al p
rofil
es o
f obs
erve
d ch
lorid
e co
ncen
tratio
n in
soi
l wat
er, w
ater
con
tent
and
mat
ric p
oten
tial o
f soi
l, an
d es
timat
ed a
ge o
f so
il w
ater
at h
oles
T03
and
T04
in a
rea
F02.
redistribution of water by the hummocky topography in area F02 (see, for example, Link and others, 1994).
The estimates of deep percolation at all four lo cations in the two areas of fine-grained soil are in the range of estimates by previous investigators using other methods. These include estimates of 0.0 mm/yr using lysimeters (Gee and others, 1992), 1.8 mm/yr using a numerical model (Smoot and others, 1989), and less than 0.1 mm/yr using soil-moisture account ing (Bauer and Vaccaro, 1990). Although absolute dif ferences between current and previous estimates are of the order of a few millimeters or less, relative dif ferences are of the order of factors of 10 or more.
Visual inspections of the walls of trenches T01, T02, and T03 at the times the samples were collected revealed layered evaporite deposits at about 1 m depth and deeper. Thicknesses of these layers ranged from a few tens to a few hundreds of millimeters. At T01 the thickness of the shallowest layer varied over this range within 1 m horizontally. Plant roots were abun dant in the soil above the topmost evaporite layer but were sparse below this layer. There was a dense mat of roots on top of the upper evaporite deposit in some places. The concentration profiles and visual observa tions of roots and evaporite deposits in these three trenches suggest that most of the precipitation that in filtrates the land surface at these locations remains in the upper 1 or 2 m of soil until it evaporates or is used by plants; little percolates to greater depths. The ob served evaporite deposits at T04 were much less de veloped than at the other trenches, which may be related to the larger estimated percolation rate at this location.
When the samples for this study were being col lected from trench T01, staff of the Pacific Northwest Laboratories (PNL) collected and analyzed an inde pendent set of samples from the wall of this trench along a vertical line about 1 m east of where the sam ples for the current study were being collected. These data were provided to the author by Ellyn M. Murphy (E.M. Murphy, Battelle, Pacific Northwest Laborato ries, Richland, Wash., written commun., July 12, 1990), and graphs of the data were published by Mur phy and others (199la). The average chloride concen tration in soil water from deeper than 1.8 m in the PNL set of samples was 13 percent greater than the average concentration in corresponding samples col lected for the present study (see fig. 10). This larger concentration would result in an estimated percolation rate that is 13 percent lower than the 0.013 mm/yr ob tained in the present study. The average concentration
in the PNL samples from shallower than 0.8 m was about four times as great as the average in corre sponding samples for the present study (130 mg/L). Although the difference between concentrations at the shallow depths was large, these concentrations were in the root zone and were not used in making esti mates by the mass-balance method; however, they were used in calculations of the age of soil water. The differences in concentrations in both the deep and shallow samples either could reflect actual differences in concentrations in the samples collected from the two closely spaced locations or could be a result of small differences in laboratory procedures for deter mining concentrations, even though both laboratories used basically the same methods.
Vertical profiles of water content of the soil were similar at T01, T02, and T03 (figs. 10 and 11). Water contents at depths below about 2 m were most ly between 3 and 5 percent by weight at T01 and T02 but were slightly smaller (2 to 5 percent) at T03. (To obtain water content in percent by volume, multiply water content in percent by weight by the ratio of the dry bulk density of the soil to the density of water, which for these silty soils is about 1.4.) Water con tents at depths shallower than about 1.2 m were most ly between 5 and 7 percent by weight at T01 and T02 but were smaller and larger at T03. Water contents, as well as chloride concentrations, in this shallow zone probably vary seasonally in response to infiltrating precipitation and evapotranspiration. The observed small water contents at a depth of about 0.1 m at TO 1, T03, and T04 probably were a result of a dry period that preceded the sampling. Water contents at T04 at nearly all depths were larger (mostly in the range 6 to 10 percent) than at T01, T02, or T03, which is consis tent with the smaller chloride concentrations and larg er estimated percolation rate at T04.
Observed values of matric potential were of the order of minus hundreds of meters of water. The rela tively large negative values (large soil suction) indi cate that the flow of water was probably controlled more by gradients in matric potential than by gravity. At each of the four sampling locations in areas F01 and F02, the direction of the potential gradient within about 0.1 m of land surface indicates that at the time of sampling the soil was losing water to the atmo sphere (water flows in the direction of decreasing po tential). A loss of water to the atmosphere is consistent with the fact that a dry season preceded the time of sampling. Gradients in matric potential at depths greater than a few tenths of a meter were not
Estimatea of Deep-Parcolation Rates 31
consistent among holes or with depth at some of the holes. In some cases the direction of the general gra dient is obscured by scatter of the data. At T01 the general trend of the matric potential suggests the flow of water was upward in the zone shallower than about 1 m and was downward below this depth. At T02 the gradients suggest that between about 0.2 and 1 m depth water was flowing down, and between about 1 and 3 m depth water was flowing up. At T03 there was a steep gradient indicating upward flow of soil water at depths shallower than about 0.5 m, but the apparent trend in matric potential below this depth suggests downward flow. At T04 the trend in matric potential suggests an upward flow of soil water throughout the depth of the soil profile.
The observed matric potentials and inferred di rections of flow could represent only the time that the samples were collected and not be representative of mean annual flow directions. Measurements of poten tial with in-place thermocouple psychrometers at an arid site near Beatty, Nev., varied seasonally down to depths of about 7 m (Fischer, 1992). However, varia tions in water content at depths greater than about 2 m were too small to be detected.
The estimated ages of soil water at the bottom of the sampled profiles are about 2,500 years at T04, 10,000 years at T01 and T03 and 23,000 years at T02 (figs. 10 and 11). Ages were estimated using equation 5 with observed chloride concentrations, estimated chloride fluxes from table 2, and a dry bulk specific gravity of 1.4 g/cm3 . The oldest ages at T01, T03, and T04 are consistent in that they are less than 13,000 years, the approximate youngest age of the Touchet beds, which is the parent material in areas F01 and F02. The oldest estimated age at T02 exceeds the esti mated age of the soil. The reason for the abnormally high estimated age is unknown, but one possible rea son is that this location may have received runoff, and hence chloride, from adjacent locations. If this were true, then the chloride flux used in the denominator of equation 5 for this location is low and the estimated age is high. This would also mean that the chloride- flux term in the numerator of equation 4 for estimat ing deep percolation are also low, causing the deep percolation at this location to be underestimated.
A deep-percolation rate computed from a chlo ride concentration at a given depth is an estimate of the deep-percolation rate that is a result of the climate, soil, and vegetation that existed at and during some period following the time the soil water at that depth fell as precipitation. The estimated ages of soil water
near the tops of the zones of large chloride concentra tion at T01, T02, and T03 range from about 1,000 to 3,000 years. Consequently, the present soil, vegeta tion, and climate conditions will result in deep- percolation rates that equal the estimated rates only if these conditions have not changed in the previous 1,000 to 3,000 years. (The rates for T03 were estimat ed from chloride concentrations at the bottom of the profile where the estimated age is about 10,000 years but where the chloride concentrations are smaller and yield estimates that are greater than would be ob tained if the larger concentrations at lesser depths were used.)
Areas C01, COS, and C04
The soil in each of the areas C01, C03, and C04 consists of about 0.6 m of silty sand overlying tens of meters of material that is predominantly sandy gravel or gravelly sand. The upper parts of the distributions of chloride concentration in these areas (figs. 12, 13, and 14) were similar to the distributions in areas F01 and F02 (figs. 10 and 11) in that concentrations were relatively small near the surface but increased rather abruptly by a factor of 10 or more at depth. However, the depths at which the increases occurred are 2 to 8 m as compared with 1 to 2 m in areas F01 and F02. Maximum concentrations at holes B12 and B20 were in the thousands of milligrams per liter, as they were at three of the four holes in areas F01 and F02. At BIO and B17 concentrations exceeded 500 mg/L, but at B18 maximum concentrations were only about 200 mg/L and concentrations varied erratically. Also, con centrations at all holes in areas C01, COS, and C04 de creased to less than about 50 mg/L at depths greater than about 10m. Similar decreases in concentration with depth were not observed in the data from areas F01 and F02, perhaps because samples from areas F01 and F02 were not collected from as great a depth (maximum of 5 m) as were samples from areas C01, C03, and C04 (more than 20 m). It is proposed that the elevated concentrations at the intermediate depths are the result of climatic, soil, and vegetal conditions that existed over the past few thousand years and that the smaller concentrations at greater depths are relics of different earlier conditions. Events that changed conditions are discussed later in this section.
Deep-percolation rates at locations in areas C01, C03, and C04 were estimated from the chloride concentrations in the depth intervals with the greatest concentrations (table 3, and figs. 12, 13, and 14). The
32 Using Chloride and Chlorine-36 as Soli-Water Tracers to Estimate Deep Percolation, Hanford Site, Washington
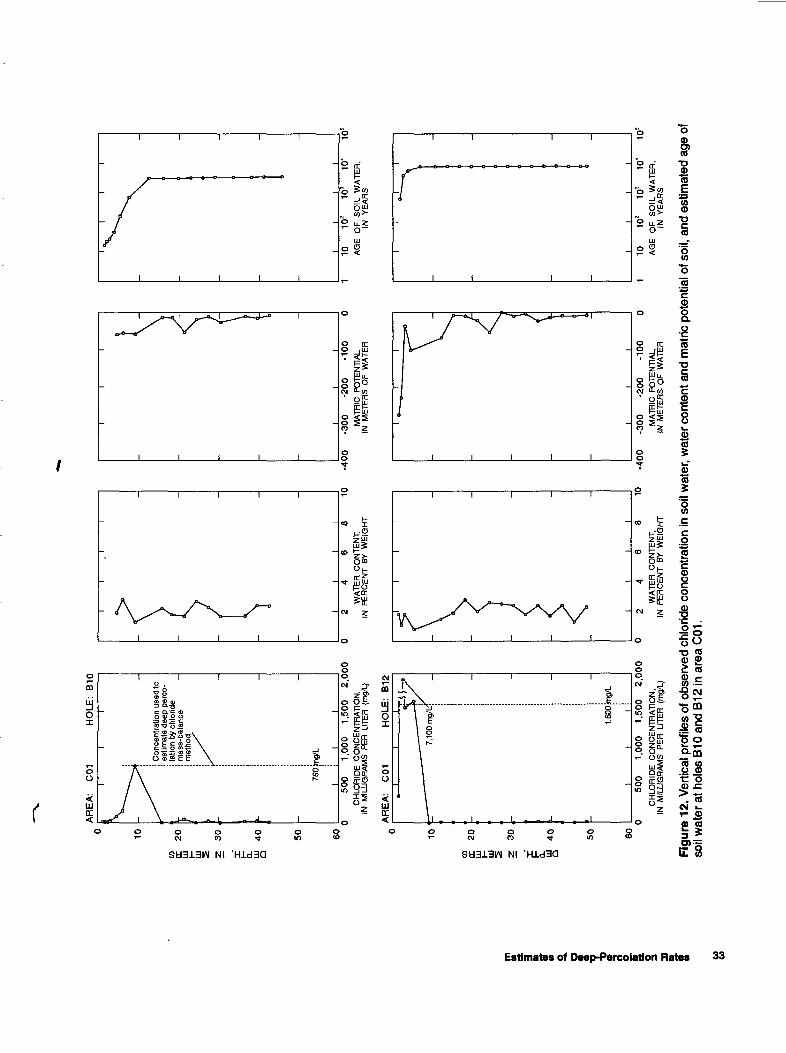
U, LU
AR
EA
: C
01H
OLE
: B
IO
10
-
20
|t
Z
30
-
0. jtj
40
-
50
-
60
I
Con
cent
ratio
n us
ed to
es
timat
e de
ep p
erco
la
tion
by c
hlor
ide
mas
s-ba
lanc
e m
etho
d
760
-ng/
L II
500
1.00
0 1,
500
2,0
00
CH
LJO
RID
E
CO
NC
EN
TR
AT
ION
, IN
M
ILL
IGR
AM
S
PE
R
LIT
ER
(m
g/L)
II
I
WA
TE
R
CO
NT
EN
T,
IN
PE
RC
EN
T
BY
W
EIG
HT
10
-40
0
-30
0
-20
0
-100
MA
TR
IC
PO
TE
NT
IAL,
IN
M
ET
ER
S O
F
WA
TE
R
1010
" 10
s 10
' 10
sA
GE
O
F
SO
IL
WA
TE
R,
IN
YE
AR
S
AR
EA
: C
01H
OLE
: B
12
CO
1C is LU 5
20 30
4°
50 60
1,60
0 m
g/L
500
1,00
0 1,
500
2,0
00
CH
LO
RID
E
CO
NC
EN
TR
AT
ION
, IN
M
ILL
IGR
AM
S
PE
R
LIT
ER
(m
g/L
)W
AT
ER
C
ON
TE
NT
, IN
P
ER
CE
NT
B
Y W
EIG
HT
I o_
10-4
00
-3
00
-2
00
-100
MA
TRIC
PO
TEN
TIAL
, IN
.ME
TE
RS
OF
WA
TER
10
102
103
10'
10s
AG
E
OF
S
OIL
W
AT
ER
, IN
Y
EA
RS
Figu
re 1
2. V
ertic
al p
rofil
es o
f obs
erve
d ch
lorid
e co
ncen
tratio
n in
soi
l wat
er, w
ater
con
tent
and
mat
ric p
oten
tial o
f soi
l, an
d es
timat
ed a
ge o
f so
il w
ater
at h
oles
B10
and
B12
in a
rea
C01
.u
u
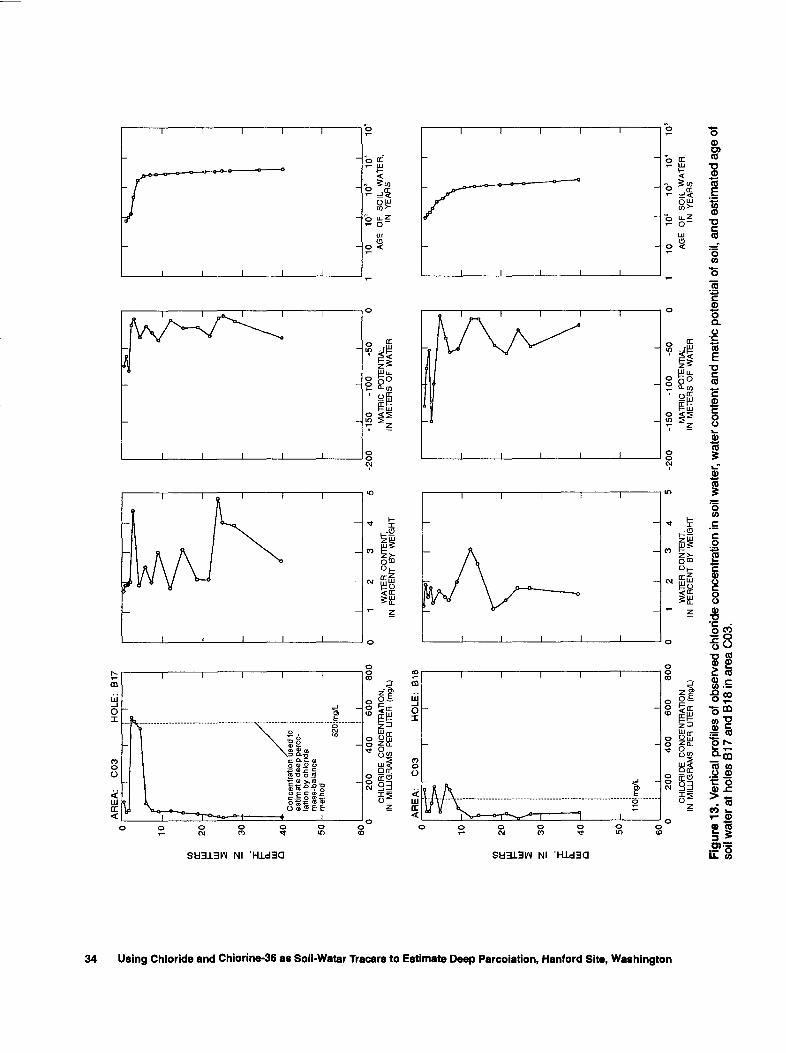
AR
EA
: C
OS
H
OLE
: B
17o> 1'
O I
O 5" a> o> (0
o I §
O m I 2 8 *
I CO
CO ir UJ i- UJ 2 UJ
Q CO ir UJ 2 UJ
Q
10 20
^
30
40 50 60
Con
cent
ratio
n us
ed to
es
timat
e de
ep p
erco
la
tion
by c
hlor
ide
mas
s-ba
lanc
e m
etho
d
520
mg/
L
200
400
600
800
CH
LOR
IDE
CO
NC
EN
TRA
TIO
N,
IN
MIL
LIG
RA
MS
PE
R L
ITER
(m
g/L)
WA
TER
CO
NTE
NT,
IN
P
ER
CE
NT
BY W
EIG
HT
AR
EA
: C
OS
HO
LE:
B18
10 20 30 40 50 60
\
110
mg/
L
200
400
600
800
CH
LOR
IDE
CO
NC
EN
TRA
TIO
N,
IN
MIL
LIG
RA
MS
PE
R L
ITER
(m
g/L)
WA
TER
CO
NTE
NT,
IN
P
ER
CE
NT
BY W
EIG
HT
II
II
-200
-150
-TO
O-5
0
MA
TRIC
PO
TEN
TIAL
, IN
M
ETE
RS
OF
WA
TER
10
10*
101
10"
AG
E
OF
SO
IL
WA
TER
, IN
Y
EA
RS
II
-200
-1
50-1
00-5
010
102
103
10s
105
MA
TRIC
PO
TEN
TIAL
, IN
M
ETE
RS
OF
WA
TER
AG
E
OF
SO
IL
WA
TE
R,
IN
YE
AR
S
Figu
re 1
3. V
ertic
al p
rofil
es o
f obs
erve
d ch
lorid
e co
ncen
tratio
n in
soi
l wat
er,
wat
er c
onte
nt a
nd m
atric
pot
entia
l of s
oil,
and
estim
ated
age
of
soil
wat
er a
t ho
les
B17
and
B18
in a
rea
COS.
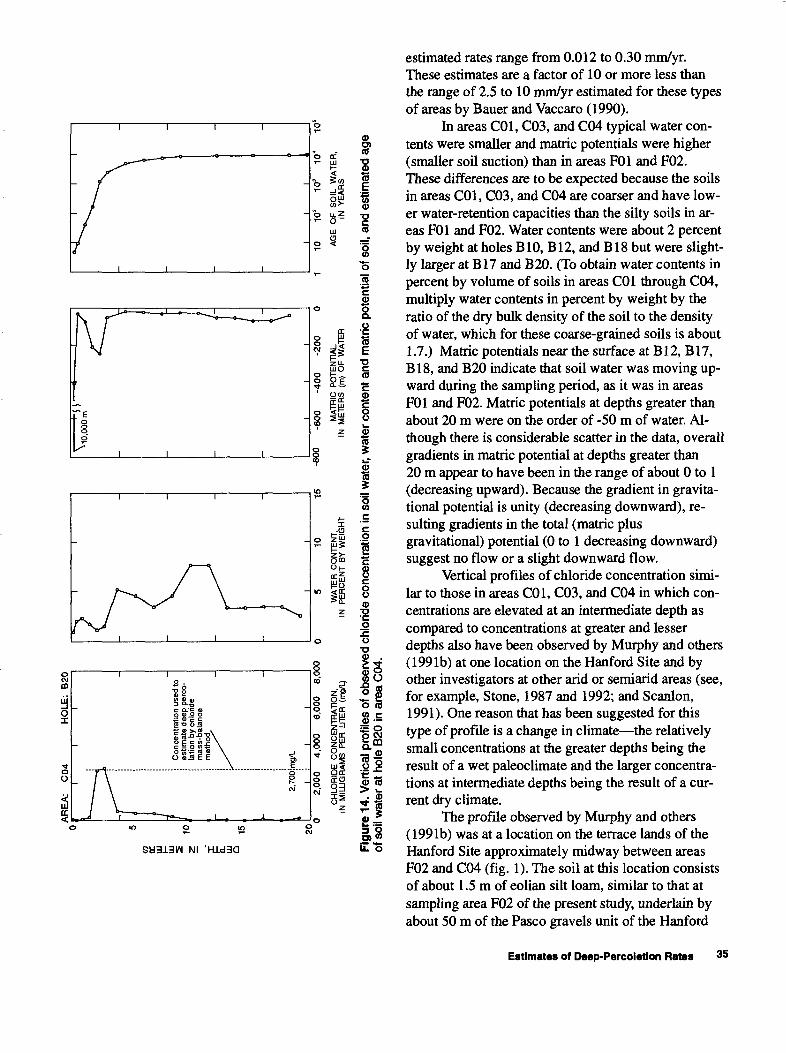
CO
IT
UJ UJ
Q
/0 5 10 15 20 CV
RE
A:
C04
HO
LE
:I
I I
f3
B20 -
Con
cent
ratio
n us
ed to
es
timat
e de
ep p
erco
la
tion
by c
hlor
ide
mas
s-ba
lanc
e m
etho
d
2,70
0 m
g/L
1 1
12
,00
0
4,0
00
6,0
00
8,01
CH
LOR
IDE
CO
NC
EN
TRA
TIO
N,
IN M
ILU
GR
AM
S
PER
LI
TER
(m
g/L)
5
10
WA
TER
CO
NTE
NT,
IN
P
ER
CE
NT
BY W
EIG
HT
15-8
00
-600
-4
00
-200
MA
TRIC
PO
TEN
TIAL
, IN
M
ETE
RS
(m
) O
F W
ATE
R
1010
* 10
3 10
* 10
s
AG
E
OF
SO
IL
WA
TE
R,
IN
YE
AR
S
Figu
re 1
4. V
ertic
al p
rofil
es o
f obs
erve
d ch
lohd
e co
ncen
tratio
n in
soi
l wat
er,
wat
er c
onte
nt a
nd m
atric
pot
entia
l of s
oil,
and
estim
ated
age
of
soi
l wat
er a
t hol
e B
20 in
are
a C
04.
u UI
lil
cr o
3-
formation. Chloride concentrations at this location were also in the thousands of milligrams per liter in an interval about 2 to 5 m below land surface, but concentrations were less than 100 mg/L at greater depths. The age of soil water at the bottom of the in terval with large chloride concentrations was estimat ed to be about 13,000 years. One of the proposed reasons for the relatively small concentrations at depth was that the deeper water is partly residual wa ter from the catastrophic floods on the Columbia Riv er, the last of which occurred about 13,000 years ago. This location was inundated by the floods, and the flood waters, which probably had relatively small chloride concentrations, most likely saturated the soil and flushed or diluted the chloride that was in the soil at that time. (Typical chloride concentrations in mod ern Columbia River water are less than 5 mg/L.) Wa ter with larger chloride concentrations at intermediate depths was assumed to be percolating water from pre cipitation during the past 13,000 years that has be come more concentrated in chloride as a result of evapotranspiration.
Jolly and others (1989) found relatively large differences in thickness of the near-surface layer with small chloride concentrations among locations with similar soil and climate in Australia. They attributed the differences to changes in land use in some areas during the past 100 years. They concluded that re moving native vegetation had resulted in increased deep percolation with a corresponding decrease in chloride concentration.
A possible reason for the decrease in chloride concentration at depth that was observed in areas C01, C03, and C04 of the present study can be constructed by combining and modifying the explanations that Murphy and others (1991b) and Jolly and others (1989) proposed for their data. Because the estimated ages of soil water at the bottoms of the intervals with elevated concentrations in areas C01, C03, and C04 range from about 1,000 to 8,000 years, all the deep water with small chloride concentration cannot be re sidual river water from the flood that occurred 13,000 years ago. Instead, it is proposed here that the small concentrations at depth are a result of deep percola tion having been much greater for a period of about 5,000 or more years (depending on location) follow ing the last catastrophic flood than it has been in more recent times. The change in percolation rate is attrib uted to changes in hydraulic conductivity and water- holding capacity of the top 1 or 2 m of soil and in
vegetation. Change in climate is a less likely cause of the change in percolation because similar effects are not evident in the data from areas F01 and F02.
The floods that saturated and flushed the soil most likely also disturbed or deposited the sands and gravels that presently are beneath the present surficial soil. It is proposed here that for thousands of years following the last flood the surficial soil on the Pasco gravels, and perhaps the vegetation, was poorly devel oped. During this period the vertical hydraulic con ductivity of the upper few meters was relatively high, water-holding capacity was relatively low, and deep- rooted plants were not prevalent. Consequently, deep- percolation rates during this period were relatively high, and the percolating water had relatively small chloride concentrations. Percolation rates during this period, which can be estimated from the chloride con centrations in the deep soil water (table 3, values in parentheses), ranged from 0.66 to 5.5 mm/yr and are of the order 10 to 100 times the percolation rates esti mated using the larger chloride concentrations at the intermediate depths. Eventually the surficial soil was modified by weathering and deposition of fine grained wind-blown deposits, and a community of deep-rooted plants became established. Consequently, vertical hydraulic conductivity decreased, and water- holding capacity and evapotranspiration increased, re sulting in decreases in deep-percolation rates and increases in the chloride concentrations of the perco lating water. The elevated chloride concentrations at the intermediate depths in figures 12 to 14 are a result of percolation during this period, and the estimated deep-percolation rates for this period (representing more recent conditions) are those in table 3 without parentheses.
An alternative reason for the small chloride concentrations at depth is that the deep water is water that percolated rapidly from the land surface to these depths along preferred pathways and was not subject to much evapo- transpiration. This explanation is un likely, however, because anthropogenic 36C1 is absent at the depths where the chloride concentrations are small (fig. 9, hole B20).
Area C02
In area C02, the Grass Site sampling area, the soil profile consists of about 0.6 m of loamy sand un derlain by about 9 m of relatively clean sand. Chlo ride concentrations at all four sampling locations in
36 Using Chloride and Chlorine-36 as Soil-Water Tracers to Estlmata Deep Percolation, Hanford Site, Washington
this area were relatively small and did not increase with depth as did the concentrations in the other sam pling areas (figs. 15 and 16). Concentrations used to estimate deep percolation by the chloride mass-bal ance method ranged from 20 to 100 mg/L, and the es timated percolation rates range from 0.39 to 2.0 mm/ yr (table 3). The estimates of deep percolation rates for this area are larger than the estimated rates for any of the other areas. One reason for this is probably that the vegetal cover at C02 consists only of sparse, shal low-rooted grasses, whereas the other areas have deep-rooted plants, which can withdraw water from deeper in the soil column, in addition to grasses. Another reason may be that the hydraulic conductivity of the shallow soil at C02 is greater than at C01, C03, orC04.
Although the estimated percolation rates at the four locations in area C02 are larger than those esti mated at the other three areas with coarse-grained soils, the rates estimated in the present study for the locations in C02 are at the low end of the range of Rockhold and others' (1990) estimates (0.06 to 28 mm/yr) and are much less than Bauer and Vaccaro's (1990) estimate (23 mm/yr). It may be possible that the estimated deep-percolation rates in this area are smaller than actual current rates. If area C02 was veg etated with deep-rooted plants before the wildfire, as suggested by Gee (see the description of area C02 in the section "Descriptions of Hanford Site and Sam pling Areas"), and if deep-percolation rates were less before the fire than they are now, the chloride mass- balance method would underestimate deep-percola tion rates for present conditions if present chloride concentrations have not yet come into equilibrium with present percolation rates. It also may be possible that the chloride concentrations determined for the samples from area CO2, which were small, are in er ror. (See section on chloride concentrations in the sec tion "Methods of Sample Collection and Analysis".)
Water contents at all four holes in area C02 tended to increase with depth from about 2 percent by weight at 1 m below land surface to about 5 percent by weight at 9 m depth at the bottom of the sampling interval (figs. 15 and 16). Water content in the top 0.5 m at B19 increased toward the surface to about 9 per cent, but water content at each of the other three holes in this area either decreased slightly toward the sur face or had the same trend as was observed deeper in the profile. The probable reason for the larger water content near land surface at B19 is that the weather
was cooler and wetter prior to the collection of sam ples from this location (November 19 and 20,1991) than prior to the collection of samples from the other three locations (September 25-27, 1990). The differ ences between the near-surface water content at B19 and the other 3 holes are similar to the seasonal differ ences observed by Rockhold and others (1990), who monitored water content using neutron probes in 25 holes in the area for a number of years.
Values of matric potential at depths greater than about 3 m at locations B14, B15, and B16 were on the order of only -1 m of water (figs. 15 and 16), suggest ing that water flow at these depths was controlled mainly by gravity rather than by matric potential. The potentials at these depths at B19 were greater than -5 m except for one value of about -20 m. Gradients of matric potential near the surface were relatively steep and changed with water content. The potential decreased towards the surface at B14, B15, and B16, indicating an upward flow of water at the time the samples were collected. At B19 the gradient of the po tential in the surficial 0.2 m indicates that water from the relatively moist surface was draining downward. A comparison of matric potential and water content at depths between 0.6 and 3 m at B14, B15, and B16 in dicates that the potential is a sensitive function of wa ter content for water contents less than about 2.5 percent by weight.
Estimated ages of soil water at the bottoms of the sampling intervals range from about 300 to 700 years except at B14, where the age is about 1,900 years (figs. 15 and 16).
Deep Percolation Estimated by the Chlorine- 36 Bomb-Pulse Method
In this section concentrations of anthropogenic 36C1 are used to estimate upper limits of deep-percola tion rates by the bomb-pulse method. In three of the four holes where 36C1 data were collected, 36C1/C1 ra tios were elevated in about the top 1.5 or 3 m but were at natural levels at greater depths (holes T02 and T03 on fig. 8, and hole B20 on fig. 9). At the fourth hole (B19, fig. 9) 36C1/C1 ratios were elevated even in the deepest sample.
Deep-percolation is estimated (eq. 6) by divid ing the quantity of water in the soil profile shallower than some characteristic point on the 36C1 profile by the elapsed time between the centroid of 36C1 fallout
Estimates of Deep-Percolation Rates 37
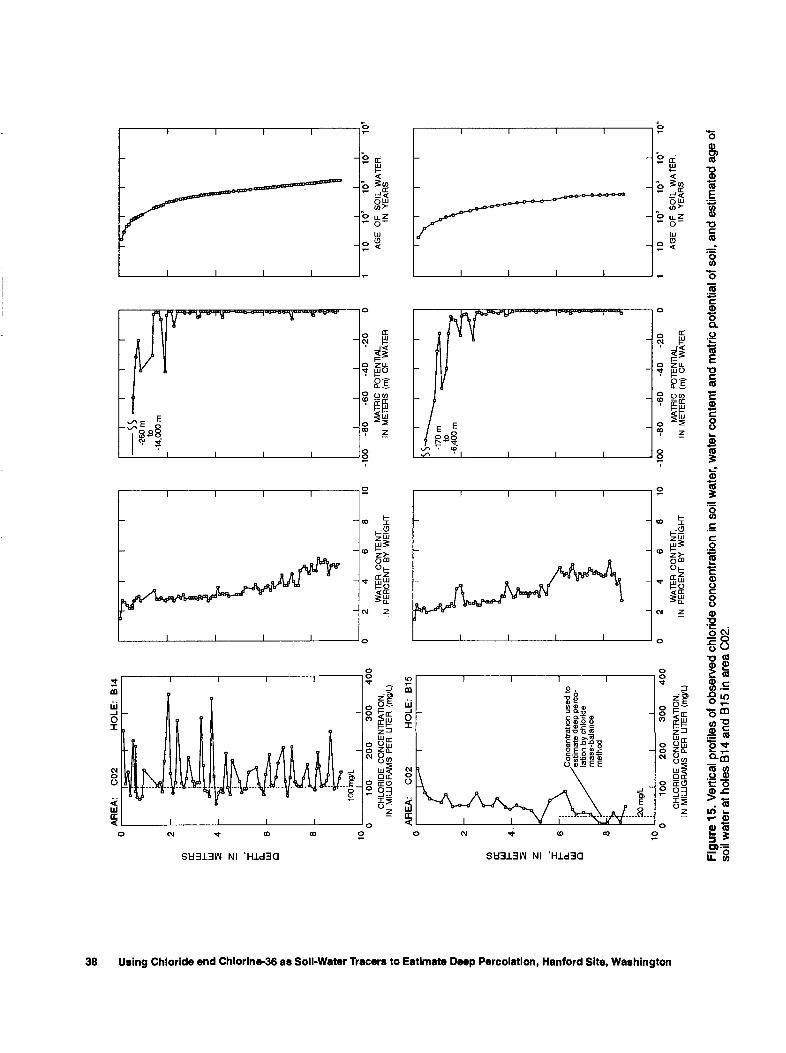
AR
EA
: C
02
HO
LE:
B14
M 5'
<o O Q. i 5 m » o
i § s i 3 m 3 Q.
CO I
w
cc LU
6
Q W
CC LU
Q
1010
0:m
g/L
I__
__
__
II
0
100
200
300
400
CH
LOR
IDE
C
ON
CE
NT
RA
TIO
N,
IN
MIL
LIG
RA
MS
PE
R
LITE
R
(mg/
L)W
AT
ER
C
ON
TE
NT
, IN
P
ER
CE
NT
B
Y
WE
IGH
T
AR
EA
: C
02H
OLE
: B
15
.Con
cent
ratio
n us
ed to
es
timat
e de
ep p
erco
la
tion
by c
hlor
ide
mas
s-ba
lanc
e m
etho
d
100
200
300
400
CH
LO
RID
E
CO
NC
EN
TR
AT
ION
, IN
M
ILL
IGR
AM
S
PE
R
LIT
ER
(m
g/L)
WA
TE
R
CO
NT
EN
T,
IN
PE
RC
EN
T
BY
W
EIG
HT
10 10
-100
-8
0 -6
0 -4
0 -2
0M
AT
RIC
P
OT
EN
TIA
L,
IN
ME
TE
RS
(m
) O
F
WA
TE
R
II
II
-100
-8
0 -6
0 -4
0 -2
0M
AT
RIC
P
OT
EN
TIA
L,
IN
ME
TE
RS
(m
) O
F
WA
TE
R
1010
"1
03
10"
10
s
AG
E
OF
S
OIL
W
AT
ER
, IN
Y
EA
RS
II
I
10
10"
10"
10'
10s
AG
E
OF
S
OIL
W
AT
ER
, IN
Y
EA
RS
Figu
re 1
5. V
ertic
al p
rofil
es o
f obs
erve
d ch
lorid
e co
ncen
trat
ion
in s
oil w
ater
, w
ater
con
tent
and
mat
ric p
oten
tial o
f soi
l, an
d es
timat
ed a
ge o
f so
il w
ater
at h
oles
B14
and
B15
in a
rea
C02
.
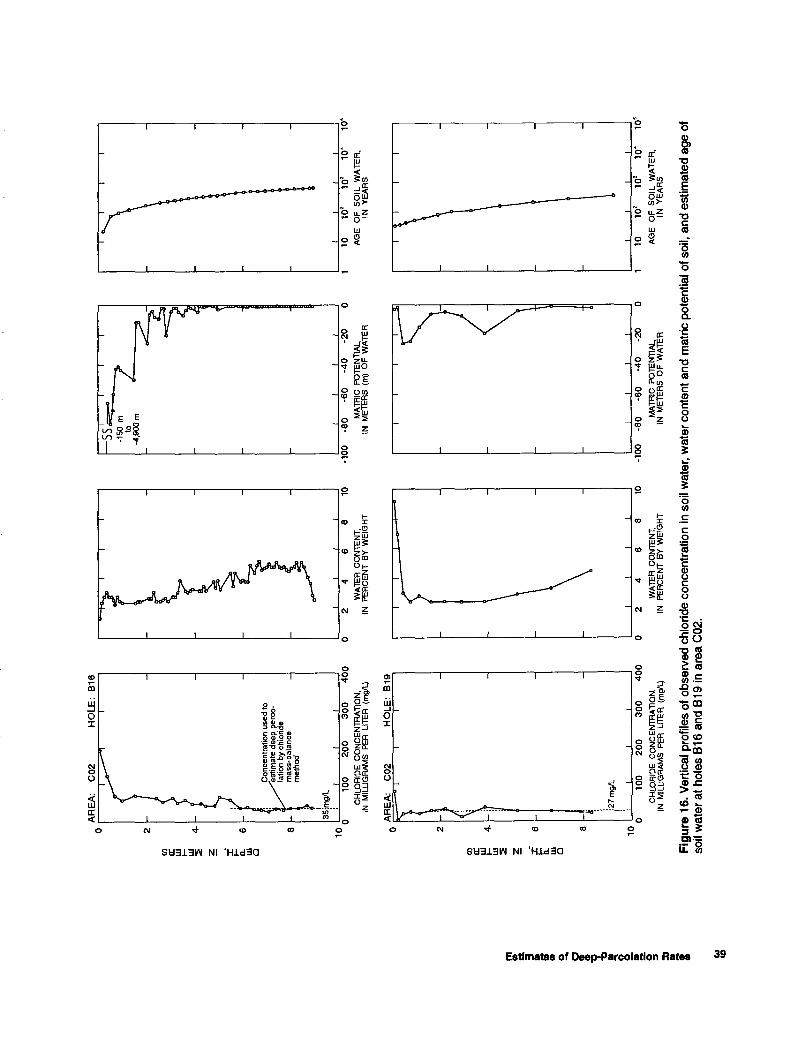
AR
EA
: C
02H
OLE
: B
16
CO EC
m I-
ui 5 a.
m
a
10
Con
cent
ratio
n us
ed to
'e
stim
ate
deep
per
co
latio
n by
chl
orid
e m
ass-
bala
nce
met
hod
35!m
g/l_ 10
0 200
30
0
40
0C
HLO
RID
E C
ON
CE
NTR
ATI
ON
, IN
M
ILLI
GR
AMS
PER
LIT
ER
(m
g/L)
WA
TER
CO
NTE
NT,
IN
P
ER
CE
NT
BY W
EIG
HT
hSS -150
m
to-4
,900
m
\ I
I
II
10-1
00
-80
-6
0
-40
-20
MA
TRIC
PO
TEN
TIAL
, IN
M
ETE
RS
(m
) O
F W
ATE
R
10
10"
103
104
10s
AG
E
OF
SO
IL
WA
TER
, IN
YE
AR
S
CO or IS
m 5 m
Q
AR
EA
C
02
10
HO
LE
: B
19
: 27
mg/
L II
100
200
30
04
00
CH
LOR
IDE
CO
NC
EN
TRA
TIO
N,
IN
MIL
LIG
RAM
S PE
R L
ITER
(m
g/L)
WA
TER
CO
NTE
NT,
IN
P
ER
CE
NT
BY W
EIG
HT
I10
-100
-8
0
-60
-4
0-2
0
MA
TRIC
PO
TEN
TIA
L,
IN M
ETE
RS
OF
WA
TER
1010
* 10
3 10
* 10
s
AG
E
OF
SO
IL W
AT
ER
, IN
YE
AR
S
Fig
ure
16.
Ver
tical
pro
files
of
obse
rved
chl
orid
e co
ncen
trat
ion
in s
oil w
ater
, w
ater
con
tent
and
mat
ric p
oten
tial o
f soi
l, an
d es
timat
ed a
ge o
f so
il w
ater
at
hole
s B
16 a
nd B
19 in
are
a C
02.
w
<o
from the bomb tests (1957) and sample collection (1990 to 1992). This calculation gives an upper limit rather than an unbiased estimate of the quantity of post-bomb precipitation that will become deep perco lation because a fraction of the water present in the root zone will be lost by evapotranspiration before the water moves deeper. The characteristic point on the 36C1 profile that is used here is the centroid (center of mass) of anthropogenic 36C1. The vertical distribution of anthropogenic 36C1 (figs. 8 and 9) is obtained by subtracting the natural 36C1/C1 ratio from the observed ratio and multiplying by the concentration of total chloride and the ratio of the atomic weights of the two forms of chloride (36.0/35.4). Note that these concen trations are in units of mass of chloride per mass of dry soil rather than per volume of soil water. If the dry bulk density of the soil is approximately uniform, the centroids of the distributions of 36C1 concentration shown in figures 8 and 9 approximate the centers of mass of anthropogenic 36C1.
Estimated Rates
Upper limits of deep-percolation rates estimated by the bomb-pulse method at the three locations with deep-rooted vegetation (T02, T03, and B20) are 3.4, 2.1, and 2.6 mm/yr, respectively (table 4). All three of these estimates are about 100 times the rates estimat ed by the mass-balance method. Average concentra tions of total chloride in soil water shallower than the centroids at these three locations were about one-tenth the concentrations below the root zone, which sug gests that about nine-tenths of the soil water that was shallower than the centroids at the time of sampling may eventually be lost by evapotranspiration, and therefore the calculated upper limits may be as much as 10 times the actual deep-percolation rates. Dividing the upper limits by 10 would yield percolation rates that are less than 1 mm/yr; however, they still would be about 10 times the estimates obtained by the mass- balance method.
Because ratios of 36C1/C1 were elevated even in the deepest samples from hole B19 in area C02 (fig. 9), the data do not define the entire profile of anthro pogenic 36C1 at this location. Therefore, the calculated depth to the centroid (3.46\xl 1m) and the deep-perco lation rate (5.1 mm/yr) are less than would be calcu lated if data from greater depths were available. Also, because there is little difference between chlo ride concentrations in shallow and deep soil water, the quantity of shallow water that eventually will be
lost by evapotranspiration is probably small. Conse quently, the estimate of 5.1 mm/yr probably is not an upper limit on the deep-percolation rate at this loca tion, and the actual deep-percolation rate is probably greater than this quantity. Although 5.1 mm/yr is still larger than the rates estimated by the mass-balance method at the four test locations in area C02 (0.39 to 2.0 mm/yr), the estimates by the mass-balance method may be too small if there is residual chloride in the soil water from the period before the wildfire when deep-percolation rates in this area may have been less.
Depths below land surface to the centroid of an thropogenic 36C1 at T02, T03, and B20 ranged from 1.06 to 1.50 m (figs. 8 and 9, and table 4). Depths to the peak 36C1/C1 ratio were only about half as much, and depths to the maximum observed depth of anthro pogenic 36C1 are one and one-half to two times the depths to the centroids (table 4). The upper limits of deep percolation that would be computed if either of these depths were used in place of the depth to the centroid would also be about half or one and one-half to two times the values obtained using the centroids. Depths to the medians of the distributions (not shown) are within 10 percent of depths to centroids. The com puted depth to the centroid at B19 (3.46 m) is more than twice that at the other three locations even though as much as two-thirds of the anthropogenic 36C1 may be below the deepest analyzed sample (see following subsection).
Inventoried Amounts of Anthropogenic Chlorine-36
Inventoried amounts of anthropogenic 36C1 in the soil at T02, T03, and B20 range from l.lxlO12 to 2.5xl012 atoms/m2 . These amounts were computed by integrating the anthropogenic-36Cl concentration over depth and multiplying by soil density and the appro priate units conversion factor (see table 4). The reason for the differences among locations is unknown, but similar differences have been observed at other study sites (see, for example, Phillips and others, 1988). The inventoried amount at B19 (0.39xl012 atoms/m2) is about one-third the minimum at the other three loca tions, which suggests that two-thirds or more of the anthropogenic 36C1 at this location may have moved deeper than the deepest sample collected there. All calculated amounts are less than or only slightly more than 2.0xl012 atoms/m2, the total bomb fallout esti mated for the latitude of Hanford (Phillips and others, 1988). The inventoried amounts are also less than or
40 Using Chloride and Chlorine-36 as Soil-Water Tracers to Estimate Deep Percolation, Hanford Site, Washington
Table 4. Deep-percolation rates estimated by the chlorine-36 bomb-pulse method, and observed amounts and depths of vertical movement of anthropogenic chlorine-36
[atoms/m , atoms per square meter; mm/yr, millimeters per year; g/cm3 , grams per cubic centimeter; cm , square centimeter, m , square meter; g/mole, grams per mole; mg/g, milligrams per gram; , indicates not determined; <, indicates less than; >, indicates greater than]
Depth to indicated point on vertical 36C1 profile, in meters, and estimated age of soil water at that depth, in years
Sampling location
Area
F01 F02 C02 C04
Hole
T02 T03 B19 B20
Natural 36C1/C1
ratio3
735xlQ- 15 854xlQ- 15 748xlO' 15 876xlO" 15
Amount of anthro pogenic 36Cl,b in
atoms/m2
2.5xl012 l.SxlO 12 0.39xl0 12 l.lxlO 12
Peak of 36C1/C1 ratio
Depth
0.64 0.38-0.89
0.91
Age
85 75-140
25
Center of mass of anthropogenic 36C1
Depth
1.37 1.06
>3.46 1.50
Age
1,200 230
>120 95
Maximum depth of anthropogenic 36C1
Depth
1.78 1.78
>5.91 3.05
Age
5,000 3,300 >210 2,500
Estimated deep per colation,0 in mm/yr
<3.4 <2.1
5.1 d
<2.6
a From table 2.
b Obtained by integrating the concentration of anthropogenic 36C1 in soil (figs. 8 and 9) from land surface to the maximum depth of observed anthropogenic 36C1, multiplying by the estimated dry bulk density of the soil (1.4 g/cm3 in areas F01 and F02, and 1.7 g/cm3 in areas C02 and C04), and multiplying by the units conversion factor: [(6.02x10 23 atoms/mole) x (104cm2/m2 )] / [(36 g/mole) x (103 mg/g)].
0 Estimated by dividing the amount of water in soil profile above center of mass of anthropogenic Cl by the time elapsed between the centroid of bomb-36Cl fallout (1957) and the time of sampling [1990 at T02 and T03 (elapse time 33 years); 1991 at B19 (elapse time 34 years); and 1992 at B20 (elapse time 35 years)].
d Data from hole B19 was not deep enough to define entire profile of anthropogenic 36C1; therefore, total anthropogenic 36C1 is greater than observed, and deep-percolation rate may be greater than estimated value.
similar to amounts inventoried by Norris and others(1987) at one of two sites in Nevada (6xl012 atoms/ m2), by Trotman (1983) and Phillips and others(1988) at three sites in New Mexico (0.74xl012 , 0.89x10¹² , and 2.5x10¹² atoms/m2), and by Scanlon (1992) at one location in Texas (2.5xl0 12 atoms/m2). Cecil and others (1992) inventoried 44x1012 atoms/m2 at one location on the Idaho Engineering Laboratory and attributed the large amount to stack emissions at this facility.
The fact that the inventoried amounts of anthro pogenic 36C1 at Hanford are less than or only slightly more than estimated total bomb-36Cl fallout and are similar to amounts inventoried by others at other semiarid locations in North America that are not near sources of anthropogenic 36C1 supports the assump tion that most of the anthropogenic 36C1 observed at the Hanford test locations is, as assumed, from the 1950's bomb tests. Any fallout from Hanford opera tions that occurred before the dates of the bomb tests would increase the estimated upper limits on percola
tion. Fallout from Hanford operations that might have occurred at about the same time as the bomb tests would not affect estimated percolation rates regardless of the amount of fallout. Fallout from Hanford opera tions that occurred later than the bomb tests would de crease estimates and also could cause secondary peaks in 36C1/C1 ratios and 36C1 concentrations at depths less than the primary peaks caused by the bomb tests. Al though 36CVC1 ratios at T03, B19, and B20 (figs. 8 and 9) do have secondary peaks at depths less than 0.5 m, the masses of 36C1 associated with these peaks (as seen in the profiles of 36C1 concentration) are relative ly small and have little effect on the computed depths of the centroids and estimated percolation rates.
Differences Between Depths to Centroid of An thropogenic Chlorine-36 and Peak of 36CI/CI Ratio
The time between the centroid of the temporal distribution of bomb-36Cl fallout and sampling varies from 33 to 35 years (footnote 3, table 4). However,
Estimates of Deep-Percolation Rates 41
the estimated ages of soil water at the depths of the anthropogenic-36Cl centroid are considerably greater (95 to 850 years), and the estimated ages of soil water at the maximum observed depths of anthropogenic 36C1 are greater still (>210 to 5,000 years). Estimated ages at the depths of the peak 36C1/C1 ratio (20 to 130 years) more closely approximate the elapsed time be tween the bomb tests and sampling; however, this should not be interpreted to mean that the depth to the peak ratio should be used in preference to the depth to the centroid when estimating deep percolation by the bomb-pulse method. The reason that depths to the centroids of the 36C1 distributions are greater than depths to where the 36C1/C1 ratios are maximum is suspected to be a result of differences in the rate of vertical movement of water and chloride along differ ent flow paths as discussed in the following para graphs.
The depth to the center of mass of anthropogen ic 36C1 was greater than the depth to the maximum 36C1/C1 ratio at holes T02, T03, and, to a lesser extent, at B20 (figs. 8 and 9). Given the temporal distribution of fallout from the 1950's bomb tests (fig. 3), these differences in depths would not be expected if all chloride at a given depth moved vertically at the same rate (so-called piston flow). The reason that depths to the centroid are greater is believed to be a result of variations within a given depth in the mobility or rate of vertical movement of chloride. Vertical distribu tions of concentrations of total chloride and of 36C1 in dicate that a substantial fraction of anthropogenic 36C1 had moved into the zone of elevated total-chloride concentrations where estimated ages of soil water (or chloride) are much older than the age of the anthropo genic 36C1 (figs. 8 and 9). This should not be interpret ed to mean that the 36C1 isotope is inherently more mobile than other chloride isotopes. Instead, the data can be interpreted to imply that there are significant differences in the rates of vertical movement of water and chloride along different flow paths. These varia tions must occur over horizontal distances smaller than the horizontal dimensions of the samples from which the data were obtained (about 0.3 m or less).
It is proposed that the observed combination of relatively large concentrations of 36C1 and relatively low 36CI/C1 ratios in the zone of large total-chloride concentrations is a result of the combination of some water and chloride from the time of the 1950's bomb tests in pathways of relatively rapid movement and a larger amount of older water in adjacent pathways or zones of relatively slow movement. Slowly moving
water would be more subject to evapotranspiration than rapidly moving water and would tend to have larger chloride concentrations. Water would move more slowly in zones with fine soil texture and poorly connected pore spaces than in zones with coarse soil texture, cracks in soil, or old root channels. Although some chloride also could be immobilized by being sorbed to soil particles, it is commonly accepted that there is little adsorption of anions (chloride) by soil when the pH is basic or neutral, as is typical of Han ford and other arid-land soils (see, for example, Bohn and others, 1985, p. 188). Also, any chloride in the soil that was in a crystalline state rather than dissolved in soil water would be immobile but still would be ex tracted by the laboratory process used to determine chloride concentration. It is not known if there are any chloride salts in the evaporites.
An alternative explanation for the differences between depths to peak ratios and to centroids is that the peak ratios result from relatively recent fallout of small amounts of 36C1 from operations at Hanford, whereas the locations of centroids are controlled by the relatively large amounts of bomb fallout at the ear lier time. However, this explanation does not account for the abnormally large estimated ages of soil water at the depths of the centroids.
Effects of Variations in Rates of Chloride Movementon Estimated Rates of Deep Percolation
An assumption implicit in equation 4 for esti mating the rate of deep percolation by the chloride mass-balance method is that the rate of movement of water and chloride at any given depth is uniform. However, as proposed in the preceding section, the rate of movement of chloride in some cases may be variable at a given depth. Consequently, it is prudent to consider how this variability may affect deep-per colation rates that are estimated by both the mass-bal ance and the bomb-pulse methods.
Chloride Mass-Balance Method
An expression for the downward flux of chlo ride, d(Qcl), through some small horizontal area dA can be written as the sum of an advective flux plus a diffusive and dispersive flux:
= (®wc)dA - QD(dc/dz)dA, (8)
42 Using Chloride snd Chlorine-36 ss Soll-Wster Trscers to Estimate Deep Percolstion, Hanford Site, Washington
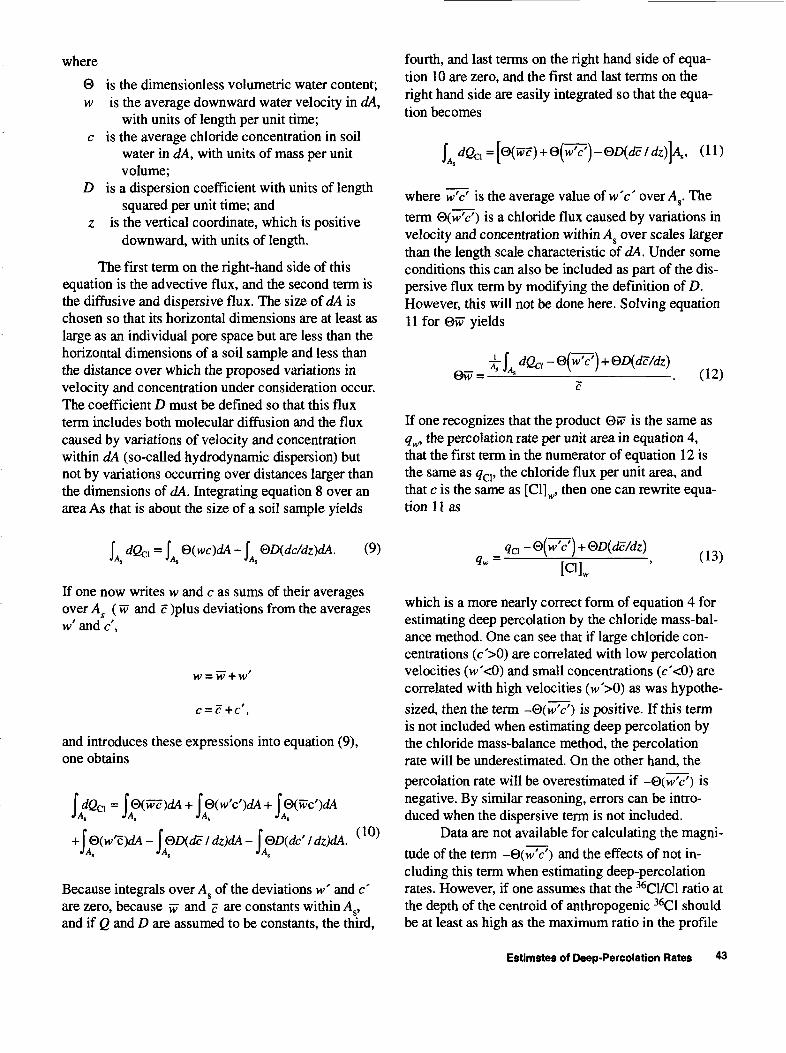
where
0w
D
is the dimensionless volumetric water content; is the average downward water velocity in dA,
with units of length per unit time; is the average chloride concentration in soil
water in dA, with units of mass per unitvolume;
is a dispersion coefficient with units of lengthsquared per unit time; and
z is the vertical coordinate, which is positivedownward, with units of length.
The first term on the right-hand side of this equation is the advective flux, and the second term is the diffusive and dispersive flux. The size of dA is chosen so that its horizontal dimensions are at least as large as an individual pore space but are less than the horizontal dimensions of a soil sample and less than the distance over which the proposed variations in velocity and concentration under consideration occur. The coefficient D must be defined so that this flux term includes both molecular diffusion and the flux caused by variations of velocity and concentration within dA (so-called hydrodynamic dispersion) but not by variations occurring over distances larger than the dimensions of dA. Integrating equation 8 over an area As that is about the size of a soil sample yields
f <fQci=f &(wc)dA-\ &D(dc/dz)dA. (9)"s *Ag 'Ag
If one now writes w and c as sums of their averages over As ( w and c )plus deviations from the averages w' and c',
= c+c',
and introduces these expressions into equation (9), one obtains
= [@(wc)dA+ [@(w'c')dA + [@(wc')dA JAS JAS JA,
f Siw^dA - f QD(dc I dz)dA - f QD(dc' I dz)dA. ( * 0) JA. JA. JA.
Because integrals over As of the deviations w' and c' are zero, because w and c are constants within As, and if Q and D are assumed to be constants, the third,
fourth, and last terms on the right hand side of equa tion 10 are zero, and the first and last terms on the right hand side are easily integrated so that the equa tion becomes
= \&(wc) + 0(^7?) - QD(dc I dz)\ \ , (11)
where w'c' is the average value of w'c' over As . The term Q(w'c') is a chloride flux caused by variations in velocity and concentration within As over scales larger than the length scale characteristic of dA. Under some conditions this can also be included as part of the dis persive flux term by modifying the definition of D. However, this will not be done here. Solving equation 11 for &w yields
(12)&w =
If one recognizes that the product &w is the same as qw, the percolation rate per unit area in equation 4, that the first term in the numerator of equation 12 is the same as qcl, the chloride flux per unit area, and that c is the same as [Cl]^, then one can rewrite equa tion 11 as
@D(dc/dz)(13)
which is a more nearly correct form of equation 4 for estimating deep percolation by the chloride mass-bal ance method. One can see that if large chloride con centrations (c'>0) are correlated with low percolation velocities (w'<0) and small concentrations (c'<0) are correlated with high velocities (w'>0) as was hypothe sized, then the term -®(w'c') is positive. If this term is not included when estimating deep percolation by the chloride mass-balance method, the percolation rate will be underestimated. On the other hand, the percolation rate will be overestimated if -0(w'c') is negative. By similar reasoning, errors can be intro duced when the dispersive term is not included.
Data are not available for calculating the magni tude of the term ~&(w'c') and the effects of not in cluding this term when estimating deep-percolation rates. However, if one assumes that the 36C1/C1 ratio at the depth of the centroid of anthropogenic 36C1 should be at least as high as the maximum ratio in the profile
Estimates of Deep-Percolation Rates 43
and that the reason it is not as high is the presence of old less mobile chloride (with low 36C1/C1 ratios) in the zone of large total- chloride concentrations, then one can hypothesize that the fraction of more mobile chloride is on the order of the 36C1/C1 ratio at the depth of the centroid of anthropogenic 36C1 divided by the maximum observed ratio in the profile. At holes T02, T03, and B20 this quotient is on the order of one-third (figs. 8 and 9). Because it is the concentra tion of mobile chloride that should be used in equa tion 4, deep-percolation rates in table 3 at locations T02, T03, and B20, and perhaps other locations, that were estimated by using equation 4 may be low by a factor of about three. However, even if the percolation rates in table 3 that were obtained with equation 4 were multiplied by this factor, the percolation rates es timated for most locations except those in area C02 would still be less than 1 mm/yr.
Chlorine-36 Bomb-Pulse Method
If all water and chloride at a given depth do not move at the same rate, then it would not be valid to assume that all water in the soil profile shallower than the centroid of anthropogenic 36C1 infiltrated the ground since the time of the bomb tests. If some of the water shallower than the centroid is older than the bomb tests, the upper limit of deep percolation esti mated with the bomb-pulse method would still be a valid upper limit; however, the estimate would exceed the actual value by more than it would if all the water were younger than the bomb tests.
Areal Variability Of Estimates
Deep-percolation rates that were estimated by the chloride mass-balance method (table 3) vary con siderably among locations with similar soil and vege tal cover. Differences between estimates in the same area range from about 50 percent in area F01 to a fac tor of about five in areas F02, C02, and C03. Also, rates estimated for areas with similar soil and vegetal cover differ by a factor of two or more. Examples are areas F01 and F02 and areas C01, C03, and C04. Rea sons for the differences between estimated rates with in individual areas and between supposedly similar areas are unknown, but these variations are typical of what other investigators have found. Cook and others (1989) investigated the variability of deep-percolation rates over an area of about 14 hectares using the chlo
ride mass-balance method and a geophysical tech nique to estimate chloride concentrations. They found that the distribution of percolation rates was approxi mately log-normally distributed and that the standard deviation was 0.91 natural log units. From this, one can compute that the ratio of percolation rates one standard deviation larger and smaller than the mean (e°-9l/e'°-91) is about six. Variations in estimated deep- percolation rates in the current study are consistent with this ratio. Because of the variability, it is appar ent that if one desires an accurate estimate of the aver age deep percolation for an area, estimates must be obtained at a large number of locations.
SUMMARY AND CONCLUSIONS
Quantifying rates at which water from precipi tation moves down through unsaturated soils and sediments and potentially recharges the aquifer be neath the U.S. Department of Energy Hanford Site is critical for assessing the environmental risk posed by stored or buried radioactive and other wastes at the site and for selecting appropriate isolation or treat ment strategies for storage and remediation. In the present study, long-term average rates of deep perco lation of water from precipitation on the Hanford Site in semiarid south-central Washington were estimated at a total of 13 locations in 6 undisturbed areas using a chloride mass-balance method and at 1 location in each of 4 of the areas using a chlorine-36 (36C1) bomb-pulse method.
To estimate deep-percolation rates by the chlo ride mass-balance method, the long-term atmospher ic-chloride deposition rate was divided by chloride concentration in soil water deeper than that at which evapotranspiration occurs. The deposition rate was es timated by dividing the natural rate of production of 36C1 in the atmosphere by the observed 36C1/C1 ratio in deep soil water that is older than the oldest anthropo genic 36C1. This method was based on the assumptions that atmospheric deposition was the only source of chloride; that all chloride was dissolved in soil water; that all water and chloride at a given depth moved downward at a uniform rate; and that chloride concen trations in the percolating water changed (increased) with depth only because some of the water, but none of the chloride, was lost by evapotranspiration.
The bomb-pulse method used as a tracer 36C1 from atmospheric fallout from nuclear-weapons tests in the Pacific Ocean during the 1950's. Anomalously
44 Using Chloride end Chlorine-36 as Soil-Wster Trscers to Estimate Deep Percolstion, Hanford Site, Washington
large relative concentrations of 36C1 in soil water served as a marker on water that fell as precipitation during the period of fallout. The quantity of soil water shallower than the centroid of mass of bomb-36Cl was approximately the quantity of water that infiltrated the land surface since the fallout occurred and had not yet been lost by evapotranspiration. This quantity of wa ter divided by the time elapsed since the bomb tests is an upper limit on the deep-percolation rate because some of the shallow soil water may be lost by evapo transpiration before it moves deeper.
Implicit in both methods was the assumption that all chloride and water at a given depth move at the same rate (plug flow). Because this assumption probably was never fully satisfied, the mass-balance method probably underestimated the deep-percolation rate. Consequently, the estimates by the two methods probably bracketed actual deep-percolation rates.
Of the six areas where deep-percolation rates were estimated, two of them (F01 and F02) were cov ered with more than 4 m of silt loam, and three of them (C01, C03, and C04) had a 0.6-m-thick surficial layer of loamy sand or sandy loam overlying tens of meters of sand and gravel. All five of these areas were vegetated with sagebrush and other deep-rooted plants plus sparse shallow- rooted grasses. The sixth area (C02) also had a 0.6-m-thick surficial layer of loamy sand overlying about 9 m of sand; however, this area was vegetated with only sparse shallow-rooted grass es. Estimates by the bomb-pulse method were made at one location in each of areas F01, F02, C04, and C02.
Observed average natural 36C1/C1 ratios in deep soil water ranged from 735xlO- 15 to 876X10' 15 , and the corresponding estimated atmospheric chloride fluxes ranged from 33 to 39 mg/m2/yr. These fluxes are two or more times the flux from precipitation alone, which implies that dry deposition was a major component of the atmospheric flux.
Deep-percolation rates estimated by the chlo ride mass-balance method at four locations in the two areas with deep silt loam (F01 and F02) ranged from 0.008 to 0.11 mm/yr. These estimates are consistent with estimates by previous investigators that used soil-moisture accounting and lysimetery. Estimates at five locations in three areas with sandy soils overlying thick deposits of sand and gravel (areas C01, C03, and C04) ranged from 0.012 to 0.30 mm/yr. These esti mates are a factor of 10 or less than estimates by pre vious investigators that used soil-moisture accounting. Vertical profiles of chloride concentration in soil wa ter at these five areas that were vegetated with sage
brush and other deep-rooted plants indicate that most of the annual precipitation (160 to 210 mm/yr) is held within the top few meters of soil where it evaporates or is taken up by plants and transpires.
Estimates by the mass-balance method at four locations in area C02, where the vegetal cover con sisted only of sparse shallow-rooted grasses, ranged from 0.39 to 2.0 mm/yr and were higher than esti mates for the other areas which had deep-rooted plants. However, these estimates may be less than ac tual present deep-percolation rates because the ob served chloride concentrations may not be in equilibrium with present vegetation. Some of the chloride in soil water in this area may be residual from when the area was populated with deep-rooted plants, which were killed by wildfire sometime before December 1992, and deep-percolation rates were low er than at present. The estimates for this area are at the low end of the range of estimates by previous investi gators.
Upper limits of the deep-percolation rate esti mated by the bomb-pulse method at the three areas with deep-rooted plants (F01, F02, and C04) ranged from 2.1 to 3.4 mm/yr. Chloride concentrations in the water shallower than the centroids of anthropogenic 36C1 indicate that the calculated upper limits of deep- percolation rates at these three areas may be about 10 times the actual rates. The estimate at C02, which was vegetated only with grass, was 5.1 mm/yr; however, this estimate is suspected of being less than the actual rate rather than being an upper limit because data were not collected from deep enough at this location to define the entire anthropogenic 36C1 profile. Ob served depths to the centroid of anthropogenic 36C1 at the three locations in F01, F02, and C04 ranged from 1.06 to 1.50 m, and the depth to the centroid that was calculated with the available data at the location in area C02 was 3.46 m. Inventoried amounts of anthro pogenic 36C1 at the locations in F01, F02, and C04 ranged from l.lxlO12 to 2.5xl0 12 atoms/m2 . These amounts are similar to amounts inventoried by others at locations in North America that are not near local sources of 36C1, which implies that the source of most of the anthropogenic 36C1 at the test locations at Han- ford was the 1950's weapons tests and not operations at the Hanford Site. The inventoried amount at C02, where the entire profile of anthropogenic 36C1 was not defined, was 0.39xl012 atoms/m2 .
Estimates of deep percolation in this study by the mass-balance and bomb-pulse methods are consis tent with results from previous investigations in that
Summary and Conclusions 45
they support the hypotheses that (1) in undisturbed areas of the Hanford Site with fine-grained surficial soils and deep-rooted plants most of the water from direct precipitation is held in the upper 1 or 2 m of the soil column until it returns to the atmosphere by evapotranspiration, and only a small percentage per colates deeper; and (2) deep-percolation rates in areas with coarse-grained surficial soils and only shallow- rooted plants are greater than in areas with fine grained soils and deep-rooted plants. However, although deep-percolation rates estimated in this and previous studies for many areas on the Hanford Site are small, rates estimated by different methods for the same or similar areas can differ by more than a factor of 10.
This study also demonstrated that both the chlo ride mass-balance and 36C1 bomb-pulse methods for estimating deep-percolation rates are suitable for use on most of the Hanford Site. Limitations on the use of the methods at Hanford appear to be no different than at other arid or semiarid sites. If the mass-balance method is used to estimate the deep-percolation rate at a location where rates are expected to be a few per cent of precipitation or greater, such as in areas with out deep-rooted vegetation, special care would be required in determining the small chloride concentra tions that would be expected at these locations. The deep-percolation rates that were estimated in this study agree reasonably well with estimates that have been made by other investigators using different methods and probably are representative of large un disturbed areas of the Hanford Site with similar surfi cial soils and vegetation. However, as found in this and other studies, deep percolation can be strongly de pendent on the type of surficial soil and vegetation; therefore, the estimates in this study should not be as sumed to be typical of sites with surficial soil or vege tation that differ from that at the test locations of this study, or of sites disturbed by construction. Additional information that could be useful to understanding the hydrology of the Hanford Site could be estimates of deep-percolation rates by the chloride mass-balance and chlorine-36 bomb-pulse methods at one or more locations that have been stripped and kept clear of vegetation since at least the mid 1950's.
A better understanding of the reliability and ac curacy of the mass-balance or the bomb-pulse meth ods for estimating deep percolation could be obtained (1) by ascertaining if chloride concentrations that are determined by the laboratory methods used in this study are representative of chloride concentrations in
percolating soil water and if they are not, by testing other existing methods or developing new methods for determining concentrations of mobile chloride, and (2) by determining reasons for the large differenc es in chloride concentrations seen when concentra tions are small.
REFERENCES CITED
Allison, G.B., and Hughes, M.W., 1978, The use of environmental chloride and tritium to estimate to tal recharge to an unconfined aquifer: Australian Journal of Soil Research, v. 16, p. 181-195.
Andrews, J.N., Davis, S.N., Fabryka-Martin, J.T., Fontes, J.C., Lehmann, B.E., Loosli, H.H., Mich- elot, J.L., Moser, H., Smith, B., and Wolf, M., 1989, The in situ production of radioisotopes in rock matricies with particular reference to the Stripa granite: Geochemica et Cosmochemica Acta, v. 53, p. 1,803-1,815.
Andrews, J.N., and Fontes, J.Ch., 1992, Importance of the in situ production of 36C1, 36Ar, and 14C in hy drology and hydrogeochemistry in International Symposium on Isotope Techniques in Water Re sources Development, Vienna, 1991, Proceed ings: Vienna, International Atomic Energy Commission, p. 245-269.
Bauer, H.H., and Vaccaro, J.J., 1990, Estimates of ground-water recharge to the Columbia Plateau regional aquifer system, Washington, Oregon, and Idaho, for predevelopment and current land- use conditions: U.S. Geological Survey Water- Resources Investigations Report 88-4108, 37 p.
Beasley, T.M., Cecil, L.D., Sharma, Pankaj, Kubik, P.W, Fehn, Udo, Mann, L.J., and Gove, H.E., 1993, Chlorine-36 in the Snake River plain aqui fer at the Idaho National Engineering Laborato ry Origin and Implications: Ground Water, v. 31, no. 2, p. 302-310.
Beasley, T.M., Elmore, David, Kubik, P.W, and Shar ma, Pankaj, 1992, Chlorine-36 releases from the Savannah River Site nuclear fuel reprocessing fa cilities: Ground Water, v. 30, no. 4, p. 539-548.
Bentley, H.W, Phillips, P.M., and Davis, S.D., 1986, Chlorine-36 in the terrestrial environment, Chap. 10, in Fritz, P., and Fontes, J.Ch., eds., Handbook of environmental isotope geochemistry, v. 2, The terrestrial environment, B: New York, Elsevier Science Publishing, p. 428-480.
46 Using Chloride and Chlorine-36 as Soil-Water Tracers to Estimate Deep Percolation, Hanford Site, Washington
Bohn, H.L., McNeal, B.L., and O'Connor, G.A., 1985, Soil chemistry: New York, John Wiley and Sons, Inc., 341 p.
Brown, D.J., and Isaacson, R.E., 1977, The Hanford environment as related to radioactive waste burial grounds and transuranium waste storage facili ties: Atlantic Richfield Hanford Company, ARH- ST-155,120 p.
Cecil, L.D., Pittman, J.R., Beasley, T.M., Michel, R.L., Kubik, P.W., Sharma, Pankaj, Fehn, Udo, and Gove, H.E., 1992, Water infiltration rates in the unsaturated zone at the Idaho National Engi neering Laboratory estimated from chlorine-36 and tritium profiles, and neutron logging, in Kharaka, Y.K., and Maest, A.S., eds., Water-rock interaction Proceedings of the 7th International Symposium on Water-Rock Interaction, Park City, Utah: Rotterdam and Brookfield, A.A. Balkema, p. 709-714.
Claassen, H.C., Reddy, M.M., and Halm, D.R., 1986, Use of the chloride ion in determining hydrolog- ic-basin water budgets a 3-year case study in the San Juan Mountains, Colorado, U.S.A.: Jour nal of Hydrology, v. 85, p. 49-71.
Connelly, M.P., Borghese, J.V., Delaney, C.D., Ford, B.H., Lindberg, S.W, and Trent, S.J., 1992, Hydrogeologic model for the 200-East Ground- water Aggregate Area: Westinghouse Hanford Corporation, WHC-SD-EN-TI-019, various pagi nation.
Cook, P.O., Walker, G.R, and Jolly, I.D., 1989, Spa tial variability of groundwater recharge in a semi- arid region: Journal of Hydrology, v. Ill, p. 195-212.
Delaney, C.D., Lindsey, K.A., and Reidel, S.P., 1991, Geology and hydrology of the Hanford Site: a standardized text for use in Westinghouse Han ford Company documents and reports: Westing- house Hanford Company, WHC-SD-ER-TI-003, various pagination.
Dettinger, M.D., 1989, Reconnaissance estimates of natural recharge to desert basins in Nevada, U.S.A. by using chloride-balance calculations: Journal of Hydrology, v. 106, p. 55-78.
Elmore, David, and Phillips, P.M., 1987, Accelerator mass spectrometry for measurement of long-lived radioisotopes: Science, v. 236, p. 543-550.
Eriksson, Erik, and Khunakasem, Vachi, 1969, Chlo ride concentration in groundwater, recharge rate and rate of deposition in the Israel coastal plain: Journal of Hydrology, v. 7, p. 178-197.
Fischer, J.M., 1992, Sediment properties and water movement through shallow unsaturated alluvium at an arid site for disposal of low-level radioac tive waste near Meatty, Nye County, Nevada: U.S. Geological Survey Water-Resources Investi gations Report 92-4032, 48 p.
Fishman, M.J., and Friedman, L.C., eds., 1985, Meth ods for determination of inorganic substances in water and fluvial sediments: Techniques of Wa ter-Resources Investigations of the U.S. Geologi cal Survey, bk. 5, chap. Al, Open-File Report 85-495,709 p.
Flint, R.F., 1938, Origin of the Cheney-Palouse sea- bland tract, Washington: Geological Society of America Bulletin, v. 49, no. 3, p. 461-523.
Gee, G.W., 1987, Recharge at the Hanford Site-Status Report: Battelle Pacific Northwest Laboratory, PNL-6403, various pagination.
Gee, G.W., Payer, M.J., Rockhold, M.L., and Camp bell, M.D., 1992, Variations in recharge at the Hanford Site: Northwest Science, v. 66, no. 4, p. 237-250.
Guy, H.P., 1977, Laboratory theory and methods for sediment analysis: Techniques of Water-Resourc es Investigations of the U.S. Geological Survey, bk. 5, chap. Cl,58p.
Hajek, B.F., 1966, Soil survey Hanford project in Benton County Washington: Battelle Pacific Northwest Laboratory, BNWL-243,16 p.
Hamblen, A.P., 1981, Filter-paper method for routine measurement of filed water potential: Journal of Hydrology, v. 53, p. 355-360.
Jolly, I.D., Cook, P.O., Allison, G.B., and Hughes, M.W., 1989, Simultaneous water and solute movement through unsaturated soil following an increase in recharge: Journal of Hydrology, v. Ill, p.391-396.
Kasza, G.L., Hartman, M.J., Hodges, F.N., and Weekes, D.C., 1991, Ground water maps of the Hanford Site, June 1991: Westinghouse Hanford Company, WHC-EP-0394-3, 50 p.
Kocher, A.E., and Strahorn, A.J., 1919, Soil survey of Benton County, Washington: U.S. Department of Agriculture, Bureau of Soils, 72 p.
Lara, O.J., and Mathes, W.J., 1986, The sedigraph as an alternative method to the pipet, in Federal Interagency Sedimentation Conference, 4th, Las Vegas, Nevada, 1986, Proceedings: Sub committee on Sedimentation, Interagency Advisory Committee on Water Data, v. 1, p. 1-12.
References Cited 47
Link, S.O., Waugh, W.J., Downs, J.L., Thiede, M.E., Chatters, J.C., and Gee, G.W., 1994, Effects of coppice and dune topography on soil-water dy namics in a cold desert ecosytem: Journal of Arid Environments, v. 27, p. 265-278.
Mattick, J.L., Duval, T.A., and Phillips, P.M., 1987, Quantification of groundwater recharge rates in New Mexico using bomb-36Cl, bomb-3H, and chloride as soil-water tracers: New Mexico Water Resources Reseach Institute, New Mexico State University, WRRI Report no. 220, 184 p.
McQueen, I.S., and Miller, R.F., 1968, Calibration of a wide-range gravimetric method for measuring moisture stress: Soil Science, v. 106, no. 3, p. 225-231.
Murphy, E.M., Szescody, J.E., and Phillips, S.J., 199la, A study plan for determining recharge rates at the Hanford Site using environmental tracers: Battelle Pacific Northwest Laboratory, PNL-7626, various pagination.
Murphy, E.M., Szescody, J.E., and Phillips, S.J., 1991b, Moisture content and recharge estimates at the Yakima Barricade borehole: Pacific North west Laboratory, PNL-SA-20155,4 p.
National Atmospheric Deposition Program, 1985-91, NAPD/NTN annual data summary, precipitation chemistry in the United States: (separate reports for each year 1983-90), Natural Resource Ecolo gy Laboratory, Colorado State University, Fort Collins, Colorado, various pagination.
National Oceanic and Atmospheric Administration, 1990, Climatological data annual summary Washington 1990: National Climatic Data Center, Ashville, North Carolina, v. 94, no. 13, 35 p.
Newcomb, R.C., Strand, J.R., and Frank, F.J., 1972, Geology and ground-water characteristics of the Hanford Reservation of the U.S. Atomic Energy Commission, Washington: U.S. Geological Sur vey Professional Paper 717, 78 p.
Norris, A.E., Wolfsberg, K., Gifford, Seth, Bentley, H.W., and Elmore, David, 1987, Infiltration at Yucca Mountain, Nevada, traced by 36Cl-Nuclear Instruments and Methods, in Physics Research, no. B29, p. 376-379.
Phillips, P.M., Mattick, J.L., Duval, T.A., Elmore, David, and Kubik, P.W, 1988, Chlorine-36 and tritium from nuclear weapons fallout as tracers for long-term liquid and vapor movement in desert soils: Water Resources Research, v. 24, no.,ll,p. 1,877-1,891.
Rockhold, M.L., Payer, M.J., Gee, G.W., and Kanyid, M.J., 1990, Natural groundwater recharge and water balance at the Hanford Site: Battelle Pacif ic Northwest Laboratory, PNL-7215, various pag ination.
Scanlon, B.R., 1991, Evaluation of moisture flux from chloride data in desert soils: Journal of Hydrolo gy, v. 128, p. 137-156.
Scanlon, B.R., 1992, Evaluation of liquid and vapor water flow in desert soils based on chlorine-36 and tritium tracers and nonisothermal flow simu lations: Water Resources Research, v.28, no. 1, p. 285-297.
Scanlon, B.R., Kubik, P.W., Sharma, Pankash, Rich- ter, B.C., and Gove, H.E., 1990, Bomb chlorine- 36 analysis in the characterization of unsaturated flow at a proposed radioactive waste disposal fa cility, Chihuahan Desert, Texas-Nuclear Instru ments and Methods, in Physics Research: Elsevier Science Publishers B.V. (North-Hol land), no. B52, p. 489-492.
Smoot, J.L., Szescody, J.E., Sagar, Budhi, Gee, G.W, and Kincaid, C.T., 1989, Simulations of infiltra tion of meteoric water and contaminant plume movement in the vadose zone at single-shell tank 241-T-106 at the Hanford Site: Westinghouse Hanford Company, Richland, Washington, WHC- EP-0332, 76 p.
Stone, W.J., 1987, Paleorecharge, climatohydrologic variability, and water-resource management, in Solomon, S.I., Beran, M., and Hogg, W, eds., Proceedings of the Symposium "The influence of climate change and climate variability on the hy- drologic regime and water resources" Vancouver, British Columbia, Canada: International Associa tion of Hydrologic Sciences Publication no. 168, p. 143-152.
1992, Paleohydrologic implications of some deep soilwater chloride profiles, Murry Basin, South Australia: Journal of Hydrology, v. 132, p. 201-223.
Stone, W.A., Thorp, J.M., Gifford, O.P., and Hoitink, D.J., 1983, Climatological summary for the Han ford area: Battelle Pacific Northwest Laboratory, Richland, Washington, PNL-4622, various pagi nation.
Trent, S.J., 1992, Hydrogeologic model for the 200- West Groundwater Aggregate Area: Westing- house Hanford Company, WHC-SD-EN-TI-014, various pagination.
48 Using Chloride end Chlorine-36 es Soil-Water Tracers to Estimete Deep Percolation, Hanford Site, Washington
Trotman, K.N., 1983, Thermonuclear chlorine-36 in arid soil: Tuscon, University of Arizona, M.S. thesis, 73 p.
Tyler and Walker, 1994, Root zone effects on tracer migration in arid zones: Soil Science Society of America Journal, v. 58, no. 1, p. 25-31.
U.S. Department of Energy, 1987, Final environmen tal impact statement, Disposal of Hanford de fense high-level, transuranic and tank wastes: U.S. Department of Energy, Richland, Washing ton, DOE/EIS-0113, v. 1, various pagination.
Vacher, H.L., and Ayers, J.F., 1980, Hydrology of
small oceanic islands- utility of an estimate of re charge inferred from the chloride concentration of the fresh water lenses: Journal of Hydrology, v. 45, p. 21-37.
Weast, R.C., ed., 1975, Handbook of chemistry and physics [56th ed.]: Cleveland, Ohio, Chemical Rubber Publishing Co., various pagination.
Westinghouse Hanford Company, 1991, Hanford en vironmental information system (HEIS) user's manual: Westinghouse Hanford Company, Rich- land, Washington, WHC-EP-0372, various pagi nation.
References Cited 49
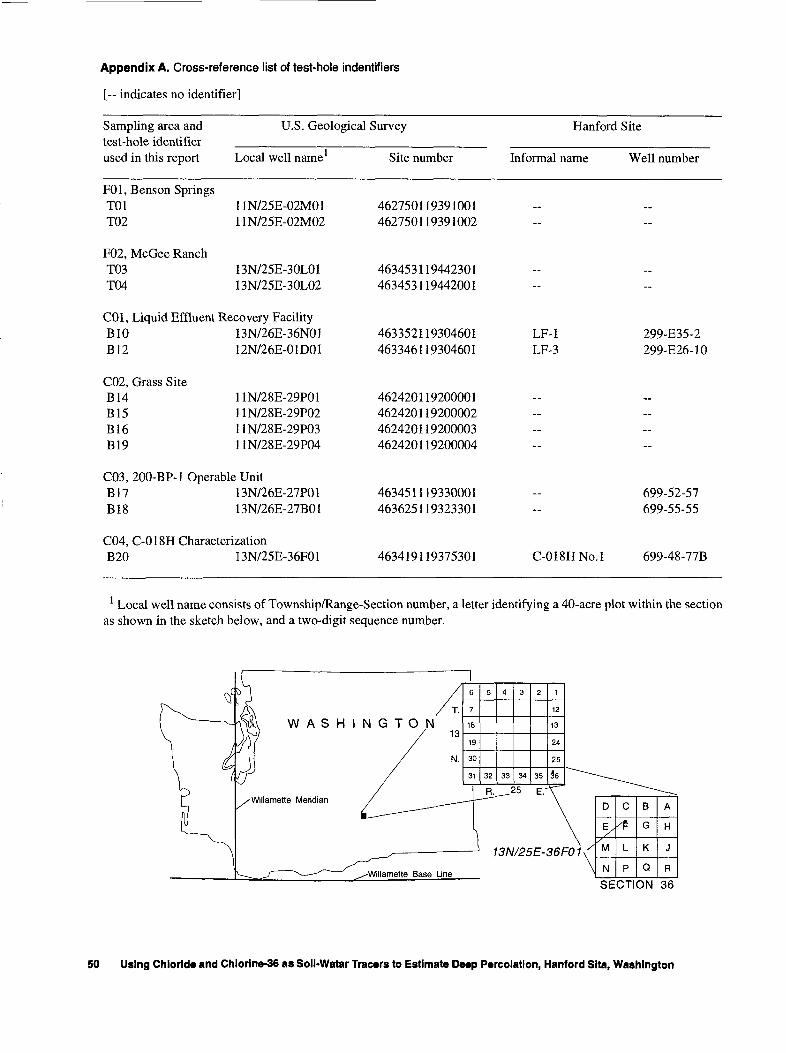
Appendix A. Cross-reference list of test-hole indentifiers
[ indicates no identifier]
Sampling area and test-hole identifier used in this report
F01, Benson Springs T01 T02
F02, McGee Ranch T03 T04
U.S. Geological Survey Hanford Site
Local well name Site number Informal name Well number
11N/25E-02M01 462750119391001 11N/25E-02M02 462750119391002
13N/25E-30L01 463453119442301 13N/25E-30L02 463453119442001
C01, Liquid Effluent Recovery Facility BIO 13N/26E-36N01 B12 12N/26E-01D01
C02, Grass SiteB14B15B16B19
11N/28E-29P01 11N/28E-29P02 11N/28E-29P03 11N/28E-29P04
C03, 200-BP-l Operable UnitB17 13N/26E-27P01B18 13N/26E-27B01
C04, C-018H Characterization B20 13N/25E-36F01
463352119304601463346119304601
462420119200001462420119200002462420119200003462420119200004
463451119330001463625119323301
463419119375301
LF-1 LF-3
299-E35-2 299-E26-10
C-OlSHNo.l
699-52-57 699-55-55
699-48-77B
1 Local well name consists of Township/Range-Section number, a letter identifying a 40-acre plot within the section as shown in the sketch below, and a two-digit sequence number.
WASHINGTON
SECTION 36
50 Using Chloride and Chlorine-36 as Soll-Watar Tracers to Estimate Deep Percolation, Hanford Sita, Washington
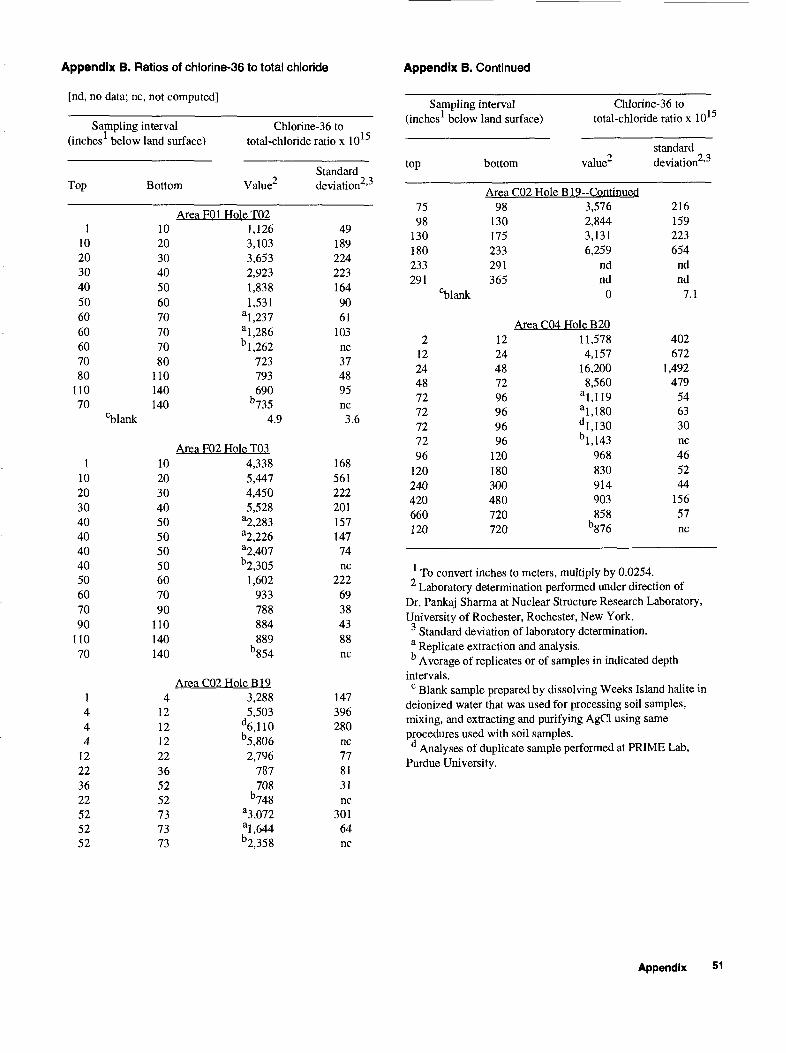
Appendix B. Ratios of chlorine-36 to total chloride
[nd, no data; nc, not computed]
Appendix B. Continued
Sampling interval Chlorine-36 to (inches below land surface) total-chloride ratio x 10
Top
110203040506060607080
11070
11020304040404050607090
11070
1444
12223622525252
Bottom Value2
10203040506070707080
110140140
cblank
1020304050505050607090
110140140
412121222365252737373
Area F01 Hole T021,1263,1033,6532,9231,8381,531
al,237al,286b l,262
723793690
b735
4.9
Area F02 Hole T034,3385,4474,4505,528
a2,283a2,226a2,407b2,305
1,602933788884889
b854
Area C02 Hole B 193,2885,503
d6,110b5,806
2,796787708
b748
a3,072al,644b2,358
Standard deviation '
491892242231649061
103nc374895nc3.6
16856122220115714774nc
22269384388nc
147396280
nc778131nc
30164nc
Sampling interval (inches below land surface)
top
7598
130180233291
cblank
21224487272 72 7296
120240420660120
bottom
Area C02 Hole98
130175233291365
Area C04122448729696 96 96
120180300480720 720
Chlorine-36 to total-chloride ratio x 10
value
B19-Continued3,5762,8443,1316,259
ndnd
0
Hole B 2011,5784,157
16,2008,560
a l,119al,180 d l,130 b l,143
968830914903858
b876
standard deviation '
216159223654
ndnd
7.1
402672
1,492479
5463 30 nc465244
15657 nc
1 To convert inches to meters, multiply by 0.0254. Laboratory determination performed under direction of
Dr. Pankaj Sharma at Nuclear Structure Research Laboratory, University of Rochester, Rochester, New York.
3 Standard deviation of laboratory determination.a Replicate extraction and analysis.b Average of replicates or of samples in indicated depth
intervals.c Blank sample prepared by dissolving Weeks Island halite in
deionized water that was used for processing soil samples, mixing, and extracting and purifying AgCl using same procedures used with soil samples.
d Analyses of duplicate sample performed at PRIME Lab, Purdue University.
Appendix 51
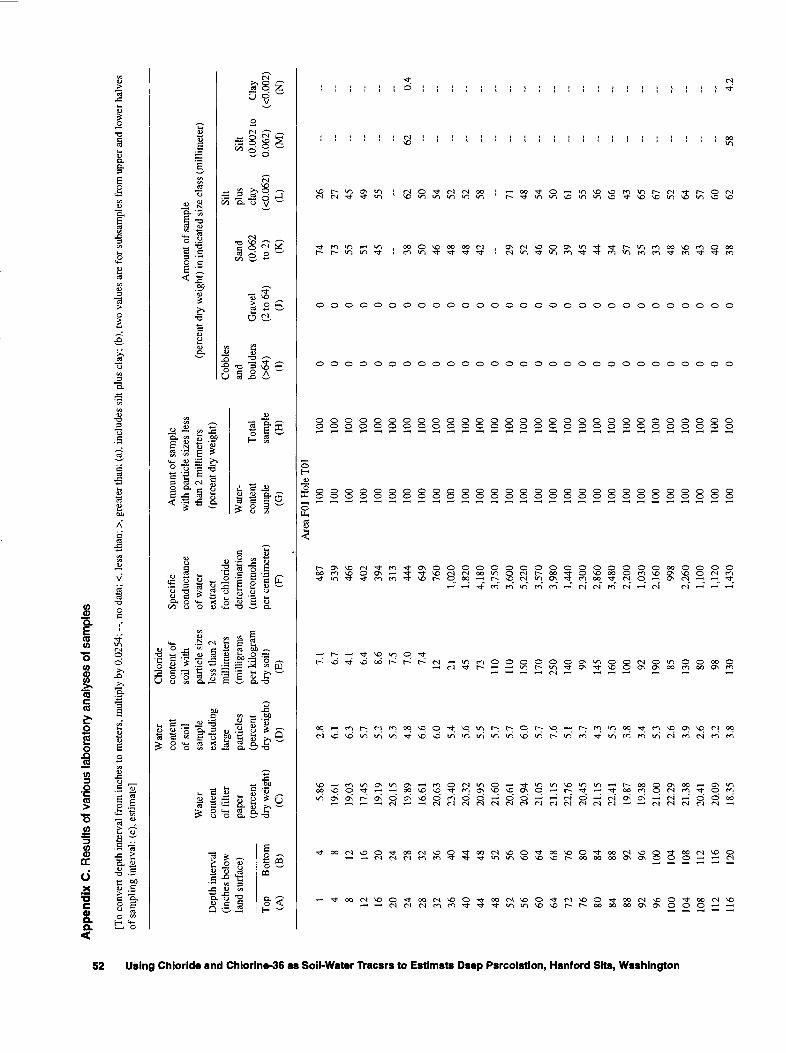
App
endi
x C
. R
esul
ts o
f var
ious
labo
rato
ry a
naly
ses
of s
ampl
es
[To
conv
ert
dept
h in
terv
al f
rom
inch
es to
met
ers,
mul
tiply
by
0.02
54; , n
o da
ta;
<, l
ess
than
; >,
gre
ater
than
; (a
), in
clud
es s
ilt p
lus
clay
; (b
), tw
o va
lues
are
for
sub
sam
ples
fro
m u
pper
and
low
er h
alve
s of
sam
plin
g in
terv
al;
(e),
estim
ate]
g Chloride
an 0. § §. 3 0> i ! o I S m ft 3 e o 0 ft S X M 1 a. (0 f 1 3" 5' 1
Dep
th in
terv
al(in
ches
bel
owla
nd s
urfa
ce)
Top
(A) 1 4 8 12 16 20 24 28 32 36 40 44 48 52 56 60 64 72 76 80 84 88 92 96 10
010
410
811
211
6
Bot
tom
(B) 4 8 12 16 20 24 28 32 36 40 44 48 52 56 60 64 68 76 80 84 88 92 96 100
104
108
112
116
120
Wat
er
cont
ent
of fi
lter
pape
r(p
erce
ntdr
y w
eigh
t)(C
) 5.86
19.6
119
.03
17.4
519
.19
20.1
519
.89
16.6
120
.63
23.4
020
.32
20.9
521
.60
20.6
120
.94
21.0
521
.15
22.7
620
.45
21.1
522
.41
19.8
719
.38
21.0
022
.29
21.3
820
.41
20.0
918
.35
Wat
er
cont
ent
of s
oil
sam
ple
excl
udin
gla
rge
part
icle
s(p
erce
ntdr
y w
eigh
t)(D
)
2.8
6.1
6.3
5.7
5.2
5.3
4.8
6.6
6.0
5.4
5.6
5.5
5.7
5.7
6.0
5.7
7.6
5.1
3.7
4.3
5.5
3.8
3.4
5.3
2.6
3.9
2.6
3.2
3.8
Chl
orid
e co
nten
t of
soil
with
pa
rtic
le s
izes
le
ss th
an 2
mill
imet
ers
(mill
igra
ms
per
kilo
gram
dry
soil)
(E) 7.
16.
74.
16.
48.
67.
57.
07.
412 21 45 73 110
110
150
170
250
140 99 145
160
100 92 190 85 130 80 98 130
Spec
ific
co
nduc
tanc
e of
wat
er
extr
act
for
chlo
ride
dete
rmin
atio
n(m
icro
moh
spe
r ce
ntim
eter
)(F
) 487
539
466
402
394
313
444
649
760
1,02
01,
820
4,18
03,
750
3,60
05,
220
3,57
03,
980
1,44
02,
300
2,86
03,
480
2,20
01,
030
2,16
099
82,
260
1,10
01,
120
1,43
0
Am
ount
of s
ampl
e w
ith p
artic
le s
izes
les
s th
an 2
mill
imet
ers
(per
cent
dry
wei
ght)
Wat
er-
cont
ent
sam
ple
(G)
Are
a F0
1 H
ole
T01
100
100
100
100
100
100
100
100
100
100
100
100
100
100
100
100
100
100
100
100
100
100
100
100
100
100
100
100
100
Tot
alsa
mpl
e(H
)
100
100
100
100
100
100
100
100
100
100
100
100
100
100
100
100
100
100
100
100
100
100
100
100
100
100
100
100
100
Am
ount
of s
ampl
e (p
erce
nt d
ry w
eigh
t) in
indi
cate
d si
ze c
lass
(m
illim
eter
)
Cob
bles
and
boul
ders
(>64
)(I
) 0 0 0 0 0 0 0 0 0 0 0 0 0 0 0 0 0 0 0 0 0 0 0 0 0 0 0 0 0
Gra
vel
(2 to
64)
(J) 0 0 0 0 0 0 0 0 0 0 0 0 0 0 0 0 0 0 0 0 0 0 0 0 0 0 0 0 0
Sand
(0.0
62to
2)
(K)
74 73 55 51 45 _ 38 50 46 48 48 42 - 29 52 46 50 39 45 44 34 57 35 33 48 36 43 40 38
Silt
plus
clay
(<0.
062)
(L) 26 27 45 49 55 .. 62 50 54 52 52 58 - 71 48 54 50 61 55 56 66 43 65 67 52 64 57 60 62
Silt
(0.0
02 to
C
lay
0.06
2)
(<0.
002)
(M)
(N)
_- - _ - 62
0.4
.. _ .. .. .. -- .. __ .. .. _ .. - -- - - .. 58
4.2
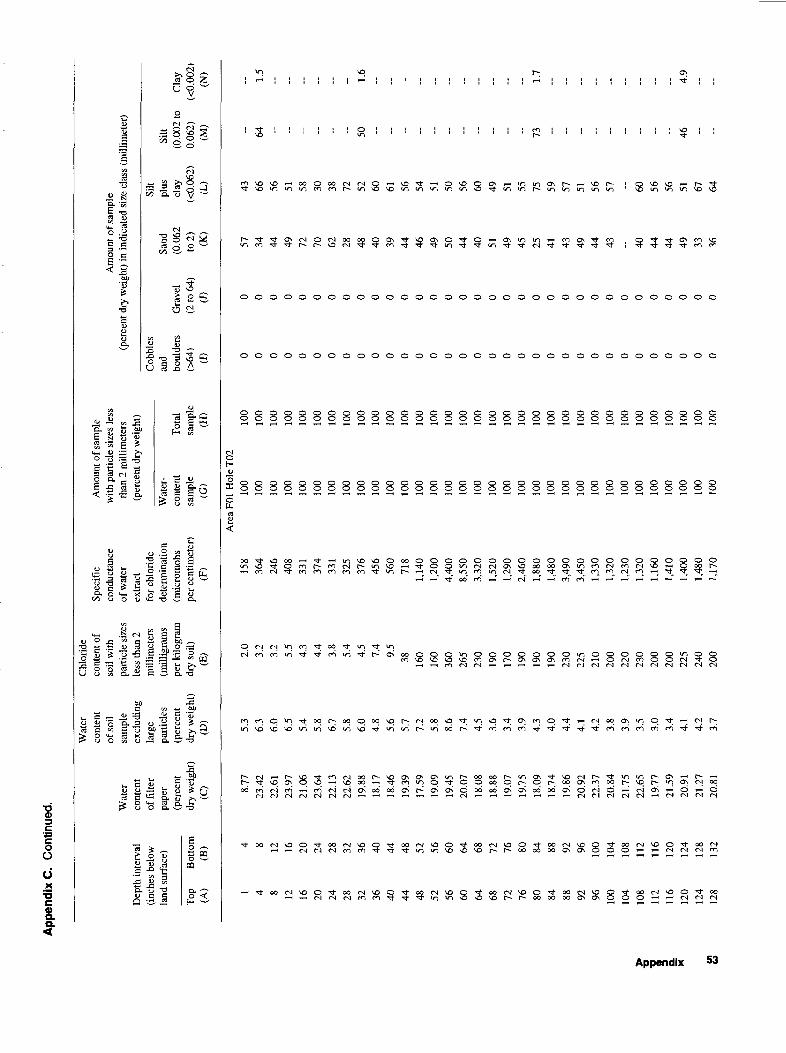
App
endi
x C
. C
ontin
ued.
8
Dep
th in
terv
al(i
nche
s be
low
land
sur
face
)
Top
(A) 1 4 8 12 16 20 24 28 32 36 40 44 48 52 56 60 64 68 72 76 80 84 88 92 96 100
104
108
112
116
120
124
128
Bot
tom
(B) 4 8 12 16 20 24 28 32 36 40 44 48 52 56 60 64 68 72 76 80 84 88 92 96 100
104
108
112
116
120
124
128
132
Wat
er
cont
ent
of fi
lter
pape
r(p
erce
ntdr
y w
eigh
t)(C
) 8.77
23.4
222
.61
23.9
721
.06
23.6
422
.13
22.6
219
.88
18.1
718
.46
19.3
917
.59
19.0
919
.45
20.0
718
.08
18.8
819
.07
19.7
518
.09
18.7
419
.86
20.9
222
.37
20.8
421
.75
22.6
519
.77
21.5
920
.91
21.2
720
.81
Wat
er
cont
ent
of so
il sa
mpl
e ex
clud
ing
larg
epa
rtic
les
(per
cent
dry
wei
ght)
(D)
5.3
6.3
6.0
6.5
5.4
5.8
6.7
5.8
6.0
4.8
5.6
5.7
7.2
5.8
8.6
7.4
4.5
3.6
3.4
3.9
4.3
4.0
4.4
4.1
4.2
3.8
3.9
3.5
3.0
3.4
4.1
4.2
3.7
Chl
orid
e co
nten
t of
soil
with
pa
rtic
le s
izes
le
ss th
an 2
mill
imet
ers
(mill
igra
ms
per k
ilogr
amdr
y so
il)(E
) 2.0
3.2
3.2
5.5
4.3
4.4
3.8
5.4
4.5
7.4
9.5
38 160
160
360
265
230
190
170
190
190
190
230
225
210
200
220
230
200
200
225
240
200
Spec
ific
cond
ucta
nce
of w
ater
ex
trac
tfo
r chl
orid
ede
term
inat
ion
(mic
rom
ohs
per
cent
imet
er)
(F) 15
836
424
640
833
137
433
132
537
645
656
071
81,
140
1,20
04,
400
8,55
03,
320
1,52
01,
290
2,46
01,
880
1,48
03,
490
3,45
01,
330
1,32
01,
230
1,32
01,
160
1,41
01,
400
1,48
01,
170
Am
ount
of s
ampl
e w
ith p
artic
le s
izes
less
th
an 2
mill
imet
ers
(per
cent
dry
wei
ght)
Wat
er-
cont
ent
sam
ple
(G)
Are
a F0
1 H
ole
T02
100
100
100
100
100
100
100
100
100
100
100
100
100
100
100
100
100
100
100
100
100
100
100
100
100
100
100
100
100
100
100
100
100
Tot
alsa
mpl
e(H
)
100
100
100
100
100
100
100
100
100
100
100
100
100
100
100
100
100
100
100
100
100
100
100
100
100
100
100
100
100
100
100
100
100
Am
ount
of s
ampl
e (p
erce
nt d
ry w
eigh
t) in
ind
icat
ed s
ize
clas
s (m
illim
eter
)
Cob
bles
and
boul
ders
064) (I) 0 0 0 0 0 0 0 0 0 0 0 0 0 0 0 0 0 0 0 0 0 0 0 0 0 0 0 0 0 0 0 0 0
Gra
vel
(2 to
64)
(J) 0 0 0 0 0 0 0 0 0 0 0 0 0 0 0 0 0 0 0 0 0 0 0 0 0 0 0 0 0 0 0 0 0
Sand
(0.0
62to
2)
(K)
57 34 44 49 72 70 62 28 48 40 39 44 46 49 50 44 40 51 49 45 25 41 43 49 44 43 - 40 44 44 49 33 36
Silt
plus
clay
(<0.
062)
(L) 43 66 56 51 58 30 38 72 52 60 61 56 54 51 50 56 60 49 51 55 75 59 57 51 56 57 - 60 56 56 51 67 64
Silt
(0.0
02 to
C
lay
0.06
2)
(<0.
002)
(M)
(N)
64
1.5
- - - ._ .. 50
1.6
- - - - - - - - .. 73
1.7
- .. - .. - - 46
4.9
..
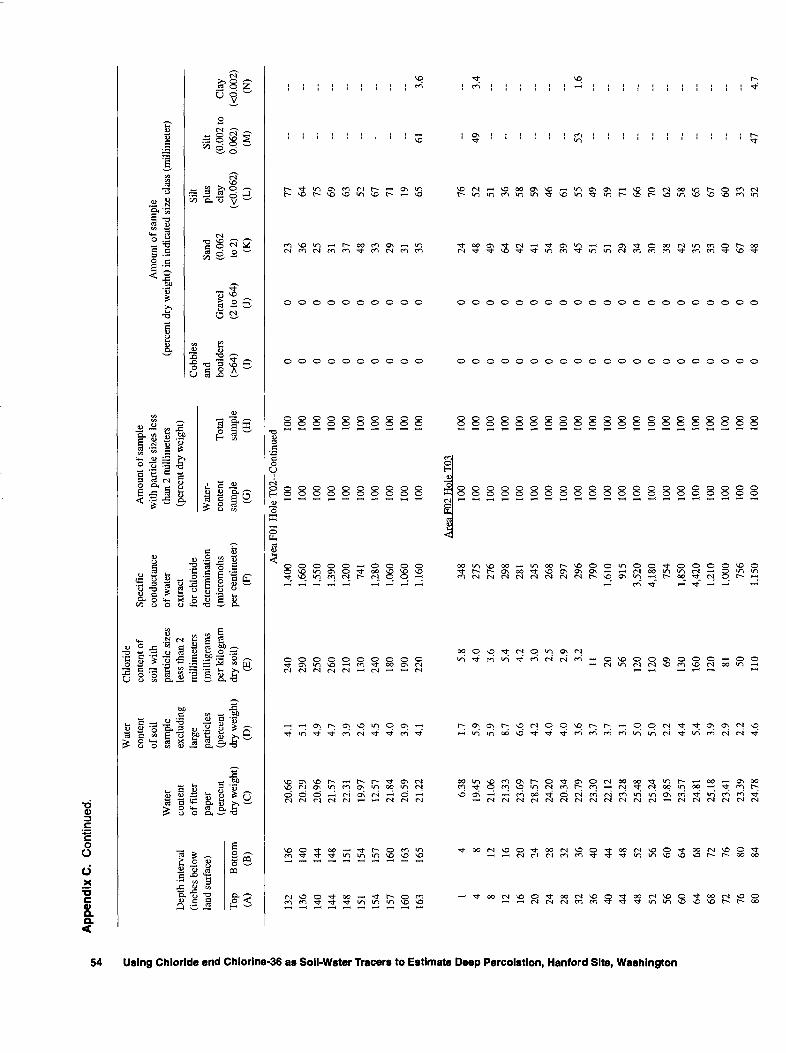
App
endi
x C
. C
ontin
ued.
3 <a o 6" OL (D (D § 1 o> S 8" i(D i1 o S 0 ff i
Dep
th in
terv
al(in
ches
bel
owla
nd s
urfa
ce)
Top
(A)
132
136
140
144
148
151
154
157
160
163
Bot
tom
(B)
136
140
144
148
151
154
157
160
163
165
Wat
er
cont
ent
of fi
lter
pape
r(p
erce
ntdr
y w
eigh
t)(C
)
20.6
620
.29
20.9
621
.57
22.3
119
.97
12.5
721
.84
20.5
921
.22
Wat
er
cont
ent
of so
il sa
mpl
e ex
clud
ing
larg
epa
rticl
es(p
erce
ntdr
y w
eigh
t)(D
)
4.1
5.1
4.9
4.7
3.9
2.6
4.5
4.0
3.9
4.1
Chl
orid
e co
nten
t of
soil
with
pa
rtic
le s
izes
le
ss th
an 2
mill
imet
ers
(mill
igra
ms
per k
ilogr
amdr
y so
il)(E
)
240
290
250
260
210
130
240
180
190
220
Spec
ific
cond
ucta
nce
of w
ater
ex
trac
tfo
r ch
lori
dede
term
inat
ion
(mic
rom
ohs
per
cent
imet
er)
(F)
Are
aFO
l1,
400
1,66
01,
550
1,39
01,
200
741
1,28
01,
060
1,06
01,
160
Am
ount
of s
ampl
e w
ith p
artic
le s
izes
les
s th
an 2
mill
imet
ers
(per
cent
dry
wei
ght)
Wat
er-
cont
ent
sam
ple
(G)
Tot
alsa
mpl
e(H
)
Am
ount
of s
ampl
e (p
erce
nt d
ry w
eigh
t) in
indi
cate
d si
ze c
lass
(m
illim
eter
)
Cob
bles
and
boul
ders
(>64
)(D
Gra
vel
(2 to
64)
(J)
Sand
(0.0
62to
2)
(K)
Silt
plus
clay
(<0.
062)
(D
Silt
(0.0
02 to
C
lay
0.06
2)
(<0.
002)
(M)
(N)
Hol
e T
02-C
ontin
ued
100
100
100
100
100
100
100
100
100
100
100
100
100
100
100
100
100
100
100
100
0 0 0 0 0 0 0 0 0 0
0 0 0 0 0 0 0 0 0 0
23 36 25 31 37 48 33 29 31 35
77 64 75 69 63 52 67 71 19 65
- -- - -- -- - - 61
3.6
S
Are
a F0
2 H
ole
T03
T3 S i s o 3 X 3 S. to S I 3 «s o 3
1 4 8 12 16 20 24 28 32 36 40 44 48 52 56 60 64 68 72 76 80
4 8 12 16 20 24 28 32 36 40 44 48 52 56 60 64 68 72 76 80 84
6.38
19.4
521
.06
21.3
323
.69
28.5
724
.20
20.3
422
.79
23.3
022
.12
23.2
825
.48
25.2
419
.85
23.5
724
.81
25.1
823
.41
23.3
924
.78
1.7
5.9
5.9
8.7
6.6
4.2
4.0
4.0
3.6
3.7
3.7
3.1
5.0
5.0
2.2
4.4
5.4
3.9
2.9
2.2
4.6
5.8
4.0
3.6
5.4
4.2
3.0
2.5
2.9
3.2
11 20 56 120
120 69 130
160
120 81 50 110
348
275
276
298
281
245
268
297
296
790
1,61
091
53,
520
4,18
075
41,
850
4,42
01,
210
1,00
075
61,
150
100
100
100
100
100
100
100
100
100
100
100
100
100
100
100
100
100
100
100
100
100
100
100
100
100
100
100
100
100
100
100
100
100
100
100
100
100
100
100
100
100
100
0 0 0 0 0 0 0 0 0 0 0 0 0 0 0 0 0 0 0 0 0
0 0 0 0 0 0 0 0 0 0 0 0 0 0 0 0 0 0 0 0 0
24 48 49 64 42 41 54 39 45 51 51 29 34 30 38 42 35 33 40 67 48
76 52 51 36 58 59 46 61 55 49 59 71 66 70 62 58 65 67 60 33 52
- 49
3.4
- - -- -- -- .. 53
1.6
-- _ - .. - .. - - 47
4.7
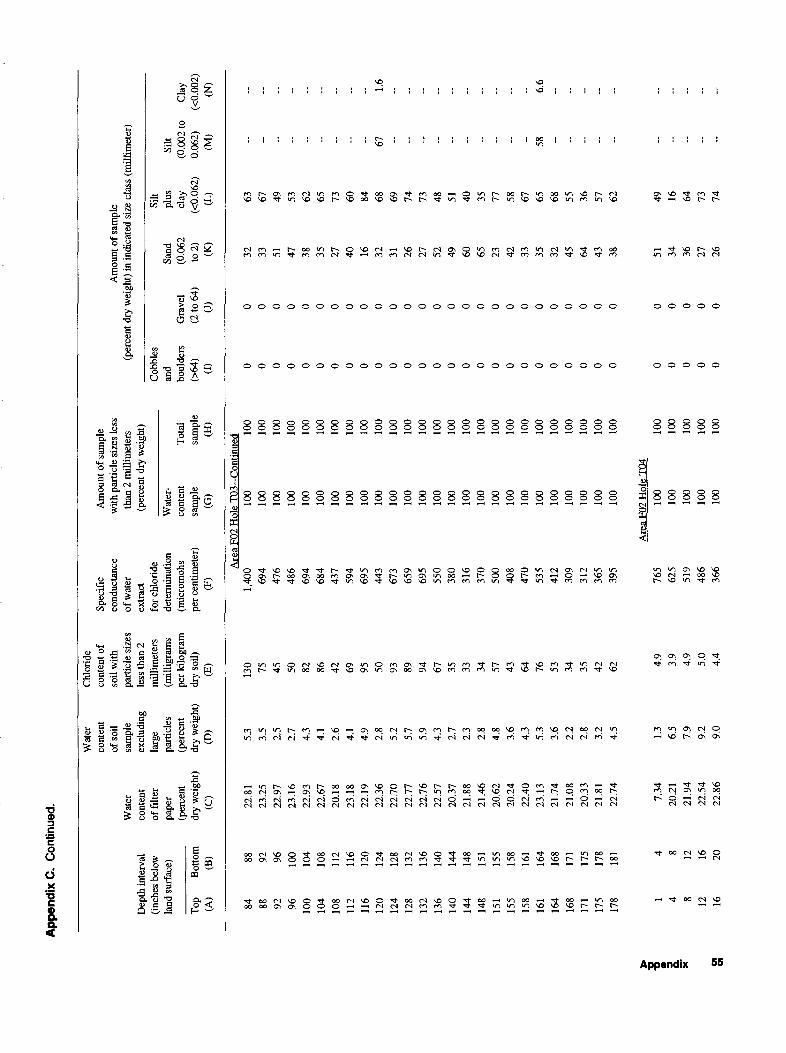
App
endi
x C
. C
ontin
ued.
Dep
th in
terv
al(in
ches
bel
owla
nd s
urfa
ce)
Top (A
)B
otto
m(B
)
Wat
er
cont
ent
of fi
lter
pape
r(p
erce
ntdr
y w
eigh
t)(C
)
Wat
er
cont
ent
of s
oil
sam
ple
excl
udin
gla
rge
parti
cles
(per
cent
dry
wei
ght)
(D)
Chl
orid
e co
nten
t of
soil
with
pa
rticl
e si
zes
less
than
2m
illim
eter
s(m
illig
ram
spe
r kilo
gram
dry
soil)
(E)
Spec
ific
cond
ucta
nce
of w
ater
ex
tract
for c
hlor
ide
dete
rmin
atio
n(m
icro
moh
spe
r cen
timet
er)
(F)
Am
ount
of s
ampl
e w
ith p
artic
le s
izes
less
th
an 2
mill
imet
ers
(per
cent
dry
wei
ght)
Wat
er-
cont
ent
sam
ple
(G)
Tota
lsa
mpl
e(H
)
Am
ount
of s
ampl
e (p
erce
nt d
ry w
eigh
t) in
indi
cate
d si
ze c
lass
(m
illim
eter
)
Cob
bles
and
boul
ders
(>64
)(I)
Gra
vel
(2 to
64)
(J)
Sand
(0.0
62to
2)
(K)
Silt
plus
Si
ltcl
ay
(0.0
02 to
C
lay
(<0.
062)
0.
062)
(L)
(M)
(<0.
002)
(N)
Are
a F0
2 H
ole
T03
-Con
tinu
ed
> D D 1 >f 8
84 88 92 96 100
104
108
112
116
120
124
128
132
136
140
144
148
151
155
158
161
164
168
171
175
178 1 4 8 12 16
88 92 96 100
104
108
112
116
120
124
128
132
136
140
144
148
151
155
158
161
164
168
171
175
178
181 4 8 12 16 20
22.8
123
.25
22.9
723
.16
22.9
322
.67
20.1
823
.18
22.1
922
.36
22.7
022
.77
22.7
622
.57
20.3
721
.88
21.4
620
.62
20.2
422
.40
23.1
321
.74
21.0
820
.33
21.8
122
.74
7.34
20.2
121
.94
22.5
422
.86
5.3
3.5
2.5
2.7
4.3
4.1
2.6
4.1
4.9
2.8
5.2
5.7
5.9
4.3
2.7
2.3
2.8
4.8
3.6
4.3
5.3
3.6
2.2
2.8
3.2
4.5
1.3
6.5
7.9
9.2
9.0
130 75 45 50 82 86 42 69 95 50 93 89 94 67 35 33 34 57 43 64 76 53 34 35 42 62 4.
93.
94.
95.
04.
4
1,40
069
447
648
669
468
443
759
469
544
367
365
969
555
038
031
637
050
040
847
053
541
230
931
236
539
5
765
625
519
486
366
100
100
100
100
100
100
100
100
100
100
100
100
100
100
100
100
100
100
100
100
100
100
100
100
100
100
Are
a F0
2 H
ole
T04
100
100
100
100
100
100
100
100
100
100
100
100
100
100
100
100
100
100
100
100
100
100
100
100
100
100
100
100
100
100
100
100
100
100
100
100
0 0 0 0 0 0 0 0 0 0 0 0 0 0 0 0 0 0 0 0 0 0 0 0 0 0 0 0 0 0 0
0 0 0 0 0 0 0 0 0 0 0 0 0 0 0 0 0 0 0 0 0 0 0 0 0 0 0 0 0 0 0
32 33 51 47 38 35 27 40 16 32 31 26 27 52 49 60 65 23 42 33 35 32 45 64 43 38 51 34 36 27 26
63 67 49 53 62 65 73 60 84 68
6769 74 73 48 51 40 35 77 58 67 65
58
68 55 36 57 62 49 16 64 73 74
- - - -- - - - - 1.6
- - - - -- -- -- -- - - 6.6
- -- - -- -- __ -- -- -- --
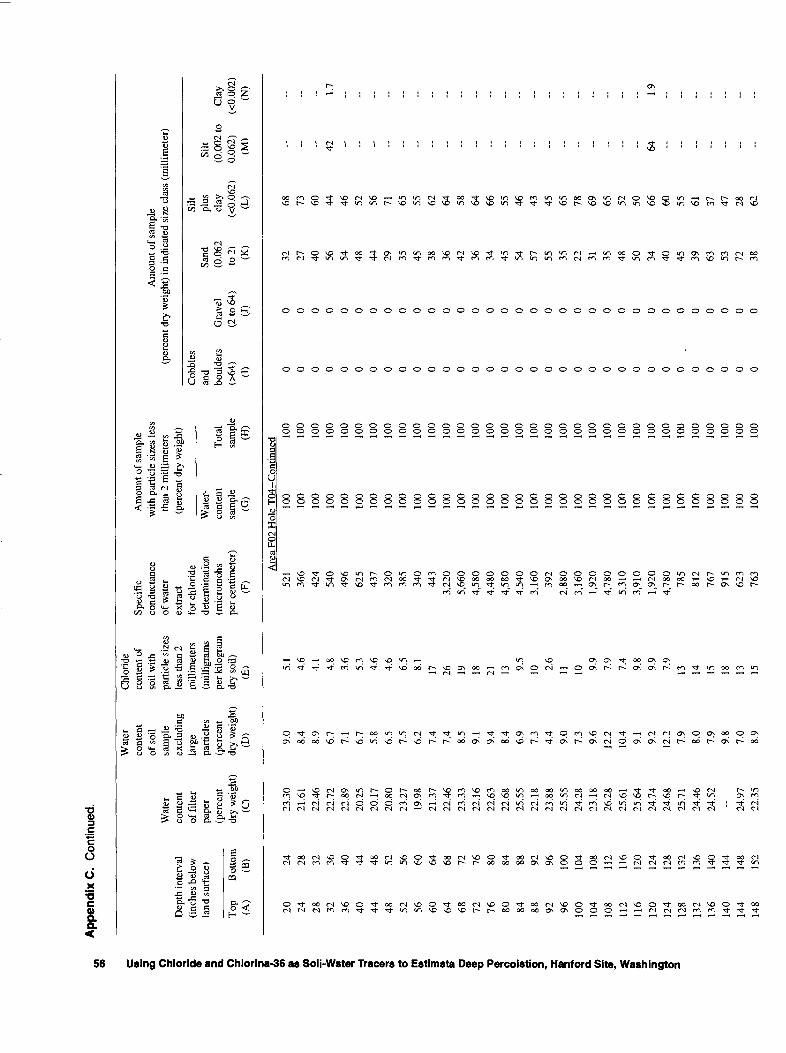
App
endi
x C
. C
ontin
ued.
Using Chlo 1(ft ID I o 5"
Dep
th in
terv
al(in
ches
bel
owla
nd s
urfa
ce)
Top (A
)B
otto
m(B
)
Wat
er
cont
ent
of fi
lter
pape
r(p
erce
ntdr
y w
eigh
t)(C
)
Wat
er
cont
ent
of s
oil
sam
ple
excl
udin
gla
rge
part
icle
s(p
erce
ntdr
y w
eigh
t)(D
)
Chl
orid
e co
nten
t of
soil
with
pa
rticl
e si
zes
less
than
2m
illim
eter
s(m
illig
ram
spe
r kilo
gram
dry
soil)
(E)
Spec
ific
co
nduc
tanc
e of
wat
er
extr
act
for c
hlor
ide
dete
rmin
atio
n(m
icro
moh
spe
r cen
timet
er)
(F)
Am
ount
of s
ampl
e w
ith p
artic
le s
izes
less
th
an 2
mill
imet
ers
(per
cent
dry
wei
ght)
Wat
er-
cont
ent
sam
ple
(G)
Tota
lsa
mpl
e(H
)
Am
ount
of s
ampl
e (p
erce
nt d
ry w
eigh
t) in
ind
icat
ed s
ize
clas
s (m
illim
eter
)
Cob
bles
and
boul
ders
064) (I)
Gra
vel
(2 to
64)
(J)
Sand
(0.0
62to
2)
(K)
Silt
plus
Si
ltcl
ay
(0.0
02 to
C
lay
(<0.
062)
0.
062)
(L)
(M)
(<0.
002)
(N)
£
Are
a F0
2 H
ole
T04
-Con
tinue
d
S W O f s1 o s S m I S o o 0 a si § z S o a (0 5 g 7 5' ta ? 3
20 24 28 32 36 40 44 48 52 56 60 64 68 72 76 80 84 88 92 96 100
104
108
112
116
120
124
128
132
136
140
144
148
24 28 32 36 40 44 48 52 56 60 64 68 72 76 80 84 88 92 96 100
104
108
112
116
120
124
128
132
136
140
144
148
152
23.3
021
.61
22.4
622
.72
22.8
920
.25
20.1
720
.80
23.2
719
.98
21.3
722
.46
23.3
322
.16
22.6
322
.68
25.5
522
.18
23.8
825
.55
24.2
823
.18
26.2
825
.61
25.6
424
.74
24.6
825
.71
24.4
624
.52
- 24.9
722
.35
9.0
8.4
8.9
6.7
7.1
6.7
5.8
6.5
7.5
6.2
7.4
7.4
8.5
9.1
9.4
8.4
6.9
7.3
4.4
9.0
7.3
9.6
12.2
10.4 9.1
9.2
12.2 7.9
8.0
7.9
9.8
7.0
8.9
5.1
4.6
4.1
4.8
3.6
5.3
4.6
4.6
6.5
8.1
17 26 19 18 21 13 9.5
10 2.6
11 10 9.9
7.9
7.4
9.8
9.9
7.9
13 14 15 18 13 15
521
366
424
540
496
625
437
320
385
340
443
3,22
05,
660
4,58
04,
480
4,58
04,
540
3,16
039
22,
880
3,16
01,
920
4,78
05,
310
3,91
01,
920
4,78
078
581
276
791
562
376
3
100
100
100
100
100
100
100
100
100
100
100
100
100
100
100
100
100
100
100
100
100
100
100
100
100
100
100
100
100
100
100
100
100
100
100
100
100
100
100
100
100
100
100
100
100
100
100
100
100
100
100
100
100
100
100
100
100
100
100
100
100
100
100
100
100
100
0 0 0 0 0 0 0 0 0 0 0 0 0 0 0 0 0 0 0 0 0 0 0 0 0 0 0 0 0 0 0 0 0
0 0 0 0 0 0 0 0 0 0 0 0 0 0 0 0 0 0 0 0 0 0 0 0 0 0 0 0 0 0 0 0 0
32 27 40 56 54 48 44 29 35 45 38 36 42 36 34 45 54 57 55 35 22 31 35 48 50 34 40 45 39 63 53 72 38
68 73 60 44
4246 52 56 71 65 55 62 64 58 64 66 55 46 43 45 65 78 69 65 52 50 66
64
60 55 61 37 47 28 62
__ - -- 1.7
- - -- - -- - - - - - - - - - - - -- - - - 1.9
- - - - - -
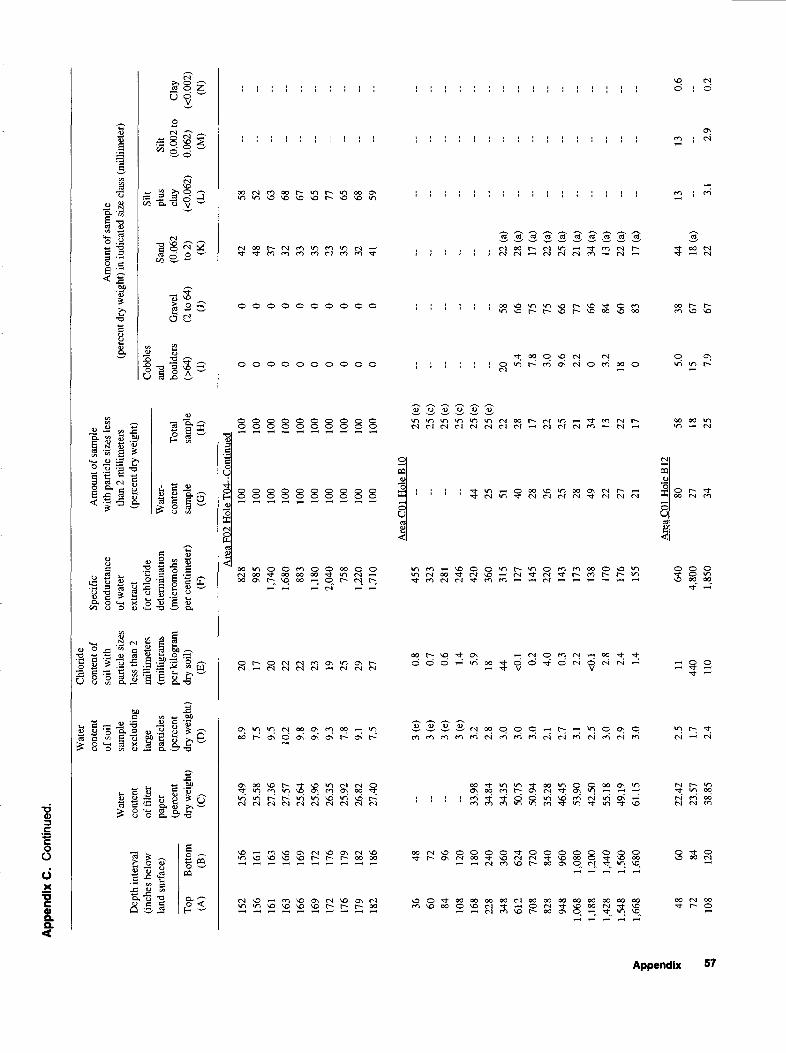
App
endi
x C
. C
ontin
ued.
Dep
th in
terv
al(i
nche
s be
low
land
sur
face
)
Top
(A)
Bot
tom
(B)
Wat
er
cont
ent
of fi
lter
pape
r(p
erce
ntdr
y w
eigh
t)(Q
Wat
er
cont
ent
of s
oil
sam
ple
excl
udin
gla
rge
part
icle
s(p
erce
ntdr
y w
eigh
t)(D
)
Chl
orid
e co
nten
t of
soil
with
pa
rtic
le s
izes
le
ss th
an 2
mill
imet
ers
(mill
igra
ms
per k
ilogr
amdr
y so
il)(E
)
Spec
ific
co
nduc
tanc
e of
wat
er
extr
act
for c
hlor
ide
dete
rmin
atio
n(m
icro
moh
spe
r cen
timet
er)
(F)
Am
ount
of s
ampl
e w
ith p
artic
le s
izes
less
th
an 2
mill
imet
ers
(per
cent
dry
wei
ght)
Wat
er-
cont
ent
sam
ple
(G)
Tota
lsa
mpl
e(H
)
Am
ount
of s
ampl
e (p
erce
nt d
ry w
eigh
t) in
indi
cate
d si
ze c
lass
(m
illim
eter
)
Cob
bles
and
boul
ders
(>64
)(I
)
Gra
vel
(2 to
64)
(J)
Sand
(0.0
62to
2)
(K)
Silt
plus
clay
(<0.
062)
(L)
Silt
(0.0
02 to
C
lay
0.06
2)
(<0.
002)
(M)
(N)
Are
aF02
Hol
e T
04-C
ontin
ued
152
156
161
163
166
169
172
176
179
182 36 60 84 108
168
228
348
612
708
828
948
1,06
81,
188
1,42
81,
548
1,66
8 48 72 108
156
161
163
166
169
172
176
179
182
186 48 72 96 120
180
240
360
624
720
840
960
1,08
01,
200
1,44
01,
560
1,68
0 60 84 120
25.4
925
.58
27.3
627
.57
25.6
425
.96
26.3
525
.92
26.8
227
.40
-- -- -- 33.9
834
.84
34.3
550
.75
50.9
435
.28
46.4
553
.90
42.5
055
.18
49.1
961
.15
22.4
223
.57
38.8
5
8.9
7.5
9.5
10.2 9.8
9.9
9.3
7.8
9.1
7.5
3(e)
3(e)
3(e)
3(e)
3.2
2.8
3.0
3.0
3.0
2.1
2.7
3.1
2.5
3.0
2.9
3.0
2.5 1.7
2.4
20 17 20 22 22 23 19 25 29 27 0.8
0.7
0.6
1.4
5.9
18 44 <0.1 0.2
4.0
0.3
2.2
<0.1 2.8
2.4
1.4
1144
011
0
828
985
1,74
01,
680
883
1,18
02,
040
758
1,22
01,
710
455
323
281
246
420
360
315
127
145
220
143
173
138
170
176
155
640
4,80
01,
850
100
100
100
100
100
100
100
100
100
100
Are
a C
01 H
ole
BIO
-- - -- -- 44 25 51 40 28 26 25 28 49 22 27 21
Are
a C0
1 H
ole
B 12
80 27 34
100
100
100
100
100
100
100
100
100
100 25 (e
)25
(e)
25 (
e)25
(e)
25 (e
)25
(e)
22 28 17 22 25 21 34 13 22 17 58 18 25
0 0 0 0 0 0 0 0 0 0 -- - -- -- -- -- 20 5.4
7.8
3.0
9.6
2.2
0 3.2
18 0 5.0
15 7.9
0 0 0 0 0 0 0 0 0 0 -- -- -- - -- -- 58 66 75 75 66 77 66 84 60 83 38 67 67
42 48 37 32 33 35 23 35 32 41 -- -- - - - - 22 (
a)28
(a)
17 (
a)22
(a)
25 (
a)21
(a)
34 (
a)13
(a)
22 (
a)17
(a)
44 18 (
a)22
58 52 63 68 67 65 77 65 68 59 -- -- -- -- -- -- -- -- -- -- -- -- -- -- -- - 13 -- 3.1
- - - .. - - __ - - -- _- - -- .. - .. .. .. .. - .. .. .. -- -- 13
0.6
.. 2.9
0.2
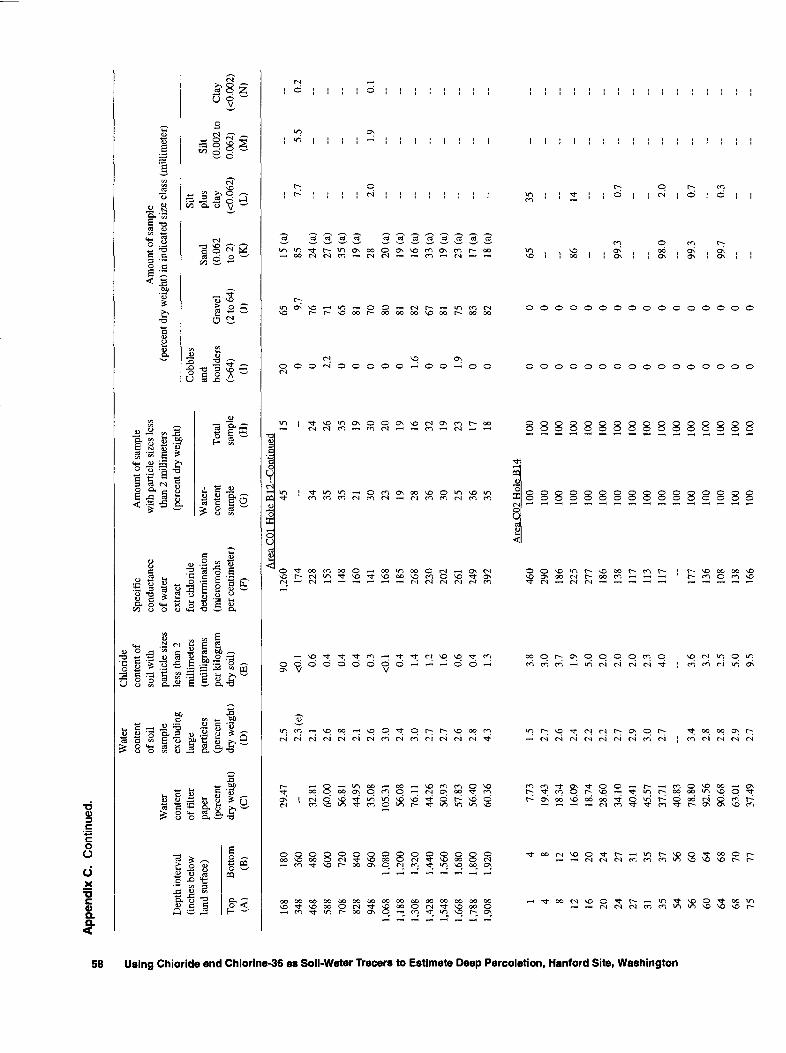
en
ooA
ppen
dix
C.
Con
tinue
d.
ID 3
(O O 1 (D 3
Q. O o 2. 1 01 s o1 1 I, 3 3 S m ID f 1 S 8 o J O s o 3 HI 1 Q. <a S 1 3" 5" f 3
Dep
th in
terv
al(in
ches
bel
owla
nd s
urfa
ce)
Top
(A)
168
348
468
588
708
828
948
1,06
81,
188
1,30
81,
428
1,54
81,
668
1,78
81,
908
Bot
tom
(B) 180
360
480
600
720
840
960
1,08
01,
200
1,32
01,
440
1,56
01,
680
1,80
01,
920
Wat
er
cont
ent
of fi
lter
pape
r(p
erce
ntdr
y w
eigh
t)(0 29
.47
32.8
160
.00
56.8
144
.95
35.0
810
5.31
56.0
876
.11
44.2
650
.93
57.8
356
.40
60.3
6
Wat
er
cont
ent
of so
il sa
mpl
e ex
clud
ing
larg
epa
rtic
les
(per
cent
dry
wei
ght)
(D)
2.5
2.3
(e)
2.1
2.6
2.8
2.1
2.6
3.0
2.4
3.0
2.7
2.7
2.6
2.8
4.3
Chl
orid
e co
nten
t of
soil
with
pa
rtic
le s
izes
le
ss th
an 2
mill
imet
ers
(mill
igra
ms
per k
ilogr
amdr
y so
il)(E
) 90 <0.1 0.6
0.4
0.4
0.4
0.3
<0.1 0.4
1.4
1.2
1.6
0.6
0.4
1.3
Spec
ific
cond
ucta
nce
of w
ater
ex
trac
tfo
r chl
orid
ede
term
inat
ion
(mic
rom
ohs
per
cent
imet
er)
(F)
Are
a C
011,
260
174
228
153
148
160
141
168
185
268
230
202
261
249
392
Am
ount
of s
ampl
e w
ith p
artic
le s
izes
less
th
an 2
mill
imet
ers
(per
cent
dry
wei
ght)
Wat
er-
cont
ent
sam
ple
(G)
Hol
e B
1245 34 35 35 21 30 23 19 28 36 30 25 36 35
Tota
lsa
mpl
e(H
)
-Con
tinue
d15 _. 24 26 35 19 30 20 19 16 32 19 23 17 18
Am
ount
of s
ampl
e (p
erce
nt d
ry w
eigh
t) in
indi
cate
d si
ze c
lass
(m
illim
eter
)
Cob
bles
and
boul
ders
(>64
)(D 20 0 0 2.
20 0 0 0 0 1.
60 0 1.
90 0
Gra
vel
(2 to
64)
(J)
65 9.7
76 71 65 81 70 80 81 82 67 81 75 83 82
Sand
(0.0
62to
2)
(K)
15 (
a)85 24
(a)
27 (
a)35
(a)
19 (
a)28 20
(a)
19 (
a)16
(a)
33 (
a)19
(a)
23 (
a)17
(a)
18 (
a)
Silt
plus
clay
(<0.
062)
(L) 7.
7 - - - 2.
0- - - - ~ - -
Silt
(0.0
02 to
C
lay
0.06
2)
(<0.
002)
(M)
(N)
5.5
0.2
.. - - .. 1.9
0.1
- .. .. - - - -
Are
a C
02 H
ole
B 14
1 4 8 12 16 20 24 27 31 35 54 56 60 64 68 75
4 8 12 16 20 24 27 31 35 37 56 60 64 68 70 77
7.73
19.4
318
.34
16.0
918
.74
28.6
034
.10
40.4
145
.57
37.7
140
.83
78.8
092
.56
90.6
863
.01
37.4
9
1.5
2.7
2.6
2.4
2.2
2.2
2.7
2.9
3.0
2.7
-- 3.4
2.8
2.8
2.9
2.7
3.8
3.0
3.7
1.9
5.0
2.0
2.0
2.0
2.3
4.0
- 3.6
3.2
2.5
5.0
9.5
460
290
186
225
277
186
138
117
113
117 -
177
136
108
138
166
100
100
100
100
100
100
100
100
100
100
100
100
100
100
100
100
100
100
100
100
100
100
100
100
100
100
100
100
100
100
100
100
0 0 0 0 0 0 0 0 0 0 0 0 0 0 0 0
0 0 0 0 0 0 0 0 0 0 0 0 0 0 0 0
65 - _ 86 - - 99.3
- - 98.0
- 99.3
- 99.7
-
35 - _ 14 - - 0.7
- - 2.0
- 0.7
- 0.3
-
.. .. _ .. - - - - .. - - .. .. .. ..
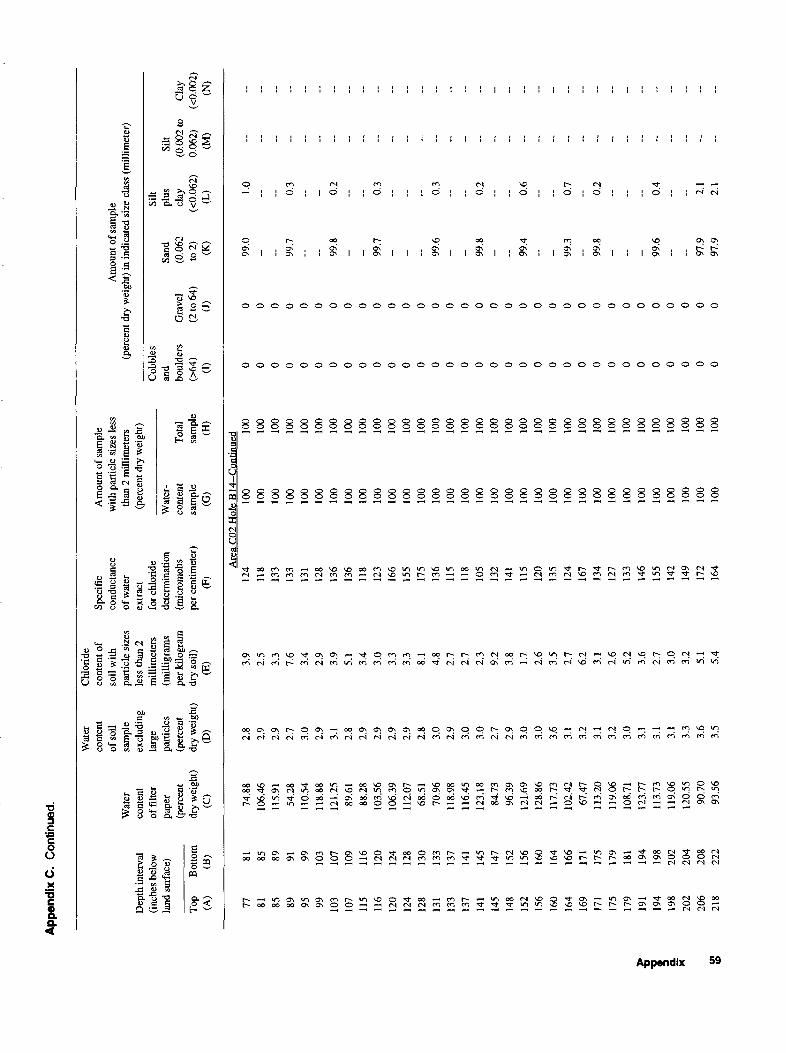
App
endi
x C
. C
ontin
ued.
3
Q. S
Dep
th in
terv
al(in
ches
bel
owla
nd s
urfa
ce)
Top
(A)
Bot
tom
(B)
Wat
er
cont
ent
of fi
lter
pape
r(p
erce
ntdr
y w
eigh
t)(C
)
Wat
er
cont
ent
of so
il sa
mpl
e ex
clud
ing
larg
epa
rtic
les
(per
cent
dry
wei
ght)
(D)
Chl
orid
e co
nten
t of
soil
with
pa
rtic
le s
izes
le
ss t
han
2m
illim
eter
s(m
illig
ram
spe
r kilo
gram
dry
soil)
(E)
Spec
ific
cond
ucta
nce
of w
ater
ex
trac
tfo
r chl
orid
ede
term
inat
ion
(mic
rom
ohs
per
cent
imet
er)
(F)
Am
ount
of s
ampl
e w
ith p
artic
le s
izes
less
th
an 2
mill
imet
ers
(per
cent
dry
wei
ght)
Wat
er-
cont
ent
sam
ple
(G)
Tot
alsa
mpl
e(H
)
Am
ount
of s
ampl
e (p
erce
nt d
ry w
eigh
t) in
indi
cate
d si
ze c
lass
(m
illim
eter
)
Cob
bles
and
boul
ders
(>64
)(I
)
Gra
vel
(2 to
64)
(J)
Sand
(0.0
62to
2)
(K)
Silt
plus
clay
(<0.
062)
(L)
Silt
(0.0
02 to
C
lay
0.06
2)
(<0.
002)
(M)
(N)
Are
a C
02 H
ole
B14
-Con
tinue
d77 81 85 89 95 99 10
310
711
511
612
012
412
813
113
313
714
114
514
815
215
616
016
416
917
117
517
919
119
419
820
220
621
8
81 85 89 91 99 103
107
109
116
120
124
128
130
133
137
141
145
147
152
156
160
164
166
171
175
179
181
194
198
202
204
208
222
74.8
810
6.46
115.
9154
.28
110.
5411
8.88
121.
2589
.61
88.2
810
3.56
106.
3911
2.07
68.5
170
.96
118.
9811
6.45
123.
1884
.73
96.3
912
1.69
128.
8611
7.73
102.
4267
.47
113.
2011
9.06
108.
7112
3.77
113.
7311
9.06
120.
5590
.70
93.5
6
2.8
2.9
2.9
2.7
3.0
2.9
3.1
2.8
2.9
2.9
2.9
2.9
2.8
3.0
2.9
3.0
3.0
2.7
2.9
3.0
3.0
3.6
3.1
3.2
3.1
3.2
3.0
3.1
3.1
3.1
3.3
3.6
3.5
3.9
2.5
3.3
7.6
3.4
2.9
3.9
5.1
3.4
3.0
3.3
3.3
8.1
4.8
2.7
2.7
2.3
9.2
3.8
1.7
2.6
3.5
2.7
6.2
3.1
2.6
5.2
3.6
2.7
3.0
3.2
5.1
5.4
124
118
133
133
131
128
136
136
118
123
166
155
175
136
115
118
105
132
141
115
120
135
124
167
134
127
133
146
155
142
149
172
164
100
100
100
100
100
100
100
100
100
100
100
100
100
100
100
100
100
100
100
100
100
100
100
100
100
100
100
100
100
100
100
100
100
100
100
100
100
100
100
100
100
100
100
100
100
100
100
100
100
100
100
100
100
100
100
100
100
100
100
100
100
100
100
100
100
100
0 0 0 0 0 0 0 0 0 0 0 0 0 0 0 0 0 0 0 0 0 0 0 0 0 0 0 0 0 0 0 0 0
0 0 0 0 0 0 0 0 0 0 0 0 0 0 0 0 0 0 0 0 0 0 0 0 0 0 0 0 0 0 0 0 0
99.0
- - 99.7
- - 99.8
- -- 99.7
- - - 99.6
- - 99.8
- - 99.4
- - 99.3
- 99.8
- - - 99.6
- - 97.9
97.9
1.0
- 0.3
- - 0.2
- - 0.3
- - -- 0.3
- - 0.2
- - 0.6
- - 0.7
- 0.2
- - - 0.4
- - 2.1
2.1
.. .. .. - - .. - .. - _ .. .. .. .. .. _ - .. - .. .. .. .. .. - - .. ..
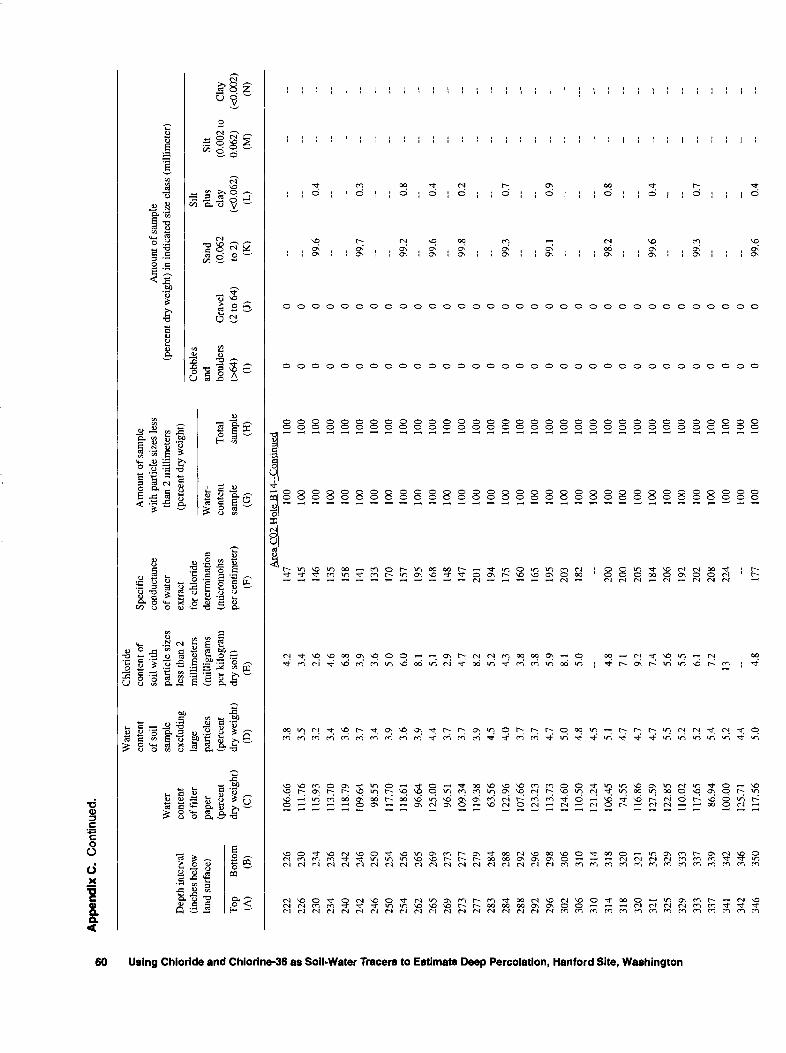
§A
ppen
dix
C. C
ontin
ued.
s. (Q S § D
epth
inte
rval
(inc
hes
belo
wa
land
sur
face
)a 0
Top
o (A
)3.
Bot
tom
(B)
Wat
er
cont
ent
of fi
lter
pape
r(p
erce
ntdr
y w
eigh
t)(C
)
Wat
er
cont
ent
of so
il sa
mpl
e ex
clud
ing
larg
epa
rtic
les
(per
cent
dry
wei
ght)
(D)
Chl
orid
e co
nten
t of
soil
with
pa
rtic
le s
izes
le
ss t
han
2m
illim
eter
s(m
illig
ram
spe
r ki
logr
amdr
y so
il)(E
)
Spec
ific
cond
ucta
nce
of w
ater
ex
trac
tfo
r ch
lorid
ede
term
inat
ion
(mic
rom
ohs
per
cent
imet
er)
(F)
Am
ount
of s
ampl
e w
ith p
artic
le s
izes
less
th
an 2
mill
imet
ers
(per
cent
dry
wei
ght)
Wat
er-
cont
ent
sam
ple
(G)
Tot
alsa
mpl
e(H
)
Am
ount
of s
ampl
e (p
erce
nt d
ry w
eigh
t) in
ind
icat
ed s
ize
clas
s (m
illim
eter
)
Cob
bles
and
boul
ders
064) (I)
Gra
vel
(2 to
64)
(J)
Silt
Sand
pl
us(0
.062
cl
ayto
2)
(<0.
062)
(K)
(L)
Silt
(0.0
02 to
C
lay
0.06
2)
(<0.
002)
(M)
(N)
£
Are
a C
02 H
ole
B 1
4-C
ontin
ued
0)
222
J
226
S.
230
§
234
S
240
H
242
§
246
5 25
°S
25
4gl
26
2|-
26
5S
269
f27
327
7 0
28
33
284
§
288
o 29
2-3
29
6»
302
3"
306
W
310
S 31
4g
31
8S
32
01
32
1
?32
532
933
333
734
134
234
6
226
230
234
236
242
246
250
254
256
265
269
273
277
279
284
288
292
296
298
306
310
314
318
320
321
325
329
333
337
339
342
346
350
106.
6611
1.76
115.
9311
3.70
118.
7910
9.64
98.5
511
7.70
118.
6196
.64
125.
0096
.51
109.
3411
9.38
63.5
612
2.96
107.
6612
3.23
113.
7312
4.60
110.
5012
1.24
106.
4574
.55
116.
8612
7.59
122.
8511
0.02
117.
6586
.94
100.
0012
5.71
117.
56
3.8
3.5
3.2
3.4
3.6
3.7
3.4
3.9
3.6
3.9
4.4
3.7
3.7
3.9
4.5
4.0
3.7
3.7
4.7
5.0
4.8
4.5
5.1
4.7
4.7
4.7
5.5
5.2
5.2
5.4
5.2
4.4
5.0
4.2
3.4
2.6
4.6
6.8
3.9
3.6
5.0
6.0
8.1 5.1 2.9
4.7
8.2
5.2
4.3
3.8
3.8
5.9
8.1
5.0
- 4.8
7.1
9.2
7.4
5.6
5.5
6.1 7.2
13 4.8
147
145
146
135
158
141
133
170
157
195
168
148
147
201
194
175
160
165
195
203
182 -
200
200
205
184
206
192
202
208
224 -
177
100
100
100
100
100
100
100
100
100
100
100
100
100
100
100
100
100
100
100
100
100
100
100
100
100
100
100
100
100
100
100
100
100
100
100
100
100
100
100
100
100
100
100
100
100
100
100
100
100
100
100
100
100
100
100
100
100
100
100
100
100
100
100
100
100
100
0 0 0 0 0 0 0 0 0 0 0 0 0 0 0 0 0 0 0 0 0 0 0 0 0 0 0 0 0 0 0 0 0
0 0 0 0 0 0 0 0 0 0 0 0 0 0 0 0 0 0 0 0 0 0 0 0 0 0 0 0 0 0 0 0 0
__ _ 99.6
0.
4 _. 99
.7
0.3
-. - 99.2
0.
8- 99
.6
0.4
- 99.8
0.
2- - 99
.3
0.7
- 99.1
0.
9 - 98
.2
0.8
- - 99.6
0.
4- 99
.3
0.7
- 99.6
0.
4
_ _ _ - - _ -. - - - - - - -- - - - - _ .. _. - -- - - - - _. _. -
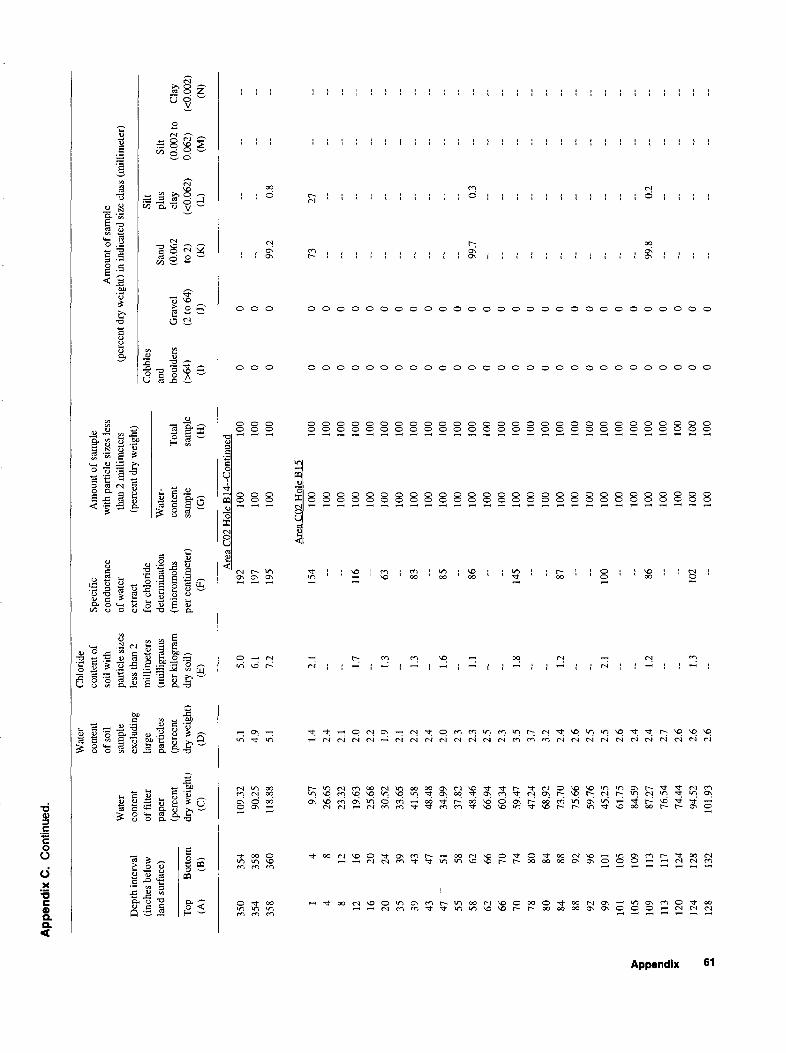
App
endi
x C
. C
ontin
ued.
Dep
th in
terv
al(i
nche
s be
low
land
sur
face
)
Top (A
)B
otto
m(B
)
Wat
er
cont
ent
of f
ilter
pape
r(p
erce
ntdr
y w
eigh
t)(C
)
Wat
er
cont
ent
of s
oil
sam
ple
excl
udin
gla
rge
part
icle
s(p
erce
ntdr
y w
eigh
t)(D
)
Chl
orid
e co
nten
t of
so
il w
ith
part
icle
siz
es
less
tha
n 2
mill
imet
ers
(mill
igra
ms
per
kilo
gram
dry
soil)
(E)
Spec
ific
co
nduc
tanc
e of
wat
er
extr
act
for
chlo
ride
dete
rmin
atio
n(m
icro
moh
spe
r ce
ntim
eter
)(F
)
Am
ount
of
sam
ple
with
par
ticle
siz
es l
ess
than
2 m
illim
eter
s (p
erce
nt d
ry w
eigh
t)
Wat
er-
cont
ent
sam
ple
(G)
Tot
alsa
mpl
e(H
)
Am
ount
of
sam
ple
(per
cent
dry
wei
ght)
in
indi
cate
d si
ze c
lass
(m
illim
eter
)
Cob
bles
and
boul
ders
(>64
)(I
)
Gra
vel
(2 t
o 64
)(J
)
Silt
Sand
pl
us
Silt
(0.0
62
clay
(0
.002
to
Cla
yto
2)
(<0.
062)
0.
062)
(<
0.00
2)(K
) (L
) (M
) (N
)
Are
a C
02 H
ole
B 1
4-C
onti
nued
350
354
358 1 4 8 12 16 20 35 39 43 47
"
55 58 62 66 70 78 80 84 88 92 99 101
>
105
1
109
[L
113
x
120
124
2
128
354
358
360 4 8 12 16 20 24 39 43 47 51 58 62 66 70 74 80 84 88 92 96 101
105
109
113
117
124
128
132
109.
3290
.25
118.
88
9.57
26.6
523
.32
19.6
325
.68
30.5
233
.65
41.5
848
.48
34.9
937
.82
48.4
6
66.9
460
.34
59.4
747
.24
68.9
273
.70
75.6
659
.76
45.2
561
.75
84.5
987
.27
76.5
474
.44
94.5
210
1.93
5.1
4.9
5.1
1.4
2.4
2.1
2.0
2.2
1.9
2.1
2.2
2.4
2.0
2.3
2.3
2.5
2.3
3.5
3.7
3.2
2.4
2.6
2.5
2.5
2.6
2.4
2.4
2.7
2.6
2.6
2.6
5.0
6.1
7.2
2.1
- - 1.7
- 1.3
- 1.3
- 1.6
- 1.1 - - 1.8
- 1.2
- - 2.1
- - 1.2
- - 1.3
-
192
197
195
154 -- --
116 63 -- 83 -- 85 -- 86 -- --
145 -- -- 87 - -
100 - -- 86 -- -
102 --
100
100
100
Are
a C
Q2
Hol
e B
15
100
100
100
100
100
100
100
100
100
100
100
100
100
100
100
100
100
100
100
100
100
100
100
100
100
100
100
100
100
100
100
100
100
100
100
100
100
100
100
100
100
100
100
100
100
100
100
100
100
100
100
100
100
100
100
100
100
100
100
0 0 0 0 0 0 0 0 0 0 0 0 0 0 0 0 0 0 0 0 0 0 0 0 0 0 0 0 0 0 0
0 0 0 0 0 0 0 0 0 0 0 0 0 0 0 0 0 0 0 0 0 0 0 0 0 0 0 0 0 0 0
.. .. 99.2
0.
8
73
27.. - - - .. .. .. - .. - 99
.7
0.3
- _. .. .. .. .. - -. - - - 99.8
0.
2- - - ..
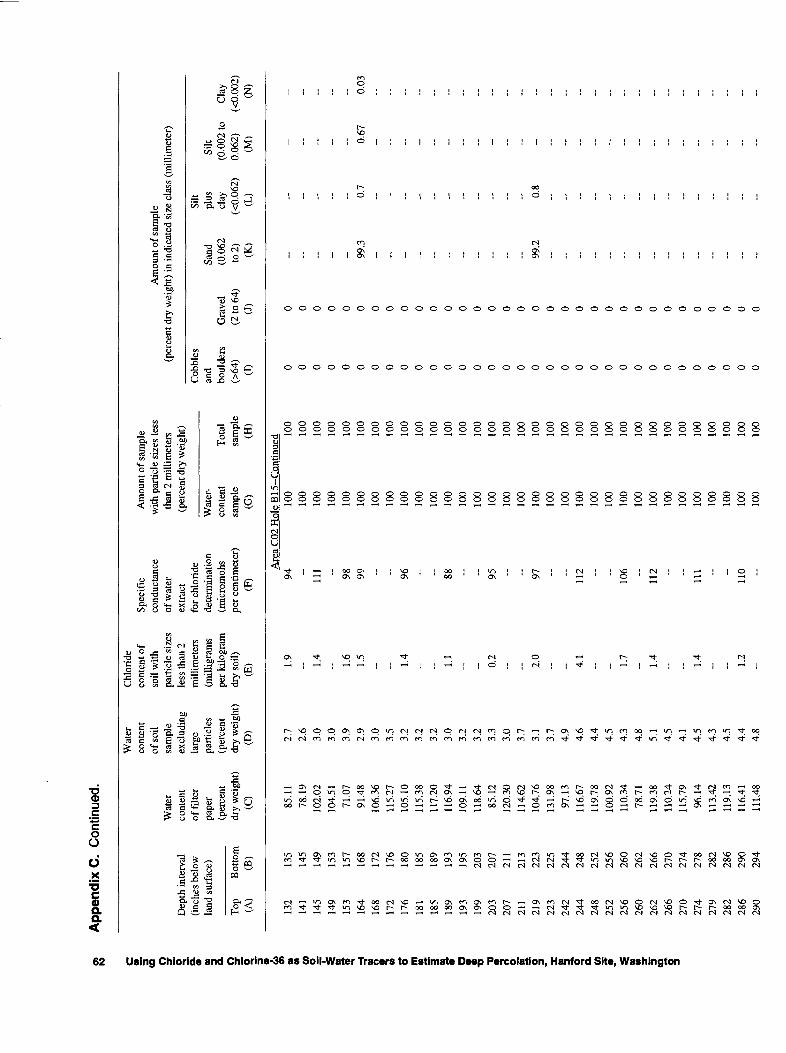
o> A
ppen
dix
C.
Con
tinue
d.
to 3 o I a!D
epth
inte
rval
(inch
es b
elow
»
land
sur
face
)Q
. § 1To
p(A
)B
otto
m(B
)
Wat
er
cont
ent
of fi
lter
pape
r(p
erce
ntdr
y w
eigh
t)(C
)
Wat
er
cont
ent
of so
il sa
mpl
e ex
clud
ing
larg
epa
rticl
es(p
erce
ntdr
y w
eigh
t)(D
)
Chl
orid
e co
nten
t of
soil
with
pa
rtic
le s
izes
le
ss t
han
2m
illim
eter
s(m
illig
ram
spe
r kilo
gram
dry
soil)
(E)
Spec
ific
co
nduc
tanc
e of
wat
er
extr
act
for
chlo
ride
dete
rmin
atio
n(m
icro
moh
spe
r ce
ntim
eter
)(F
)
Am
ount
of s
ampl
e w
ith p
artic
le s
izes
les
s th
an 2
mill
imet
ers
(per
cent
dry
wei
ght)
Wat
er-
cont
ent
sam
ple
(G)
Tota
lsa
mpl
e(H
)
Am
ount
of s
ampl
e (p
erce
nt d
ry w
eigh
t) in
indi
cate
d si
ze c
lass
(m
illim
eter
)
Cob
bles
and
boul
ders
(>64
)(I
)
Gra
vel
(2 to
64)
(J)
Silt
Sand
pl
us
Silt
(0.0
62
clay
(0
.002
to
Cla
yto
2)
(O.0
62)
0.06
2)
(<0.
002)
(K)
(L)
(M)
(N)
&
Are
a C
02 H
ole
B15
-Con
tinue
do> to w O i i i 0 m i 0> s 1o 1 ~x 1 a j? ^ 3
1 5' a I
132
141
145
149
153
164
168
172
176
181
185
189
193
199
203
207
211
219
223
242
244
248
252
256
260
262
266
270
274
279
282
286
290
135
145
149
153
157
168
172
176
180
185
189
193
195
203
207
211
213
223
225
244
248
252
256
260
262
266
270
274
278
282
286
290
294
85.1
178
.19
102.
0210
4.51
71.0
791
.48
106.
3611
5.27
105.
1011
5.38
117.
2011
6.94
109.1
111
8.64
85.1
212
0.30
114.
6210
4.76
131.
9897
.13
116.
6711
9.78
100.
9211
0.34
78.7
111
9.38
110.
2411
5.79
96.1
411
3.42
119.
1311
6.41
111.
48
2.7
2.6
3.0
3.0
3.9
2.9
3.0
3.5
3.2
3.2
3.2
3.0
3.2
3.2
3.3
3.0
3.7
3.1
3.7
4.9
4.6
4.4
4.5
4.3
4.8
5.1
4.5
4.1
4.5
4.3
4.5
4.4
4.8
1.9
- 1.4
_ 1.6 1.5 - - 1.4
__ - 1.1
- 0.2
__ - 2.0
- - 4.1
- 1.7
- 1.4
- -- 1.4
- - 1.2
-
94 -
Ill __ 98 99 - - 96 ._ - 88 - 95 __ - 97 - -
112 -- -
106 -
112 -- -
Ill - -
110 --
100
100
100
100
100
100
100
100
100
100
100
100
100
100
100
100
100
100
100
100
100
100
100
100
100
100
100
100
100
100
100
100
100
100
100
100
100
100
100
100
100
100
100
100
100
100
100
100
100
100
100
100
100
100
100
100
100
100
100
100
100
100
100
100
100
100
0 0 0 0 0 0 0 0 0 0 0 0 0 0 0 0 0 0 0 0 0 0 0 0 0 0 0 0 0 0 0 0 0
0 0 0 0 0 0 0 0 0 0 0 0 0 0 0 0 0 0 0 0 0 0 0 0 0 0 0 0 0 0 0 0 0
_ - _ .. 99.3
0.
7 0.
67
0.03
.. _. .. -- -. .. - __ - 99.2
0.
8.. - ~ .. .. .. _ - -- .. .. ..
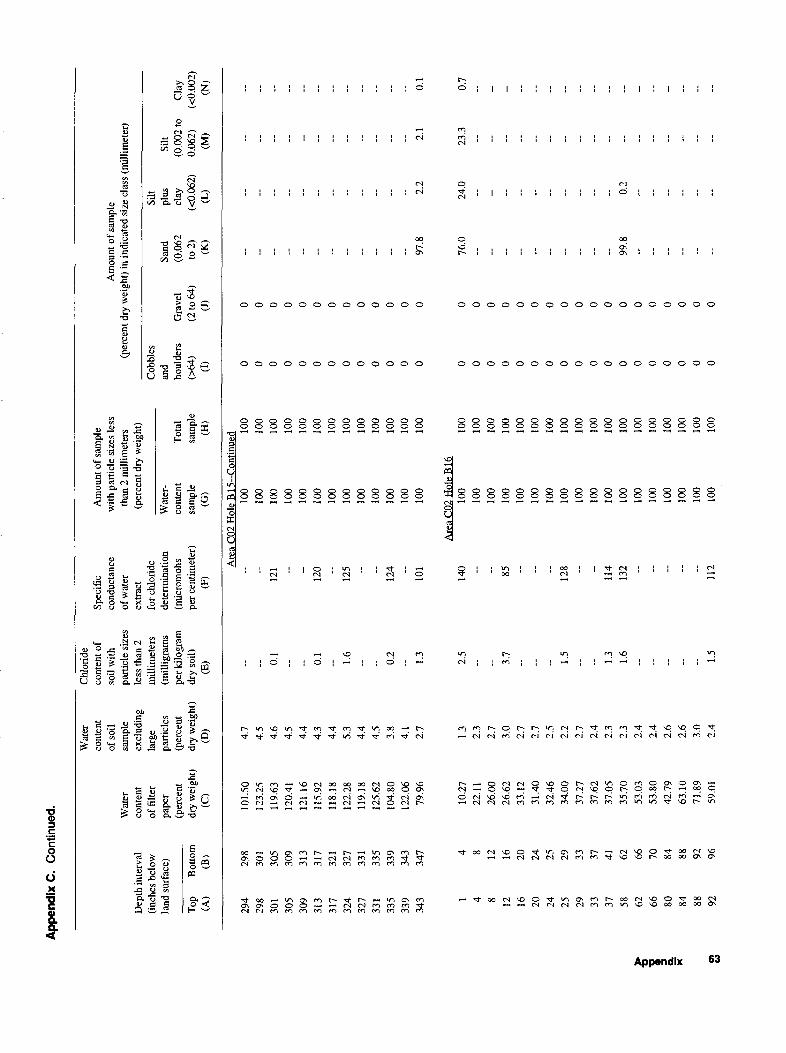
App
endi
x C
. C
ontin
ued.
1 O.
X 8
Dep
th in
terv
al(in
ches
bel
owla
nd s
urfa
ce)
Top
(A)
Bot
tom
(B)
Wat
er
cont
ent
of fi
lter
pape
r(p
erce
ntdr
y w
eigh
t)(C
)
Wat
er
cont
ent
of so
il sa
mpl
e ex
clud
ing
larg
epa
rtic
les
(per
cent
dry
wei
ght)
(D)
Chl
orid
e co
nten
t of
soil
with
pa
rtic
le s
izes
le
ss th
an 2
mill
imet
ers
(mill
igra
ms
per k
ilogr
amdr
y so
il)(E
)
Spec
ific
cond
ucta
nce
of w
ater
ex
tract
for
chlo
ride
dete
rmin
atio
n(m
icro
moh
spe
r ce
ntim
eter
)(F
)
Am
ount
of s
ampl
e w
ith p
artic
le s
izes
less
th
an 2
mill
imet
ers
(per
cent
dry
wei
ght)
Wat
er-
cont
ent
sam
ple
(G)
Tot
alsa
mpl
e(H
)
Am
ount
of s
ampl
e (p
erce
nt d
ry w
eigh
t) in
indi
cate
d si
ze c
lass
(m
illim
eter
)
Cob
bles
and
boul
ders
(>64
)(D
Sand
Gra
vel
(0.0
62(2
to 6
4)
to 2
)(J
) (K
)
Silt
plus
Si
ltcl
ay
(0.0
02 to
C
lay
(<0.
062)
0.
062)
(<
0.00
2)(L
) (M
) (N
)
Are
a C
02 H
ole
B 15
--C
ontin
ued
294
298
301
305
309
313
317
324
327
331
335
339
343 1 4 8 12 16 20 24 25 29 33 37 58 62 66 80 84 88 92
298
301
305
309
313
317
321
327
331
335
339
343
347 4 8 12 16 20 24 25 29 33 37 41 62 66 70 84 88 92 96
101.
5012
3.25
119.
6312
0.41
121.
1611
5.92
118.
1812
2.28
119.
1812
5.62
104.
8012
2.06
79.9
6
10.2
722
.11
26.0
026
.62
33.1
231
.40
32.4
634
.00
37.2
737
.62
37.0
535
.70
53.0
353
.80
42.7
963
.10
71.8
959
.01
4.7
4.5
4.6
4.5
4.4
4.3
4.4
5.3
4.4
4.5
3.8
4.1
2.7
1.3
2.3
2.7
3.0
2.7
2.7
2.5
2.2
2.7
2.4
2.3
2.3
2.4
2.4
2.6
2.6
3.0
2.4
-- - 0.1
- - 0.1
- 1.6
- - 0.2
- 1.3
2.5
-- - 3.7
-- -- - 1.5
- - 1.3
1.6
- - - - -- 1.5
-- -
121 -- --
120 --
125 - -
124 -
101
140 - -- 85 -- -- --
128 - -
114
132 -- -- - - --
112
100
100
100
100
100
100
100
100
100
100
100
100
100
Are
a C
02 H
ole
B 16
100
100
100
100
100
100
100
100
100
100
100
100
100
100
100
100
100
100
100
100
100
100
100
100
100
100
100
100
100
100
100
100
100
100
100
100
100
100
100
100
100
100
100
100
100
100
100
100
100
0 0 0 0 0 0 0 0 0 0 0 0 0 0 0 0 0 0 0 0 0 0 0 0 0 0 0 0 0 0 0
0 0 0 0 0 0 0 0 0 0 0 0 0 97
.8
0 76
.00 0 0 0 0 0 0 0 0 0 0
99.8
0 0 0 0 0 0
- - .. - .. .. .. - - - .. 2.2
2.1
0.1
24.0
23
.3
0.7
- - - - .. - - - 0.2
- - - - -
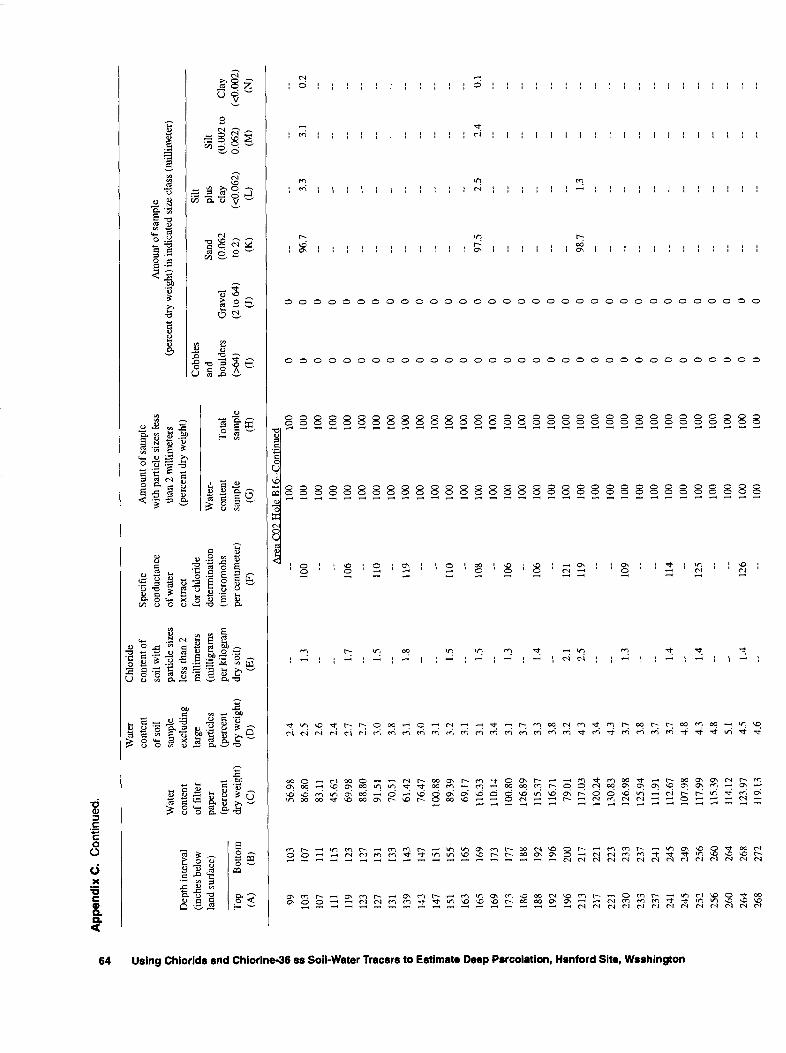
App
endi
x C
. C
ontin
ued.
Using Chiorid » (0 3
Q.
O 5" z. I S I £ i O 5 0 m |- B ^ S § I s 3" a (0 ff 1 5' =
Dep
th in
terv
al
(inch
es b
elow
land
sur
face
)
Top
(A)
99 103
107
111
119
123
127
131
139
143
147
151
163
165
169
173
186
188
192
196
213
217
221
230
233
237
241
245
252
256
260
264
268
Bot
tom
(B)
103
107
111
115
123
127
131
133
143
147
151
155
165
169
173
177
188
192
196
200
217
221
223
233
237
241
245
249
256
260
264
268
272
Wat
er
cont
ent
of fi
lter
pape
r(p
erce
ntdr
y w
eigh
t)(C
)
56.9
886
.80
83.1
145
.62
69.9
888
.80
91.5
170
.51
61.4
276
.47
100.
8889
.39
69.1
711
6.33
110.
1410
0.80
126.
8911
5.37
116.
7179
.01
117.
0312
0.24
130.
8312
6.98
125.
9411
1.91
112.
6710
7.98
117.
9911
5.39
114.
1212
3.97
119.
13
Wat
er
cont
ent
of s
oil
sam
ple
excl
udin
g la
rge
parti
cles
(per
cent
dry
wei
ght)
(D)
2.4
2.5
2.6
2.4
2.7
2.7
3.0
3.8
3.1
3.0
3.1
3.2
3.1
3.1
3.4
3.1
3.7
3.3
3.8
3.2
4.3
3.4
4.3
3.7
3.8
3.7
3.7
4.8
4.3
4.8
5.1
4.5
4.6
Chl
orid
e co
nten
t of
soil
with
pa
rtic
le s
izes
le
ss t
han
2 m
illim
eter
s(m
illig
ram
spe
r kilo
gram
dry
soil)
(E) 1.
3- - 1.
7-- 1.
5- 1.
8- - 1.
5- 1.
5- 1.
3
1.4
__ 2.1
2.5
- - 1.3
-- - 1.4
- 1.4
- - 1.4
-
Spec
ific
cond
ucta
nce
of w
ater
ex
trac
t fo
r ch
lori
dede
term
inat
ion
(mic
rom
ohs
per
cent
imet
er)
(F)
Are
a C
02
100 --
106 --
110 -
119 - -
110
108 -
106 -
106
121
119 -- --
109 -- -
114 --
125 -- --
126 -
Am
ount
of s
ampl
e w
ith p
artic
le s
izes
less
th
an 2
mill
imet
ers
(per
cent
dry
wei
ght)
Wat
er-
cont
ent
sam
ple
(G)
Tota
lsa
mpl
e(H
)
Am
ount
of s
ampl
e (p
erce
nt d
ry w
eigh
t) in
indi
cate
d si
ze c
lass
(mill
imet
er)
Cob
bles
and
boul
ders
(>64
)(I
)
Sand
Gra
vel
(0.0
62(2
to 6
4)
to 2
)(J
) (K
)
Silt
plus
Si
ltcl
ay
(0.0
02 to
C
lay
(<0.
062)
0.
062)
(<
0.00
2)(L
) (M
) (N
)
Hol
eB16
-Con
tinu
ed10
010
010
010
010
010
010
010
010
010
010
010
010
010
010
010
010
010
010
010
010
010
010
010
010
010
010
010
010
010
010
010
010
0
100
100
100
100
100
100
100
100
100
100
100
100
100
100
100
100
100
100
100
100
100
100
100
100
100
100
100
100
100
100
100
100
100
0 0 0 0 0 0 0 0 0 0 0 0 0 0 0 0 0 0 0 0 0 0 0 0 0 0 0 0 0 0 0 0 0
0 0 96
.70 0 0 0 0 0 0 0 0 0 0 0
97.5
0 0 0 0 0 0 0 98
.70 0 0 0 0 0 0 0 0 0 0 0
.. 3.3
3.1
0.2
- - - - - -- - -- .. - _ 2.5
2.4
0.1
.. .. - - .. - 1.3
- - - - - - - - - - -- ..
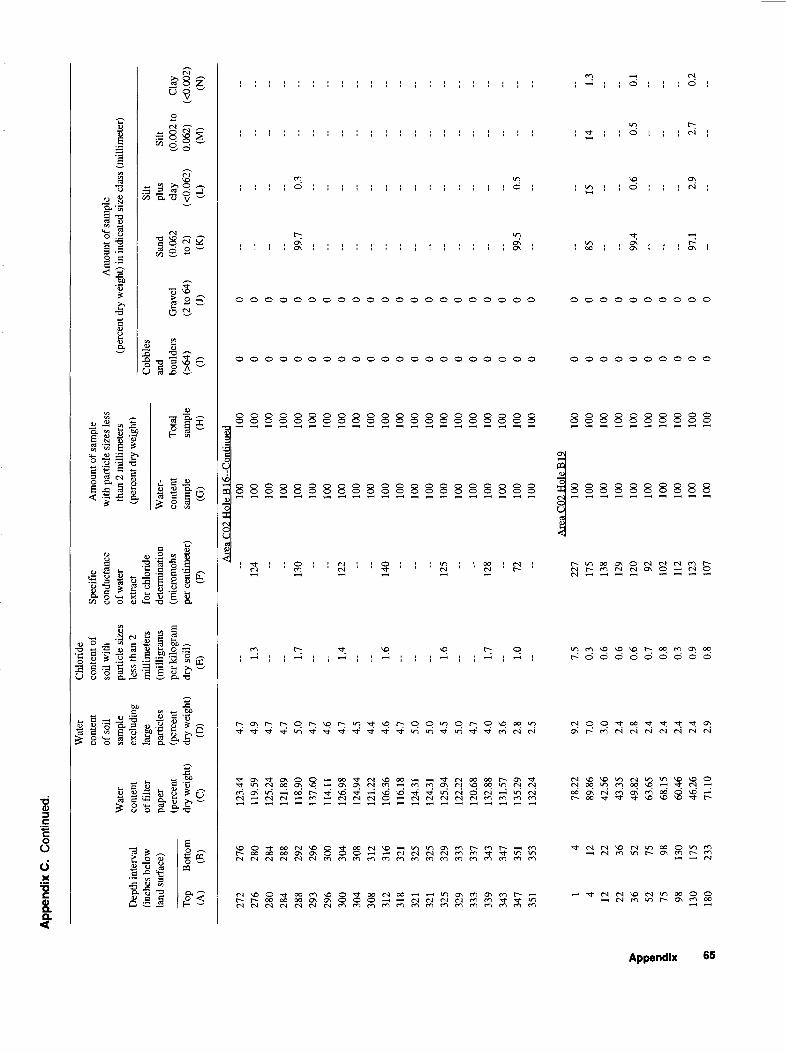
App
endi
x C
. C
ontin
ued.
Dep
th in
terv
al(in
ches
bel
owla
nd s
urfa
ce)
Top
(A)
Bot
tom
(B)
Wat
er
cont
ent
of fi
lter
pape
r(p
erce
ntdr
y w
eigh
t)(Q
Wat
er
cont
ent
of so
il sa
mpl
e ex
clud
ing
larg
epa
rtic
les
(per
cent
dry
wei
ght)
(D)
Chl
orid
e co
nten
t of
soil
with
pa
rtic
le s
izes
le
ss th
an 2
mill
imet
ers
(mill
igra
ms
per k
ilogr
amdr
y so
il)(E
)
Spec
ific
cond
ucta
nce
of w
ater
ex
trac
tfo
r chl
orid
ede
term
inat
ion
(mic
rom
ohs
per
cent
imet
er)
(F)
Am
ount
of s
ampl
e w
ith p
artic
le s
izes
less
th
an 2
mill
imet
ers
(per
cent
dry
wei
ght)
Wat
er-
cont
ent
sam
ple
(G)
Tota
lsa
mpl
e(H
)
Am
ount
of s
ampl
e (p
erce
nt d
ry w
eigh
t) in
indi
cate
d si
ze c
lass
(m
illim
eter
)
Cob
bles
and
boul
ders
(>64
)(I
)
Sand
Gra
vel
(0.0
62(2
to 6
4)
to 2
)(J
) (K
)
Silt
plus
Si
ltcl
ay
(0.0
02 to
C
lay
(<0.
062)
0.
062)
(<
0.00
2)(L
) (M
) (N
)
Are
a C
02 H
ole
B 1
6-C
ontin
ued
272
276
280
284
288
293
296
300
304
308
312
318
321
321
325
329
333
339
343
347
351 1 4 12 22 36 52 75 98 130
180
276
280
284
288
292
296
300
304
308
312
316
321
325
325
329
333
337
343
347
351
353 4 12 22 36 52 75 98 130
175
233
123.
4411
9.59
125.
2412
1.89
118.
9013
7.60
114.
1112
6.98
124.
9412
1.22
106.
3611
6.18
124.
3112
4.31
125.
9412
2.22
120.
6813
2.88
131.
5713
5.29
132.
24
78.2
289
.86
42.5
643
.35
49.8
263
.65
68.1
560
.46
46.2
671
.10
4.7
4.9
4.7
4.7
5.0
4.7
4.6
4.7
4.5
4.4
4.6
4.7
5.0
5.0
4.5
5.0
4.7
4.0
3.6
2.8
2.5
9.2
7.0
3.0
2.4
2.8
2.4
2.4
2.4
2.4
2.9
-- 1.3
1.7
-- - 1.4
- - 1.6
-- -- -- 1.6
- - 1.7
- 1.0
-- 7.5
0.3
0.6
0.6
0.6
0.7
0.8
0.3
0.9
0.8
-
124 -- --
130 -- --
122 - -
140 -- -- --
125 - -
128 -- 72 --
227
175
138
129
120 92 102
112
123
107
100
100
100
100
100
100
100
100
100
100
100
100
100
100
100
100
100
100
100
100
100
Are
a C
02 H
ole
B 1
910
010
010
010
010
010
010
010
010
010
0
100
100
100
100
100
100
100
100
100
100
100
100
100
100
100
100
100
100
100
100
100
100
100
100
100
100
100
100
100
100
100
0 0 0 0 0 0 0 0 0 0 0 0 0 0 0 0 0 0 0 0 0 0 0 0 0 0 0 0 0 0 0
0 0 0 0 0 99
.70 0 0 0 0 0 0 0 0 0 0 0 0 0 0
99.5
0 0 0 85
0 0 0 99
.40 0 0 0
97.1
0
.. .. _. .. 0.3
.. .. .. - .. .. .. .. .. .. .. .. .. .. 0.5
-- .. 15
14
1.3
.. .. 0.6
0.5
0.1
.. .. .. 2.9
2.7
0.2
..
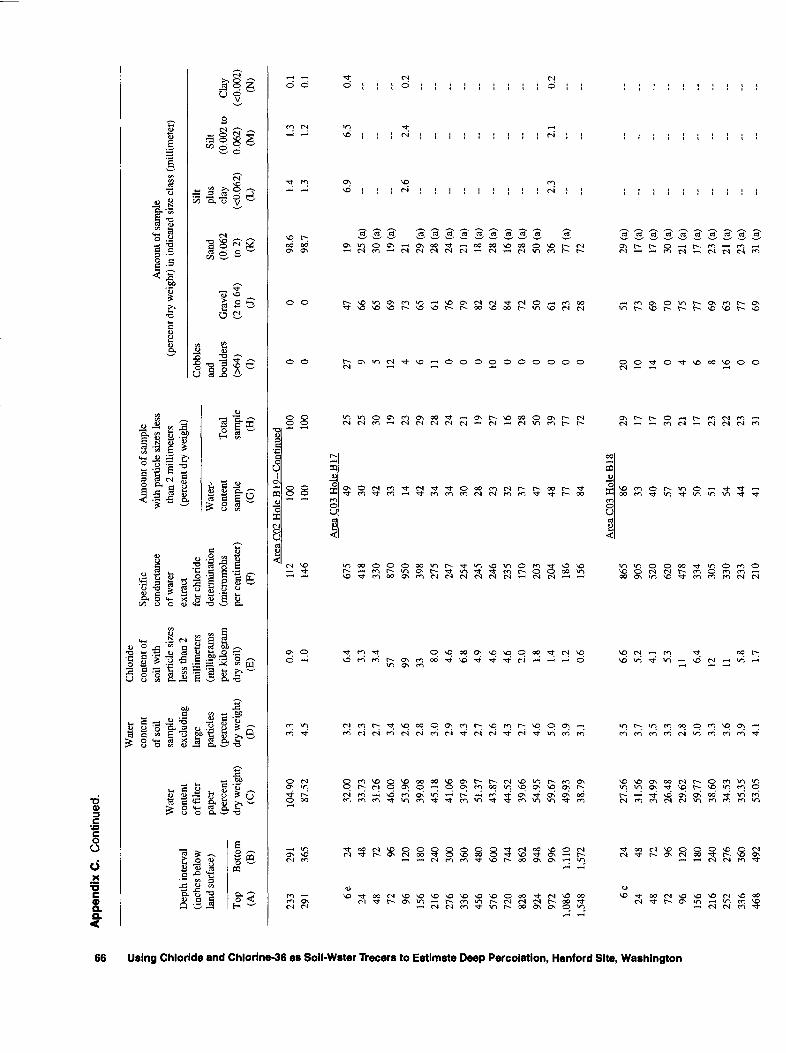
8 A
ppen
dix
C. C
ontin
ued.
c 3"
10 O 9_
Dep
th in
terv
al§
(in
ches
bel
ow8>
land
sur
face
)a O
T
-3-
T
op5
(A
)3 a> a
233
«
291
o i a 6e
?24 48
3
72o
96S
15
63
216
S
276
f33
645
6»
576
§72
082
80
924
I
972
^
1,08
6?
1,54
8a <fi ? ~f
6e
S
243
48
!
723
96 156
216
252
336
468
Bot
tom
(B)
Wat
er
cont
ent
of fi
lter
pape
r(p
erce
ntdr
y w
eigh
t)(C
)
Wat
er
cont
ent
of so
il sa
mpl
e ex
clud
ing
larg
epa
rticl
es(p
erce
ntdr
y w
eigh
t)(D
)
Chl
orid
e co
nten
t of
soil
with
pa
rticl
e si
zes
less
than
2m
illim
eter
s(m
illig
ram
spe
r kilo
gram
dry
soil)
(E)
Spec
ific
cond
ucta
nce
of w
ater
ex
tract
for c
hlor
ide
dete
rmin
atio
n(m
icro
moh
spe
r cen
timet
er)
(F)
Am
ount
of s
ampl
e w
ith p
artic
le s
izes
less
th
an 2
mill
imet
ers
(per
cent
dry
wei
ght)
Wat
er-
cont
ent
sam
ple
(G)
Tota
lsa
mpl
e(H
)
Am
ount
of s
ampl
e (p
erce
nt d
ry w
eigh
t) in
indi
cate
d si
ze c
lass
(m
illim
eter
)
Cob
bles
and
boul
ders
(>64
)(1
)
Gra
vel
(2 to
64)
(J)
Sand
(0.0
62to
2)
(K)
Silt
plus
Si
ltcl
ay
(0.0
02 to
C
lay
(<0.
062)
0.
062)
(<
0.00
2)(L
) (M
) (N
)
Are
a C
02 H
ole
B19
-Con
tinu
ed29
136
5 24 48 72 96 120
180
240
300
360
480
600
744
862
948
996
1,11
01,
572 24 48 72 96 120
180
240
276
360
492
104.
90
87.5
2
32.0
033
.73
31.2
646
.00
53.9
639
.08
45.1
841
.06
37.9
951
.37
43.8
744
.52
39.6
654
.95
59.6
749
.93
38.7
9
27.5
631
.56
34.9
926
.48
29.6
2
59.7
738
.60
34.5
335
.35
53.0
5
3.3
4.5
3.2
2.3
2.7
3.4
2.6
2.8
3.0
2.9
4.3
2.7
2.6
4.3
2.7
4.6
5.0
3.9
3.1 3.5
3.7
3.5
3.3
2.8
5.0
3.3
3.6
3.9
4.1
0.9 1.0
6.4
3.3
3.4
57 99 33 8.0
4.6
6.8
4.9
4.6
4.6
2.0 1.8
1.4
1.2
0.6
6.6
5.2
4.1 5.3
11 6.4
12 11 5.8 1.7
112
146
675
418
330
870
950
398
275
247
254
245
246
235
170
203
204
186
156
865
905
520
620
478
334
305
330
233
210
100
100
Are
a C
03 H
ole
B 17
49 30 42 33 14 42 34 34 30 28 23 32 37 47 48 77 84
Are
a C
03 H
ole
B18
86 33 40 57 45 50 51 54 44 41
100
100 25 25 30 19 23 29 28 24 21 19 27 16 28 50 39 77 72 29 17 17 30 21 17 23 22 23 31
0 0 27 9 5 12 4 6 11 0 0 0 10 0 0 0 0 0 0 20 10 14 0 4 6 8 16 0 0
0 0 47 66 65 69 73 65 61 76 79 82 62 84 72 50 61 23 28 51 73 69 70 75 77 69 63 77 69
98.6
98.7
19 25 (
a)30
(a)
19 (
a)21 29
(a)
28 (
a)24
(a)
21 (
a)18
(a)
28 (
a)16
(a)
28 (
a)50
(a)
36 77 (
a)72 29
(a)
17 (
a)17
(a)
30 (
a)21
(a)
17 (
a)23
(a)
21 (
a)23
(a)
31 (
a)
1.4
1.3
0.1
1.3
1.2
0.1
6.9
6.5
0.4
- __ - 2.6
2.4
0.2
- - - - - - -- 2.3
2.1
0.2
.. .. .. .. - .. .. .. .. ..
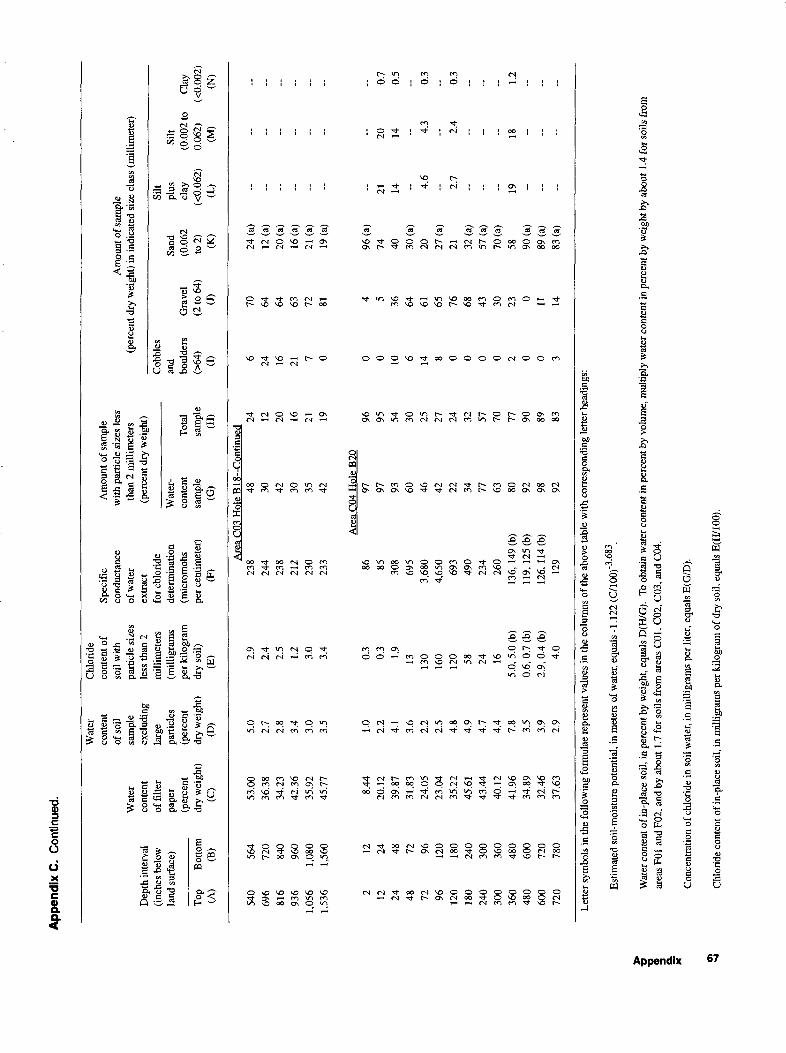
App
endi
x C
. C
ontin
ued.
1 Q.
X
Dep
th in
terv
al(in
ches
bel
owla
nd s
urfa
ce)
Top
Bot
tom
(A)
(B)
Wat
er
cont
ent
of fi
lter
pape
r(p
erce
ntdr
y w
eigh
t)(C
)
Wat
er
cont
ent
of so
il sa
mpl
e ex
clud
ing
larg
epa
rticl
es(p
erce
ntdr
y w
eigh
t)(D
)
Chl
orid
e co
nten
t of
soil
with
pa
rtic
le s
izes
le
ss t
han
2m
illim
eter
s(m
illig
ram
spe
r kilo
gram
dry
soil)
(E)
Spec
ific
co
nduc
tanc
e of
wat
er
extr
act
for
chlo
ride
dete
rmin
atio
n(m
icro
moh
spe
r ce
ntim
eter
)(F
)
Am
ount
of s
ampl
e w
ith p
artic
le s
izes
less
th
an 2
mill
imet
ers
(per
cent
dry
wei
ght)
Wat
er-
cont
ent
sam
ple
(G)
Tota
lsa
mpl
e(H
)
Am
ount
of s
ampl
e (p
erce
nt d
ry w
eigh
t) in
indi
cate
d si
ze c
lass
(m
illim
eter
)
Cob
bles
and
boul
ders
(>64
)(I
)
Gra
vel
(2 to
64)
(J)
Sand
(0.0
62to
2)
(K)
Silt
plus
clay
(<0.
062)
(L)
Silt
(0.0
02 to
0.06
2)(M
)
Cla
y(<
0.00
2)(N
)
Are
a C
03 H
ole
B 1 8
-Con
tinue
d54
0 56
469
6 72
081
6 84
093
6 96
01,
056
1,08
01,
536
1,56
0
53.0
036
.38
34.2
342
.36
35.9
245
.77
5.0
2.7
2.8
3.4
3.0
3.5
2.9
2.4
2.5
1.2
3.0
3.4
238
244
238
212
230
233
48 30 42 30 35 42
24 12 20 16 21 19
6 24 16 21 7 0
70 64 64 63 72 81
24 (
a)12
(a)
20 (
a)16
(a)
21 (
a)19
(a)
-- -- - -- --
-- -- -- - -
- - -
Are
a C
04 H
ole
B20
2 12
12
2424
48
48
7272
96
96
120
120
180
180
240
240
300
300
360
360
480
480
600
600
720
720
780
8.44
20.1
239
.87
31.8
324
.05
23.0
435
.22
45.6
143
.44
40.1
241
.96
34.8
932
.46
37.6
3
1.0
2.2
4.1
3.6
2.2
2.5
4.8
4.9
4.7
4.4
7.8
3.5
3.9
2.9
0.3
0.3 1.9
13 130
160
120 58 24 16
5.0,
5.0
(b)
0.6,
0.7
(b)
2.9,
0.4
(b)
4.0
86 85 308
695
3,68
04,
650
693
490
234
260
136,
149
(b)
119,
125
(b)
126,
114
(b)
129
97 97 93 60 46 42 22 34 77 63 80 92 98 92
96 95 54 30 25 27 24 32 57 70 77 90 89 83
0 0 10 6 14 8 0 0 0 0 2 0 0 3
4 5 36 64 61 65 76 68 43 30 23 0 11 14
96 (
a)74 40 30
(a)
20 27 (
a)21 32
(a)
57 (
a)70
(a)
58 90 (
a)89
(a)
83 (
a)
- 21 14 -- 4.6
-- 2.7
-- -- -- 19 - --
-- 20 14 -- 4.3
-- 2.4
-- -- -- 18 - --
0.7
0.5
-- 0.3
-- 0.3
- -- -- 1.2
-- --
Let
ter
sym
bols
in th
e fo
llow
ing
form
ulae
rep
rese
nt v
alue
s in
the
colu
mns
of t
he a
bove
tabl
e w
ith c
orre
spon
ding
lette
r hea
ding
s:
Est
imat
ed s
oil-
moi
stur
e po
tent
ial,
in m
eter
s of
wat
er, e
qual
s -1
.122
(C
/100
) .
Wat
er c
onte
nt o
f in-
plac
e so
il, i
n pe
rcen
t by
wei
ght,
equa
ls D
(H/G
). To
obt
ain
wat
er c
onte
nt in
per
cent
by
volu
me,
mul
tiply
wat
er c
onte
nt in
per
cent
by
wei
ght b
y ab
out
1.4
for s
oils
fro
m
area
s F0
1 an
d F0
2, a
nd b
y ab
out
1.7
for
soils
fro
m a
reas
C01
, C02
, C03
, and
C04
.
Con
cent
ratio
n of
chl
orid
e in
soi
l wat
er, i
n m
illig
ram
s pe
r lit
er, e
qual
s E(
G/D
).
Chl
orid
e co
nten
t of i
n-pl
ace
soil,
in m
illig
ram
s pe
r kilo
gram
of d
ry s
oil,
equa
ls E
(H/1
00).
Selected Series of U.S. Geological Survey Publications
Books and Other Publications
Professional Papers report scientific data and interpretations of lasting scientific interest that cover all facets of USGS inves tigations and research.
Bulletins contain significant data and interpretations that are of lasting scientific interest but are generally more limited in scope or geographic coverage than Professional Papers.
Water-Supply Papers are comprehensive reports that present significant interpretive results of hydrologic investigations of wide interest to professional geologists, hydrologists, and engi neers. The series covers investigations in all phases of hydrol ogy, including hydrogeology, availability of water, quality of water, and use of water.
Circulars are reports of programmatic or scientific information of an ephemeral nature; many present important scientific information of wide popular interest. Circulars are distributed at no cost to the public.
Fact Sheets communicate a wide variety of timely information on USGS programs, projects, and research. They commonly address issues of public interest. Fact Sheets generally are two or four pages long and are distributed at no cost to the public.
Reports in the Digital Data Series (DDS) distribute large amounts of data through digital media, including compact disc- read-only memory (CD-ROM). They are high-quality, interpre tive publications designed as self-contained packages for view ing and interpreting data and typically contain data sets, software to view the data, and explanatory text.
Water-Resources Investigations Reports are papers of an interpretive nature made available to the public outside the for mal USGS publications series. Copies are produced on request (unlike formal USGS publications) and are also available for public inspection at depositories indicated in USGS catalogs.
Open-File Reports can consist of basic data, preliminary reports, and a wide range of scientific documents on USGS investigations. Open-File Reports are designed for fast release and are available for public consultation at depositories.
Maps
Geologic Quadrangle Maps (GQ's) are multicolor geologic maps on topographic bases in 7.5- or 15-minute quadrangle formats (scales mainly 1:24,000 or 1:62,500) showing bedrock, surficial, or engineering geology. Maps generally include brief texts; some maps include structure and columnar sections only.
Geophysical Investigations Maps (GP's) are on topographic or planimetric bases at various scales. They show results of geophysical investigations using gravity, magnetic, seismic, or radioactivity surveys, which provide data on subsurface struc tures that are of economic or geologic significance.
Miscellaneous Investigations Series Maps or Geologic Investigations Series (I's) are on planimetric or topographic bases at various scales; they present a wide variety of format and subject matter. The series also incudes 7.5-minute quadran gle photogeologic maps on planimetric bases and planetary maps.
Information Periodicals
Metal Industry Indicators (Mil's) is a free monthly newslet ter that analyzes and forecasts the economic health of five metal industries with composite leading and coincident indexes: primary metals, steel, copper, primary and secondary aluminum, and aluminum mill products.
Mineral Industry Surveys (MIS's) are free periodic statistical and economic reports designed to provide timely statistical data on production, distribution, stocks, and consumption of signifi cant mineral commodities. The surveys are issued monthly, quarterly, annually, or at other regular intervals, depending on the need for current data. The MIS's are published by commod ity as well as by State. A series of international MIS's is also available.
Published on an annual basis, Mineral Commodity Summa ries is the earliest Government publication to furnish estimates covering nonfuel mineral industry data. Data sheets contain information on the domestic industry structure, Government programs, tariffs, and 5-year salient statistics for more than 90 individual minerals and materials.
The Minerals Yearbook discusses the performance of the worldwide minerals and materials industry during a calendar year, and it provides background information to assist in inter preting that performance. The Minerals Yearbook consists of three volumes. Volume I, Metals and Minerals, contains chap ters about virtually all metallic and industrial mineral commod ities important to the U.S. economy. Volume II, Area Reports: Domestic, contains a chapter on the minerals industry of each of the 50 States and Puerto Rico and the Administered Islands. Volume III, Area Reports: International, is published as four separate reports. These reports collectively contain the latest available mineral data on more than 190 foreign countries and discuss the importance of minerals to the economies of these nations and the United States.
Permanent Catalogs
"Publications of the U.S. Geological Survey, 1879-1961" and "Publications of the U.S. Geological Survey, 1962- 1970" are available in paperback book form and as a set of microfiche.
"Publications of the U.S. Geological Survey, 1971-1981" isavailable in paperback book form (two volumes, publications listing and index) and as a set of microfiche.
Annual supplements for 1982, 1983,1984, 1985, 1986, and subsequent years are available in paperback book form.
Availability of Publications of the U.S. Geological Survey
Order U.S. Geological Survey (USGS) publications from the offices listed below. Detailed ordering instructions, along with prices of the last offerings, are given in the current-year issues of the catalog "New Publications of the U.S. GeologicalSurvey."
Books, Maps, and Other Publications
By Mail
Books, maps, and other publications are available by mail from
USGS Information Services Box 25286, Federal Center Denver, CO 80225
Publications include Professional Papers, Bulletins, Water- Supply Papers, Techniques of Water-Resources Investigations, Circulars, Fact Sheets, publications of general interest, single copies of permanent USGS catalogs, and topographic and thematic maps.
Over the Counter
Books, maps, and other publications of the U.S. Geological Survey are available over the counter at the following USGS Earth Science Information Centers (ESIC's), all of which are authorized agents of the Superintendent of Documents:
Anchorage, Alaska Rm. 101,4230 University Dr. Denver, Colorado-Bldg. 810, Federal Center Menlo Park, California-^lm. 3128, Bldg. 3,
345 Middlefield Rd. Reston, Virginia-^lm. 1C402, USGS National Center,
12201 Sunrise Valley Dr. Salt Lake City, Utah-2222 West, 2300 South (books and
maps available for inspection only) Spokane, Washington-^lm. 135, U.S. Post Office
Building, 904 West Riverside Ave. Washington, D.C.-Rm. 2650, Main Interior Bldg.,
18th and CSts.,NW.
Maps only may be purchased over the counter at the following USGS office:
Rolla, Missouri 1400 Independence Rd.
Electronically
Some USGS publications, including the catalog "New Publica tions of the U.S. Geological Survey" are also available elec tronically on the USGS's World Wide Web home page at http://www.usgs.gov
Preliminary Determination of Epicenters
Subscriptions to the periodical "Preliminary Determination of Epicenters" can be obtained only from the Superintendent of
Documents. Check or money order must be payable to the Superintendent of Documents. Order by mail from
Superintendent of Documents Government Printing Office Washington, DC 20402
Information Periodicals
Many Information Periodicals products are available through the systems or formats listed below:
Printed Products
Printed copies of the Minerals Yearbook and the Mineral Com modity Summaries can be ordered from the Superintendent of Documents, Government Printing Office (address above). Printed copies of Metal Industry Indicators and Mineral Indus try Surveys can be ordered from the Center for Disease Control and Prevention, National Institute for Occupational Safety and Health, Pittsburgh Research Center, P.O. Box 18070, Pitts burgh, PA 15236-0070.
Mines FaxBack: Return fax service
1. Use the touch-tone handset attached to your fax machine's telephone jack. (ISDN [digital] telephones cannot be used with fax machines.)2. Dial (703) 648-4999.3. Listen to the menu options and punch in the number of your selection, using the touch-tone telephone.4. After completing your selection, press the start button on your fax machine.
CD-ROM
A disc containing chapters of the Minerals Yearbook (1993- 95), the Mineral Commodity Summaries (1995-97), a statisti cal compendium (1970-90), and other publications is updated three times a year and sold by the Superintendent of Docu ments, Government Printing Office (address above).
World Wide Web
Minerals information is available electronically at http://minerals.er.usgs.gov/minerals/
Subscription to the catalog "New Publications of the U.S. Geological Survey"
Those wishing to be placed on a free subscription list for the catalog "New Publications of the U.S. Geological Survey" should write to
U.S. Geological Survey 903 National Center Reston, VA 20192

Printed OR recycled paper
ISBN 0-bQ7-£fl7flO-5
9"780607ll897807


