USING CATASTROPHE RISK MODELS TO OPTIMIZE SUPPLY … · • 2011 Sept-Nov floods lasted 4- 9 weeks...
19
1 Copyright © 2015 Risk Management Solutions, Inc. USING CATASTROPHE RISK MODELS TO OPTIMIZE SUPPLY CHAIN RESILIENCE Robert Muir-Wood Chief Research Officer Dec 14th 2018
Transcript of USING CATASTROPHE RISK MODELS TO OPTIMIZE SUPPLY … · • 2011 Sept-Nov floods lasted 4- 9 weeks...

1Copyright © 2015 Risk Management Solutions, Inc.
USING CATASTROPHE RISK MODELS TO OPTIMIZE SUPPLY CHAIN RESILIENCE
Robert Muir-WoodChief Research OfficerDec 14th 2018

2Copyright © 2015 Risk Management Solutions, Inc..
CATASTROPHE RISK MODELLING FOR INSURANCE
Synthetic history computer
Three principal multi-perils
Three additional perils
Three additional perils
Three principal multi-perils
Three principal multi-perils
Earthquake +
Hurricane +
Flood Cyber
Toxic release
PandemicRecent history
Synthetic history
v

3Copyright © 2015 Risk Management Solutions, Inc..
Create a set of earthquake events that characterize long-term probabilities
FRAMEWORK FOR EARTHQUAKE RISK MODELING
Define Events Assess Ground Motion Calculate Damage Quantify Risk
Calculate the ground motion for all sites due to each stochastic event
Calculate the average damage and associated uncertainty. Determine the business downtime.
Calculate the financial impact for all perspectives

4Copyright © 2015 Risk Management Solutions, Inc..
4
THE OUTPUTS OF A CATASTROPHE LOSS MODEL The EP curve provides a visual interpretation of loss potential
Each point of the curve has an associated threshold and probability of exceedance

5Copyright © 2015 Risk Management Solutions, Inc..
SUPPLY CHAIN CATS: 2011 THAI FLOODS
• Six large industrial estate ‘business clusters’ established on Chao Phraya flood plain in the 1990s
• Low levels of flood protection.• 2011 Sept-Nov floods lasted 4-9
weeks
• 7,510 industrial and manufacturing plants flooded,

6Copyright © 2015 Risk Management Solutions, Inc..
SUPPLY CHAIN CATS: 2012 SUPERSTORM SANDY
• Caused widespread damage to the logistics and transportation networks in the US MidAtlantic region.
• Ports and terminals from Baltimore to New York were temporarily closed causing shipping carriers to either delay or reroute shipments for a week
• Even after a month, Port Authority of NY & NJ only operating at 75 percent.

7Copyright © 2015 Risk Management Solutions, Inc..
SUPPLY CHAIN CATS: XIRALLIC 2011 JAPAN EQ
• Sole manufacturer of a pearl-luster pigment paint that makes cars sparkle
• Plant suffered shaking damage in March 11th 2011 M9EQ
• Factory was situated in the initial radiation exclusion zone
• Site inaccessible until radiation release stabilized
• Production resumed May 8th 2011 –backlog cleared by September 2011

8Copyright © 2015 Risk Management Solutions, Inc.. CONFIDENTIAL© 2012 Risk Management Solutions, Inc.
SUPPLY-CHAIN NETWORK WITHIN MOTORX
DistributionsSuppliers Facility3rd Tier 2nd Tier 1st Tier
Engine
Okado
Parts
MotorX
Global distributions
HBC1Daikoku
Yokosuka
Rear differential gears
Hunan
Topology # of main facilitybuildings / sites
# of suppliersbuildings / sites
# of distributionsbuildings / sites
Total # ofbuildings / sites
description
4 2 / 2 8 / 7 9 / 8 19 / 17 Add Daikoku and YokosukaDisclaimer or model ports 8
Assemble
MotorXYakimaa
MotorXIMain
96%(x1.2)
4%(x1.2)
Transmission
Hakone Gifu MotorX
88%(x1.2)8%(x1.2)4%(x1.2)
MetalForging
Inomaki
KyotoIchitan
90%(x1.2)
10%(x1.2)Domestic
distributions
TohokuOta
Kanagawa
Toki
Kansai
Fukuoka
12.5%(x1.9)
1.4%(x1.9)
6.9%(x1.9)
1.4%(x1.9)
7.8%(x1.9)
36%(x2.8)
8%(x2.8)
HBC1
HBC2
A%(xB) indicates contribution factor A and maximum capacity B.
14%(x2.8)
12%(x2.8)
Additional suppliers

9Copyright © 2015 Risk Management Solutions, Inc.. CONFIDENTIAL© 2012 Risk Management Solutions, Inc.
0
0.5
1
Rest
ored
func
tion
Days after an event0
0.5
1
Rest
ored
func
tion
Days after an event0
0.5
1
Rest
ored
func
tion
Days after an event0
0.5
1
Rest
ored
func
tion
Days after an event
COMBINING RESTORATION CURVES IN A CBI MODEL M9
Facility
SuppliersDistributions
100%50%
30%
0% 0%
0%
FacilitySuppliersDistributionsCombined Restoration
Network downtime caused by the specified earthquake event9
Days after an event
Res
tore
d fu
nctio
n
10Copyright © 2015 Risk Management Solutions, Inc.. CONFIDENTIAL© 2012 Risk Management Solutions, Inc.
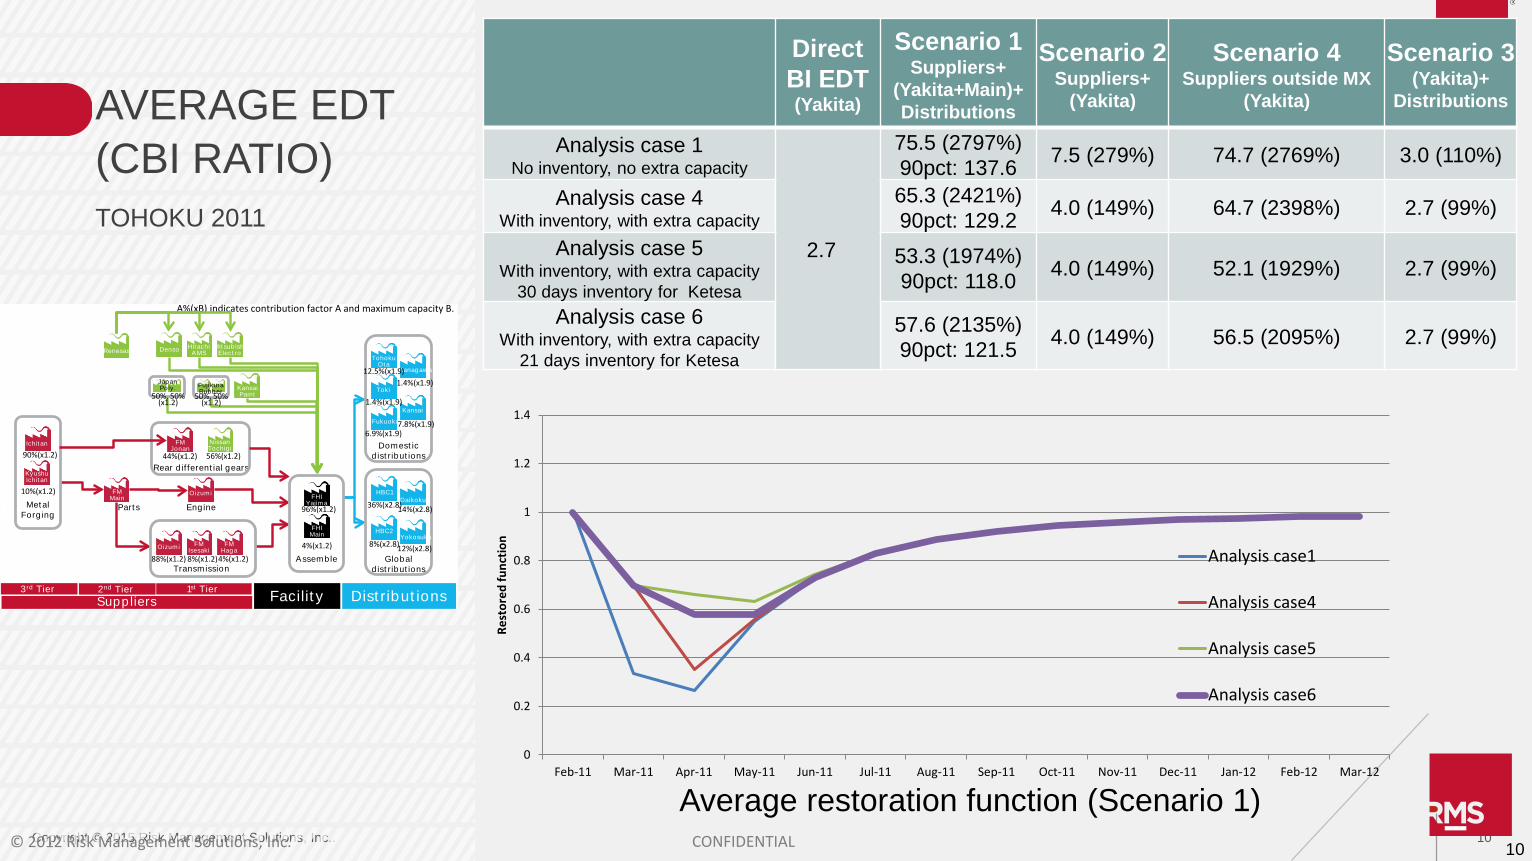
AVERAGE EDT (CBI RATIO)TOHOKU 2011
DirectBI EDT(Yakita)
Scenario 1Suppliers+
(Yakita+Main)+Distributions
Scenario 2Suppliers+
(Yakita)
Scenario 4Suppliers outside MX
(Yakita)
Scenario 3(Yakita)+
Distributions
Analysis case 1No inventory, no extra capacity
2.7
75.5 (2797%)90pct: 137.6 7.5 (279%) 74.7 (2769%) 3.0 (110%)
Analysis case 4With inventory, with extra capacity
65.3 (2421%)90pct: 129.2 4.0 (149%) 64.7 (2398%) 2.7 (99%)
Analysis case 5With inventory, with extra capacity
30 days inventory for Ketesa
53.3 (1974%)90pct: 118.0 4.0 (149%) 52.1 (1929%) 2.7 (99%)
Analysis case 6With inventory, with extra capacity
21 days inventory for Ketesa
57.6 (2135%)90pct: 121.5 4.0 (149%) 56.5 (2095%) 2.7 (99%)
10
0
0.2
0.4
0.6
0.8
1
1.2
1.4
Feb-11 Mar-11 Apr-11 May-11 Jun-11 Jul-11 Aug-11 Sep-11 Oct-11 Nov-11 Dec-11 Jan-12 Feb-12 Mar-12
Rest
ored
func
tion
Analysis case1
Analysis case4
Analysis case5
Analysis case6
Dist ribut ions
Engine
Suppliers Facilit y
Rear d if ferent ial gears
3rd Tier 2nd Tier 1st Tier
Part s
KansaiPaint
FujikuraRubber
JapanPoly.
Denso Hit achiAMS
Mit sub ishiElect roRenesas
FM Jonan
Nissan Tochig i
FHI Yajima
FHIMain
Oizumi
Oizumi FM Isesaki
FM Haga
FM Main
Ichit an
KyushuIchit an
TohokuOt a
Kanagawa
Toki
Kansai
Fukuoka
HBC1
HBC2
Daikoku
Yokosuka
Assemble
FHI Yajima
FHIMain
96%(x1.2)
4%(x1.2)
Global d ist r ibut ions
HBC1Daikoku
Yokosuka
Domest ic d ist r ibut ions
TohokuOt a
Kanagawa
Toki
Kansai
Fukuoka
12.5%(x1.9)
1.4%(x1.9)
6.9%(x1.9)
1.4%(x1.9)
7.8%(x1.9)
36%(x2.8)
8%(x2.8)
14%(x2.8)
12%(x2.8)
HBC1
HBC2
Met alForg ing
Ichit an
KyushuIchit an
90%(x1.2)
10%(x1.2)
Transmission
Oizumi FM Isesaki
FM Haga
88%(x1.2) 8%(x1.2)4%(x1.2)
44%(x1.2) 56%(x1.2)
50%, 50% (x1.2)
50%, 50% (x1.2)
A%(xB) indicates contribution factor A and maximum capacity B.
Average restoration function (Scenario 1)
11Copyright © 2015 Risk Management Solutions, Inc.. CONFIDENTIAL© 2012 Risk Management Solutions, Inc.
0 10 20 30 40 50 60 70 80 90 100
Retu
rn p
erio
d (y
ears
)
Downtime (days)
Internal CBIInternal+External CBI
1000500
250
50
100
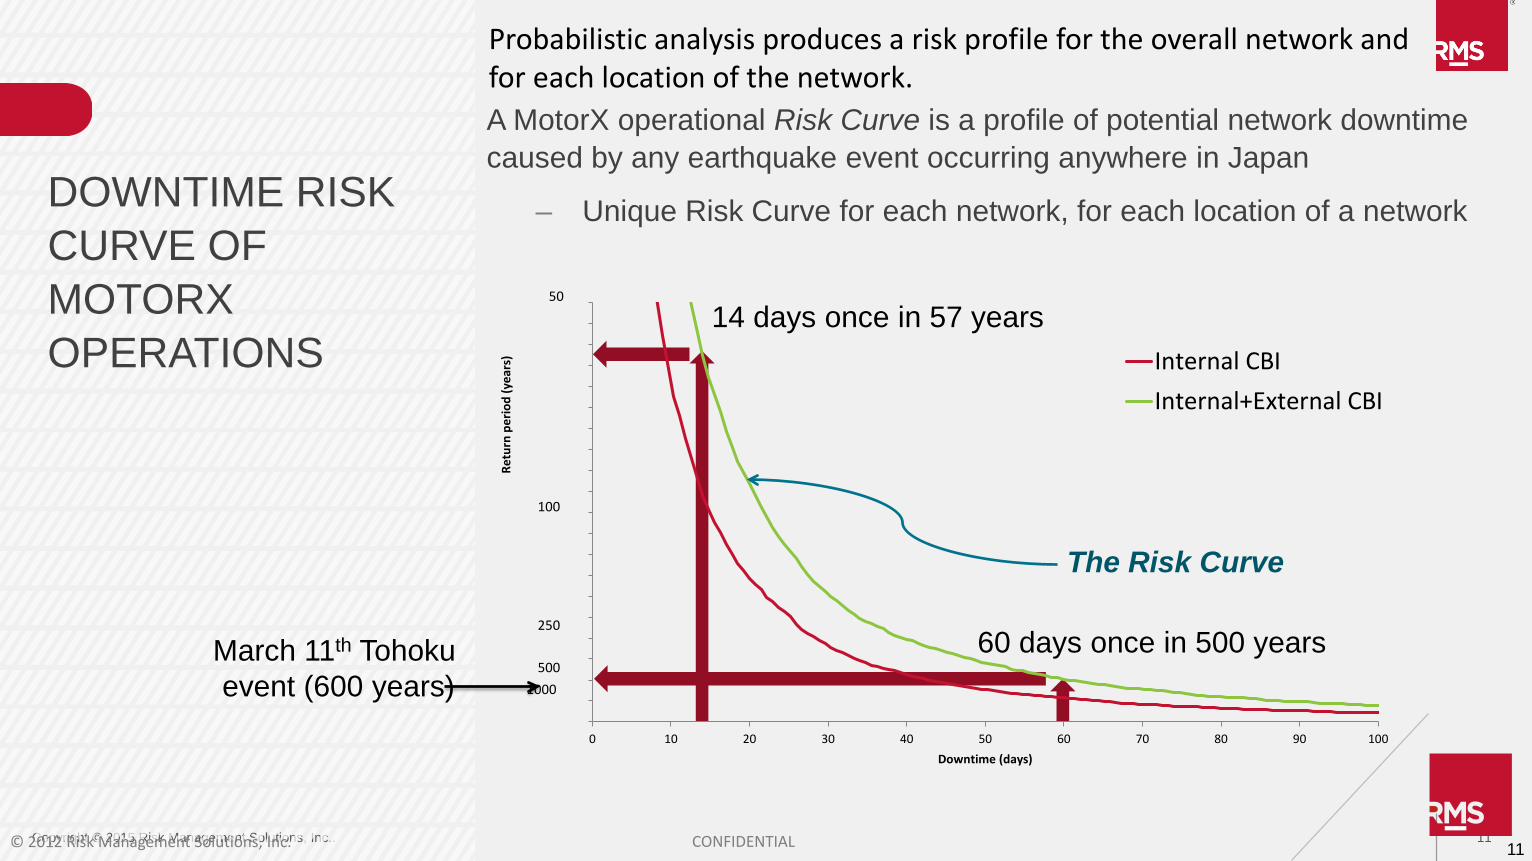
A MotorX operational Risk Curve is a profile of potential network downtime caused by any earthquake event occurring anywhere in Japan
– Unique Risk Curve for each network, for each location of a network DOWNTIME RISK CURVE OF MOTORXOPERATIONS
60 days once in 500 yearsMarch 11th Tohokuevent (600 years)
14 days once in 57 years
Probabilistic analysis produces a risk profile for the overall network and for each location of the network.
The Risk Curve
11
12Copyright © 2015 Risk Management Solutions, Inc.. CONFIDENTIAL© 2012 Risk Management Solutions, Inc.
0 5 10 15 20 25 30 35 40 45 50
Retu
rn p
erio
d (y
ears
)
Downtime (days)
CBI risk profile of internal+externalCBI
1000500
250
50
100
0 5 10 15 20 25 30 35 40 45 50
CBI improved risk profile
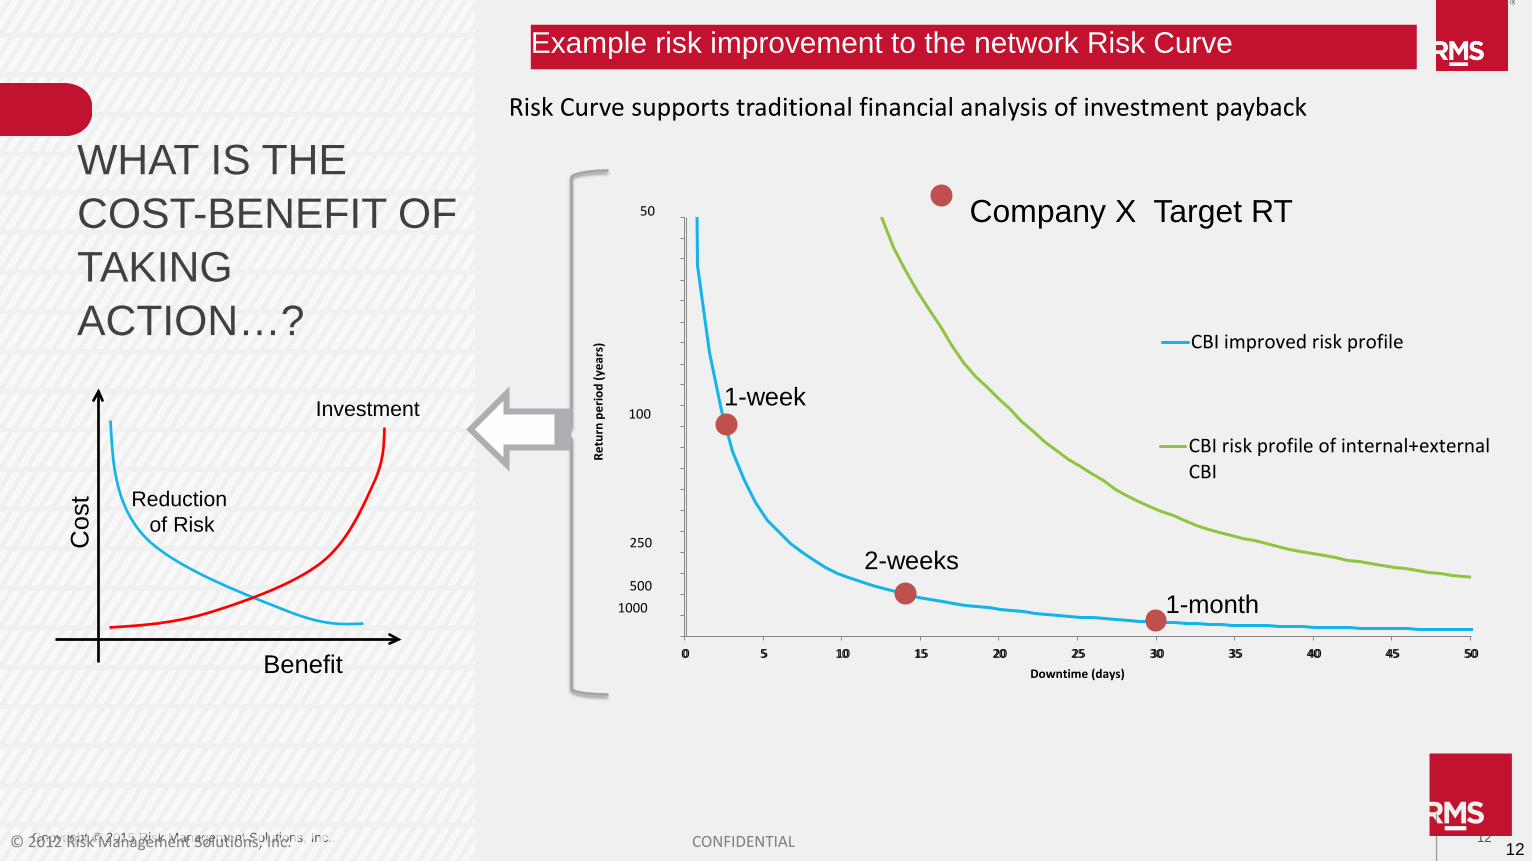
Example risk improvement to the network Risk Curve
WHAT IS THE COST-BENEFIT OF TAKING ACTION…?
2-weeks
1-month
Company X Target RT
1-week
Benefit
Cos
t Reduction of Risk
Investment
Risk Curve supports traditional financial analysis of investment payback
12

13Copyright © 2015 Risk Management Solutions, Inc..
IDEALLY EACH ELEMENT OF SUPPLY IS TRACKED USING THE ‘SUPPLIER’S DATA SCHEMA’
• High Res location of supplier• Buildings, Ages, Construction, etc• Lifelines of the supplier• Details (Code) for what is being supplied• Flow of supplies (per day/week)• Route of supply• Key ports/airports • Destination
• Information is also requested for the supplier’s own upstream sub-supply chain

14Copyright © 2015 Risk Management Solutions, Inc..
THE SUPPLY CHAIN RISK MANAGEMENT SYSTEM IS USED TO EXPLORE REDUNDANCY AND MANAGE SHOCKS
What if a key supply is interrupted for a week?
What if a key supply is interrupted for three months?
Flows are viewed passing through the supply chain
Onsite Inventory
Offsite Warehousing
Optional Supplier& ramp-up time
Current Supplier
15Copyright © 2015 Risk Management Solutions, Inc..
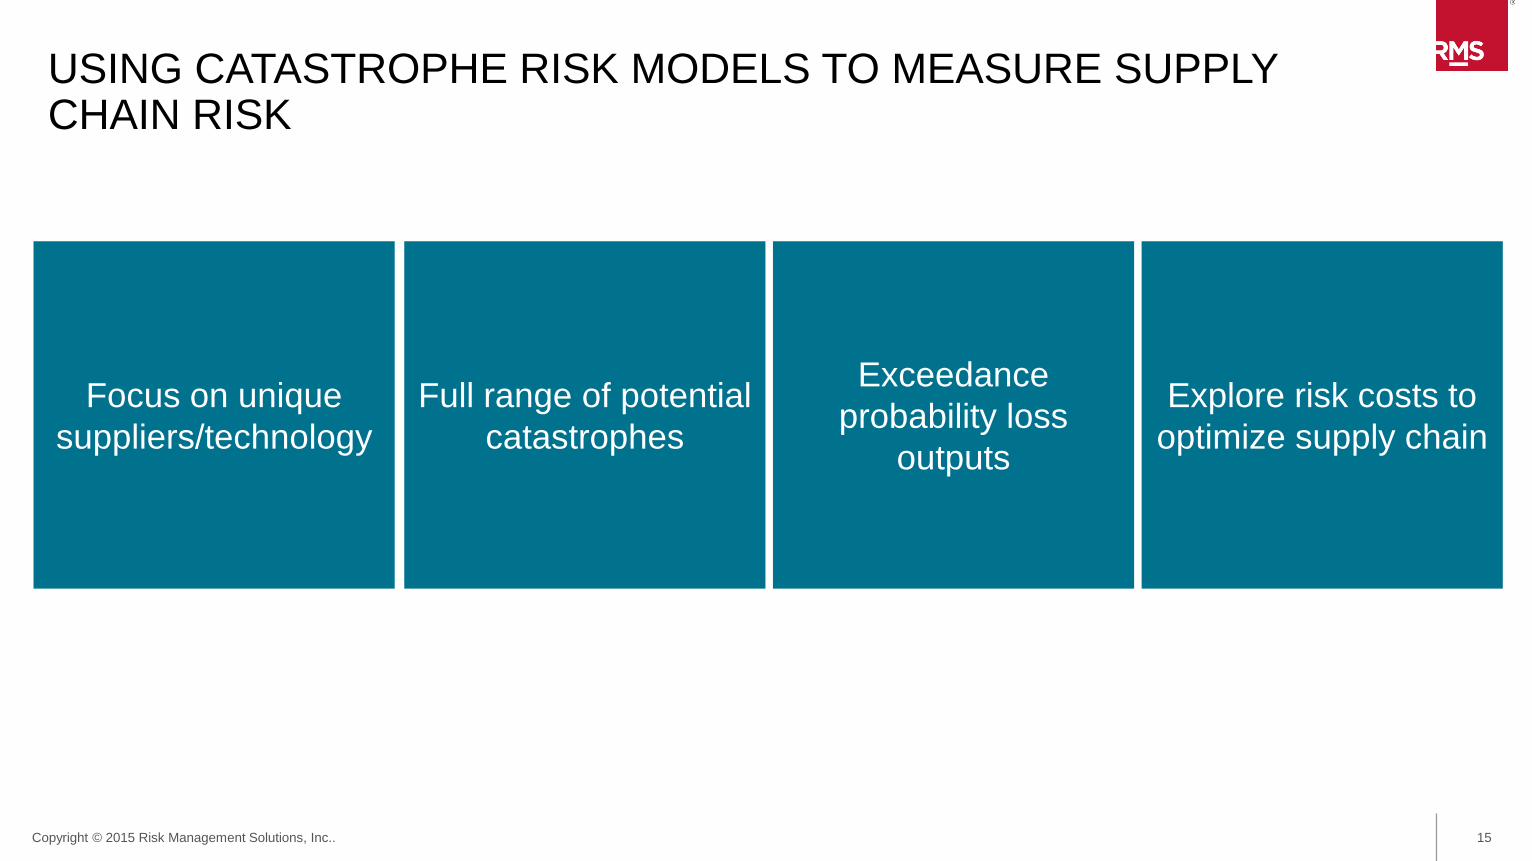
USING CATASTROPHE RISK MODELS TO MEASURE SUPPLY CHAIN RISK
Full range of potential catastrophes
Exceedance probability loss
outputs
Focus on unique suppliers/technology
Explore risk costs to optimize supply chain

16Copyright © 2015 Risk Management Solutions, Inc..
10 KEY DISASTERS FOR SUPPLY CHAIN RESILIENCE PLANNING
VEI 6 Eruption Mt Fuji
NEUS Hurricane and flooding
M7.4 Tokyo Earthquake
Rhine River flooding ***

17Copyright © 2015 Risk Management Solutions, Inc..
10 KEY DISASTERS FOR SUPPLY CHAIN RESILIENCE PLANNING
Mw7.2 Hayward Fault
Pearl River Delta Typhoon & Flooding
Cascadia M9 earthquake
Pandemic work disruption* * *
18Copyright © 2015 Risk Management Solutions, Inc..
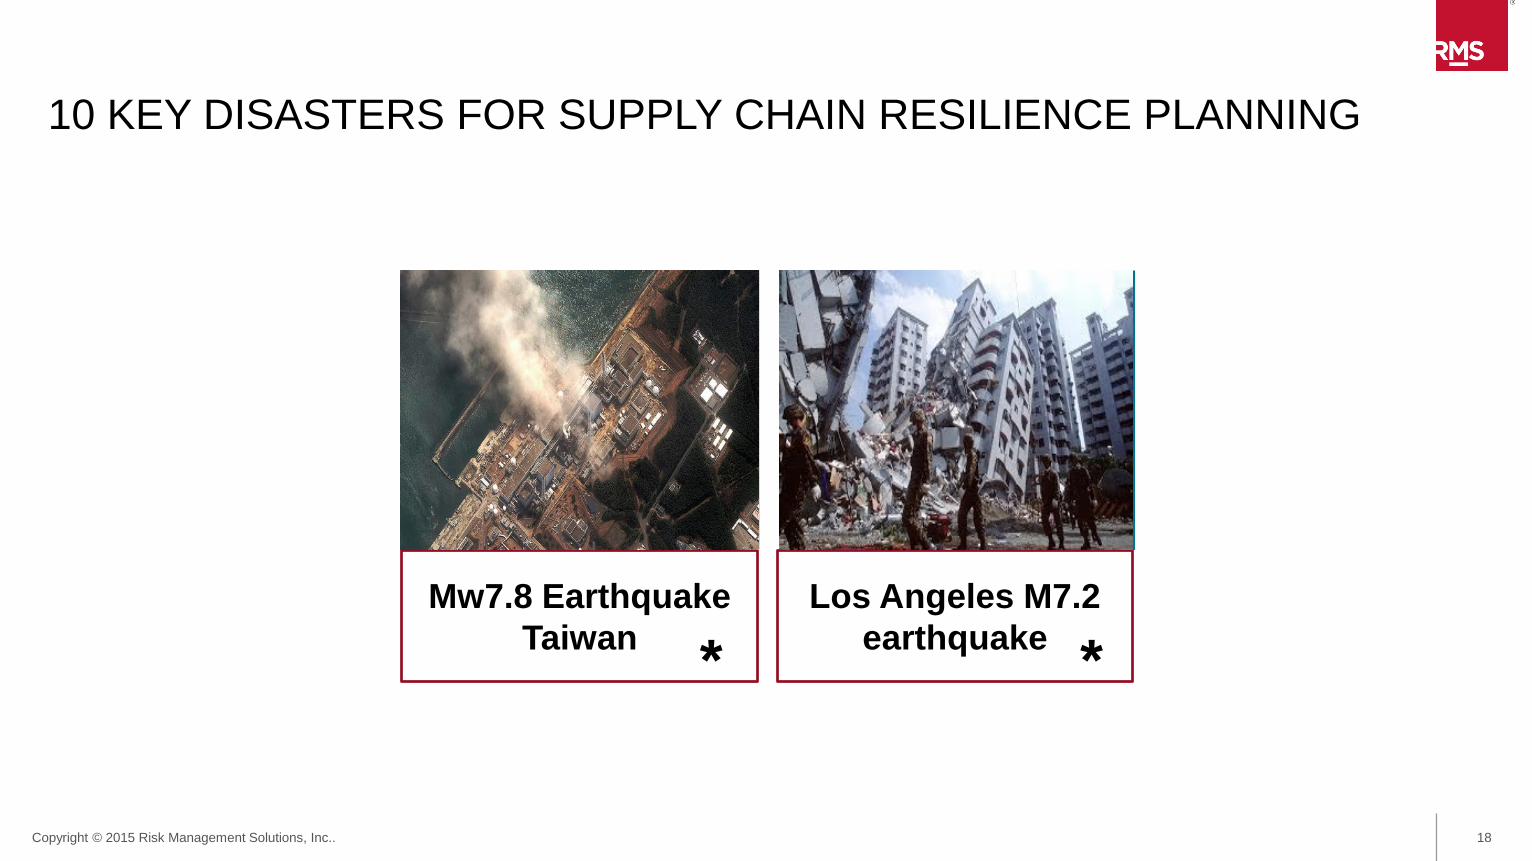
10 KEY DISASTERS FOR SUPPLY CHAIN RESILIENCE PLANNING
Mw7.8 Earthquake Taiwan
Los Angeles M7.2 earthquake **

19Copyright © 2015 Risk Management Solutions, Inc..
PORT TRANSPORT INTERRUPTIONS – TOP 12 EARTHQUAKE ‘RISK’ (PROBABILITY X CONSEQUENCE) LOCATIONS1. Nagoya
2. Yokohama*
3. Izmit
4. Oakland
5. Lazaro Cardenas
6. Chiba*
7. Los Angeles
8. Tokyo*
9. Seattle
10. Osaka@
11. Taichung
12. Kobe@ * / @ Potential to be hit by the same earthquake