Using Anion-Exchange Chromatography Coupled with High ......Using Anion-Exchange Chromatography...
3
Using Anion-Exchange Chromatography Coupled with High Resolution Accurate Mass Spectrometry for TCA Pathway Targeted Metabolomics Analysis Terri Christison, 1 Junhua Wang, 2 Shen S. Hu, 3 Linda Lopez, 1 Yingying Huang, 2 Carl Fisher 1 1 Thermo Fisher Scientific, Sunnyvale, CA, USA; 2 Thermo Fisher Scientific. San Jose, CA, USA; 3 UCLA Jonsson Comprehensive Cancer Center, UCLA School of Dentistry, Los Angeles, CA, USA Poster Note 71736 Overview Purpose: Demonstrate targeted metabolomics analysis of TCA metabolites using capillary and high throughput ion chromatography with a high resolution, accurate mass MS (HR/AM ). Methods: A highly sensitive platform was developed to determine anionic polar metabolites by coupling capillary and high throughput ion chromatography with high resolution accurate mass spectrometry. These methods provide separations of isobaric organic acids, sugar mono- and di-phosphates using a capillary format and a high throughput anion-exchange columns optimized for high resolution and efficient separations of organic acids using supermacroporous, 4-μm particle resin particles. The analytes were detected by an orbitrap mass spectrometer resulting in mass accuracy within 1 ppm and fmole on column sensitivity. Results: This method was applied to metabolomic profiling to identify biomarkers for oral squamous cell carcinoma (OSCC) metastasis, 3 paired OSCC cell lines (UM1, UM5, CSC) with wild-type controls. Cap IC demonstrated outstanding separation and peak shape for anionic polar metabolites with increased sensitivities >100-fold as compared to RPLC and HILIC methods. Differential analysis revealed significant changes in energy metabolism pathways, e.g., glycolysis cycle and tricarboxylic acid cycle. Introduction The metabolomics approach is of increasing interest to cancer researchers. However, many of these metabolites are small polar molecules which are isobaric and therefore require a separation method prior to MS analysis. RPLC is not suitable for small polar compounds and HILIC shows poor retention time stability and weak resolving power for biological samples. Therefore ion chromatography (IC), which was designed for the separation of small polar compounds, was selected. Here a new highly sensitive method was developed using the capillary format of IC (Cap IC) coupled with the Q Exactive mass spectrometer to profile biomarkers of oral squamous cell carcinoma (OSCC) metastasis from cell lysates. Methods Sample Preparation UMS1, UMS2, UMSCC5 and UMSCC6 head and neck cancer cells were cultured in Dulbecco’s modified eagle medium (DMEM) plus 10% fetal bovine serum, penicillin (100 U/mL), and streptomycin (100 μg/mL). The cells were maintained at 37 C in a humidified 5% CO 2 incubator and passaged when they reached 90–95% confluence. Cell number of representative samples were counted: UM1: 3.46 M, UM2: 2.88 M, UMSCC5: 2.88 M, MSCC6: 3.06 M/plate. Wild-type controls with biological replicates and three cancer lines (UMSCC1, UMSCC5, cancer stem-like cells (CSC)) were harvested and counted. Cellular metabolites were extracted using the liquid nitrogen snap-freezing method with methanol/water . Capillary Ion Chromatography System: Thermo Scientific Dionex ICS-4000 Capillary IC Column: Thermo Scientific ™ Dionex ™ IonPac ™ AS11HC-4μm, 0.4 250 mm KOH Gradient: Thermo Scientific Dionex EGC KOH capillary cartridge 2 mM (0–5 min), 2–13 mM (5–13.5 min); 13–20 mM (13.5– 22.5 min), 20–70 mM (22.5–31.5 min), 70 mM (31.5–37.5 min), 70–2 mM (0.1 min), 2 mM (37.6–45.1 min) Eluent Flow: 25 L/min Desalter: Thermo Scientific ™ Dionex ™ ACES ™ 300 Anion Capillary Electrolytic Suppressor, external water mode Solv. makeup: 2 mM acetic acid in methanol, 10 L/min Results FIGURE 1. Flow diagram of a HPIC-Q Exactive HF platform for targeted and non-targeted metabolomic analysis. High Throughput IC System: Thermo Scientific ™ Dionex ™ ICS-5000 + HPIC ™ (Figure 1) Column: Dionex IonPac AS11HC-4μm, 2 250 mm KOH Gradient: Dionex EGC 500 KOH cartridge 10 mM (-3–0.2 min), 10–85 mM (0.2–17 min); 85 mM (17– 19 min), 10 mM (19.1–20.0 min) Eluent Flow: 0.38 mL/min Desalter: Thermo Scientific ™ Dionex ™ AERS ™ 500 Anion Electrolytically Regenerated Suppressor, external water mode, 0.60 mL/min Solv. makeup: Methanol, 60 L/min Mass Spectrometry The high field Thermo Scientific ™ Q Exactive HF ™ quadrupole-Orbitrap mass spectrometer was operated under ESI negative mode. The resolution settings were 17,500 to 240,000. Full mass scan (m/z 67-1000) used resolution (120,000), automati gain control (AGC) target of 1x10 6 ions and a maximum ion injection time (IT) of 100 ms. Source ionization parameters were optimized with the spray voltage (3.5kV); transfer temp. (320 C); S-Lens level (50); heater temp. (325 C); Sheath gas (36); Aux gas (5). Software and Data Analysis The programming is managed by new interface software (Thermo Scientific ™ Standar Instrument Integration (SII)) for coupling Thermo Scientific ™ Xcalibur ™ and Thermo Scientific ™ Dionex ™ Chromeleon ™ Chromatography Data System, version 7.) Differential analysis of profiling data was performed using Thermo Scientific™ SIEVE 2.2. Targeted analysis of TCA compounds was performed using Thermo Scientific ™ Tracefinder ™ 3.2. Conductivity Detector EG IC Column Suppressor IC Pump 0.380 mL/min H2O Methanol Mixing Tee Waste AXP-MS Pump 0.060 mL/min HPIC Modular IC System Injection from Autosampler To assist desolvation Q Exactive HF Mass Spectrometer Dionex ICS-5000 + HPIC Modular IC System Grounding Union H2O AXP Pump 0.80 mL/min H2O/Analytes 0.380 mL/min Trap Guard 0.80 mL/min Degas
Transcript of Using Anion-Exchange Chromatography Coupled with High ......Using Anion-Exchange Chromatography...
Using Anion-Exchange Chromatography Coupled with High Resolution Accurate Mass Spectrometry for TCA Pathway Targeted Metabolomics AnalysisTerri Christison,1 Junhua Wang,2 Shen S. Hu,3 Linda Lopez,1 Yingying Huang,2 Carl Fisher1 1Thermo Fisher Scientific, Sunnyvale, CA, USA; 2Thermo Fisher Scientific. San Jose, CA, USA; 3UCLA Jonsson Comprehensive Cancer Center, UCLA School of Dentistry, Los Angeles, CA, USA
Po
ster No
te 71736
Using Anion-Exchange Chromatography Coupled with High Resolution Accurate Mass Spectrometry for TCA Pathway Targeted Metabolomics Analysis Terri Christison1, Junhua Wang2, Shen S. Hu3, Linda Lopez1, Yingying Huang2, Carl Fisher1
Thermo Fisher Scientific, 1Sunnyvale, CA, United States; 2San Jose, CA, USA; 3UCLA Jonsson Comprehensive Cancer Center, UCLA School of Dentistry, Los Angeles, CA, USA
Overview Purpose: Demonstrate targeted metabolomics analysis of TCA metabolites using capillary and high throughput ion chromatography with a high resolution, accurate mass MS (HR/AM ).
Methods: A highly sensitive platform was developed to determine anionic polar metabolites by coupling capillary and high throughput ion chromatography with high resolution accurate mass spectrometry. These methods provide separations of isobaric organic acids, sugar mono- and di-phosphates using a capillary format and a high throughput anion-exchange columns optimized for high resolution and efficient separations of organic acids using supermacroporous, 4-μm particle resin particles. The analytes were detected by an orbitrap mass spectrometer resulting in mass accuracy within 1 ppm and fmole on column sensitivity.
Results: This method was applied to metabolomic profiling to identify biomarkers for oral squamous cell carcinoma (OSCC) metastasis, 3 paired OSCC cell lines (UM1, UM5, CSC) with wild-type controls. Cap IC demonstrated outstanding separation and peak shape for anionic polar metabolites with increased sensitivities >100-fold as compared to RPLC and HILIC methods. Differential analysis revealed significant changes in energy metabolism pathways, e.g., glycolysis cycle and tricarboxylic acid cycle.
Introduction The metabolomics approach is of increasing interest to cancer researchers. However, many of these metabolites are small polar molecules which are isobaric and therefore require a separation method prior to MS analysis. RPLC is not suitable for small polar compounds and HILIC shows poor retention time stability and weak resolving power for biological samples. Therefore ion chromatography (IC), which was designed for the separation of small polar compounds, was selected. Here a new highly sensitive method was developed using the capillary format of IC (Cap IC) coupled with the Q Exactive mass spectrometer to profile biomarkers of oral squamous cell carcinoma (OSCC) metastasis from cell lysates.
Methods Sample Preparation UMS1, UMS2, UMSCC5 and UMSCC6 head and neck cancer cells were cultured in Dulbecco’s modified eagle medium (DMEM) plus 10% fetal bovine serum, penicillin (100 U/mL), and streptomycin (100 μg/mL). The cells were maintained at 37 C in a humidified 5% CO2 incubator and passaged when they reached 90–95% confluence. Cell number of representative samples were counted: UM1: 3.46 M, UM2: 2.88 M, UMSCC5: 2.88 M, MSCC6: 3.06 M/plate. Wild-type controls with biological replicates and three cancer lines (UMSCC1, UMSCC5, cancer stem-like cells (CSC)) were harvested and counted. Cellular metabolites were extracted using the liquid nitrogen snap-freezing method with methanol/water .
Capillary Ion Chromatography System: Thermo Scientific Dionex ICS-4000 Capillary IC
Column: Thermo Scientific™ Dionex™ IonPac™ AS11HC-4µm, 0.4 250 mm
KOH Gradient: Thermo Scientific Dionex EGC KOH capillary cartridge 2 mM (0–5 min), 2–13 mM (5–13.5 min); 13–20 mM (13.5–22.5 min), 20–70 mM (22.5–31.5 min), 70 mM (31.5–37.5 min), 70–2 mM (0.1 min), 2 mM (37.6–45.1 min)
Eluent Flow: 25 L/min
Desalter: Thermo Scientific™ Dionex™ ACES™ 300 Anion Capillary Electrolytic Suppressor, external water mode
Solv. makeup: 2 mM acetic acid in methanol, 10 L/min
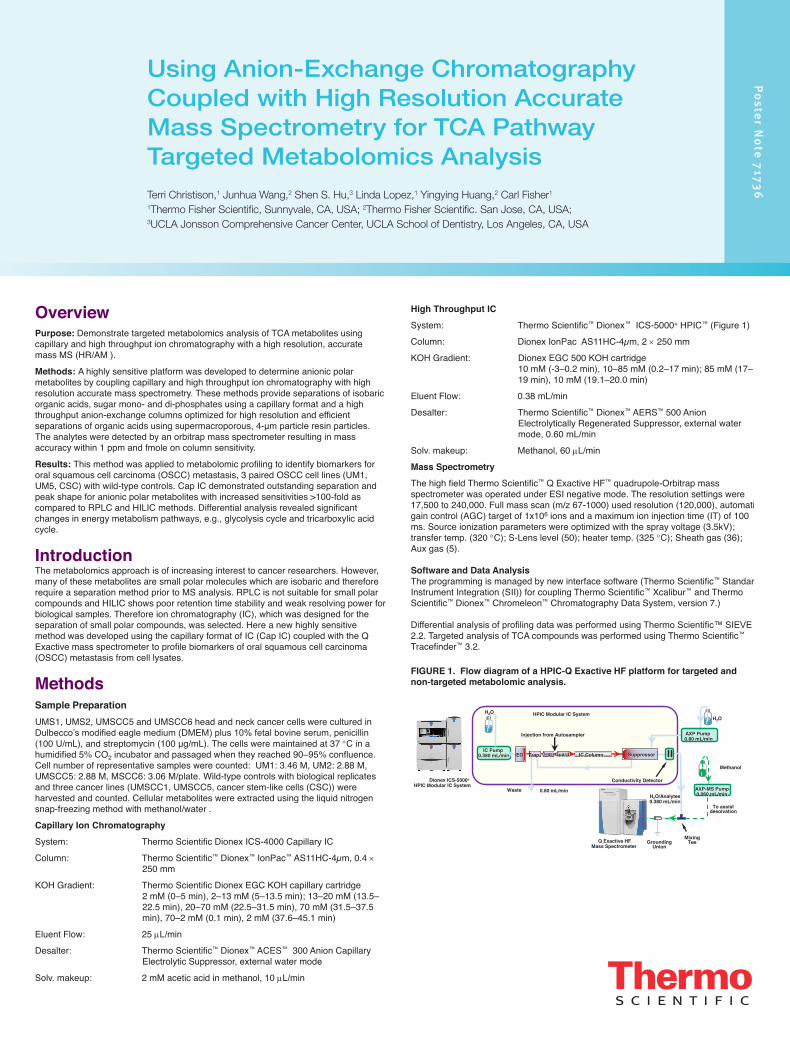
ResultsComparison of Cap IC- and HILIC-HR/AM The separation and response of twenty-one polar metabolites at 600 ppb were compared using Cap IC (green), HILIC (blue), UHLPC (not shown) with HR/AM mass spectrometer in full scan mode (Figure 2). See Reference 1 for HILIC conditions.
Cap IC-HR/AM showed better peak shape, higher response, and better resolution of isobaric compounds. The resolution was similar (not shown) at 60 ppt (10,000-fold less) with RT < 0.04 min. Separations and peak responses by UHPLC were poor, whereas separations for most metabolites were good with HILIC except for important isomeric compounds. In comparison, Cap IC had baseline resolution for sugar monophosphates (5, 6, 7), citrate isomers(13, 14), aconitate isomers (16, 17), and sugar diphosphates (18, 19) isomers.
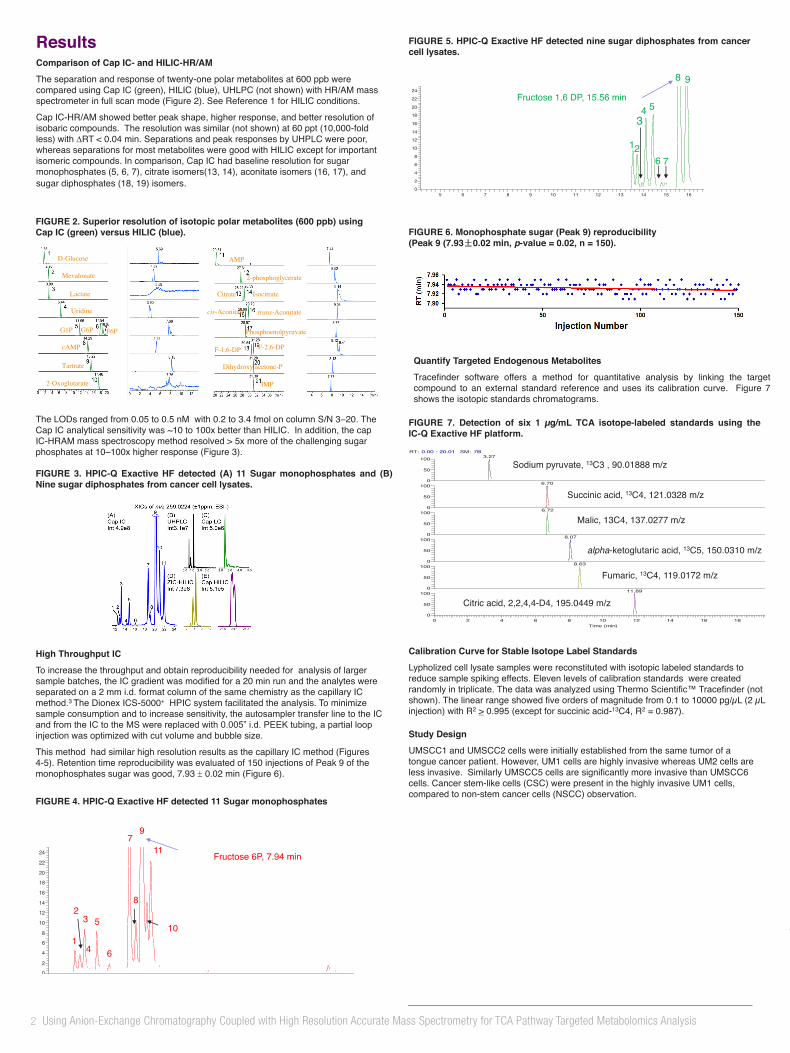
The LODs ranged from 0.05 to 0.5 nM with 0.2 to 3.4 fmol on column S/N 3–20. The Cap IC analytical sensitivity was ~10 to 100x better than HILIC. In addition, the cap IC-HRAM mass spectroscopy method resolved > 5x more of the challenging sugar phosphates at 10–100x higher response (Figure 3).
©2015 Thermo Fisher Scientific Inc. All rights reserved. All trademarks are the property of Thermo FisherScientific and its subsidiaries unless otherwise specified. This information is not intended to encourage use of these products in any manner that might infringe the intellectual property rights of others.
FIGURE 1. Flow diagram of a HPIC-Q Exactive HF platform for targeted and non-targeted metabolomic analysis.
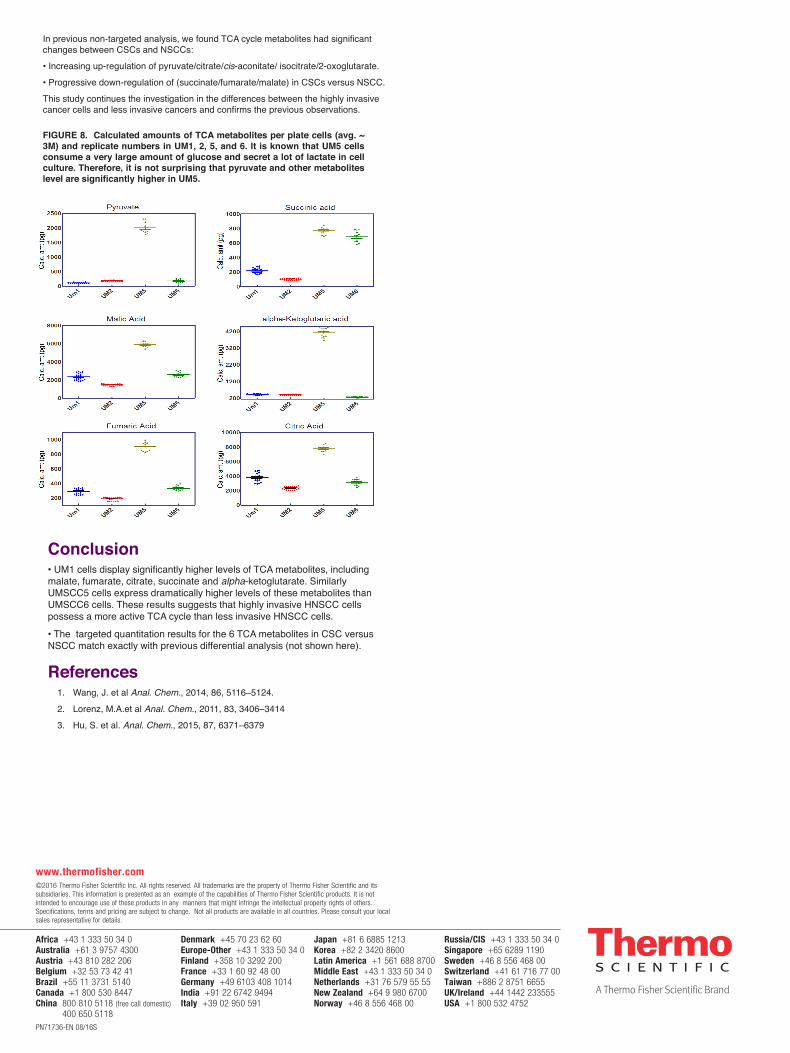
In previous non-targeted analysis, we found TCA cycle metabolites had significant changes between CSCs and NSCCs:
• Increasing up-regulation of pyruvate/citrate/cis-aconitate/ isocitrate/2-oxoglutarate.
• Progressive down-regulation of (succinate/fumarate/malate) in CSCs versus NSCC.
This study continues the investigation in the differences between the highly invasivecancer cells and less invasive cancers and confirms the previous observations.
High Throughput ICSystem: Thermo Scientific™ Dionex™ ICS-5000+ HPIC™ (Figure 1)
Column: Dionex IonPac AS11HC-4µm, 2 250 mm
KOH Gradient: Dionex EGC 500 KOH cartridge10 mM (-3–0.2 min), 10–85 mM (0.2–17 min); 85 mM (17–19 min), 10 mM (19.1–20.0 min)
Eluent Flow: 0.38 mL/min
Desalter: Thermo Scientific™ Dionex™ AERS™ 500 Anion Electrolytically Regenerated Suppressor, external water mode, 0.60 mL/min
Solv. makeup: Methanol, 60 L/min
Mass SpectrometryThe high field Thermo Scientific™ Q Exactive HF™ quadrupole-Orbitrap mass spectrometer was operated under ESI negative mode. The resolution settings were 17,500 to 240,000. Full mass scan (m/z 67-1000) used resolution (120,000), automatic gain control (AGC) target of 1x10⁶ ions and a maximum ion injection time (IT) of 100 ms. Source ionization parameters were optimized with the spray voltage (3.5kV); transfer temp. (320 C); S-Lens level (50); heater temp. (325 C); Sheath gas (36); Aux gas (5).
Software and Data Analysis The programming is managed by new interface software (Thermo Scientific™ Standard Instrument Integration (SII)) for coupling Thermo Scientific™ Xcalibur™ and ThermoScientific™ Dionex™ Chromeleon™ Chromatography Data System, version 7.)
Differential analysis of profiling data was performed using Thermo Scientific™ SIEVE 2.2. Targeted analysis of TCA compounds was performed using Thermo Scientific™
Tracefinder™ 3.2.
Study DesignUMSCC1 and UMSCC2 cells were initially established from the same tumor of atongue cancer patient. However, UM1 cells are highly invasive whereas UM2 cells are less invasive. Similarly UMSCC5 cells are significantly more invasive than UMSCC6cells. Cancer stem-like cells (CSC) were present in the highly invasive UM1 cells, compared to non-stem cancer cells (NSCC) observation.
Conductivity Detector
EG IC Column SuppressorIC Pump
0.380 mL/min
H2O
Methanol
Mixing Tee
Waste AXP-MS Pump0.060 mL/min
HPIC Modular IC System
Injection from Autosampler
To assist desolvation
Q Exactive HFMass Spectrometer
Dionex ICS-5000+
HPIC Modular IC System
Grounding Union
H2O
AXP Pump0.80 mL/min
H2O/Analytes0.380 mL/min
Trap Guard
0.80 mL/min
Degas
RT: 4.11 - 16.79 SM: 7G
5 6 7 8 9 10 11 12 13 14 15 160
2
4
6
8
10
12
14
16
18
20
22
24
0
2
4
6
8
10
12
14
16
18
20
22
24
NL:1.82E7m/z= 259.0196-259.0248 MS50ppb_isotopes_512_UM1E-2
NL:1.37E7m/z= 338.9854-338.9922 MS50ppb_isotopes_512_UM1E-2
Fructose 6P, 7.94 min
1
23
4
5
6
7
8
10
11
RT: 4.11 - 16.79 SM: 7G
5 6 7 8 9 10 11 12 13 14 15 160
2
4
6
8
10
12
14
16
18
20
22
24
0
2
4
6
8
10
12
14
16
18
20
22
24
NL:1.82E7m/z= 259.0196-259.0248 MS50ppb_isotopes_512_UM1E-2
NL:1.37E7m/z= 338.9854-338.9922 MS50ppb_isotopes_512_UM1E-2
Fructose 1,6 DP, 15.56 min
12
3
6
54
7
8 9
FIGURE 8. Calculated amounts of TCA metabolites per plate cells (avg. ~3M) and replicate numbers in UM1, 2, 5, and 6. It is known that UM5 cellsconsume a very large amount of glucose and secret a lot of lactate in cellculture. Therefore, it is not surprising that pyruvate and other metaboliteslevel are significantly higher in UM5.
Quantify Targeted Endogenous MetabolitesTracefinder software offers a method for quantitative analysis by linking the targetcompound to an external standard reference and uses its calibration curve. Figure 7shows the isotopic standards chromatograms.
FIGURE 3. HPIC-Q Exactive HF detected (A) 11 Sugar monophosphates and (B)Nine sugar diphosphates from cancer cell lysates.
High Throughput ICTo increase the throughput and obtain reproducibility needed for analysis of larger sample batches, the IC gradient was modified for a 20 min run and the analytes were separated on a 2 mm i.d. format column of the same chemistry as the capillary IC method.3 The Dionex ICS-5000+ HPIC system facilitated the analysis. To minimize sample consumption and to increase sensitivity, the autosampler transfer line to the IC and from the IC to the MS were replaced with 0.005” i.d. PEEK tubing, a partial loop injection was optimized with cut volume and bubble size.
This method had similar high resolution results as the capillary IC method (Figures 4-5). Retention time reproducibility was evaluated of 150 injections of Peak 9 of the monophosphates sugar was good, 7.93 0.02 min (Figure 6).
FIGURE 7. Detection of six 1 µg/mL TCA isotope-labeled standards using theIC-Q Exactive HF platform.
Calibration Curve for Stable Isotope Label StandardsLypholized cell lysate samples were reconstituted with isotopic labeled standards to reduce sample spiking effects. Eleven levels of calibration standards were created randomly in triplicate. The data was analyzed using Thermo Scientific™ Tracefinder (not shown). The linear range showed five orders of magnitude from 0.1 to 10000 pg/µL (2 µLinjection) with R2 > 0.995 (except for succinic acid-13C4, R2 = 0.987).
FIGURE 6. Monophosphate sugar (Peak 9) reproducibility(Peak 9 (7.93±0.02 min, p-value = 0.02, n = 150).
RT: 0.00 - 20.01 SM: 7B
0 2 4 6 8 10 12 14 16 18 20Time (min)
0
50
1000
50
1000
50
1000
50
100
Relati
ve Ab
undanc
e 0
50
1000
50
100 3.27
6.70
6.72
8.07
8.63
11.89
NL: 1.03E8m/z= 90.0183-90.0193 F: FTMS - p ESI Full ms [67.00-1000.00] MS1ppm_isotopes_512_UM1B-3
NL: 1.55E8m/z= 121.0322-121.0334 F: FTMS - p ESI Full ms [67.00-1000.00] MS1ppm_isotopes_512_UM1B-3
NL: 1.56E8m/z= 137.0270-137.0284 F: FTMS - p ESI Full ms [67.00-1000.00] MS1ppm_isotopes_512_UM1B-3
NL: 1.38E8m/z= 150.0302-150.0318 F: FTMS - p ESI Full ms [67.00-1000.00] MS1ppm_isotopes_512_UM1B-3
NL: 1.42E8m/z= 119.0166-119.0178 F: FTMS - p ESI Full ms [67.00-1000.00] MS1ppm_isotopes_512_UM1B-3
NL: 1.12E8m/z= 195.0439-195.0459 F: FTMS - p ESI Full ms [67.00-1000.00] MS1ppm_isotopes_512_UM1B-3
Sodium pyruvate, 13C3 , 90.01888 m/z
Succinic acid, 13C4, 121.0328 m/z
Malic, 13C4, 137.0277 m/z
alpha-ketoglutaric acid, 13C5, 150.0310 m/z
Fumaric, 13C4, 119.0172 m/z
Citric acid, 2,2,4,4-D4, 195.0449 m/z
D-Glucose
Mevalonate
Lactate
Uridine
G6PG1P
cAMP
Tartrate
2-Oxoglutarate
F6P
AMP
2-phosphoglycerate
Citrate Isocitrate
cis-Aconitate trans-Aconitate
Phosphoenolpyruvate
F-1,6-DP F-2,6-DP
Dihydroxy acetone-P
IMP
FIGURE 2. Superior resolution of isotopic polar metabolites (600 ppb) using Cap IC (green) versus HILIC (blue).
FIGURE 4. HPIC-Q Exactive HF detected 11 Sugar monophosphates
FIGURE 5. HPIC-Q Exactive HF detected nine sugar diphosphates from cancercell lysates.
9
Conclusion• UM1 cells display significantly higher levels of TCA metabolites, including malate, fumarate, citrate, succinate and alpha-ketoglutarate. SimilarlyUMSCC5 cells express dramatically higher levels of these metabolites than UMSCC6 cells. These results suggests that highly invasive HNSCC cellspossess a more active TCA cycle than less invasive HNSCC cells.
• The targeted quantitation results for the 6 TCA metabolites in CSC versusNSCC match exactly with previous differential analysis (not shown here).
References1. Wang, J. et al Anal. Chem., 2014, 86, 5116–5124.
2. Lorenz, M.A.et al Anal. Chem., 2011, 83, 3406–3414
3. Hu, S. et al. Anal. Chem., 2015, 87, 6371–6379
PO71736-EN 0815S
Using Anion-Exchange Chromatography Coupled with High Resolution Accurate Mass Spectrometry for TCA Pathway Targeted Metabolomics Analysis Terri Christison1, Junhua Wang2, Shen S. Hu3, Linda Lopez1, Yingying Huang2, Carl Fisher1
Thermo Fisher Scientific, 1Sunnyvale, CA, United States; 2San Jose, CA, USA; 3UCLA Jonsson Comprehensive Cancer Center, UCLA School of Dentistry, Los Angeles, CA, USA
OverviewPurpose: Demonstrate targeted metabolomics analysis of TCA metabolites using capillary and high throughput ion chromatography with a high resolution, accurate mass MS (HR/AM ).
Methods: A highly sensitive platform was developed to determine anionic polar metabolites by coupling capillary and high throughput ion chromatography with highresolution accurate mass spectrometry. These methods provide separations of isobaric organic acids, sugar mono- and di-phosphates using a capillary format and a high throughput anion-exchange columns optimized for high resolution and efficientseparations of organic acids using supermacroporous, 4-μm particle resin particles. The analytes were detected by an orbitrap mass spectrometer resulting in mass accuracy within 1 ppm and fmole on column sensitivity.
Results: This method was applied to metabolomic profiling to identify biomarkers for oral squamous cell carcinoma (OSCC) metastasis, 3 paired OSCC cell lines (UM1, UM5, CSC) with wild-type controls. Cap IC demonstrated outstanding separation and peak shape for anionic polar metabolites with increased sensitivities >100-fold ascompared to RPLC and HILIC methods. Differential analysis revealed significant changes in energy metabolism pathways, e.g., glycolysis cycle and tricarboxylic acid cycle.
IntroductionThe metabolomics approach is of increasing interest to cancer researchers. However, many of these metabolites are small polar molecules which are isobaric and therefore require a separation method prior to MS analysis. RPLC is not suitable for small polar compounds and HILIC shows poor retention time stability and weak resolving power for biological samples. Therefore ion chromatography (IC), which was designed for theseparation of small polar compounds, was selected. Here a new highly sensitivemethod was developed using the capillary format of IC (Cap IC) coupled with the Q Exactive mass spectrometer to profile biomarkers of oral squamous cell carcinoma (OSCC) metastasis from cell lysates.
MethodsSample PreparationUMS1, UMS2, UMSCC5 and UMSCC6 head and neck cancer cells were cultured in Dulbecco’s modified eagle medium (DMEM) plus 10% fetal bovine serum, penicillin (100 U/mL), and streptomycin (100 μg/mL). The cells were maintained at 37 C in a humidified 5% CO2 incubator and passaged when they reached 90–95% confluence. Cell number of representative samples were counted: UM1: 3.46 M, UM2: 2.88 M, UMSCC5: 2.88 M, MSCC6: 3.06 M/plate. Wild-type controls with biological replicates and three cancer lines (UMSCC1, UMSCC5, cancer stem-like cells (CSC)) were harvested and counted. Cellular metabolites were extracted using the liquid nitrogen snap-freezing method with methanol/water .
Capillary Ion ChromatographySystem: Thermo Scientific Dionex ICS-4000 Capillary IC
Column: Thermo Scientific™ Dionex™ IonPac™ AS11HC-4µm, 0.4 250 mm
KOH Gradient: Thermo Scientific Dionex EGC KOH capillary cartridge2 mM (0–5 min), 2–13 mM (5–13.5 min); 13–20 mM (13.5–22.5 min), 20–70 mM (22.5–31.5 min), 70 mM (31.5–37.5 min), 70–2 mM (0.1 min), 2 mM (37.6–45.1 min)
Eluent Flow: 25 L/min
Desalter: Thermo Scientific™ Dionex™ ACES™ 300 Anion Capillary Electrolytic Suppressor, external water mode
Solv. makeup: 2 mM acetic acid in methanol, 10 L/min
Results Comparison of Cap IC- and HILIC-HR/AM The separation and response of twenty-one polar metabolites at 600 ppb were compared using Cap IC (green), HILIC (blue), UHLPC (not shown) with HR/AM mass spectrometer in full scan mode (Figure 2). See Reference 1 for HILIC conditions.
Cap IC-HR/AM showed better peak shape, higher response, and better resolution of isobaric compounds. The resolution was similar (not shown) at 60 ppt (10,000-fold less) with RT < 0.04 min. Separations and peak responses by UHPLC were poor, whereas separations for most metabolites were good with HILIC except for important isomeric compounds. In comparison, Cap IC had baseline resolution for sugar monophosphates (5, 6, 7), citrate isomers(13, 14), aconitate isomers (16, 17), and sugar diphosphates (18, 19) isomers.
The LODs ranged from 0.05 to 0.5 nM with 0.2 to 3.4 fmol on column S/N 3–20. The Cap IC analytical sensitivity was ~10 to 100x better than HILIC. In addition, the cap IC-HRAM mass spectroscopy method resolved > 5x more of the challenging sugar phosphates at 10–100x higher response (Figure 3).
©2015 Thermo Fisher Scientific Inc. All rights reserved. All trademarks are the property of Thermo FisherScientific and its subsidiaries unless otherwise specified. This information is not intended to encourage use of these products in any manner that might infringe the intellectual property rights of others.
FIGURE 1. Flow diagram of a HPIC-Q Exactive HF platform for targeted and non-targeted metabolomic analysis.
In previous non-targeted analysis, we found TCA cycle metabolites had significant changes between CSCs and NSCCs:
• Increasing up-regulation of pyruvate/citrate/cis-aconitate/ isocitrate/2-oxoglutarate.
• Progressive down-regulation of (succinate/fumarate/malate) in CSCs versus NSCC.
This study continues the investigation in the differences between the highly invasivecancer cells and less invasive cancers and confirms the previous observations.
High Throughput IC System: Thermo Scientific™ Dionex™ ICS-5000+ HPIC™ (Figure 1)
Column: Dionex IonPac AS11HC-4µm, 2 250 mm
KOH Gradient: Dionex EGC 500 KOH cartridge 10 mM (-3–0.2 min), 10–85 mM (0.2–17 min); 85 mM (17–19 min), 10 mM (19.1–20.0 min)
Eluent Flow: 0.38 mL/min
Desalter: Thermo Scientific™ Dionex™ AERS™ 500 Anion Electrolytically Regenerated Suppressor, external water mode, 0.60 mL/min
Solv. makeup: Methanol, 60 L/min
Mass Spectrometry The high field Thermo Scientific™ Q Exactive HF™ quadrupole-Orbitrap mass spectrometer was operated under ESI negative mode. The resolution settings were 17,500 to 240,000. Full mass scan (m/z 67-1000) used resolution (120,000), automatic gain control (AGC) target of 1x10⁶ ions and a maximum ion injection time (IT) of 100 ms. Source ionization parameters were optimized with the spray voltage (3.5kV); transfer temp. (320 C); S-Lens level (50); heater temp. (325 C); Sheath gas (36); Aux gas (5).
Software and Data Analysis The programming is managed by new interface software (Thermo Scientific™ Standard Instrument Integration (SII)) for coupling Thermo Scientific™ Xcalibur™ and Thermo Scientific™ Dionex™ Chromeleon™ Chromatography Data System, version 7.)
Differential analysis of profiling data was performed using Thermo Scientific™ SIEVE 2.2. Targeted analysis of TCA compounds was performed using Thermo Scientific™ Tracefinder™ 3.2.
Study DesignUMSCC1 and UMSCC2 cells were initially established from the same tumor of atongue cancer patient. However, UM1 cells are highly invasive whereas UM2 cells are less invasive. Similarly UMSCC5 cells are significantly more invasive than UMSCC6cells. Cancer stem-like cells (CSC) were present in the highly invasive UM1 cells, compared to non-stem cancer cells (NSCC) observation.
Conductivity Detector
EG IC Column Suppressor IC Pump
0.380 mL/min
H2O
Methanol
Mixing Tee
Waste AXP-MS Pump 0.060 mL/min
HPIC Modular IC System
Injection from Autosampler
To assist desolvation
Q Exactive HF Mass Spectrometer
Dionex ICS-5000+ HPIC Modular IC System
Grounding Union
H2O
AXP Pump 0.80 mL/min
H2O/Analytes 0.380 mL/min
Trap Guard
0.80 mL/min
Degas
RT: 4.11 - 16.79 SM: 7G
5 6 7 8 9 10 11 12 13 14 15 160
2
4
6
8
10
12
14
16
18
20
22
24
0
2
4
6
8
10
12
14
16
18
20
22
24
NL:1.82E7m/z= 259.0196-259.0248 MS50ppb_isotopes_512_UM1E-2
NL:1.37E7m/z= 338.9854-338.9922 MS50ppb_isotopes_512_UM1E-2
Fructose 6P, 7.94 min
1
23
4
5
6
7
8
10
11
RT: 4.11 - 16.79 SM: 7G
5 6 7 8 9 10 11 12 13 14 15 160
2
4
6
8
10
12
14
16
18
20
22
24
0
2
4
6
8
10
12
14
16
18
20
22
24
NL:1.82E7m/z= 259.0196-259.0248 MS50ppb_isotopes_512_UM1E-2
NL:1.37E7m/z= 338.9854-338.9922 MS50ppb_isotopes_512_UM1E-2
Fructose 1,6 DP, 15.56 min
12
3
6
54
7
8 9
FIGURE 8. Calculated amounts of TCA metabolites per plate cells (avg. ~3M) and replicate numbers in UM1, 2, 5, and 6. It is known that UM5 cellsconsume a very large amount of glucose and secret a lot of lactate in cellculture. Therefore, it is not surprising that pyruvate and other metaboliteslevel are significantly higher in UM5.
Quantify Targeted Endogenous MetabolitesTracefinder software offers a method for quantitative analysis by linking the targetcompound to an external standard reference and uses its calibration curve. Figure 7shows the isotopic standards chromatograms.
FIGURE 3. HPIC-Q Exactive HF detected (A) 11 Sugar monophosphates and (B)Nine sugar diphosphates from cancer cell lysates.
High Throughput ICTo increase the throughput and obtain reproducibility needed for analysis of larger sample batches, the IC gradient was modified for a 20 min run and the analytes were separated on a 2 mm i.d. format column of the same chemistry as the capillary IC method.3 The Dionex ICS-5000+ HPIC system facilitated the analysis. To minimize sample consumption and to increase sensitivity, the autosampler transfer line to the IC and from the IC to the MS were replaced with 0.005” i.d. PEEK tubing, a partial loop injection was optimized with cut volume and bubble size.
This method had similar high resolution results as the capillary IC method (Figures 4-5). Retention time reproducibility was evaluated of 150 injections of Peak 9 of the monophosphates sugar was good, 7.93 0.02 min (Figure 6).
FIGURE 7. Detection of six 1 µg/mL TCA isotope-labeled standards using theIC-Q Exactive HF platform.
Calibration Curve for Stable Isotope Label StandardsLypholized cell lysate samples were reconstituted with isotopic labeled standards to reduce sample spiking effects. Eleven levels of calibration standards were created randomly in triplicate. The data was analyzed using Thermo Scientific™ Tracefinder (not shown). The linear range showed five orders of magnitude from 0.1 to 10000 pg/µL (2 µLinjection) with R2 > 0.995 (except for succinic acid-13C4, R2 = 0.987).
FIGURE 6. Monophosphate sugar (Peak 9) reproducibility(Peak 9 (7.93±0.02 min, p-value = 0.02, n = 150).
RT: 0.00 - 20.01 SM: 7B
0 2 4 6 8 10 12 14 16 18 20Time (min)
0
50
1000
50
1000
50
1000
50
100
Relati
ve Ab
undanc
e 0
50
1000
50
100 3.27
6.70
6.72
8.07
8.63
11.89
NL: 1.03E8m/z= 90.0183-90.0193 F: FTMS - p ESI Full ms [67.00-1000.00] MS1ppm_isotopes_512_UM1B-3
NL: 1.55E8m/z= 121.0322-121.0334 F: FTMS - p ESI Full ms [67.00-1000.00] MS1ppm_isotopes_512_UM1B-3
NL: 1.56E8m/z= 137.0270-137.0284 F: FTMS - p ESI Full ms [67.00-1000.00] MS1ppm_isotopes_512_UM1B-3
NL: 1.38E8m/z= 150.0302-150.0318 F: FTMS - p ESI Full ms [67.00-1000.00] MS1ppm_isotopes_512_UM1B-3
NL: 1.42E8m/z= 119.0166-119.0178 F: FTMS - p ESI Full ms [67.00-1000.00] MS1ppm_isotopes_512_UM1B-3
NL: 1.12E8m/z= 195.0439-195.0459 F: FTMS - p ESI Full ms [67.00-1000.00] MS1ppm_isotopes_512_UM1B-3
Sodium pyruvate, 13C3 , 90.01888 m/z
Succinic acid, 13C4, 121.0328 m/z
Malic, 13C4, 137.0277 m/z
alpha-ketoglutaric acid, 13C5, 150.0310 m/z
Fumaric, 13C4, 119.0172 m/z
Citric acid, 2,2,4,4-D4, 195.0449 m/z
D-Glucose
Mevalonate
Lactate
Uridine
G6PG1P
cAMP
Tartrate
2-Oxoglutarate
F6P
AMP
2-phosphoglycerate
Citrate Isocitrate
cis-Aconitate trans-Aconitate
Phosphoenolpyruvate
F-1,6-DP F-2,6-DP
Dihydroxy acetone-P
IMP
FIGURE 2. Superior resolution of isotopic polar metabolites (600 ppb) using Cap IC (green) versus HILIC (blue).
FIGURE 4. HPIC-Q Exactive HF detected 11 Sugar monophosphates
FIGURE 5. HPIC-Q Exactive HF detected nine sugar diphosphates from cancercell lysates.
9
Conclusion• UM1 cells display significantly higher levels of TCA metabolites, including malate, fumarate, citrate, succinate and alpha-ketoglutarate. SimilarlyUMSCC5 cells express dramatically higher levels of these metabolites than UMSCC6 cells. These results suggests that highly invasive HNSCC cellspossess a more active TCA cycle than less invasive HNSCC cells.
• The targeted quantitation results for the 6 TCA metabolites in CSC versusNSCC match exactly with previous differential analysis (not shown here).
References1. Wang, J. et al Anal. Chem., 2014, 86, 5116–5124.
2. Lorenz, M.A.et al Anal. Chem., 2011, 83, 3406–3414
3. Hu, S. et al. Anal. Chem., 2015, 87, 6371–6379
PO71736-EN 0815S
2 Using Anion-Exchange Chromatography Coupled with High Resolution Accurate Mass Spectrometry for TCA Pathway Targeted Metabolomics Analysis
Using Anion-Exchange Chromatography Coupled with High Resolution Accurate Mass Spectrometry for TCA Pathway Targeted Metabolomics Analysis Terri Christison1, Junhua Wang2, Shen S. Hu3, Linda Lopez1, Yingying Huang2, Carl Fisher1 Thermo Fisher Scientific, 1Sunnyvale, CA, United States; 2San Jose, CA, USA; 3UCLA Jonsson Comprehensive Cancer Center, UCLA School of Dentistry, Los Angeles, CA, USA
Overview Purpose: Demonstrate targeted metabolomics analysis of TCA metabolites using capillary and high throughput ion chromatography with a high resolution, accurate mass MS (HR/AM ).
Methods: A highly sensitive platform was developed to determine anionic polar metabolites by coupling capillary and high throughput ion chromatography with high resolution accurate mass spectrometry. These methods provide separations of isobaric organic acids, sugar mono- and di-phosphates using a capillary format and a high throughput anion-exchange columns optimized for high resolution and efficient separations of organic acids using supermacroporous, 4-μm particle resin particles. The analytes were detected by an orbitrap mass spectrometer resulting in mass accuracy within 1 ppm and fmole on column sensitivity.
Results: This method was applied to metabolomic profiling to identify biomarkers for oral squamous cell carcinoma (OSCC) metastasis, 3 paired OSCC cell lines (UM1, UM5, CSC) with wild-type controls. Cap IC demonstrated outstanding separation and peak shape for anionic polar metabolites with increased sensitivities >100-fold as compared to RPLC and HILIC methods. Differential analysis revealed significant changes in energy metabolism pathways, e.g., glycolysis cycle and tricarboxylic acid cycle.
Introduction The metabolomics approach is of increasing interest to cancer researchers. However, many of these metabolites are small polar molecules which are isobaric and therefore require a separation method prior to MS analysis. RPLC is not suitable for small polar compounds and HILIC shows poor retention time stability and weak resolving power for biological samples. Therefore ion chromatography (IC), which was designed for the separation of small polar compounds, was selected. Here a new highly sensitive method was developed using the capillary format of IC (Cap IC) coupled with the Q Exactive mass spectrometer to profile biomarkers of oral squamous cell carcinoma (OSCC) metastasis from cell lysates.
Methods Sample Preparation UMS1, UMS2, UMSCC5 and UMSCC6 head and neck cancer cells were cultured in Dulbecco’s modified eagle medium (DMEM) plus 10% fetal bovine serum, penicillin (100 U/mL), and streptomycin (100 μg/mL). The cells were maintained at 37 C in a humidified 5% CO2 incubator and passaged when they reached 90–95% confluence. Cell number of representative samples were counted: UM1: 3.46 M, UM2: 2.88 M, UMSCC5: 2.88 M, MSCC6: 3.06 M/plate. Wild-type controls with biological replicates and three cancer lines (UMSCC1, UMSCC5, cancer stem-like cells (CSC)) were harvested and counted. Cellular metabolites were extracted using the liquid nitrogen snap-freezing method with methanol/water .
Capillary Ion Chromatography System: Thermo Scientific Dionex ICS-4000 Capillary IC
Column: Thermo Scientific™ Dionex™ IonPac™ AS11HC-4µm, 0.4 250 mm
KOH Gradient: Thermo Scientific Dionex EGC KOH capillary cartridge 2 mM (0–5 min), 2–13 mM (5–13.5 min); 13–20 mM (13.5–22.5 min), 20–70 mM (22.5–31.5 min), 70 mM (31.5–37.5 min), 70–2 mM (0.1 min), 2 mM (37.6–45.1 min)
Eluent Flow: 25 L/min
Desalter: Thermo Scientific™ Dionex™ ACES™ 300 Anion Capillary Electrolytic Suppressor, external water mode
Solv. makeup: 2 mM acetic acid in methanol, 10 L/min
Results Comparison of Cap IC- and HILIC-HR/AM The separation and response of twenty-one polar metabolites at 600 ppb were compared using Cap IC (green), HILIC (blue), UHLPC (not shown) with HR/AM mass spectrometer in full scan mode (Figure 2). See Reference 1 for HILIC conditions.
Cap IC-HR/AM showed better peak shape, higher response, and better resolution of isobaric compounds. The resolution was similar (not shown) at 60 ppt (10,000-fold less) with RT < 0.04 min. Separations and peak responses by UHPLC were poor, whereas separations for most metabolites were good with HILIC except for important isomeric compounds. In comparison, Cap IC had baseline resolution for sugar monophosphates (5, 6, 7), citrate isomers(13, 14), aconitate isomers (16, 17), and sugar diphosphates (18, 19) isomers.
The LODs ranged from 0.05 to 0.5 nM with 0.2 to 3.4 fmol on column S/N 3–20. The Cap IC analytical sensitivity was ~10 to 100x better than HILIC. In addition, the cap IC-HRAM mass spectroscopy method resolved > 5x more of the challenging sugar phosphates at 10–100x higher response (Figure 3).
©2015 Thermo Fisher Scientific Inc. All rights reserved. All trademarks are the property of Thermo Fisher Scientific and its subsidiaries unless otherwise specified. This information is not intended to encourage use of these products in any manner that might infringe the intellectual property rights of others.
FIGURE 1. Flow diagram of a HPIC-Q Exactive HF platform for targeted and non-targeted metabolomic analysis.
In previous non-targeted analysis, we found TCA cycle metabolites had significant changes between CSCs and NSCCs:
• Increasing up-regulation of pyruvate/citrate/cis-aconitate/ isocitrate/2-oxoglutarate.
• Progressive down-regulation of (succinate/fumarate/malate) in CSCs versus NSCC.
This study continues the investigation in the differences between the highly invasive cancer cells and less invasive cancers and confirms the previous observations.
High Throughput IC System: Thermo Scientific™ Dionex™ ICS-5000+ HPIC™ (Figure 1)
Column: Dionex IonPac AS11HC-4µm, 2 250 mm
KOH Gradient: Dionex EGC 500 KOH cartridge 10 mM (-3–0.2 min), 10–85 mM (0.2–17 min); 85 mM (17–19 min), 10 mM (19.1–20.0 min)
Eluent Flow: 0.38 mL/min
Desalter: Thermo Scientific™ Dionex™ AERS™ 500 Anion Electrolytically Regenerated Suppressor, external water mode, 0.60 mL/min
Solv. makeup: Methanol, 60 L/min
Mass Spectrometry The high field Thermo Scientific™ Q Exactive HF™ quadrupole-Orbitrap mass spectrometer was operated under ESI negative mode. The resolution settings were 17,500 to 240,000. Full mass scan (m/z 67-1000) used resolution (120,000), automatic gain control (AGC) target of 1x10⁶ ions and a maximum ion injection time (IT) of 100 ms. Source ionization parameters were optimized with the spray voltage (3.5kV); transfer temp. (320 C); S-Lens level (50); heater temp. (325 C); Sheath gas (36); Aux gas (5). Software and Data Analysis The programming is managed by new interface software (Thermo Scientific™ Standard Instrument Integration (SII)) for coupling Thermo Scientific™ Xcalibur™ and Thermo Scientific™ Dionex™ Chromeleon™ Chromatography Data System, version 7.) Differential analysis of profiling data was performed using Thermo Scientific™ SIEVE 2.2. Targeted analysis of TCA compounds was performed using Thermo Scientific™ Tracefinder™ 3.2.
Study Design UMSCC1 and UMSCC2 cells were initially established from the same tumor of a tongue cancer patient. However, UM1 cells are highly invasive whereas UM2 cells are less invasive. Similarly UMSCC5 cells are significantly more invasive than UMSCC6 cells. Cancer stem-like cells (CSC) were present in the highly invasive UM1 cells, compared to non-stem cancer cells (NSCC) observation.
Conductivity Detector
EG IC Column Suppressor IC Pump
0.380 mL/min
H2O
Methanol
Mixing Tee
Waste AXP-MS Pump 0.060 mL/min
HPIC Modular IC System
Injection from Autosampler
To assist desolvation
Q Exactive HF Mass Spectrometer
Dionex ICS-5000+ HPIC Modular IC System
Grounding Union
H2O
AXP Pump 0.80 mL/min
H2O/Analytes 0.380 mL/min
Trap Guard
0.80 mL/min
Degas
RT: 4.11 - 16.79 SM: 7G
5 6 7 8 9 10 11 12 13 14 15 160
2
4
6
8
10
12
14
16
18
20
22
24
0
2
4
6
8
10
12
14
16
18
20
22
24
NL:1.82E7m/z= 259.0196-259.0248 MS 50ppb_isotopes_512_UM1E-2
NL:1.37E7m/z= 338.9854-338.9922 MS 50ppb_isotopes_512_UM1E-2
Fructose 6P, 7.94 min
1
2 3
4
5
6
7
8
10
11
RT: 4.11 - 16.79 SM: 7G
5 6 7 8 9 10 11 12 13 14 15 160
2
4
6
8
10
12
14
16
18
20
22
24
0
2
4
6
8
10
12
14
16
18
20
22
24
NL:1.82E7m/z= 259.0196-259.0248 MS 50ppb_isotopes_512_UM1E-2
NL:1.37E7m/z= 338.9854-338.9922 MS 50ppb_isotopes_512_UM1E-2
Fructose 1,6 DP, 15.56 min
1 2
3
6
5 4
7
8 9
FIGURE 8. Calculated amounts of TCA metabolites per plate cells (avg. ~ 3M) and replicate numbers in UM1, 2, 5, and 6. It is known that UM5 cells consume a very large amount of glucose and secret a lot of lactate in cell culture. Therefore, it is not surprising that pyruvate and other metabolites level are significantly higher in UM5.
Quantify Targeted Endogenous Metabolites Tracefinder software offers a method for quantitative analysis by linking the target compound to an external standard reference and uses its calibration curve. Figure 7 shows the isotopic standards chromatograms.
FIGURE 3. HPIC-Q Exactive HF detected (A) 11 Sugar monophosphates and (B) Nine sugar diphosphates from cancer cell lysates.
High Throughput IC To increase the throughput and obtain reproducibility needed for analysis of larger sample batches, the IC gradient was modified for a 20 min run and the analytes were separated on a 2 mm i.d. format column of the same chemistry as the capillary IC method.3 The Dionex ICS-5000+ HPIC system facilitated the analysis. To minimize sample consumption and to increase sensitivity, the autosampler transfer line to the IC and from the IC to the MS were replaced with 0.005” i.d. PEEK tubing, a partial loop injection was optimized with cut volume and bubble size.
This method had similar high resolution results as the capillary IC method (Figures 4-5). Retention time reproducibility was evaluated of 150 injections of Peak 9 of the monophosphates sugar was good, 7.93 0.02 min (Figure 6).
FIGURE 7. Detection of six 1 µg/mL TCA isotope-labeled standards using the IC-Q Exactive HF platform.
Calibration Curve for Stable Isotope Label Standards Lypholized cell lysate samples were reconstituted with isotopic labeled standards to reduce sample spiking effects. Eleven levels of calibration standards were created randomly in triplicate. The data was analyzed using Thermo Scientific™ Tracefinder (not shown). The linear range showed five orders of magnitude from 0.1 to 10000 pg/µL (2 µL injection) with R2 > 0.995 (except for succinic acid-13C4, R2 = 0.987).
FIGURE 6. Monophosphate sugar (Peak 9) reproducibility (Peak 9 (7.93±0.02 min, p-value = 0.02, n = 150).
RT: 0.00 - 20.01 SM: 7B
0 2 4 6 8 10 12 14 16 18 20Time (min)
0
50
1000
50
1000
50
1000
50
100
Relati
ve Ab
undanc
e 0
50
1000
50
100 3.27
6.70
6.72
8.07
8.63
11.89
NL: 1.03E8m/z= 90.0183-90.0193 F: FTMS - p ESI Full ms [67.00-1000.00] MS 1ppm_isotopes_512_UM1B-3
NL: 1.55E8m/z= 121.0322-121.0334 F: FTMS - p ESI Full ms [67.00-1000.00] MS 1ppm_isotopes_512_UM1B-3
NL: 1.56E8m/z= 137.0270-137.0284 F: FTMS - p ESI Full ms [67.00-1000.00] MS 1ppm_isotopes_512_UM1B-3
NL: 1.38E8m/z= 150.0302-150.0318 F: FTMS - p ESI Full ms [67.00-1000.00] MS 1ppm_isotopes_512_UM1B-3
NL: 1.42E8m/z= 119.0166-119.0178 F: FTMS - p ESI Full ms [67.00-1000.00] MS 1ppm_isotopes_512_UM1B-3
NL: 1.12E8m/z= 195.0439-195.0459 F: FTMS - p ESI Full ms [67.00-1000.00] MS 1ppm_isotopes_512_UM1B-3
Sodium pyruvate, 13C3 , 90.01888 m/z
Succinic acid, 13C4, 121.0328 m/z
Malic, 13C4, 137.0277 m/z
alpha-ketoglutaric acid, 13C5, 150.0310 m/z
Fumaric, 13C4, 119.0172 m/z
Citric acid, 2,2,4,4-D4, 195.0449 m/z
D-Glucose
Mevalonate
Lactate
Uridine
G6P G1P
cAMP
Tartrate
2-Oxoglutarate
F6P
AMP
2-phosphoglycerate
Citrate Isocitrate
cis-Aconitate trans-Aconitate
Phosphoenolpyruvate
F-1,6-DP F-2,6-DP
Dihydroxy acetone-P
IMP
FIGURE 2. Superior resolution of isotopic polar metabolites (600 ppb) using Cap IC (green) versus HILIC (blue).
FIGURE 4. HPIC-Q Exactive HF detected 11 Sugar monophosphates
FIGURE 5. HPIC-Q Exactive HF detected nine sugar diphosphates from cancer cell lysates.
9
Conclusion • UM1 cells display significantly higher levels of TCA metabolites, including malate, fumarate, citrate, succinate and alpha-ketoglutarate. Similarly UMSCC5 cells express dramatically higher levels of these metabolites than UMSCC6 cells. These results suggests that highly invasive HNSCC cells possess a more active TCA cycle than less invasive HNSCC cells.
• The targeted quantitation results for the 6 TCA metabolites in CSC versus NSCC match exactly with previous differential analysis (not shown here).
References 1. Wang, J. et al Anal. Chem., 2014, 86, 5116–5124.
2. Lorenz, M.A.et al Anal. Chem., 2011, 83, 3406–3414
3. Hu, S. et al. Anal. Chem., 2015, 87, 6371–6379
PO71736-EN 0815S
PN71736-EN 08/16S
Using Anion-Exchange Chromatography Coupled with High Resolution Accurate Mass Spectrometry for TCA Pathway Targeted Metabolomics Analysis Terri Christison1, Junhua Wang2, Shen S. Hu3, Linda Lopez1, Yingying Huang2, Carl Fisher1
Thermo Fisher Scientific, 1Sunnyvale, CA, United States; 2San Jose, CA, USA; 3UCLA Jonsson Comprehensive Cancer Center, UCLA School of Dentistry, Los Angeles, CA, USA
OverviewPurpose: Demonstrate targeted metabolomics analysis of TCA metabolites using capillary and high throughput ion chromatography with a high resolution, accurate mass MS (HR/AM ).
Methods: A highly sensitive platform was developed to determine anionic polar metabolites by coupling capillary and high throughput ion chromatography with highresolution accurate mass spectrometry. These methods provide separations of isobaric organic acids, sugar mono- and di-phosphates using a capillary format and a high throughput anion-exchange columns optimized for high resolution and efficientseparations of organic acids using supermacroporous, 4-μm particle resin particles. The analytes were detected by an orbitrap mass spectrometer resulting in mass accuracy within 1 ppm and fmole on column sensitivity.
Results: This method was applied to metabolomic profiling to identify biomarkers for oral squamous cell carcinoma (OSCC) metastasis, 3 paired OSCC cell lines (UM1, UM5, CSC) with wild-type controls. Cap IC demonstrated outstanding separation and peak shape for anionic polar metabolites with increased sensitivities >100-fold ascompared to RPLC and HILIC methods. Differential analysis revealed significant changes in energy metabolism pathways, e.g., glycolysis cycle and tricarboxylic acid cycle.
IntroductionThe metabolomics approach is of increasing interest to cancer researchers. However, many of these metabolites are small polar molecules which are isobaric and therefore require a separation method prior to MS analysis. RPLC is not suitable for small polar compounds and HILIC shows poor retention time stability and weak resolving power for biological samples. Therefore ion chromatography (IC), which was designed for theseparation of small polar compounds, was selected. Here a new highly sensitivemethod was developed using the capillary format of IC (Cap IC) coupled with the Q Exactive mass spectrometer to profile biomarkers of oral squamous cell carcinoma (OSCC) metastasis from cell lysates.
MethodsSample PreparationUMS1, UMS2, UMSCC5 and UMSCC6 head and neck cancer cells were cultured in Dulbecco’s modified eagle medium (DMEM) plus 10% fetal bovine serum, penicillin (100 U/mL), and streptomycin (100 μg/mL). The cells were maintained at 37 C in a humidified 5% CO2 incubator and passaged when they reached 90–95% confluence. Cell number of representative samples were counted: UM1: 3.46 M, UM2: 2.88 M, UMSCC5: 2.88 M, MSCC6: 3.06 M/plate. Wild-type controls with biological replicates and three cancer lines (UMSCC1, UMSCC5, cancer stem-like cells (CSC)) were harvested and counted. Cellular metabolites were extracted using the liquid nitrogen snap-freezing method with methanol/water .
Capillary Ion ChromatographySystem: Thermo Scientific Dionex ICS-4000 Capillary IC
Column: Thermo Scientific™ Dionex™ IonPac™ AS11HC-4µm, 0.4 250 mm
KOH Gradient: Thermo Scientific Dionex EGC KOH capillary cartridge2 mM (0–5 min), 2–13 mM (5–13.5 min); 13–20 mM (13.5–22.5 min), 20–70 mM (22.5–31.5 min), 70 mM (31.5–37.5 min), 70–2 mM (0.1 min), 2 mM (37.6–45.1 min)
Eluent Flow: 25 L/min
Desalter: Thermo Scientific™ Dionex™ ACES™ 300 Anion Capillary Electrolytic Suppressor, external water mode
Solv. makeup: 2 mM acetic acid in methanol, 10 L/min
ResultsComparison of Cap IC- and HILIC-HR/AM The separation and response of twenty-one polar metabolites at 600 ppb were compared using Cap IC (green), HILIC (blue), UHLPC (not shown) with HR/AM mass spectrometer in full scan mode (Figure 2). See Reference 1 for HILIC conditions.
Cap IC-HR/AM showed better peak shape, higher response, and better resolution of isobaric compounds. The resolution was similar (not shown) at 60 ppt (10,000-fold less) with RT < 0.04 min. Separations and peak responses by UHPLC were poor, whereas separations for most metabolites were good with HILIC except for important isomeric compounds. In comparison, Cap IC had baseline resolution for sugar monophosphates (5, 6, 7), citrate isomers(13, 14), aconitate isomers (16, 17), and sugar diphosphates (18, 19) isomers.
The LODs ranged from 0.05 to 0.5 nM with 0.2 to 3.4 fmol on column S/N 3–20. The Cap IC analytical sensitivity was ~10 to 100x better than HILIC. In addition, the cap IC-HRAM mass spectroscopy method resolved > 5x more of the challenging sugar phosphates at 10–100x higher response (Figure 3).
©2015 Thermo Fisher Scientific Inc. All rights reserved. All trademarks are the property of Thermo FisherScientific and its subsidiaries unless otherwise specified. This information is not intended to encourage use of these products in any manner that might infringe the intellectual property rights of others.
FIGURE 1. Flow diagram of a HPIC-Q Exactive HF platform for targeted and non-targeted metabolomic analysis.
In previous non-targeted analysis, we found TCA cycle metabolites had significant changes between CSCs and NSCCs:
• Increasing up-regulation of pyruvate/citrate/cis-aconitate/ isocitrate/2-oxoglutarate.
• Progressive down-regulation of (succinate/fumarate/malate) in CSCs versus NSCC.
This study continues the investigation in the differences between the highly invasive cancer cells and less invasive cancers and confirms the previous observations.
High Throughput ICSystem: Thermo Scientific™ Dionex™ ICS-5000+ HPIC™ (Figure 1)
Column: Dionex IonPac AS11HC-4µm, 2 250 mm
KOH Gradient: Dionex EGC 500 KOH cartridge10 mM (-3–0.2 min), 10–85 mM (0.2–17 min); 85 mM (17–19 min), 10 mM (19.1–20.0 min)
Eluent Flow: 0.38 mL/min
Desalter: Thermo Scientific™ Dionex™ AERS™ 500 Anion Electrolytically Regenerated Suppressor, external water mode, 0.60 mL/min
Solv. makeup: Methanol, 60 L/min
Mass SpectrometryThe high field Thermo Scientific™ Q Exactive HF™ quadrupole-Orbitrap mass spectrometer was operated under ESI negative mode. The resolution settings were 17,500 to 240,000. Full mass scan (m/z 67-1000) used resolution (120,000), automatic gain control (AGC) target of 1x10⁶ ions and a maximum ion injection time (IT) of 100 ms. Source ionization parameters were optimized with the spray voltage (3.5kV); transfer temp. (320 C); S-Lens level (50); heater temp. (325 C); Sheath gas (36); Aux gas (5).
Software and Data Analysis The programming is managed by new interface software (Thermo Scientific™ Standard Instrument Integration (SII)) for coupling Thermo Scientific™ Xcalibur™ and ThermoScientific™ Dionex™ Chromeleon™ Chromatography Data System, version 7.)
Differential analysis of profiling data was performed using Thermo Scientific™ SIEVE 2.2. Targeted analysis of TCA compounds was performed using Thermo Scientific™
Tracefinder™ 3.2.
Study DesignUMSCC1 and UMSCC2 cells were initially established from the same tumor of atongue cancer patient. However, UM1 cells are highly invasive whereas UM2 cells are less invasive. Similarly UMSCC5 cells are significantly more invasive than UMSCC6cells. Cancer stem-like cells (CSC) were present in the highly invasive UM1 cells, compared to non-stem cancer cells (NSCC) observation.
Conductivity Detector
EG IC Column SuppressorIC Pump
0.380 mL/min
H2O
Methanol
Mixing Tee
Waste AXP-MS Pump0.060 mL/min
HPIC Modular IC System
Injection from Autosampler
To assist desolvation
Q Exactive HFMass Spectrometer
Dionex ICS-5000+
HPIC Modular IC System
Grounding Union
H2O
AXP Pump0.80 mL/min
H2O/Analytes0.380 mL/min
Trap Guard
0.80 mL/min
Degas
RT: 4.11 - 16.79 SM: 7G
5 6 7 8 9 10 11 12 13 14 15 160
2
4
6
8
10
12
14
16
18
20
22
24
0
2
4
6
8
10
12
14
16
18
20
22
24
NL:1.82E7m/z= 259.0196-259.0248 MS50ppb_isotopes_512_UM1E-2
NL:1.37E7m/z= 338.9854-338.9922 MS50ppb_isotopes_512_UM1E-2
Fructose 6P, 7.94 min
1
23
4
5
6
7
8
10
11
RT: 4.11 - 16.79 SM: 7G
5 6 7 8 9 10 11 12 13 14 15 160
2
4
6
8
10
12
14
16
18
20
22
24
0
2
4
6
8
10
12
14
16
18
20
22
24
NL:1.82E7m/z= 259.0196-259.0248 MS50ppb_isotopes_512_UM1E-2
NL:1.37E7m/z= 338.9854-338.9922 MS50ppb_isotopes_512_UM1E-2
Fructose 1,6 DP, 15.56 min
12
3
6
54
7
8 9
FIGURE 8. Calculated amounts of TCA metabolites per plate cells (avg. ~ 3M) and replicate numbers in UM1, 2, 5, and 6. It is known that UM5 cells consume a very large amount of glucose and secret a lot of lactate in cell culture. Therefore, it is not surprising that pyruvate and other metabolites level are significantly higher in UM5.
Quantify Targeted Endogenous MetabolitesTracefinder software offers a method for quantitative analysis by linking the targetcompound to an external standard reference and uses its calibration curve. Figure 7shows the isotopic standards chromatograms.
FIGURE 3. HPIC-Q Exactive HF detected (A) 11 Sugar monophosphates and (B)Nine sugar diphosphates from cancer cell lysates.
High Throughput ICTo increase the throughput and obtain reproducibility needed for analysis of larger sample batches, the IC gradient was modified for a 20 min run and the analytes were separated on a 2 mm i.d. format column of the same chemistry as the capillary IC method.3 The Dionex ICS-5000+ HPIC system facilitated the analysis. To minimize sample consumption and to increase sensitivity, the autosampler transfer line to the IC and from the IC to the MS were replaced with 0.005” i.d. PEEK tubing, a partial loop injection was optimized with cut volume and bubble size.
This method had similar high resolution results as the capillary IC method (Figures 4-5). Retention time reproducibility was evaluated of 150 injections of Peak 9 of the monophosphates sugar was good, 7.93 0.02 min (Figure 6).
FIGURE 7. Detection of six 1 µg/mL TCA isotope-labeled standards using theIC-Q Exactive HF platform.
Calibration Curve for Stable Isotope Label StandardsLypholized cell lysate samples were reconstituted with isotopic labeled standards to reduce sample spiking effects. Eleven levels of calibration standards were created randomly in triplicate. The data was analyzed using Thermo Scientific™ Tracefinder (not shown). The linear range showed five orders of magnitude from 0.1 to 10000 pg/µL (2 µLinjection) with R2 > 0.995 (except for succinic acid-13C4, R2 = 0.987).
FIGURE 6. Monophosphate sugar (Peak 9) reproducibility(Peak 9 (7.93±0.02 min, p-value = 0.02, n = 150).
RT: 0.00 - 20.01 SM: 7B
0 2 4 6 8 10 12 14 16 18 20Time (min)
0
50
1000
50
1000
50
1000
50
100
Relati
ve Ab
undanc
e 0
50
1000
50
100 3.27
6.70
6.72
8.07
8.63
11.89
NL: 1.03E8m/z= 90.0183-90.0193 F: FTMS - p ESI Full ms [67.00-1000.00] MS1ppm_isotopes_512_UM1B-3
NL: 1.55E8m/z= 121.0322-121.0334 F: FTMS - p ESI Full ms [67.00-1000.00] MS1ppm_isotopes_512_UM1B-3
NL: 1.56E8m/z= 137.0270-137.0284 F: FTMS - p ESI Full ms [67.00-1000.00] MS1ppm_isotopes_512_UM1B-3
NL: 1.38E8m/z= 150.0302-150.0318 F: FTMS - p ESI Full ms [67.00-1000.00] MS1ppm_isotopes_512_UM1B-3
NL: 1.42E8m/z= 119.0166-119.0178 F: FTMS - p ESI Full ms [67.00-1000.00] MS1ppm_isotopes_512_UM1B-3
NL: 1.12E8m/z= 195.0439-195.0459 F: FTMS - p ESI Full ms [67.00-1000.00] MS1ppm_isotopes_512_UM1B-3
Sodium pyruvate, 13C3 , 90.01888 m/z
Succinic acid, 13C4, 121.0328 m/z
Malic, 13C4, 137.0277 m/z
alpha-ketoglutaric acid, 13C5, 150.0310 m/z
Fumaric, 13C4, 119.0172 m/z
Citric acid, 2,2,4,4-D4, 195.0449 m/z
D-Glucose
Mevalonate
Lactate
Uridine
G6PG1P
cAMP
Tartrate
2-Oxoglutarate
F6P
AMP
2-phosphoglycerate
Citrate Isocitrate
cis-Aconitate trans-Aconitate
Phosphoenolpyruvate
F-1,6-DP F-2,6-DP
Dihydroxy acetone-P
IMP
FIGURE 2. Superior resolution of isotopic polar metabolites (600 ppb) using Cap IC (green) versus HILIC (blue).
FIGURE 4. HPIC-Q Exactive HF detected 11 Sugar monophosphates
FIGURE 5. HPIC-Q Exactive HF detected nine sugar diphosphates from cancercell lysates.
9
Conclusion • UM1 cells display significantly higher levels of TCA metabolites, including malate, fumarate, citrate, succinate and alpha-ketoglutarate. Similarly UMSCC5 cells express dramatically higher levels of these metabolites than UMSCC6 cells. These results suggests that highly invasive HNSCC cells possess a more active TCA cycle than less invasive HNSCC cells.
• The targeted quantitation results for the 6 TCA metabolites in CSC versusNSCC match exactly with previous differential analysis (not shown here).
References 1. Wang, J. et al Anal. Chem., 2014, 86, 5116–5124.
2. Lorenz, M.A.et al Anal. Chem., 2011, 83, 3406–3414
3. Hu, S. et al. Anal. Chem., 2015, 87, 6371–6379
PO71736-EN 0815S
Africa +43 1 333 50 34 0Australia +61 3 9757 4300Austria +43 810 282 206Belgium +32 53 73 42 41Brazil +55 11 3731 5140Canada +1 800 530 8447China 800 810 5118 (free call domestic)
400 650 5118
Denmark +45 70 23 62 60Europe-Other +43 1 333 50 34 0Finland +358 10 3292 200France +33 1 60 92 48 00Germany +49 6103 408 1014India +91 22 6742 9494Italy +39 02 950 591
Japan +81 6 6885 1213Korea +82 2 3420 8600Latin America +1 561 688 8700Middle East +43 1 333 50 34 0Netherlands +31 76 579 55 55 New Zealand +64 9 980 6700 Norway +46 8 556 468 00
Russia/CIS +43 1 333 50 34 0Singapore +65 6289 1190Sweden +46 8 556 468 00 Switzerland +41 61 716 77 00Taiwan +886 2 8751 6655UK/Ireland +44 1442 233555USA +1 800 532 4752
www.thermofisher.com©2016 Thermo Fisher Scientific Inc. All rights reserved. All trademarks are the property of Thermo Fisher Scientific and its subsidiaries. This information is presented as an example of the capabilities of Thermo Fisher Scientific products. It is not intended to encourage use of these products in any manners that might infringe the intellectual property rights of others. Specifications, terms and pricing are subject to change. Not all products are available in all countries. Please consult your local sales representative for details.