Using analytics to maximize reimbursement€™s Revenue Intellect Solution; a vendor agnostic,...
23
What am I leaving on the table? Using analytics to maximize reimbursement 2015 HFMA Region 5 Dixie Institute February 19, 2015
Transcript of Using analytics to maximize reimbursement€™s Revenue Intellect Solution; a vendor agnostic,...

What am I leaving on the table?
Using analytics to maximize reimbursement 2015 HFMA Region 5 Dixie Institute
February 19, 2015
2 Copyright © 2015 Deloitte Development LLC. All rights reserved.
1
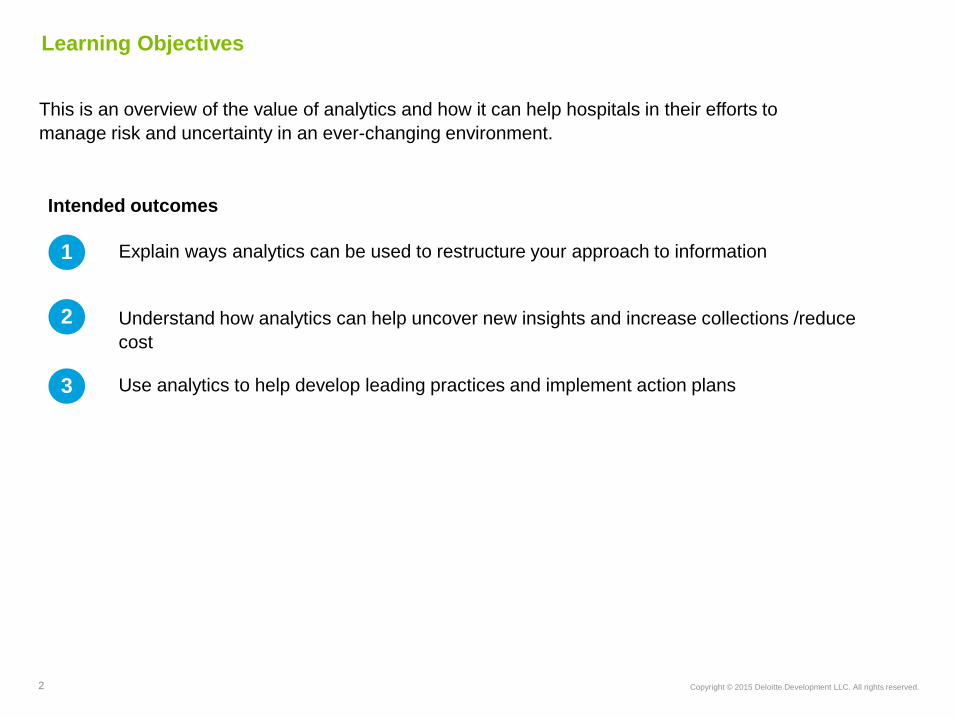
This is an overview of the value of analytics and how it can help hospitals in their efforts to manage risk and uncertainty in an ever-changing environment.
Explain ways analytics can be used to restructure your approach to information
2 Understand how analytics can help uncover new insights and increase collections /reduce cost
3 Use analytics to help develop leading practices and implement action plans
Intended outcomes
Learning Objectives
3 Copyright © 2015 Deloitte Development LLC. All rights reserved.
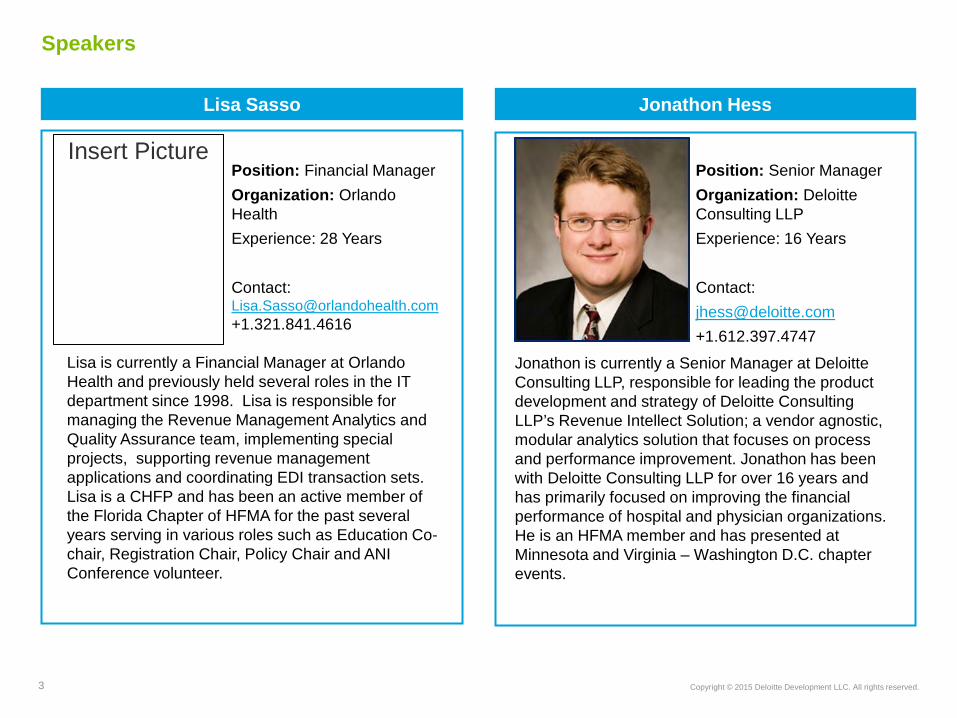
Lisa Sasso Jonathon Hess
Insert Picture
Position: Senior Manager Organization: Deloitte Consulting LLP Experience: 16 Years Contact: [email protected] +1.612.397.4747
Jonathon is currently a Senior Manager at Deloitte Consulting LLP, responsible for leading the product development and strategy of Deloitte Consulting LLP’s Revenue Intellect Solution; a vendor agnostic, modular analytics solution that focuses on process and performance improvement. Jonathon has been with Deloitte Consulting LLP for over 16 years and has primarily focused on improving the financial performance of hospital and physician organizations. He is an HFMA member and has presented at Minnesota and Virginia – Washington D.C. chapter events.
Position: Financial Manager Organization: Orlando Health Experience: 28 Years Contact: [email protected]+1.321.841.4616
Lisa is currently a Financial Manager at Orlando Health and previously held several roles in the IT department since 1998. Lisa is responsible for managing the Revenue Management Analytics and Quality Assurance team, implementing special projects, supporting revenue management applications and coordinating EDI transaction sets. Lisa is a CHFP and has been an active member of the Florida Chapter of HFMA for the past several years serving in various roles such as Education Co-chair, Registration Chair, Policy Chair and ANI Conference volunteer.
Speakers

4 Copyright © 2015 Deloitte Development LLC. All rights reserved.
Analytics Analytics can help organizations – and healthcare providers are no different - pull pertinent information from each of these frameworks to help them make strategic decisions
HealthCare Providers Providers are not immune to the uncertainty that exists in these frameworks and face unique challenges within each
• Macroeconomic environment • Employment • Inflation
Economic Landscape 1
Risk & Uncertainty
• Leadership changes • Regulation changes • Incentives / Penalties
Government & Regulation 2
• Age / Gender / Ethnicity • Population volume • Education • Preferences
Demographics 3
• Industry size, growth • Players / Position • Disruptions
Market Competition 4
Companies and organizations are often charged with managing uncertainty and risk with limited information
• Patient coverage and employment • NHEA and rising out of pocket healthcare costs
• Credit outlook for industry2
Economic Impact 1
• Affordable Care Act • ICD-10 • CMS programs • Quality Care versus Fee4Service
Government Impact 2
• Birth rates and aging population • Medicare & Medicaid • Coverage volume by area
Demographic Impact 3
• Innovation • M&A activity3
• Industry Consolidation4
• Non-traditional service platforms
Market Impact 4
Organizations face risk and uncertainty

5 Copyright © 2015 Deloitte Development LLC. All rights reserved.
Find the right information to drive business decisions
• The information you have is not the information you want
• The information you want is not the information you need
• The information you need is not the information you can obtain
• The information you can obtain costs more than you want to pay
1
2
3
4
6 billion
mobile phones 1.75 Billion1 smartphones
Common Data Complaints2
How do providers determine what information matters from what they have access to?
60 billion1 intelligent devices
Number of information bits in the world has exceeded the number of stars1
in the universe
Amazon & Google know more about our daily activity, sleeping and consumption habits than our physicians do…
The quantity of information and data can make it difficult to drive quality insights
(1) Deloitte Research Tools “Data Center – Digital Universe” Computer World Data Center Study. January 2014 (2) Bernstein, Peter Against the Gods: The Remarkable Story of Risk Jon Wiley & Sons, 1996.

6 Copyright © 2015 Deloitte Development LLC. All rights reserved.
Traditional business intelligence can only get us so far
Standard insights on historical performance are limited by process and time constraints and involve many stakeholders
Report published with desktop
access
Hindsight &
Insight
Business Intelligence
Business Question
1 2
3
4
5
Report Request
Report Enters Queue
5
4
3
2
1 Business Owner
Reporting Leadership
Report Writer
Business Owner
Traditional Business Process

7 Copyright © 2015 Deloitte Development LLC. All rights reserved.
5 4 3 2
Analytics provides another level of understanding
Individual business owners can uncover new insights, prioritize attention and drive action with analytics
Analytics provides more insight than traditional business metrics and provides foresight into issues before they occur
Share insights efficiently through mobile access and report production and take action now
5
Answer business questions immediately with only a few clicks to drive action
Share insights instantly through mobile access and report production and take action now
to a broader range of data allows users to ask and answer new questions
Business Owner
1
Analytics
Develop new insights to focus attention on issues before they arise to help build foresight
Business Question
Instant Access
Fast Answers
Share Insights
Build Foresight
Team
VP Rev Cycle
CFO
Share Insights

8 Copyright © 2015 Deloitte Development LLC. All rights reserved.
Patient Access Charge Integrity Patient Financial Services Tracking accounts by facility can only get us so far
Registration
Traditional approaches can allow for basic profiling but do not always lead to strongest action possible
490
497
974 405
279
394
266
RidgeRockCascadeSummitBasinValleyCrest Action
• Cascade Hospital has the most accounts
• Areas with largest account volumes might lead to insights
Traditional Business Intelligence
(in Thousands)
Patient Access
Accounts by Facility
Insight
• Investigate key issue areas for potential causes of top issue areas
• Begin to work focused accounts
An analytical based approach can improve revenue cycle performance

9 Copyright © 2015 Deloitte Development LLC. All rights reserved.
Patient Access Charge Integrity Patient Financial Services Using analytics to solve business questions can enable managers to pull new insights about rev cycle
Registration
In an attempt to cut registration costs, a provider decentralized its registrars. A closer look at the denial rates for registrar IDs uncovered some unintended consequences of that decision
Action
• More is better: the more registration per user, the lower the denial rate per user
• The higher denial rate for staff who did less than 20 denials a week, cost this organizations $7.2M in registration write-offs
Analytics
Patient Access
Insight
Increase average registrations per week per user to build experience and promote consistency
Consider impact on reimbursement for both cost and revenue strategies
0%
10%
20%
30%
40%
50%
60%
70%
80%
90%
100%
0 1,000 2,000 3,000 4,000 5,000 6,000 7,000
Average: 11%
Denials by Registrar ID Volume1
An analytical based approach can improve revenue cycle performance
(1) Aggregate data from Deloitte Consulting’s Revenue Intellect™ application
10 Copyright © 2015 Deloitte Development LLC. All rights reserved.
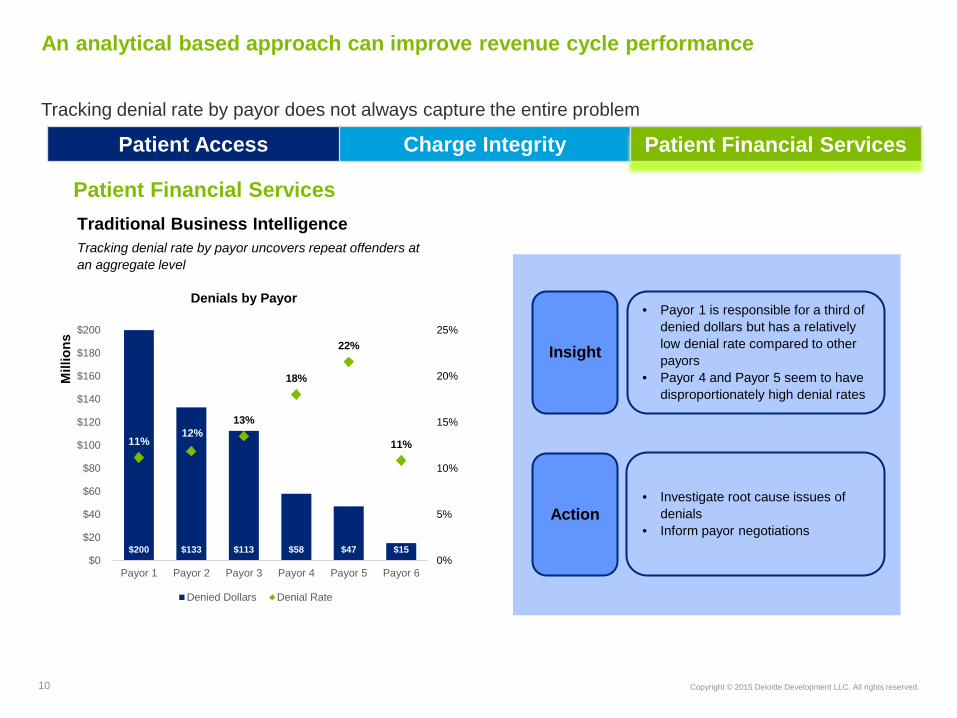
Patient Access Charge Integrity Patient Financial Services Tracking denial rate by payor does not always capture the entire problem
Patient Financial Services
Tracking denial rate by payor uncovers repeat offenders at an aggregate level
Action
• Payor 1 is responsible for a third of denied dollars but has a relatively low denial rate compared to other payors
• Payor 4 and Payor 5 seem to have disproportionately high denial rates
Traditional Business Intelligence
Denials by Payor
Insight
• Investigate root cause issues of denials
• Inform payor negotiations
Patient Financial Services
$200 $133 $113 $58 $47 $15
11% 12%
13%
18%
22%
11%
0%
5%
10%
15%
20%
25%
$0
$20
$40
$60
$80
$100
$120
$140
$160
$180
$200
Payor 1 Payor 2 Payor 3 Payor 4 Payor 5 Payor 6
Mill
ions
Denied Dollars Denial Rate
An analytical based approach can improve revenue cycle performance
11 Copyright © 2015 Deloitte Development LLC. All rights reserved.
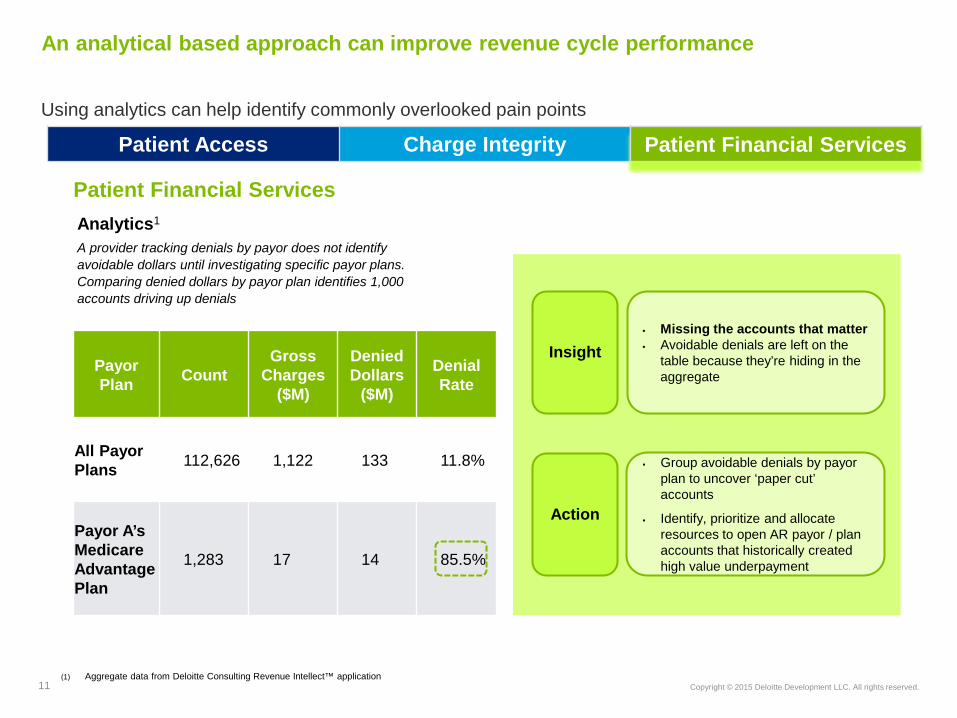
Patient Access Charge Integrity Patient Financial Services Using analytics can help identify commonly overlooked pain points
A provider tracking denials by payor does not identify avoidable dollars until investigating specific payor plans. Comparing denied dollars by payor plan identifies 1,000 accounts driving up denials
Action
Missing the accounts that matter Avoidable denials are left on the
table because they’re hiding in the aggregate
Analytics1
Insight
Group avoidable denials by payor plan to uncover ‘paper cut’ accounts
Identify, prioritize and allocate resources to open AR payor / plan accounts that historically created high value underpayment
Patient Financial Services
Patient Financial Services
Payor Plan Count
Gross Charges
($M)
Denied Dollars
($M)
Denial Rate
All Payor Plans 112,626 1,122 133 11.8%
Payor A’s Medicare Advantage Plan
1,283 17 14 85.5%
An analytical based approach can improve revenue cycle performance
(1) Aggregate data from Deloitte Consulting Revenue Intellect™ application

12 Copyright © 2015 Deloitte Development LLC. All rights reserved.
Orlando Health
9 Facilities 2,200 Affiliated
Physicians 14,000 Employees
Orlando Health is one of Florida’s most comprehensive private, not-for-profit healthcare Organizations since 1918
1983 Licensed Beds
Graduate Medical Center
Level 1 Trauma Center
IP: 95,325 OP: 629,368 ED: 250,465
Discharges FY14
Care People
Total Cash: $ 1,698B Cash to Net : 100.2% Operating Margin: 6.0% Days Cash on Hand: 169
AR Days: 50.2 Community Care: $298M Bills Transmitted: 990,850 Call Handling: 71,279 Calls
Financial Metrics: How we ended FY141
(1) Statistics provided by Orlando Health team
13 Copyright © 2015 Deloitte Development LLC. All rights reserved.
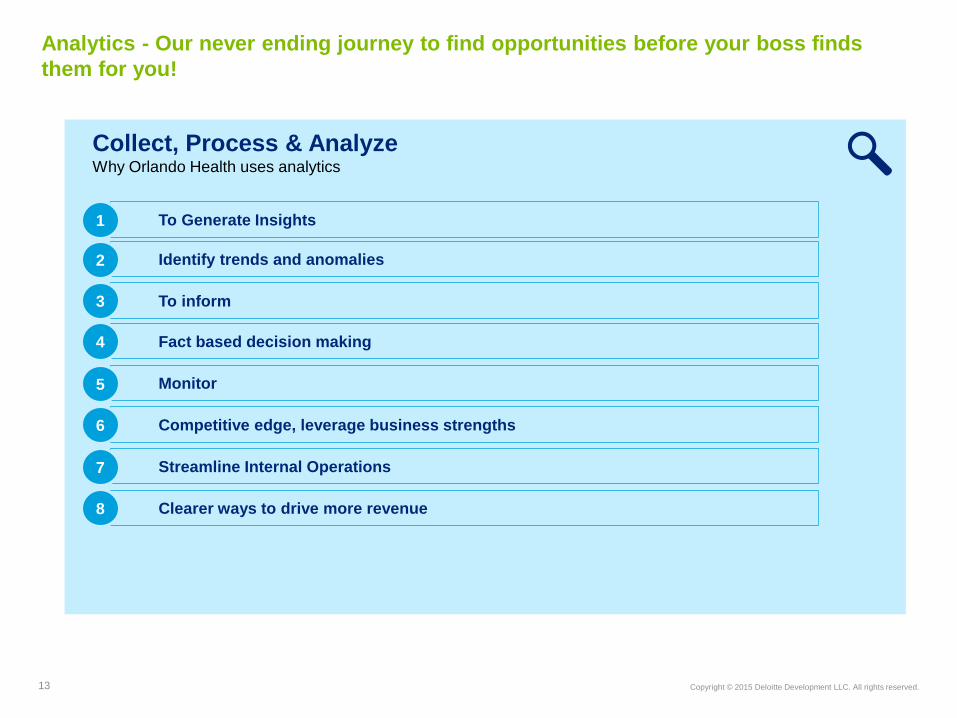
Collect, Process & Analyze Why Orlando Health uses analytics
To Generate Insights 1
Analytics - Our never ending journey to find opportunities before your boss finds them for you!
Identify trends and anomalies
To inform
Fact based decision making
Monitor
Competitive edge, leverage business strengths
Streamline Internal Operations
Clearer ways to drive more revenue
2
3
4
5
6
7
8
14 Copyright © 2015 Deloitte Development LLC. All rights reserved.
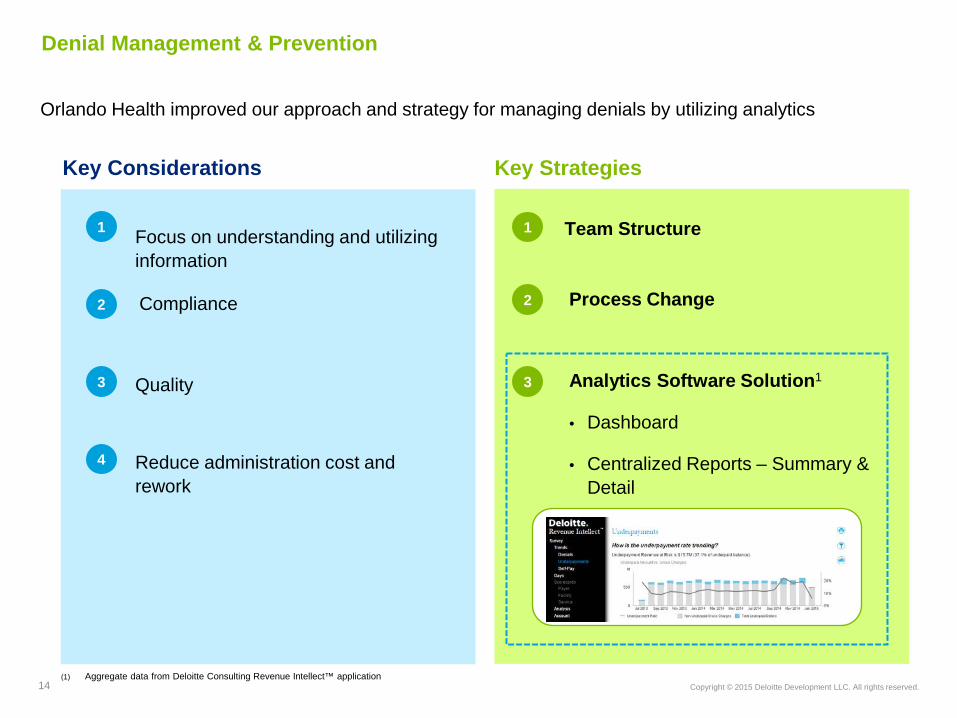
Denial Management & Prevention
Focus on understanding and utilizing information
Compliance
Quality
Reduce administration cost and rework
Orlando Health improved our approach and strategy for managing denials by utilizing analytics
2
3
4
1
2
3
1 Team Structure
Process Change
Analytics Software Solution1
• Dashboard
• Centralized Reports – Summary & Detail
Key Considerations Key Strategies
(1) Aggregate data from Deloitte Consulting Revenue Intellect™ application

15 Copyright © 2015 Deloitte Development LLC. All rights reserved.
Using analytics to identify opportunities
We have found some of the following strategies and best practices useful in managing denials
Groupings are foundational
Group denial reason and remark codes for analysis, identification of root causes and assignment of responsibility
Denial code groupings drive management reporting to identify high-level issues
Denial code groupings support root cause analysis to resolve issues and reduce denial rates
Denial code groupings support routing of claims for more efficient follow-up
Denial Reason Groups
Root Causes
Responsibility
Best Practices
Below are some lessons learned from our experience grouping denials
Focus on a limited number (<20) of denial reason code groupings
Group first to “owner”, or responsible party then to denial reason
Group denials into recoverable and unrecoverable buckets
Use both reason, remark codes for grouping/assignment
Documenting and sharing business leading practices will help to promote consistency and
standard methodology across systems

16 Copyright © 2015 Deloitte Development LLC. All rights reserved.
Registration HIM CM/UR Billing
Having aggregated denials according to responsibility and root cause area, analytics can uncover actionable insights
1. Root Cause High Level Area Map to CAS Codes
2. Then group by Reason for the Denial
3. Group by Avoidable and Recoverable
Patient Access
Uncovered large opportunity in High Dollar Radiology procedures
Registration related denials
Opportunity • Procedure authorized is not what was
actually performed
Denial Type • Authorization missing/invalid
Steps Taken
1. Multiple processes in the workflow need to be addressed
2. Show data on timeline 3. Note what was monitored, responsible
parties 4. Outcome/results/recommendations
Patient Financial Services
Identified underpayments by payor across time to better understand reimbursement pain points
Underpayments by Payor
Opportunity • Average days to pay and reimbursement
issues
Underpay • Summary of underpayments by payor
Steps Taken
1. Resources allocated to work specific open AR
2. Recovery effort focus (claim events, negotiated settlements)
Billing Registration
Review denials based on root cause area

17 Copyright © 2015 Deloitte Development LLC. All rights reserved.
Denial Rate Full Denials1
Patient Access Denial Discovery Analysis
$38 $37 $34 $40 $39 $57 $63 $46 $43 $49 $44 $48 $47 $51 $46 $59 $61
6.1% 5.9% 5.5% 6.0% 6.1%
8.6% 9.2%
7.0% 6.3%
7.3% 6.6%
7.4% 7.0% 7.6% 7.1%
8.1% 8.9%
0.0%
5.0%
10.0%
$0
$10
$20
$30
$40
$50
$60
$70
Jul '13 Aug '13 Sep '13 Oct '13 Nov '13 Dec '13 Jan '14 Feb '14 Mar '14 Apr '14 May '14 Jun '14 Jul '14 Aug '14 Sep '14 Oct '14 Nov '14
Milli
ons
Denied Gross Charges Denial Rate
Average: 7.1%
Measuring historical denial rate and root cause areas uncovered disproportionate outliers
Top Appeal Root Cause
(1) Aggregate data from Deloitte Consulting Revenue Intellect™ application

18 Copyright © 2015 Deloitte Development LLC. All rights reserved.
Registration/Auth Denials1 DMU AR – Denial Reason1
Analysis
Patient Access Denial Deep Dive
Denial Type1
Authorization related denials accounted for 72% of denied accounts within the analysis
These accounts also made up 61% of denied dollars
Tracking Authorization denials across time can identify areas that require further investigation and drive action
Investigating root cause area helps to refine search and discovery of key issue drivers
(1) Aggregate data from Deloitte Consulting Revenue Intellect™ application and covers one payor only
19 Copyright © 2015 Deloitte Development LLC. All rights reserved.
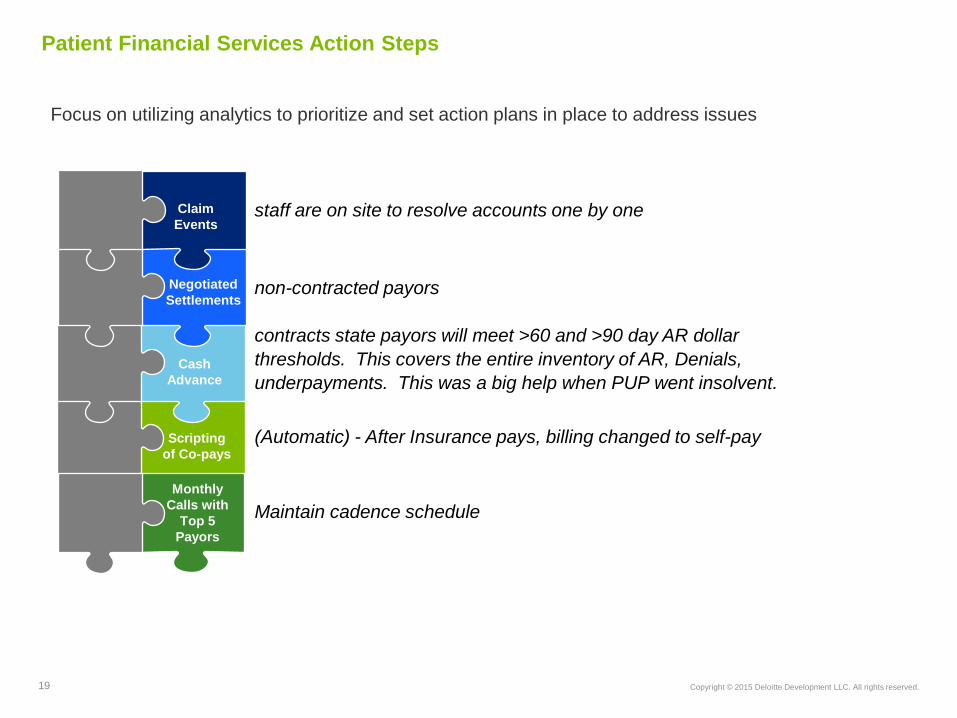
Focus on utilizing analytics to prioritize and set action plans in place to address issues
Scripting of Co-pays
Claim Events
Negotiated Settlements
Cash Advance
Monthly Calls with
Top 5 Payors
staff are on site to resolve accounts one by one
non-contracted payors
contracts state payors will meet >60 and >90 day AR dollar thresholds. This covers the entire inventory of AR, Denials, underpayments. This was a big help when PUP went insolvent.
(Automatic) - After Insurance pays, billing changed to self-pay
Maintain cadence schedule
Patient Financial Services Action Steps
20 Copyright © 2015 Deloitte Development LLC. All rights reserved.
Lessons Learned
1. More is not always better
2. Analysis paralysis
3. Leadership engagement – Buy-in & Support
4. Continuous Learning Cycle & evolution
2
3
1
4
A few things to keep in mind…

21 Copyright © 2015 Deloitte Development LLC. All rights reserved.
Questions
? ? ?

22 Copyright © 2015 Deloitte Development LLC. All rights reserved.
References: (1) Any aggregate data detailed through out the presentation is was
pulled from Deloitte Consulting Revenue Intellect™ application
(2) “Moody's: US not-for-profit hospital outlook remains negative for 2014; revenue growth to decline,” Moody’s, November 25, 2013, https://www.moodys.com/research/Moodys- US-not-for-profit-hospital-outlook-remains-negative-for PR_287519, accessed Nov. 22, 2014
(3) Tom McGee, Deloitte M&A Trends Report 2014: A comprehensive look at the M&A market, June 2014,http://www.deloitte.com/view/en_US/us/Services/additional-services/merger-acquisition services/77212ac570e36410VgnVCM2000003356f70aRCRD.htm, accessed Dec. 1, 2014
(4) Ion Skillrud, Wendy Gerhardt and Maulesh Shukla “The great consolidation: the potential for rapid consolidation of health systems” Deloitte Center for Health Solutions. October 24, 2014
(5) Bill Copeland “Good for what ails us: The disruptive rise of value based care” Deloitte Center for Health Solutions. June 17, 2014
(6) Deloitte Research “Global LSHC Overview” October 24, 2014
(7) Bernstein, Peter Against the Gods: The Remarkable Story of Risk Jon Wiley & Sons, 1996.
(8) Deloitte Research Tools “Data Center – Digital Universe” Computer World Data Center Study. January 2014
(9) Deloitte Research “Deloitte Analytics: Big Data and Analytics” September 22, 2013

As used in this document, “Deloitte” means Deloitte LLP and its subsidiaries. Please see www.deloitte.com/us/about for a detailed description of the legal structure of Deloitte LLP and its subsidiaries. Certain services may not be available to attest clients under the rules and regulations of public accounting. Copyright © 2015 Deloitte Development LLC. All rights reserved. 36 USC 220506 Member of Deloitte Touche Tohmatsu Limited