
Using altimeter and Argo data to estimate biases in XBT fall rate equations
16
Using altimeter and Argo Using altimeter and Argo data to estimate biases data to estimate biases in XBT fall rate in XBT fall rate equations equations Josh K. Willis Josh K. Willis [email protected] [email protected] Jet Propulsion Laboratory Jet Propulsion Laboratory
-
Upload
cadman-mckinney -
Category
Documents
-
view
19 -
download
0
description
Using altimeter and Argo data to estimate biases in XBT fall rate equations. Josh K. Willis [email protected] Jet Propulsion Laboratory. Overview. Ocean “cooling” – why overall accuracy in the XBT network is important Argo and altimeter data as calibration tools - PowerPoint PPT Presentation
Transcript of Using altimeter and Argo data to estimate biases in XBT fall rate equations

Using altimeter and Argo Using altimeter and Argo data to estimate biases in data to estimate biases in
XBT fall rate equationsXBT fall rate equations
Josh K. WillisJosh K. [email protected]@jpl.nasa.gov
Jet Propulsion LaboratoryJet Propulsion Laboratory

I.I. Ocean “cooling” – why overall Ocean “cooling” – why overall accuracy in the XBT network is accuracy in the XBT network is importantimportant
II.II. Argo and altimeter data as Argo and altimeter data as calibration toolscalibration tools
III.III. Time evolution of recent XBT biasesTime evolution of recent XBT biases
IV.IV. Remaining XBT errorsRemaining XBT errors
OverviewOverview

2003 to 2005 cooling:-1.0 ± 0.33 W/m2
(Averaged over Earth’s surface)
Cooling!!!
from from Lyman et al.Lyman et al. ( (GRLGRL, 2006), 2006)
Upper-Ocean “cooling”Upper-Ocean “cooling”

XBT Data – Signals and XBT Data – Signals and ErrorsErrors
Eddies
• Big signals in “isotherm displacement”
• Lots of averaging required for large-scale
• Average signals susceptible to systematic error

WHOI float biasesWHOI float biases

Removing the bad float data reduces the cooling but does not completely eliminate it.
A correction to “recent cooling”A correction to “recent cooling”
Ocean Heat Content from 2004 to 2006
From Willis et al., GRL, in prep.

Another bias: XBTs are biased warm, which also causes spurious cooling.
A correction to “recent cooling”A correction to “recent cooling”
Ocean Heat Content from 2004 to 2006
From Willis et al., GRL, in prep.

XBT bias & fall-rate errors – XBT bias & fall-rate errors – pair analysispair analysis
Isotherm Displacement:
z =dTclim /dz
Tclim – T
XBT/Argo pairs ~12,000
Argo/CTD pairs ~2,000
From Willis et al., GRL, in prep.
Comparison of Isotherm
Displacements

The “pseudo pair”The “pseudo pair”
From Wijffels et al., manuscript in prep.
Coefficient of regression, r between SSH anomaly and T(400 m)
• Much of upper ocean T variaibility is contained in SSH anomaly
• Use AVISO SSH maps to make “pseudo” temperature anomalies:
Tpseudo = (z) * SSHA
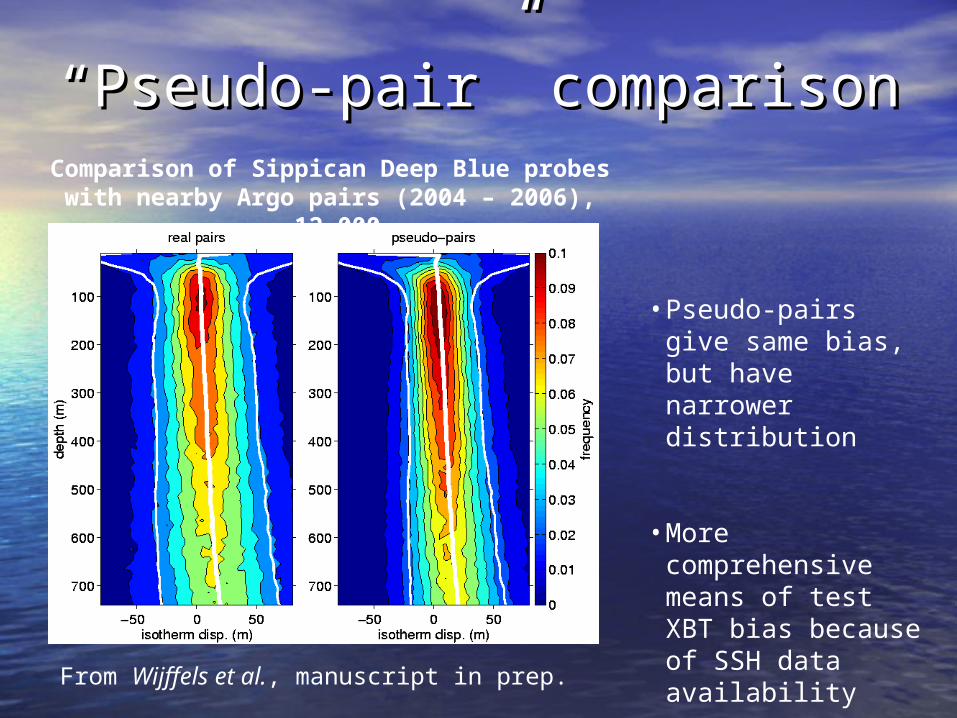
““Pseudo-pair” comparisonPseudo-pair” comparison
From Wijffels et al., manuscript in prep.
Comparison of Sippican Deep Blue probes with nearby Argo pairs (2004 – 2006),
~12,000
•Pseudo-pairs give same bias, but have narrower distribution
•More comprehensive means of test XBT bias because of SSH data availability

““Pseudo-pair” analysis of other dataPseudo-pair” analysis of other data(a.k.a. sanity check)(a.k.a. sanity check)
From Wijffels et al., accepted
• CTD data show no significant bias during any time period
• Argo floats show little bias except for WHOI/FSI floats
CTD data Argo profile data

Time dependence of XBT Time dependence of XBT biasbias
From Wijffels et al., manuscript in prep.
Time dependence of bias in Sippican Deep Blue XBT
probes
• Bias increases over time
• Hi bias in later years may reflect “double” application of Hanawa et al. (1995) correction

Stretching Stretching factor by factor by probe typeprobe type

Revised ocean heat content Revised ocean heat content estimateestimate

Remaining ErrorsRemaining Errors• Skewness: Skewness:
significant significant difference between difference between mean and medianmean and median
• Could be a sign of Could be a sign of wire stretchwire stretch

Remaining ErrorsRemaining Errors
Gaussian
Tail for positive depth error is much bigger


![The impact of historical biases on the XBT-derived …and Szabados, 1989] in comparison to ±0.001 C for conductivity-temperature-depth (CTD) stations or ±0.005 C for Argo profiling](https://static.fdocuments.in/doc/165x107/5f79ccddd0cc5425c54ea046/the-impact-of-historical-biases-on-the-xbt-derived-and-szabados-1989-in-comparison.jpg)