Using a Snow Drift Model to simulate Aeolian Drift and ... · Revised’ 1’ Using a Snow Drift...
46
Revised Using a Snow Drift Model to simulate Aeolian Drift and Snowfall on the Summit of 1 Mauna Kea, Hawaii 2 3 By 4 5 Leigh Anne Eaton and Steven Businger 6 University of Hawaii at Manoa 7 8 submitted to a special issue volume of the Arctic, Antarctic, and Alpine Research 9 June 2014 10 11 12
Transcript of Using a Snow Drift Model to simulate Aeolian Drift and ... · Revised’ 1’ Using a Snow Drift...

Revised
Using a Snow Drift Model to simulate Aeolian Drift and Snowfall on the Summit of 1
Mauna Kea, Hawaii 2
3
By 4
5
Leigh Anne Eaton and Steven Businger 6
University of Hawaii at Manoa 7
8
submitted to a special issue volume of the Arctic, Antarctic, and Alpine Research 9
June 2014 10
11
12

Revised
Abstract 13
The goal of this research is to help develop a better understanding of the micro-14
meteorology of the Mauna Kea summit area and its relationship to the distribution and 15
population health of the Wēkiu Bug (Nysius Wekiuicola). SnowModel, a spatially 16
distributed snow-evolution model, is used to construct snowfall and bug-fall 17
accumulation maps across the summit. Eight weather stations associated with 18
astronomical observatories on the summit ridges and four Davis weather stations located 19
in various cinder cones (pu‘u in Hawaiian), provide the meteorological observations 20
needed as input to run SnowModel. Snow-depth observations taken after a passing cold 21
front in January 2011 are used to help validate the model accumulation predictions prior 22
to the climatological study. Observations from the eight weather stations over a three-23
year period ( 2008, 2009, and 2010) are used as input for the modeled summit 24
accumulations of snowfall and bug fall, presented in this study. For the snowfall maps, 25
only weather data from days during which snow fell are included. For the bug-fall 26
estimates, all days for which we have weather data are included in the model output. 27
Since there are no comprehensive data available on the distribution of bug fall, the bug-28
fall maps only provide a climatological pattern, without reference to the magnitude of the 29
bug fall. 30
The greatest modeled snow accumulations are found on Pu‘u Wēkiu and Pu‘u 31
Haukea. Similar results are found in the climatological bug-fall accumulation pattern. 32
Prevailing wind direction is most critical for the distribution of snowfall and bug fall with 33
maximum accumulations occurring on lee side of ridges and crests. Favorable Wēkiu 34
Bug trapping sites in which bugs were found historically, are spatially well collocated 35
Revised
with snowfall and bug fall accumulations, suggesting that the results of this study will be 36
of interest to entomologists in locating wēkiu bug populations. 37
38
1. Introduction 39
Mauna Kea is a dormant post-shield volcano located on the Big Island of Hawaii. 40
The summit rises 4205 m above sea level and sits well above the typical trade-wind 41
inversion (~2255m) that limits depth of clouds and convection within the island chain 42
(Cao et al., 2007). Therefore, the summit is classified as semi-arid alpine tundra. At the 43
summit, air temperatures are cool to cold, with nocturnal freezing throughout the year, 44
and extremely dry dew-point temperatures that result in a very low density of vascular 45
plants (James, 1922; Ugolini, 1974; da Silva, 2012). 46
The arid climate and low incident angle of the sun in some aspects of the Mauna 47
Kea summit contribute to the formation of subsurface ice. Areas of permafrost were first 48
discovered in 1969 (Woodcock, 1974). More recently Ehses (2007) measured soil 49
temperatures in the summit area in an effort to estimate the extent of permafrost. Ehses 50
found near surface ice at several locations that she surveyed, however, whether or not ice 51
was present year round was not confirmed because the observing period was from mid 52
January to early March. Nevertheless, as pertains to the ecology of the wēkiu bug, it is 53
suggested that the sites that Ehses identified as likely to support permafrost, are not sites 54
where wēkiu bug populations would likely be found owing to unfavorably cool 55
temperatures. 56
Aside from prevailing trade winds, the summit does experience a variety of 57
weather systems, including kona lows, upper-level lows, tropical upper-tropospheric 58

Revised
troughs, and the rare tropical cyclone that (Blumenstock and Price, 1967; Worthley, 59
1967; and Kodama and Businger, 1998). These weather systems bring clouds and rain 60
and snow to the summit. 61
Consistent with the nature of post-shield volcanoes, the slopes of Mauna Kea are 62
generally smooth and gradual (on average 7-12% grade). However, on the summit, slopes 63
of 30% can be seen on the flanks of various pu‘us. Pu‘us are cinder cones that were 64
created from explosions of highly vesicular material such as ash, lapilli, and cinder. The 65
ash was carried downwind, and the lapilli and cinder fell close to the explosion site 66
forming the cinder cones (Porter, 1997). The current day summit geological make-up of 67
the summit area includes an array of pu‘us, glacial till, dikes, various lava flows, and 68
glacial outwash (Wolfe et al., 1997; Sustainable Resources Group International, Inc., 69
2009). 70
The porous material that makes up the pu‘u slopes is home to several plant and 71
animal life forms. There are approximately 25 different lichen and 12 different moss 72
communities found on the summit (Group 70 International, 2000). Mauna Kea houses a 73
multitude of arthropods (spiders, moths, mites, spring-tails, centipedes, and true bugs). 74
Summit life is considered an Aeolian ecosystem, which is a term first introduced by 75
Swan (1963), that describes a habitat that is solely dependent on the transport of nutrients 76
(biological fallout such as organic debris and insects) by the wind. Average wind speed at 77
the summit is approximately 4-5 m s-1, with much higher winds during the passage of 78
storms (Bely, 1987; da Silva, 2012). 79
The Wēkiu Bug (Nysius Wekiuicola) has been a focus of research since its 80
discovery in 1980 by biologists searching for insects under the Canada, France, and 81

Revised
Hawaii Telescope (CFHT) (Ashlock and Gagne, 1983). This true bug is endemic to the 82
summit and receives its nutrients and moisture from the distribution of Aeolian debris 83
and snow (Englund et al., 2002; Englund et al., 2009; Eiben and Rubinoff, 2010; Fish and 84
Wildlife, 2010). Early entomology studies have shown that the Wēkiu Bug is most active 85
in the winter and are commonly found in adjacent snow pack areas (Ashlock and Gange, 86
1983). 87
Although it is located in the tropics, the summit of Mauna Kea can and does 88
receive snowfall. There are no formal studies detailing the climatology of snowfall events 89
for the summit because of the limited snow depth and snowfall data. However, da Silva 90
(2006) created a proxy, where observations of temperature and relative humidity are 91
below 0°C and greater than 80%, respectively, for periods of 4 hours or more, to estimate 92
the average number of snowfall events per month. She found that January typically has 93
six such events, February and March both averaged five events, and November averaged 94
four. In 2008 the summit experienced 40 days where there was recorded precipitation 95
and temperatures below 0°C at one or more of the weather stations. In 2009 the summit 96
experienced 52 days like this (Fig. 1). 97
How wind flow varies over terrain has been a widely studied (e.g., Jackson and 98
Hunt, 1975; Whiteman, 2000). It is known that the speed, direction, and turbulence 99
associated with wind, all change as it flows over hills. Unstable and neutrally stable air is 100
easily carried over a hill. For stable air, the degree of stability, wind speed, and terrain 101
characteristics determine how the protruding hills or pu‘u affect the flow. The highest 102
wind speeds in flow around a barrier are on the slopes where flow is parallel to the hills’ 103
elevation contour lines. In this study the analysis is restricted to the micrometeorology of 104

Revised
the summit region itself (Fig. 2). 105
This study uses SnowModel (Liston and Elder, 2006), a spatially distributed snow 106
evolution model, which incorporates weighted interpolations of daily weather data to 107
derive wind-flow adjustments around the pu’u stippled summit. A description of 108
SnowModel is given in section 2. The results of SnowModel include estimates of the 109
distribution of snowfall and Aeolian debris, which are presented in section 3. The 110
resulting climatological distributions are then compared with the locations where Wēkiu 111
Bugs have been observed in the field. 112
113
2. Data and Methods 114
This research aims to connect previous entomological and geological studies with 115
a micro-meteorological study of the summit. Both observations and modeling are used in 116
hopes of gaining a better understanding of the endemic Wēkiu Bug’s habitat. 117
2.1 Study Area 118
Mauna Kea is one of the five volcanoes that make up Hawaii Island. Mauna 119
Kea’s summit rises 4205 m above sea level and is located at 19.8N and -155.5W. The 120
study area encompasses a 4320 m by 3250 m area that includes [from East to West] Pu’u 121
Lilinoe, Pu‘u Mahoe, Pu‘u Kea, Pu‘u Wēkiu, Pu‘u Haukea, Pu‘u Hau’oki, Pu‘u Poli‘ahu, 122
and Pu‘u Pōhaku (Fig 2). It can be seen in Fig. 2 that Pu’u Wekiu is the largest of the 123
pu’u in areal extent and elevation difference. Elevation in the region ranges from 3741.6 124
m to 4205 m. The terrain is comprised mainly of cinder cones and glacial till. The central 125
southern region of the domain is the northern tip of the Mauna Kea Ice Age Natural Area 126
Reserve, which holds the Mauna Kea Adze Quarry. 127
Revised
The summit also houses the world’s largest observatory for optical, infrared, and 128
sub-millimeter astronomy. Presently, there are 13 active telescopes on the summit ridges, 129
several which support basic weather stations (Fig. 2). Additionally, four Davis weather 130
stations were installed in 2007 in low-lying areas within four different pu'us (Hau'oki, 131
Kea, Wēkiu, and Pōhaku) under the supervision of the Wēkiu Bug Scientific Advisory 132
Committee (WBSAC) (Table 1). 133
134
2.2 Model 135
SnowModel is a spatially distributed snow-evolution modeling system that 136
includes first order physics required to simulate snow evolution within each of the snow 137
climates, i.e., ice, tundra, alpine/mountain, prairie, maritime, and ephemeral (Liston and 138
Elder, 2006). SnowModel has been tested on a variety of snowy environments (i.e., 139
Colorado (Greene et al., 1999), Antarctica (Liston et al., 2000), Idaho (Prasad et al., 140
2001), and Alaska (Liston and Sturm, 2002)). 141
SnowModel is comprised of four sub-models, MicroMet, EnBal, SnowPack, and 142
SnowTran-3D. MicroMet was developed by Liston and Sturm (2006b) to produce high-143
resolution atmospheric variables (air temperature, relative humidity, wind speed, wind 144
direction, incoming solar radiation, incoming longwave radiation, surface pressure, and 145
precipitation), using meteorological point data from weather stations as input. The output 146
from MicroMet is then available as input for spatially distributed terrestrial models over a 147
wide variety of landscapes. 148
Included in MicroMet is a three-step preprocessor that helps to identify and /or 149
correct deficiencies found in the station data. MicroMet uses the Barnes objective 150

Revised
analysis scheme (Barnes, 1973; Koch et al., 1983) to interpolate irregularly distributed 151
meteorological data to a regularly spaced grid, with corrections based on known 152
temperature-elevation, wind-topography, and solar radiation- topography relationships 153
(Liston and Sturm, 2006a). Detailed physics are provided in Liston and Elder, 2006a. 154
EnBal uses the near-surface atmospheric conditions produced by MicroMet to 155
simulate surface skin temperature and energy and moisture fluxes. Surface latent and 156
sensible heat fluxes and snowmelt calculations are made using the surface energy balance 157
model, 158
1− 𝛼 𝑄!" + 𝑄!" + 𝑄 + 𝑄! + 𝑄! + 𝑄! = 𝑄! , 159
where Qsi, is the solar radiation reaching the surface, Qli is the incoming longwave 160
radiation, Qle is the emitted longwave radiation, Qh is the turbulent exchange of sensible 161
heat, Qe is the turbulent exchange of latent heat, Qc is the conductive energy transport, Qm 162
is the energy flux available for melt, and α is the surface albedo (Liston and Elder, 163
2006b). For all of the terms found in the equation, surface temperature is the only 164
unknown, and it is solved for. Surface temperatures greater than 0°C indicate there is 165
energy available for melting. The energy flux available for melt, Qm, is solved by setting 166
surface temperature to zero (Liston and Elder, 2006b). 167
SnowPack is a simple, single-layer, snowpack evolution model that calculates 168
snowpack changes in response to the precipitation and melt fluxes defined by MicroMet. 169
The compaction-based snow-density evolution is based on Anderson (1976). SnowPack 170
uses snow temperature, overlying snow weight, and the effect of snow melting to 171
calculate temporal snow-density changes. In the case of non-blowing snow, static-surface 172
sublimation is calculated and used to adjust the snow pack. 173

Revised
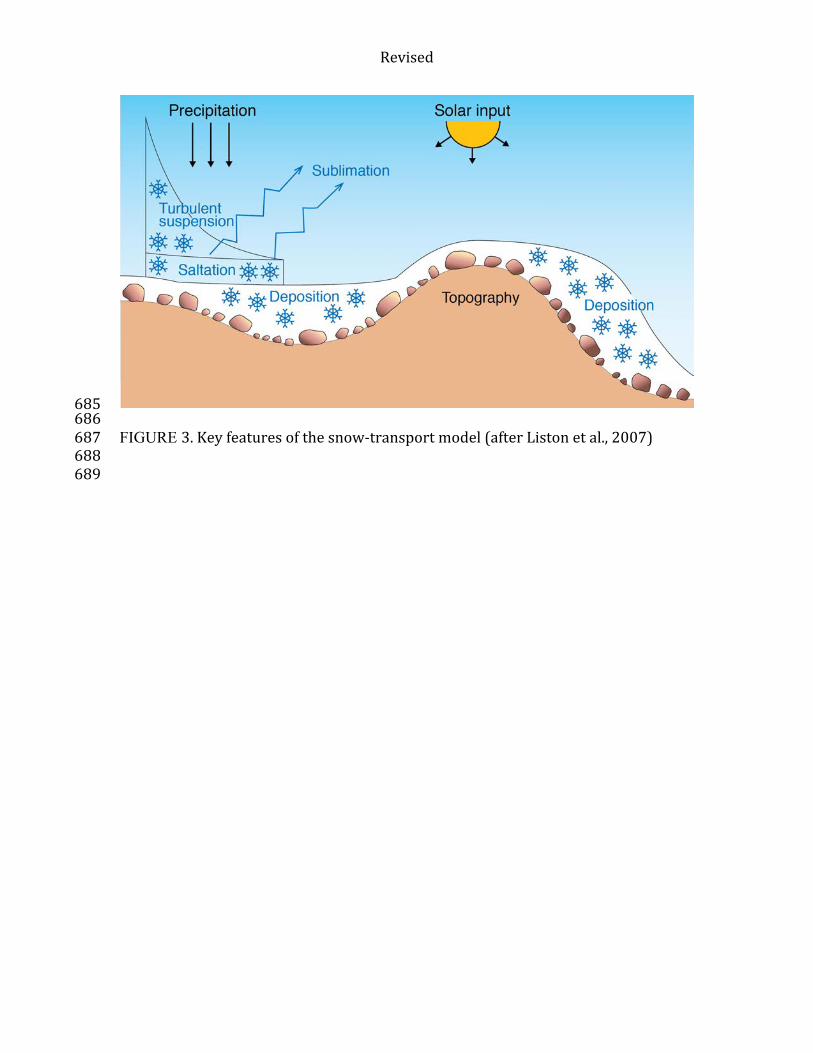
SnowTran-3D simulates wind-driven snow-depth evolution over topographically 174
variable terrain (Liston et al., 1998). There are five primary components: i) the wind-flow 175
forcing field; ii) the wind-shear stress on the surface; iii) the transport of snow by the 176
dominant wind-transport modes of saltation and turbulent suspension; iv) the sublimation 177
of saltating and suspended snow; and v) the accumulation and erosion of snow at the 178
snow surface (Fig. 3). The required model inputs include, topography, vegetation, and 179
spatially distributed temporally variant weather data (precipitation, wind speed, wind 180
direction, air temperature, and relative humidity). 181
The physics behind SnowTran-3D are primarily based on a mass-balance equation 182
that describes the temporal variation of snow depth at each point within the simulated 183
domain. Accumulation and erosion of snow depth at each point results from the 184
following processes; i) changes in horizontal mass-transport rates of saltation, Qsalt (kg m-185
1 s-1); ii) differences in horizontal mass-transport rates of turbulent suspended snow, Qturb 186
(kg m-1 s-1); iii) sublimation of transported snow particles, Qv (kg m-1 s-1); and iv) the 187
incoming rate of water equivalent precipitation, P (m s-1). The mass-balance equation is 188
! !!!!"
= 𝜌!𝑃 −!!!"#$!"
+ !!!"#$!"
+ !!!"#$!"
+ !!!"#$!"
+ 𝑄!, 189
where t (s) is time; x (m) and y (m) are the horizontal coordinates in the east-west and 190
north-south directions, and ρs and ρw (kg m-3) are the snow and water densities. The 191
mass-balance equation is solved at every time-step, for every grid cell and is coupled 192
with neighboring cells through spatial derivatives (Liston and Sturm, 1998). 193
Snow drift and accumulation totals can occur by three main modes of transport 194
(creep, saltation, suspension). Creep, the rolling motion of the snow along the surface, 195
occurs in light wind speeds. SnowModel does not specifically state or calculate 196

Revised
redistribution due to the creep process. Although, earlier snow redistribution studies have 197
found that the percentage of redistribution from creep is small, between 6-10% (Kosugi et 198
al., 1992). Saltation and suspension are the dominant processes for moving snow and the 199
transport rate of snow by these two methods can be described by wind speed 200
relationships. 201
Saltation is the transport of snow in periodic contact with and directly above the 202
surface; transportation rate roughly increases linearly with friction velocity (Pomeroy and 203
Gray, 1990). Whereas, suspension is the transport of snow through turbulent eddies at 204
higher wind speeds and can occur several hundred meters above the surface. Saltation 205
must be occurring in order to have turbulent-suspended snow particles (Liston and Sturm, 206
1998). Liston and Sturm (1998) showed that at higher frictional velocities, suspension is 207
the dominant mode of transport over saltation. 208
To allow the initial processes that allow snow to be transported, the snow depth 209
must surpass the vegetation holding depth and break the gravitational and cohesive bond 210
of the ice crystals. Vegetation holding depth is defined as the height that the snowfall 211
accumulation must exceed to cover various surface characteristics, which may include 212
grass, boulders, and other features blocking snow’s path. Along with exceeding the 213
vegetation holding depth, a threshold friction velocity (u*t) must be exceeded to lift the 214
snow for transport. The shear stress on the surface, u* (friction velocity), produced by the 215
wind is the main determining factor for transport. It is defined by, 216
𝑢∗ = 𝑢!!
!" !!!! , 217
where ur (m s-1) is the wind speed at reference height zr (m), z0 (m) is the surface 218
roughness length, and κ is von Karman’s constant. The friction velocity of a given wind 219

Revised
must exceed a threshold friction velocity value (u*t) for transport to begin. The threshold 220
friction velocity is lower (u*t = 0.07-0.25 m s-1) for fresh, loose, dry snow and during 221
snowfall and higher (u*t = 0.25-1.0 m s-1) for older, wind hardened, dense, and/or wet 222
snow where inter-particle bonds and cohesion forces are strong (Kind, 1981). 223
The loss of snow particle mass as a result of sublimation is a function of wind 224
speed, air temperature, humidity, particle size, and solar radiation. Sublimation is the 225
cause for significant reductions in snow mass in snow accumulation areas (Schmidt, 226
1982; Marsh, 1999). 227
To estimate the bug fall distribution on the summit of Mauna Kea, we assumed a 228
constant bug fall rate and allowed SnowModel to determine the final bug fall distribution 229
based on the input of wind data from 2008 to 2010 from the summit weather stations. To 230
model the bug fall, only Micromet and SnowTran-3D sub-models are used. The 231
SnowPack and EnBal sub-models are turned off, to eliminate melting and density 232
changes from energy inputs to the modeled bug fall. Within the SnowTran-3D sub-233
model, sublimation is removed as a valid process of snow transport and is set to zero. The 234
elimination of sublimation, evaporation, and melting of the solid matter bug fall is 235
consistent with the notion that bug fall mass is not lost to the atmosphere during transport 236
or when settled. To imitate the transport of solid bug fall matter at the summit, 237
temperature, relative humidity, and a bug fall precipitation rate were set to constant 238
values of 0°C, 100%, and 0.2 mm hr-1, respectively. Hypothetical bug fall stations were 239
created at ten locations around the perimeter of the study domain. The ten stations acted 240
to provide steady bug fall data, as listed above, for ingest into MicroMet. The bug fall 241
precipitation rate (0.2 mm hr-1) is a hypothetical value based on a rate that would allow 242

Revised
for viewable model return. The results from this modeling exercise only give a relative 243
distribution field for bug fall, but not absolute values for accumulation, since data on 244
bug-fall rates are unavailable. 245
Studies from Eiben and Rubinoff (2010) and Ashlock and Gagne (1983) suggest the 246
Wēkiu Bug feeds on dead or dying insects, which are all wind driven and deposited on 247
the summit from lower elevations. This study does not incorporate flight dynamics of the 248
insects and bugs found within bug fall on the summit; it is assumed the majority of the 249
incoming bug fall is dead and did not use its own means for transport or flight once at 250
summit level. 251
252
3. RESULTS 253
3.1 Case Study 254
Initial testing of SnowModel was completed after the passage of a cold front on 255
11 January 2011. Between 21:30 UTC 11 January and 0000 UTC 12 January 2011, a 256
field experiment on the summit measured the fallen and drifted snow in Pu‘u Wēkiu and 257
Pu‘u Hau‘oki. The cold front dropped ~15 cm of snow (Fig. 4) with drifts up to 60 cm 258
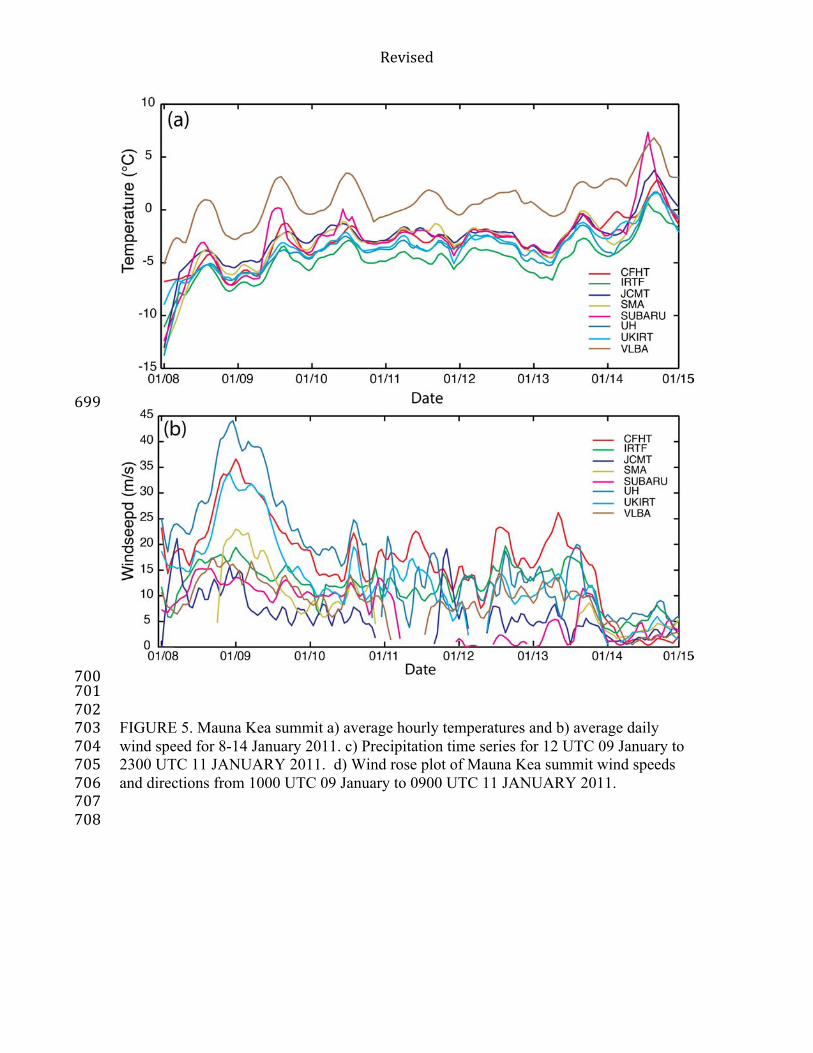
on the summit. Summit temperature, relative humidity, wind speed and direction, and 259
precipitation observations from January 2011 were used as input for SnowModel (Fig. 5). 260
The majority of the winds during the event were from the west and southwest (Fig. 5d). 261
Snow depth measurements took place between 2130 UTC 11 January and 0000 262
UTC 12 January 2011; and focused on the center depressions and the interior slopes of 263
Pu’u Wēkiu and Pu’u Hau’oki. Measurements from the field experiment on 11 January 264
2011 are compared against SnowModel output from 10 January 2011. The bulk of the 265

Revised
snowfall associated with the frontal passage occurred on 10 January 2011.Output from 266
SnowModel for 0959 UTC 11 January 2011 shows an average depth of ~15 cm covering 267
a majority of the summit, in good agreement with observed snow depth (Fig. 6). 268
The overall spatial pattern of the modeled snowfall for 10 January 2011 is in 269
reasonable agreement with snow depth observations within Pu’u Wēkiu and Pu’ Hau’oki. 270
Field observations show snow depth values increasing along the inner western slope of 271
Pu’u Wēkiu, with the shallowest recordings in the center. This same spatial gradient is 272
captured within the modeled output for Pu’u Wēkiu. However, the model does show a 273
tendency to overestimate, especially with the depression of the pu’u and does not extend 274
the higher snow accumulation down the inner western slope. The inner western slope of 275
Pu’u Wēkiu, in this case study, is considered to be the leeward side on the western crest 276
of Pu’u Wēkiu. Discrepancies between the model and the observations in this case may 277
be, in part, caused by the limited number and spatial layout of the weather stations, 278
leading to variations in wind and precipitation. The model interpolates point data to a 279
gridded field. The buildup of snow along the upper section of the inner western slope, 280
suggests that the modeled wind speed is dropping more quickly than is actually 281
occurring. 282
Within Pu‘u Hau‘oki, the overall spatial pattern from the model and observations 283
again were in reasonable agreement. In the western crease of the pu'u center, the model 284
did a fair job in representing actual snow depths. The model underestimates the inner 285
northern slope of the pu‘u, but is in agreement with the increase in snow depth that is 286
occurring spatially, which also holds true for the inner western slope. Pu’u Hau’oki is 287
shielded from the south and west by other pu’us and observatories, more so than Pu’u 288

Revised
Wēkiu. The sharp gradient found in the snow accumulation in Pu’u Wēkiu is not seen 289
here, due to the less noticeable wind acceleration and the less steep slope within this 290
pu’u. 291
Although, the overall spatial patterns from the model are in agreement with the 292
observations, some variability in the snow depth observations not captured by the model 293
can be, in part, attributed to the limited number of weather stations within the study 294
domain. Additionally, subgrid-scale variability in surface terrain and roughness elements 295
will lead to discrepancies between model and observations. The model’s output 296
resolution and 1/3 arc-second National Elevation Dataset (NED) input, are not sufficient 297
to resolve individual boulders that cause variations across the snow-depth field. GPS 298
receivers were used to point locate the snow depth observations, while the model uses the 299
longitude and latitude locations from NED input. 300
301
3.2 Wind and snowfall observations 302
Wind and precipitation data (Figs. 1, 7 and 8) are used in daily model runs to 303
estimate the climatological accumulation of snowfall and bug fall across the summit 304
region. Snow events are characterized by days that have precipitation and the summit 305
average temperature is freezing or below. An overview of the wind and precipitation 306
data is presented here. Nominally, the wind speed threshold for saltation is 5 m s-1 and 307
the threshold for suspension is 15 m s-1 (Liston and Sturm, 1998). 308
Easterly winds prevail in snow events for 2008, especially in February, March, and 309
November (Fig. 7a). December snow events are governed by both easterly and westerly 310
winds; the same goes for snow events in April. The summit received snowfall 40 days out 311

Revised
of the year for 2008 (Fig. 1a). The annual total snowfall observed for the year averaged 312
over all the observation sites was 193 mm. 313
Winds during snow events for 2009 are predominantly westerly (Fig. 7b). January, 314
March, and November have the greatest variation in snow event wind direction. In 315
November there are a number of events with average winds being northerly. In January 316
and March there are a number of snow events having easterly winds. The higher 317
percentages of northeasterly and southeasterly winds are not seen during snow events for 318
2009, as they were in 2008. Winds with strong northern and southern directions are also 319
less frequent during snow events. Snowfall on the summit was recorded during 52 days 320
out of the year for 2009 (Fig. 1b) and the annual total snowfall observed for the year 321
averaged over all the observation sites was 239 mm. Due to equipment failures, 322
precipitation measurements from 2010 were limited. 323
In this study it is suggested that bug fall accumulation patterns are governed by 324
similar physics as snow transport. In estimating the long-term climatology of the bug fall 325
distribution, wind data (Fig. 8) and model results throughout the period of study were 326
integrated. 327
In overview, analysis of all the summit surface winds for the period of study, 2008 328
through 2010, shows that winds favor easterly and westerly directions. The summit 329
experiences winds with easterly components 59% of the time, with a westerly component 330
41% of the time (Fig. 8). Southerly and northerly winds occur relatively infrequently and 331
tend to be lighter. In total summit winds greater than 10 m s-1 occurred 31% of the time. 332
Stronger winds favor southwesterly and eastnortheasterly directions (Fig. 8). 333
334

Revised
3.3 Impact of summit pu‘us on wind speed and direction 335
MicroMet was run to model the changes that occur to winds as they interact with 336
the pu‘u stippled summit. Cardinal and inter-cardinal (north, south, east, west, northeast, 337
southeast, southwest, and northwest) wind fields of 7 m s-1 were initialized into 338
MicroMet to display how the pu’us affect winds from a given direction (Figs. 9-10). 339
Pu‘u Wēkiu had the greatest impact on the wind field for all eight directions. Winds with 340
easterly components have the greatest positive wind speed changes on the pu‘u (Fig. 9a). 341
The outer eastern slope of Pu‘u Wēkiu for these three scenarios (east, northeast, 342
southwest) saw an increase in wind speeds by ~20%. 343
For both direct west and east winds, Pu‘u Wēkiu caused more winds to flow south 344
than north around the pu’u around the pu’u judging from wind directional changes (Fig. 345
10). Pu‘u Hau‘oki does not exhibit any great speed changes, however, approaching 346
winds with a westerly component experience a greater directional change than winds with 347
an easterly component (Fig. 10). Wind speed changes due to interaction with Pu‘u 348
Haukea are most recognizable from winds that have north and east components. The 349
increase, however, is not as distinct as seen on Pu‘u Wēkiu. Consistent with 350
expectations, the center depressions for all three pu‘us experience wind speeds that are 351
~40% slower than surrounding winds. 352
353
3.4 SnowModel Climatology 354
Wind and precipitation data for 2008 and 2009 (Figs. 1 and 7) are used in model 355
runs to estimate the climatological distribution of snowfall accumulation across the 356
summit region. For the snowfall estimation, the model is run with wind data during snow 357

Revised
events only (Fig. 7). Precipitation data for 2010 are incomplete as a result of 358
instrumentation issues. Therefore, the results for 2010 are not included in the snowfall 359
climatology. 360
Accumulated snowfall and bug fall patterns agree well (Figs. 11-12), with the 361
maxima in accumulated snow and dead bugs on the lee sides of ridges and crests. Lower 362
accumulation areas are seen on the windward sides in areas of enhanced winds, where 363
saltation and scouring are active (Figs. 11-12). Differences in the patterns of bug fall and 364
snowfall accumulation are consistent with differences in the dominant wind direction 365
over the days of integration. 366
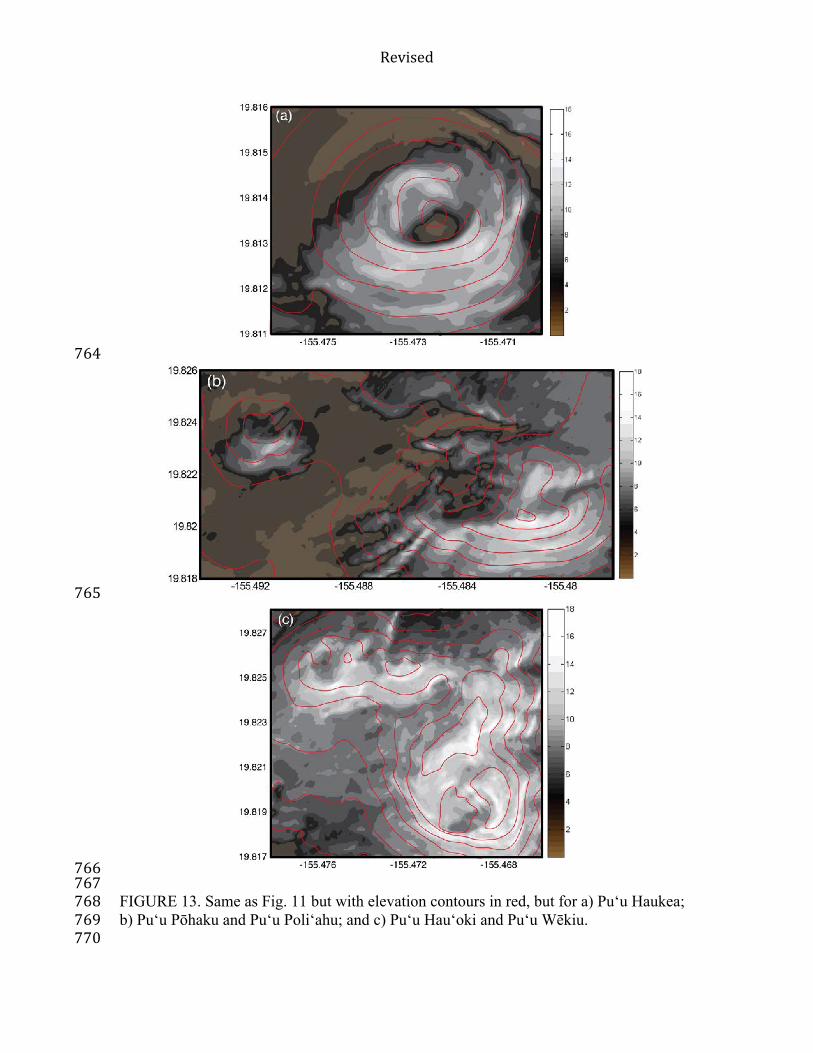
Pu‘u Haukea’s maxima for snowfall and bug fall consistently occur on the outer 367
southern and southeastern slopes (Figs. 13a and 14a). A second snowfall maximum is 368
seen on the inner northeastern slope of Pu‘u Haukea. 369
Pu‘us Poli‘ahu and Pōhaku display similar patterns for snowfall and bug fall (Figs. 370
13b and 14b). Maxima are seen on the southern slopes of Pu‘u Pōhaku and Pu‘u 371
Poli‘ahu. The maxima associated with the lateral ridges on the southwest slope of Pu‘u 372
Poli‘ahu are well defined. Pu‘u Wēkiu and Pu‘u Hau‘oki clearly show the effect that 373
wind direction and speed have on accumulation locations for both snow and bug fall 374
(Figs. 13b and 14b). Maxima on Pu‘u Wēkiu are seen on both the inner and outer eastern 375
slope and on either side of the ridge extending north from the pu‘u. The higher values on 376
the eastern slopes are the product of the higher westerly wind speeds observed in 2009. 377
The outer southern slope in both easterly and westerly winds accumulates maxima on 378
Pu’u Wēkiu. 379
380

Revised
4. Conclusions and Discussion 381
The summit of Mauna Kea is an Aeolian system, where nutrients primarily come 382
from matter being blown in from lower elevations. The cinder cone (pu’u) stippled 383
summit area affects local wind patterns and summit deposition of moisture and nutrients, 384
which is of great interest in understanding the life cycle, habitat, and distribution of the 385
Wēkiu Bug and other summit species. Pu'us protrude as much as 200 m above the 386
surrounding surface elevations, creating slope angles of ~30% grade. In general, winds 387
traveling up hills or pu'us and on the ridge are faster than those over flat terrain and 388
within the pu’u center. Wind that travels parallel to the slope gradient also experiences 389
increases in speed. On the down-slope sides, winds speeds tend to decelerate. As the 390
wind approaches the pu'us, it is forced around or over the pu'u. 391
For the summit of Mauna Kea winds with an easterly or northerly direction produce 392
the greatest acceleration in wind speed, especially on Pu’u Wēkiu, the largest cinder 393
cone. Consequently, the maxima in accumulated snow and dead bugs are seen on the lee 394
sides of ridges and crests where deposits are made as the wind falls below the thresholds 395
for suspension or saltation. Areas like Pu’u Haukea and Pu’u Poli’ahu have the greatest 396
snowfall accumulation on their southern outer slopes, with maxima occurring where the 397
parallel gradient curves. The summation of the years creates a smoother gradient of snow 398
along the slope, as the percentage of east to west winds between the two years becomes 399
comparable. 400
In this study it is suggested that the maximum bug-fall accumulation patterns are 401
governed by similar physics as snow transport, with allowance made for the fact that 402
dead bugs do not change phase. The modeled maxima in bug-fall accumulation is 403
Revised
located on the leeward sides of the pu‘us and the position of the maxima is controlled by 404
wind speed, much like that of the snowfall accumulation. The case study suggests that 405
the model may have a tendency to underestimate the wind speed and snow may actually 406
extend further down the slope on the leeward side. As expected, lower accumulation is 407
seen on the windward sides in areas of enhanced winds, where saltation and scouring are 408
active. 409
410
4.1 Specific conclusions 411
v The center depressions for the three main pu’us experience wind speeds that are 412
~40% slower than surrounding winds. 413
v Prevailing easterlies have maximum moisture and nutrient accumulations on the inner 414
eastern slope and the outer western slope on Pu‘u Wēkiu and the ridge extending 415
north from the pu’u. The highest nutrient concentrations are towards the upper 416
portion of the slope. Stronger winds cause nutrients to also accumulate on the outer 417
northwestern slope of Pu‘u Wēkiu. 418
v Prevailing westerlies allow for moisture and nutrients to collect along the inner 419
western slope of Pu‘u Wēkiu. Moisture and nutrient accumulation is the greatest on 420
the outer eastern slope of Pu‘u Wēkiu, with the nutrient maxima accumulating half 421
way up this side. Additionally, the eastern slope of the ridge extending from Pu‘u 422
Wēkiu traps nutrients on the upper portion of the slope. 423
v Pu‘u Pōhaku’s maxima of nutrients and moisture occur on the outer southern slope. 424
There is a second bug fall maxima on the western slope. 425
v Nutrient and moisture supplies on Pu‘u Haukea are the greatest on the outer southern 426

Revised
and southeastern slopes and the inner northwestern slope. 427
v Maximum moisture on Pu‘u Poli‘ahu is found continuously down the outer southern 428
slope. Nutrient accumulation occurs mainly on the upper section of the outer southern 429
slope. Down the inner northern slope, nutrient and moisture maxima occur. 430
v Nutrient accumulation on Pu‘u Hau‘oki is minimal, with moisture accumulation 431
occurring on the outer southern slope. 432
433
4.2 Discussion 434
The synoptic-scale winds on the summit are mainly controlled by the prevailing 435
surface high-pressure center that is located north of the Hawaiian Islands and the position 436
of the polar jet stream and its storm track, which shifts southward in winter. When the 437
high pressure dominates, the winds favor easterly directions, and when the jet stream 438
expands near Hawaii, the winds turn westerly. The location of both the high and the jet 439
are influenced by ENSO. On the local scale the variable terrain of the surface alters the 440
free atmosphere wind significantly. 441
The summit is an Aeolian system, where nutrients primarily come from matter 442
being blown to the summit from lower elevations. Areas of deposits differ with changing 443
wind speeds and directions. The strength of the wind is important in determining how 444
much snow and nutrient is carried and where it is eventually deposited. An increase in 445
wind speed increases the saltation and turbulent suspension and results in the moisture 446
and nutrient maxima to accumulate further down the slope of an associated pu'u. Slope 447
angle and aspect have primary effects on wind speed and direction, and subtle secondary 448
effects on the accumulation patterns. 449

Revised
The variables used to simulate incoming bug fall are hypothetical and are set at the 450
minimum solid precipitation value for the model to run. It is suggested that since wind is 451
the primary agent of debris transportation, climatological patterns for bug-fall 452
accumulation would likely follow the patterns seen in the model analysis presented here. 453
Limited bug-fall data suggest that the primary source for the bug fall is from the 454
tundra and brush areas just below the summit area and above the tree line, with some 455
additional bugs coming from agricultural areas further from the summit (Jesse Eiben, 456
personal communication). For modeling purposes, it was assumed that the background 457
bug fall from these areas was initially evenly distributed. Time-series data on bug fall 458
with analysis of the taxonomy and source of the bugs are not available. Comprehensive 459
bug-fall data are very time consuming and expensive to obtain. So at present there is no 460
way to validate the bug-fall model results quantitatively. Nevertheless, we argue that the 461
bug-fall results are of interest, because they provide a potentially useful guide to 462
entomologists in the field working to locate wēkiu bug populations. 463
The rotation of synoptic wind from prevailing easterlies (summer) to more variable 464
easterlies and westerlies (winter) affects accumulation patterns on the summit, with the 465
greatest differences occurring on Pu‘u Wēkiu. Western wind regimes deposit most 466
nutrients on the outer eastern slopes of the pu‘u, whereas, during easterly wind regimes 467
the outer western and the inner eastern slopes of Pu‘u Wēkiu accumulate the most 468
nutrients. Nutrients are found on the outer southern slope of Pu’u Wēkiu in both easterly 469
and westerly winds, and the wind flows along the slopes gradient. 470
Bug fall and snowfall fields show similar characteristics where accumulations 471
occur, but the fields are not exact replicas due to the different set of days used in the 472

Revised
integration. The bug fall accumulations were modeled using winds from the entire three-473
year period. For snowfall, only the winds that were present during snow events were 474
used to distribute snowfall on the summit. Also, sublimation and melting are ignored 475
when modeling bug fall; there are no losses to the maxima accumulations through phase 476
changes. Nutrient maxima occur in clumped areas, while snowfall accumulation areas 477
are more continuous down the slope. This clumping of maxima bug-fall areas may arise 478
from the uniform size distribution of the bug fall and the way in which cohesion and 479
friction velocities where calculated in the model. The constant 0°C air temperature used 480
during bug fall modeling resulted in a “stickier” surface, which may have promoted 481
clumping. 482
483
4.3 Relation to Wēkiu Bug Ecology 484
Several field surveys have helped to identify the locations favorable for Wēkiu Bug 485
habitat through various trapping techniques (Brenner, 2006; Englund et al., 2002; 486
Englund et al., 2009; Eiben and Rubinoff, 2010). Wēkiu Bugs have been recorded on the 487
west and northwest rim of Pu’u Haukea, in the flatter area between Pu’u Haukea and 488
Pu’u Poli’ahu, on the northern side of Pu’u Hau’oki and on the southern and eastern rim, 489
on the outer western slope of Pu’u Wēkiu, in the Pu’u Wēkiu center depression, on the 490
inner eastern slope of Pu’u Wēkiu, and on the outer eastern slope of Pu’u Wēkiu and the 491
ridge extending from the pu’u (Figs. 11-12). 492
The annual Wēkiu Bug field surveys led by Brenner (2006) from 2002 to 2006, 493
found the highest count of Wēkiu Bugs in the spring. These field surveys were 494
conducted on Pu‘u Hau‘oki and Pu‘u Wēkiu. The most sampling has been done on Pu‘us 495

Revised
Hau‘oki, Haukea, and Wēkiu. Englund et al. (2009) sampled a pu‘u around the Very 496
Long Baseline Array (VLBA) on Mauna Kea in both 2007 and 2008. The north side of 497
the pu‘u only positively observed one Wēkiu Bug between 2007 and 2008. The south 498
side positively observed eleven and nine Wēkiu Bugs in 2007 and 2008. The sample sites 499
on Pu‘us Hau‘oki, Haukea, Wēkiu had considerably more Wēkiu Bug activity than the 500
pu‘u by the VLBA. Englund et al. (2009) compiled Wēkiu Bug sample site data from 501
2001 to 2008 showing that 822 Wēkiu Bugs have been observed on Pu’u Haukea over 502
that 9-year period. 503
Englund et al. (2009) observed 537 Wēkiu Bugs using 42 traps located on Pu‘u 504
Haukea, Pu‘u Hau‘oki, Pu‘u Wēkiu, and surrounding the pu‘u by VLBA in 2007. The 505
traps for 2007 had a total trap day number of 252. In 2008, their observations of Wēkiu 506
Bugs were ~7x less than observed in 2007. In 2008, 30 traps in approximately the same 507
summit locations counted 70 Wēkiu Bugs. The 2008 study had a total trap day value of 508
120. 509
The model output shows that the locations of the Wēkiu Bug recordings and 510
trappings, except for the area between Pu‘u Haukea and Pu‘u Poli‘ahu and the center 511
depression of Pu‘u Wēkiu, receive high amounts of snowdrift over the winter season. The 512
locations that receive high snowdrifts also accumulate the highest density bug fall, except 513
for Pu‘u Hau‘oki. Bug fall accumulation is considerably less on Pu‘u Hau‘oki than Pu‘u 514
Haukea or Pu‘u Wēkiu. 515
The pu‘us are cinder cones and are made up of ash, lapilli, and cinder from 516
explosions that occurred on the summit. This combination of volcanic rock allows for 517
large interspatial areas between rocks to occur, a necessity for the Wēkiu Bug. The 518

Revised
majority of the land surrounding the pu’us is comprised of older hawaiite-mugearite lava 519
flows, which is primarily made up of ‘a’ā lava with large rough sections. The geological 520
make-up surrounding Pu‘u Pōhaku’s base is primarily glacial till, as well as the eastern 521
side of Pu‘u Wēkiu. The finer make up of glacial till is unsuitable for Wēkiu Bug life 522
(Englund et al., 2002; Eiben and Rubinoff, 2010). 523
The pu'us on the summit act to speed up and slow down winds, change their 524
direction, and thereby act as a trap for moisture and nutrients being blown on the summit. 525
Concurrently, the pu'us are, generally areas with high interstitial spaces (like cinder), 526
which is the preferred habitat for the Wēkiu Bug. The combination of moisture, 527
nutrients, and cinder substrate is presumably where the population of Wēkiu Bugs will be 528
found. Previous trapping locations support this suggestion (Figs. 11 and 12). It is hoped 529
that the results of the snow and bug-fall climatology presented in this paper will be of 530
value to entomologists and biologists in their efforts to better understand and characterize 531
the fragile ecology of the summit area of Mauna Kea. 532
533
5. Acknowledgements 534
Foremost, we are indebted to Dr. Glen Liston for give us access to his SnowModel and 535
for his helpful comments and support throughout this research. We are grateful to Sara da 536
Silva for help with data analysis tools. Thanks go to Ryan Lyman for his efforts in siting 537
and collecting the Davis weather station data. Ryan, along with Chris Chambers and 538
Matt Foster helped to collect case snow depth measurements. This research was 539
supported by the Office of Mauna Kea Management. 540

Revised
6. References 541
Anderson, E.A., 1976: A point energy and mass balance model of a snow cover. NOAA 542
Technical Report NWS-19, 150 pp. 543
Ashlock, P., and Gagne, W., 1983: A remarkable new Micropterous Nysius species from 544
the aeolian zone of Mauna Kea, Hawaii Island (Hemiptera: Lygaeidae). 545
International Journal of Entomology., 25: 47–55. 546
Barnes, S. L., 1973: Mesoscale objective analysis using weighted time-series 547
observations. NOAA Tech Memo. ERL NSSL-62, National Severe Storms 548
Laboratory, Norman, OK 73069, 60 pp. [NTIS-COM-73-10781]. 549
Bely, P.-Y., 1987: Weather and seeing on Mauna Kea. Publications of the Astronomical 550
Society of the Pacific., 99: 569–570. 551
Blumenstock, D.I., and Price, S., 1967: Climates of the States: Hawaii. Climatology of 552
the US, No. 60-51. US Department of Commerce, 27 p. 553
Cao, G., Giambelluca, T. W., Stevens, D. E., and Schroeder, T. A., 2007: Inversion 554
variability in the Hawaiian trade wind regime. Journal of Climate., 20: 1145–555
1160. 556
Conant, S., 2007: Memorandum: Climate variability and microscale ecology of Mauna 557
Kea study. [Between Mauna Kea Management Board and Wēkiu Bug Scientific 558
Advisory Committee]. 559
da Silva, S. C., 2006: Climatological analysis of meteorological observations at the 560
summit of Mauna Kea. OMKM Technical Report, Dept. of Meteorology, 561
University of Hawaii at Mānoa, 77 pp. [Available at: 562
www.mkwc.ifa.hawaii.edu/archive.] 563

Revised
da Silva, S. C., 2012: High altitude climate of the Island of Hawai’i. MS Thesis, Dept. of 564
Meteorology, University of Hawaii at Mānoa, 110 pp. [Available at 565
http://www.soest.hawaii.edu/MET/Faculty/businger/highlights.html.] 566
Eiben, J., and Rubinoff, D., 2010: Life history and captive rearing of the Wēkiu bug 567
(Nysius Wēkiuiucola, Lygaeidae), an alpine carnivore endemic to the Mauna Kea 568
volcano of Hawaii. Journal of Insect Conservation.,14: 701–709. 569
Englund, R. A., Polhemus, D. A., Howarth, F. G., and Montgomery, S. L., 2002: Range, 570
habitat, and ecology of the Wēkiu Bug (Nysius Wēkiuicola), a rare insect species 571
unique to Mauna Kea, Hawaii Island. Report prepared for Office of Mauna Kea 572
Management, University of Hawaii at Hilo, 200 W. Kawili Street, Hilo, HI 573
96720. 574
-----, Preston, D. J., Vorsin, A. E., Evenhuis, N. L., Myers, S., and Englund, L. L., 2009: 575
Results of the 2007-2008 alien arthropod species and Wēkiu bug monitors on 576
Mauna Kea, Hawaii Island. Hawaii Biological Survey final report prepared for 577
Office of Mauna Kea Management, University of Hawaii at Hilo, 200 W. Kawili 578
Street, Hilo, HI 96720. 579
Ehses, J., 2007: GIS-gestützte Abschätzung möglicher Permafrostvorkommen am Mauna 580
Kea, Hawaii, mittels klimageographischer Modellierung. M.A. Thesis, 581
Department of Geography and Climate, Rheinisch-Westfälische Technische 582
Hochschule University – Aachen, 106 pp. 583
Fish and Wildlife Service, 2010: Endangered and Threatened Wildlife and Plants; 584
Review of Native Species That are Candidates for Listing as Endangered or 585
Threatened; Annual Notice of Findings on Resubmitted Petitions; Annual 586

Revised
Description of Progress on Listing Action. 50 CFR Part 17 [Docket No. FWS-587
R9-ES-2010-0065;MO-9221050083-B2]. 588
Greene, E. M., Liston, G. E., and Pielke, R. A., Sr., 1999: Simulation of above treeline 589
snowdrift formation using a numerical snow-transport model. Cold Regions 590
Science and Technology, 30: 135–144. 591
Group 70 International, 2000: Mauna Kea Science Reserve Master Plan: A final 592
environmental impact statement Master Plan. Report prepared for Research 593
Corporation of the University of Hawai’i by Group 70 International, 925 Bethel 594
Street, 5th Floor. Honolulu, HI 96813. 595
Jackson, P. S and Hunt, J. C. R., 1975: Turbulent wind flow over a low hill. Quarterly 596
Journal of the Royal Meteorological Society, 101: 929–955. 597
Kind, R. J., 1981: Snow drifting. Handbook of Snow, Principles, Processes, 598
Management, and Use. D.M. Gray and D.H. Male, Editors, Pergamon Press, p. 599
338-359. 600
Koch, S. E., DesJardins, M., and Kocin, P. J., 1983: An interactive Barnes objective map 601
analysis scheme for use with satellite and conventional data. Journal of Climate 602
and Applied Meteorology, 22: 1487–1503. 603
Kosugi, K., Nishimura, N., and Maeno, N., 1992: Snow ripples and their contribution to 604
the mass transport in drifting snow. Boundary Layer Meteorology, 59: 59-66. 605
Kodama, K. R., and Businger, S., 1998: Weather and forecasting challenges in the Pacific 606
region of the National Weather Service. Weather and Forecasting., 13: 523–546. 607

Revised
Liston, G. E., Haehnel, R. B., Sturm, M., Hiemstra, C. A., Berezovskaya, S., and Tabler, 608
R. D., 2007: Simulating complex snow distributions in windy environments 609
using SnowTran-3D. Journal of Glaciology, 53, 241-256. 610
-----, and Elder, K., 2006a: A meteorological distribution system for high-resolution 611
modeling (MicroMet). Journal of Hydrometeorology., 7: 217–234. 612
-----, and Elder, K., 2006b: A distributed snow-evolution modeling system 613
(SnowModel). Journal of Hydrometeorology., 7: 1259–1276. 614
-----, Haehnel, R. B., Sturm, M., Hiemstra, C. A., Berezovskaya, S., and Tabler, R. D., 615
1998: Instruments and methods, Simulating complex snow distributions in windy 616
environments using SnowTran-3D. Journal of Glaciology, 53: 241–256. 617
-----, and Sturm, M., 1998: A snow-transport model for complex terrain. Journal of 618
Glaciology., 44: 498–516. 619
-----, and -----, 2002: Winter precipitation patterns in arctic Alaska determined from a 620
blowing snow model and snow-depth observations. Journal of 621
Hydrometeorology, 3: 646–659. 622
-----, and -----, 2006: A meteorological distribution system of high-resolution terrestrial 623
modeling (MicroMet). Journal of Hydrometeorology, 7: 217–234. 624
-----, Winther, J.-G., Bruland, O., Elvehoy, H., Sand, K., and Karlof, L., 2000: Snow and 625
blue-ice distribution patterns on the coastal Antarctic ice sheet. Antarctic 626
Science, 12: 69–79. 627
Pomeroy, J. W., and Gray, D. M., 1990: Saltation of snow. Water Resources Research, 628
26: 1583–1594. 629
Revised
Porter, S. C., 1997: Late Pleistocene eolian sediments related to pyroclastic eruptions of 630
Mauna Kea Volcano, Hawaii. Quaternary Research., 47: 261–276. 631
Prasad, R., Tarboton, D. G., Liston, G. E., Luce, C. H., and Seyfried, M. S., 2001: 632
Testing a blowing snow model against distributed snow measurements at Upper 633
Creek, Idaho, United States of America. Water Resources Research, 37: 1341–634
1350. 635
Swan, L., 1963: Aeolian zone. Science, 140: 77–78. 636
Schmidt, R. A, 1982: Vertical profiles of wind speed, snow concentration, and humidity 637
in blowing snow. Boundary Layer Meteorology, 23: 223–246. 638
Sustainable Resources Group International, Inc., 2009: Natural resources management 639
plan for the UH management areas on Mauna Kea: A sub-plan of the Mauna Kea 640
Comprehensive Management Plan. Prepared by the Sustainable Resources Group 641
Internationals, Inc.,111 Hekili Street, Suite A373, Kailua, HI, 98734. 642
Ugolini, F. C., 1974: Hydrothermal origins of the clays from the upper slopes of Mauna 643
Kea, Hawaii. Clay and Clay Minerals, 22: 189–194. 644
Whiteman, C. D., 2000: Mountain Meteorology—Fundamentals and Applications. New 645
York: Oxford University Press. 646
Wolfe, E. W., Wise, W. S., and Dalrymple, G. B., 1997: The geology and petrology of 647
Mauna Kea Volcano, Hawaii – A study of post shield volcanism. U.S. 648
Geological Survey Professional Paper, 1557, pp. 143. 649
Woodcock, A. H., 1974: Permafrost and climatology of a Hawaii volcano crater. Arctic 650
and Alpine Research, 6: 49–62. 651

Revised
Worthley, L. E., 1967: Weather phenomena in Hawaii. Part 1. Synoptic climatology of 652
Hawaii. Hawaii Institute of Geophysics, University of Hawaii, 40 pp. [Available 653
from Dept. of Meteorology, University of Hawaii, 2525 Correa Rd., Honolulu, 654
HI 96822.] 655
656

Revised
7. Tables 657
658
TABLE 1
Station Lat (N) Long. (W) Elev. (m)
T (°C)
RH (%)
WS (m/s)
WD (°)
Precip. (mm/hr) Valid Dates
MKD Hau'oki 19.8267 -155.4753 4138 X X X X X
01/2008 – 03/2009 05/2009 – 07/2009 10/2009 - 7/2010
MKD Wekiu 19.8192 -155.4697 4153 X X X X X
01/2008 04/2008 – 04/2009 09/2009 -03/2010 05/2010- 07/2010
MKD Kea 19.8261 -155.4683 4168 X X X X X 01/2008 – 01/2009 MKD Pohaku 19.8253 -155.4900 4003 X X X X X 01/2008 – 04/2008 UH88 19.8230 -155.4694 4214 X X X X X 01/2008 – 01/2011
CFHT 19.8253 -155.4688 4204 X X X X 01/2008 – 07/2009 09/2009 – 01/2011
JCMT 19.8228 -155.4770 4075 X X X X 05/3008 – 01/2011 UKIRT 19.8224 -155.4703 4199 X X X X 01/2008 – 01/2011
SUBARU 19.8255 -155.4760 4163 X X X X X 01/2008 – 02/2008 05/2008 – 01/2011
VLBA 19.8014 -155.4555 4077 X X X X X 01/2008 – 01/2011 IRTF 19.8262 -155.4720 4168 X X X X 01/2008 – 01/2011
SMA 19.8242 -155.4782 4080 X X X X X
01/2008 – 03/2008 05/2008 – 12/2008 07/2010 – 01/2011
659 660 Table 1: Weather stations and their locations, elevations, recorded variables, and valid 661
dates for this study. Abreviations in the table include: Mauna Kea Davis stations (MKD), 662
University of Hawaii 88” Telescope (UH88), Canada, France, Hawaii Telescope (CFHT), 663
United Kingdom Infra Red Telescope (UKIRT), James Clark Maxwell Telescope 664
(JCMT), Very Long Baseline Array (VLBA), Infra Red Telescope Facility (IRTF), and 665
Sub-Millimeter Array (SMA). 666
667

Revised
668
7. Figures 669
670 671
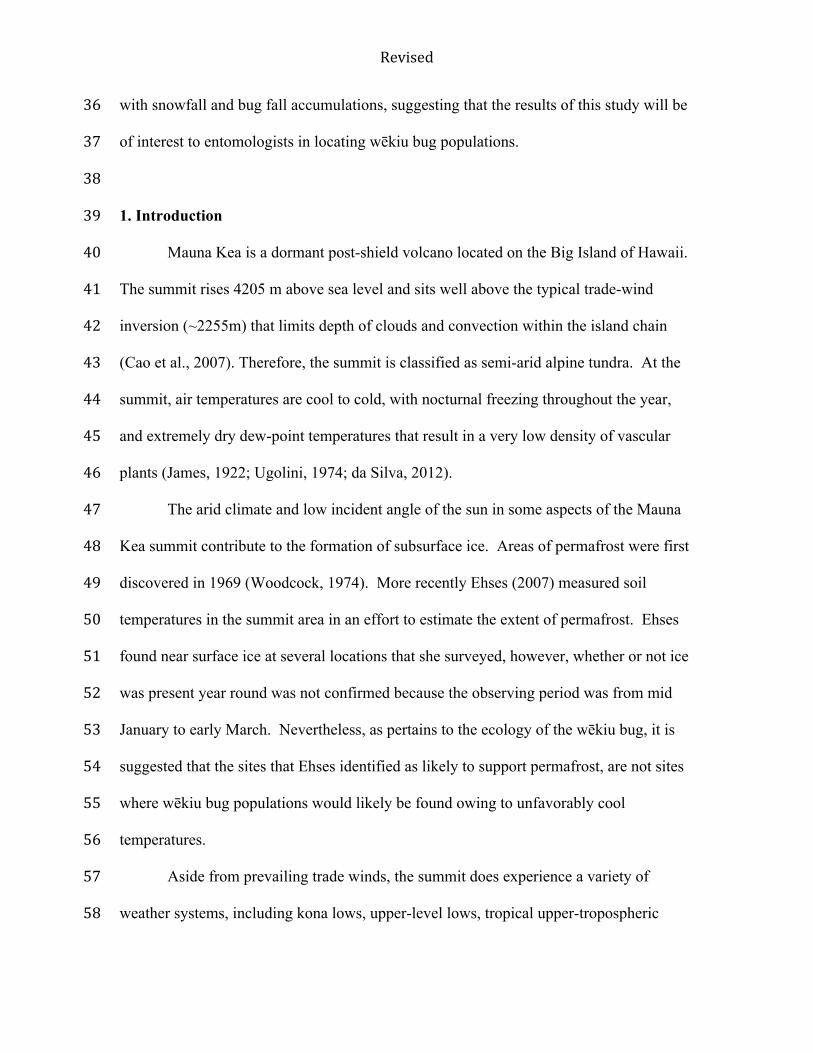
FIGURE 1. Time series of summit precipitation (mm) from listed weather stations and 672 average daily temperature (°C, in red) from the United Kingdom Infra-Red Telescope 673 (UKIRT) for a) 2008; b) 2009. 674 675 676

Revised
677
678 679 FIGURE 2. Study area spans from 19.808 N to 19.837 N and -155.495 W to -155.455W, 680 a 140400 m2 area. Plotted are locations of Davis weather stations (red) and telescope 681 weather stations (blue). See Table 1 for locations and definitions of acronyms. 682 683 684
Revised
685 686 FIGURE 3. Key features of the snow-‐transport model (after Liston et al., 2007) 687 688 689

Revised
690 691
692 693 FIGURE 4. Field experiment on 11 JANUARY 2011; a) Pu‘u Hau‘oki during field 694 experiment, taking snow depth measurements (Photo by C.R.S. Chambers); b) ruler 695 showing depth in cm (Photo by L. Eaton). 696 697 698
Revised
699
700 701
702 FIGURE 5. Mauna Kea summit a) average hourly temperatures and b) average daily 703 wind speed for 8-14 January 2011. c) Precipitation time series for 12 UTC 09 January to 704 2300 UTC 11 JANUARY 2011. d) Wind rose plot of Mauna Kea summit wind speeds 705 and directions from 1000 UTC 09 January to 0900 UTC 11 JANUARY 2011. 706 707 708

Revised
709
710 711
FIGURE 5. continued Mauna Kea summit c) Precipitation from 1200 UTC 09 January to 712 2300 UTC 11 JANUARY 2011. d) Wind rose plot of Mauna Kea summit wind speeds 713 and directions from 1000 UTC 09 January to 0900 UTC 11 JANUARY 2011. 714 715 716

Revised
717 718 FIGURE 6. a) Pu‘u Hau‘oki and b) Pu‘u Wēkiu modeled snow depth (color contours) for 719 0959 UTC 11 January 2011; snow depth observations (colored dots) between 2130 UTC 720 11 January and 0000 UTC 12 January 2011. 721 722 723

Revised
724
725 726 FIGURE 7. Wind rose of winds during snow events only for a) 2008 and b) 2009. 727 728 729

Revised
730 731 732 FIGURE 8. Wind rose for all Mauna Kea summit winds during for January 2008 through 733 December 2010. 734 735

Revised
736 737
738 739 740
FIGURE 9. Modeled wind speed (m s-1) from cardinal wind fields: a) east, b) west. 741 742

Revised
743 744 745
FIGURE 10. Modeled wind direction from cardinal wind fields: a) east, b) west. 746 747

Revised
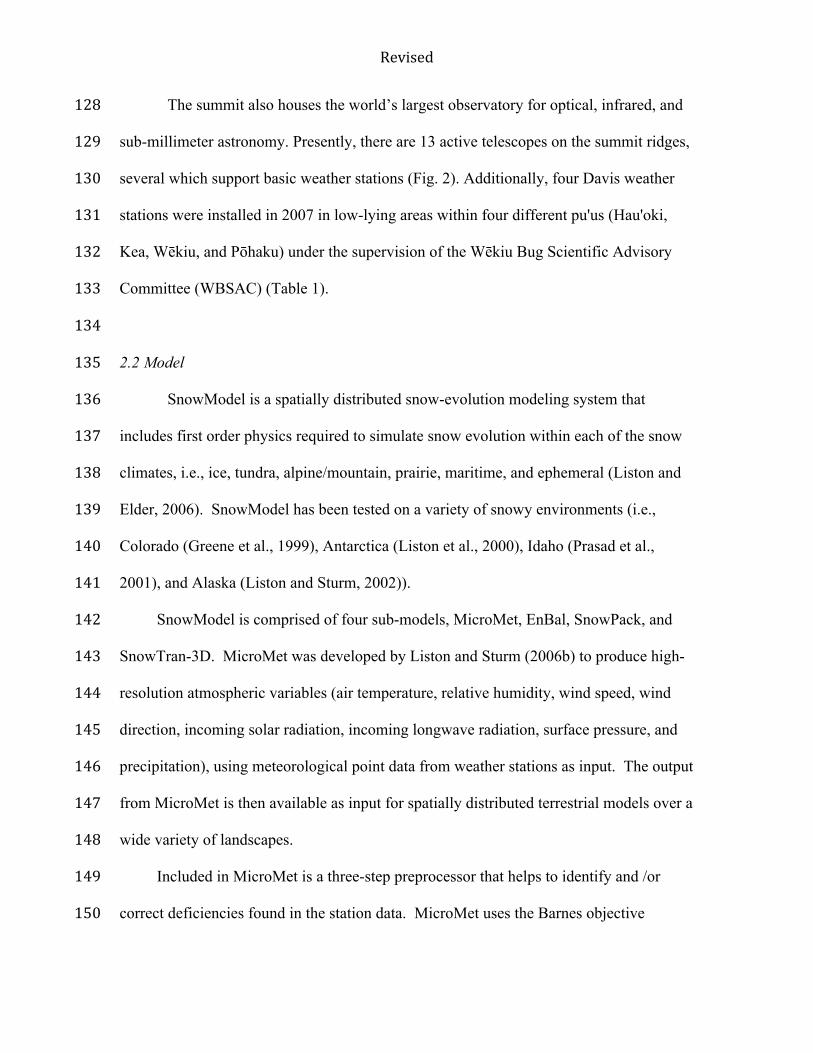
748 749 FIGURE 11. Modeled snow depth (in m, shading) and elevation (white contours) of 750 Mauna Kea summit for the 2-year total from 2008-2009, and Wēkiu Bug trap locations 751 from 2002-2008 with positive capture rates (yellow boxes), permafrost locations (white 752 circles). Red lines indicate roads and dark shading indicates areas of lava flows and 753 glacial till found to be unsuitable as wēkiu bug habitat. 754 755 756

Revised
H757
758 759 FIGURE 12. As in Fig. 11, but for modeled bug fall density (undefined relative scale, 760 colored shading) on Mauna Kea for 3-year total from 2008 through 2010. 761 762 763
Revised
764
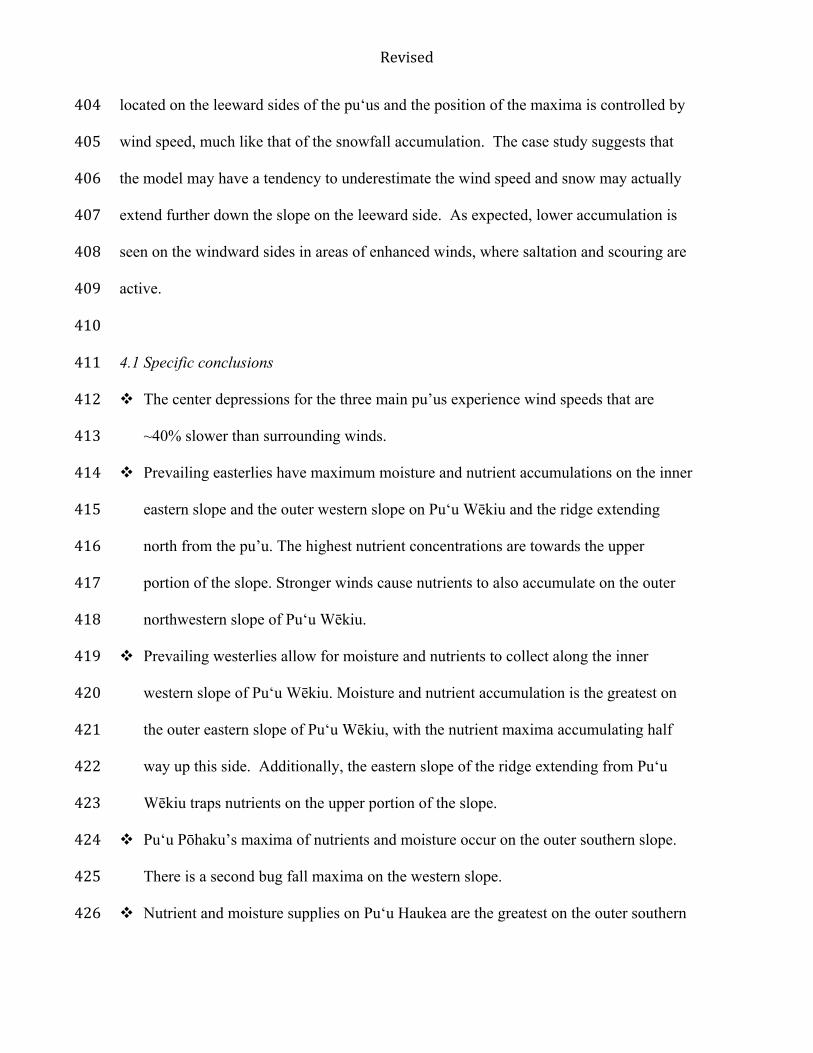
765
766 767 FIGURE 13. Same as Fig. 11 but with elevation contours in red, but for a) Pu‘u Haukea; 768 b) Pu‘u Pōhaku and Pu‘u Poli‘ahu; and c) Pu‘u Hau‘oki and Pu‘u Wēkiu. 769 770

Revised
771
772
773 774 FIGURE 14. Same as Fig. 12 but for a) Pu‘u Haukea; b) Pu‘u Pōhaku and Pu‘u Poli‘ahu; 775 and c) Pu‘u Hau‘oki and Pu‘u Wēkiu. 776 777