Using a Nuclear Elemental Static Sample Analyzer to...
16
Using a Nuclear Elemental Static Sample Analyzer to Optimize the Operation of a Preparation Plant Steve Foster Vice President Product Development; SABIA, Inc. Abstract A large coal preparation plant in West Virginia is using a SABIA Model L-2000 to analyze the ash levels in product as it leaves the plant in order to adjust the circuits in real time and optimize the plant output. Operating at nearly 4M tons of coal per year the site delivers both steam and metallurgical coal to customers in the United States and around the world. The static sample analyzer, which delivers a sulfur and ash analysis in 15 minutes or less on one-gallon samples is being used to give the customer a quicker turn around on prep plant adjustments as the coal ash levels vary coming out of the prep plant. This paper takes a look at both the economics as well as application details and the difference this analyzer could make for the operation. ** Nuclear Elemental Analyzers as defined for the purposes of this paper includes those analyzers that measure the individual elements of the periodic table. For example, Ash is determined by adding the sum of the individually measured constituents of Ash, i.e., Silicon, Iron, Calcium, Aluminum, Potassium, Titanium, etc… Introduction What is a static sample analyzer? How they work The installation and application Using the data Some Do’s and Don’ts Looking ahead Summary Introduction The coal company has multiple modern mining complexes located in southern West Virginia, eastern Kentucky and southern Virginia, utilizing underground room and pillar mining as well as underground longwall and surface and highwall mining. These mining systems include hundreds of miles of belt structure. These operations sell high-quality, low sulfur coal for electric generation, steel making and industrial application. Overall the company has over a dozen state-of-the-art preparation plants, processing raw coal at a combined rated capacity nearly 20,0000 tons per hour. The processing plant operates at nearly 4M tons of coal per year. The site delivers both steam and metallurgical coal to customers in the United States and around the world. The static sample analyzer, which delivers a sulfur and ash analysis measurement in 15 minutes or less on one-gallon samples is being used to give the customer a quicker turn around on prep plant adjustments as the coal ash levels vary coming out of the prep plant.
Transcript of Using a Nuclear Elemental Static Sample Analyzer to...
Using a Nuclear Elemental Static Sample Analyzer to Optimize the Operation
of a Preparation Plant
Steve Foster Vice President Product Development; SABIA, Inc.
Abstract
A large coal preparation plant in West Virginia is using a SABIA Model L-2000 to analyze the ash levels in product as it leaves the plant in order to adjust the circuits in real time and optimize the plant output. Operating at nearly 4M tons of coal per year the site delivers both steam and metallurgical coal to customers in the United States and around the world. The static sample analyzer, which delivers a sulfur and ash analysis in 15 minutes or less on one-gallon samples is being used to give the customer a quicker turn around on prep plant adjustments as the coal ash levels vary coming out of the prep plant. This paper takes a look at both the economics as well as application details and the difference this analyzer could make for the operation. ** Nuclear Elemental Analyzers as defined for the purposes of this paper includes those analyzers that measure the individual elements of the periodic table. For example, Ash is determined by adding the sum of the individually measured constituents of Ash, i.e., Silicon, Iron, Calcium, Aluminum, Potassium, Titanium, etc… Introduction What is a static sample analyzer? How they work The installation and application Using the data Some Do’s and Don’ts Looking ahead Summary
Introduction
The coal company has multiple modern mining complexes located in southern West Virginia, eastern Kentucky and southern Virginia, utilizing underground room and pillar mining as well as underground longwall and surface and highwall mining. These mining systems include hundreds of miles of belt structure. These operations sell high-quality, low sulfur coal for electric generation, steel making and industrial application. Overall the company has over a dozen state-of-the-art preparation plants, processing raw coal at a combined rated capacity nearly 20,0000 tons per hour.
The processing plant operates at nearly 4M tons of coal per year. The site delivers both steam and metallurgical coal to customers in the United States and around the world. The static sample analyzer, which delivers a sulfur and ash analysis measurement in 15 minutes or less on one-gallon samples is being used to give the customer a quicker turn around on prep plant adjustments as the coal ash levels vary coming out of the prep plant.
What is a Static Sample Analyzer?
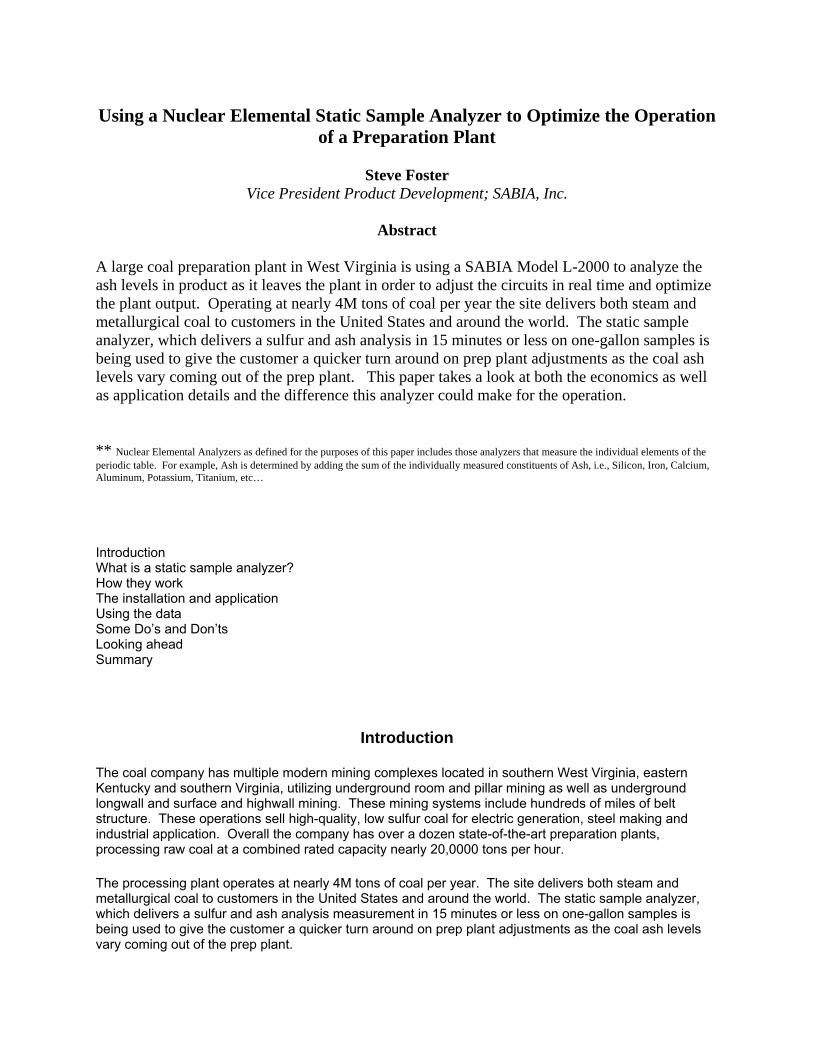
As a result of the pioneering work of Bob Stewart at the Bureau of Mines in the 1970’s and further research under grants from the federal government and from EPRI in the 1970’s and 1980’s it became possible to introduce a commercially viable nuclear elemental analyzer in the mid-1980’s. The technology uses a technique known as prompt gamma neutron activation (PGNA). In this process a spontaneous fissioning nuclear source such as Californium 252 is used to bombard a sample to be analyzed with massive quantities of neutrons – several hundred thousand per second. In turn, the elemental atoms in the sample capture a large number of the incident neutrons. These atoms become unstable but quickly re-stabilize by emitting an array of gamma energies. Since each element emits a unique set of gamma energies, spectral analysis identifies which elements are in the material. As a true elemental analysis technology, it can measure on-line and in real time the quantities Silicon, Calcium Aluminum, Iron, Titanium, Magnesium, Potassium, Sodium, and Sulfur, as well as Chlorine, Nitrogen, and Hydrogen. The first successful version of these instruments was “chute-type” analyzers that required a gravity-feed of the producer’s crushed quarry materials from the top of the unit onto an exit conveyor underneath the unit and now is available as a laboratory instrument that quickly gives sulfur, ash, moisture, BTU and SO2 in 15 minutes with no sample preparation. A lab version of the technology is shown below:
Figure 1. The Static Sample Analyzer
In this model the sample is placed in a 1-gallon pitcher, the kind available at the local Wal-Mart, and then the pitcher is placed in the drawer for insertion into the nuclear analyzers. The operator presses a button on the analyzer display keyboard and the analysis process begins with results appearing in 10 to 15 minutes.
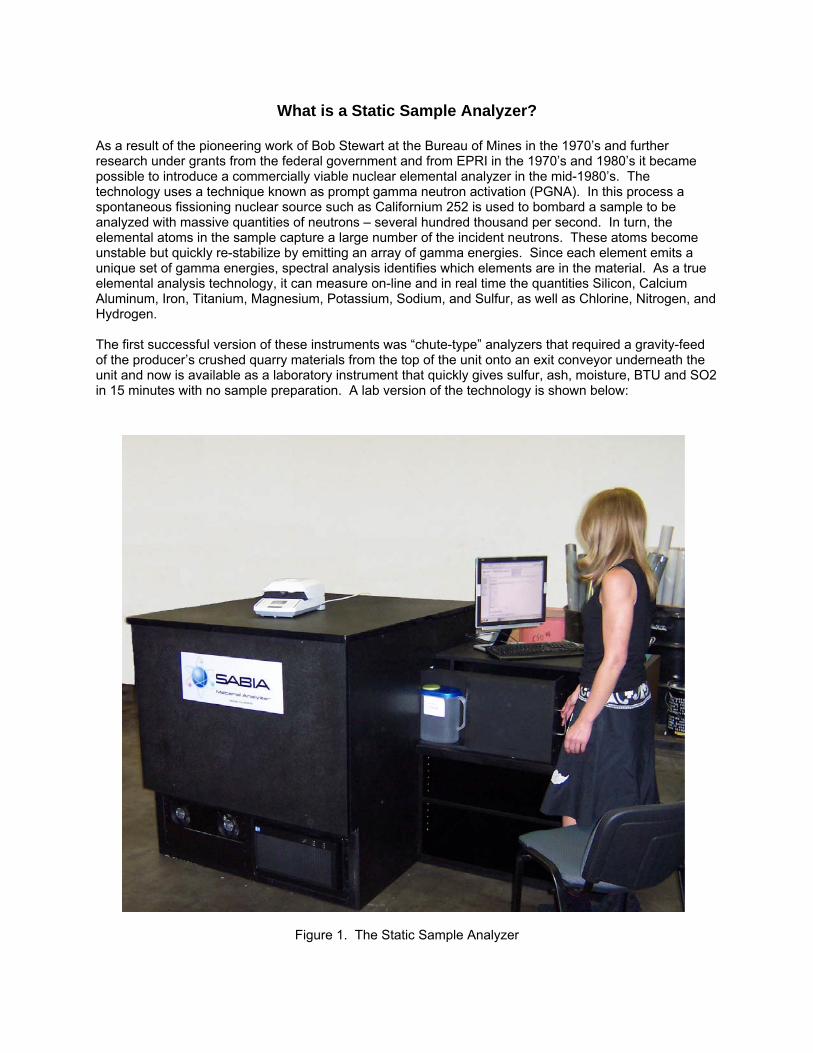
How They Work Basic Principles When a bulk material such as cement is bombarded with thermal neutrons, (<1 electron volt neutron energy), from a Californium 252 nuclear source, many of the neutrons are captured by elemental atoms within the cement. When this happens the atom becomes temporarily unstable. In order to re-stabilize the atom sheds a spectrum of high-energy gamma rays. The specific energies of gamma rays given off are a unique set for each of the elements within the periodic table. This principle makes it possible to create a signal to enable the on-line elemental analysis of cement possible with PGNA. Obtaining and Processing the Signal In order to create an electronic signal used for the determination of the weight percent of the elements of interest within the cement the unique elemental signature gamma rays resulting from the capture of neutrons by elemental atoms are detected by a scintillating crystal such as Sodium Iodide (NaI). As the gamma rays penetrate the detector they deposit their energy as high-speed electrons within the crystal. These electrons create ionization, which can be detected as UV light pulses. The light pulses are in turn detected by photo-multiplier tubes (a vacuum tube electronic component operating at a high voltage, typically 500 to 1000 VDC) and turned into electrical pulses which are immediately amplified, shaped and then converted into digital signals, and collected into a spectrum over some predetermined period of time (typically one minute) which can then be processed by a computer at very high speeds. Nucleus of Nucleus of Nucleus of Elemental Thermal Stable Elemental Excited Elemental Atom Stabilized by Neutron Atom Atom with Captured Release of Gamma Spectrum Neutron Neutron still captured inside
γ
Figure 2. The Nuclear Physics of PGNAA
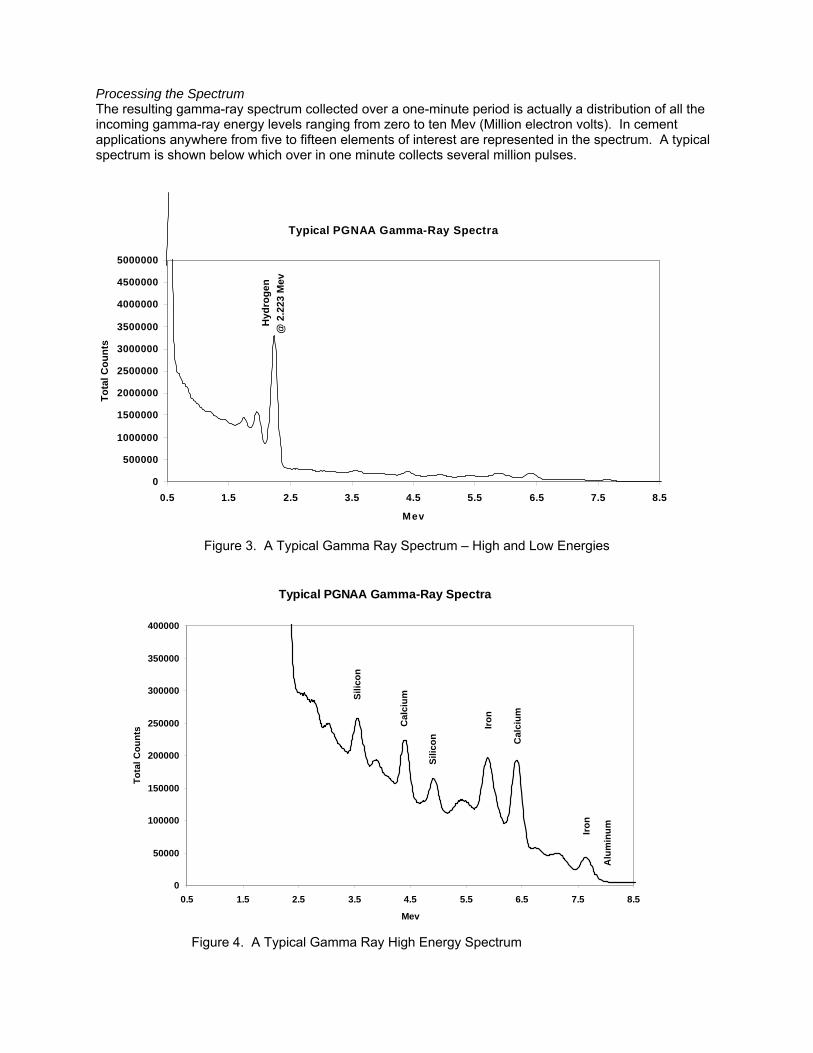
Processing the Spectrum The resulting gamma-ray spectrum collected over a one-minute period is actually a distribution of all the incoming gamma-ray energy levels ranging from zero to ten Mev (Million electron volts). In cement applications anywhere from five to fifteen elements of interest are represented in the spectrum. A typical spectrum is shown below which over in one minute collects several million pulses.
Typical PGNAA Gamma-Ray Spectra
0
500000
1000000
1500000
2000000
2500000
3000000
3500000
4000000
4500000
5000000
0.5 1.5 2.5 3.5 4.5 5.5 6.5 7.5 8.5
Mev
Tota
l Cou
nts
Hyd
roge
n @
2.2
23 M
ev
Figure 3. A Typical Gamma Ray Spectrum – High and Low Energies
Typical PGNAA Gamma-Ray Spectra
0
50000
100000
150000
200000
250000
300000
350000
400000
0.5 1.5 2.5 3.5 4.5 5.5 6.5 7.5 8.5
Mev
Tota
l Cou
nts
Alu
min
um
Silic
on
Cal
cium
Iron
Cal
cium
Iron
Silic
on
Figure 4. A Typical Gamma Ray High Energy Spectrum
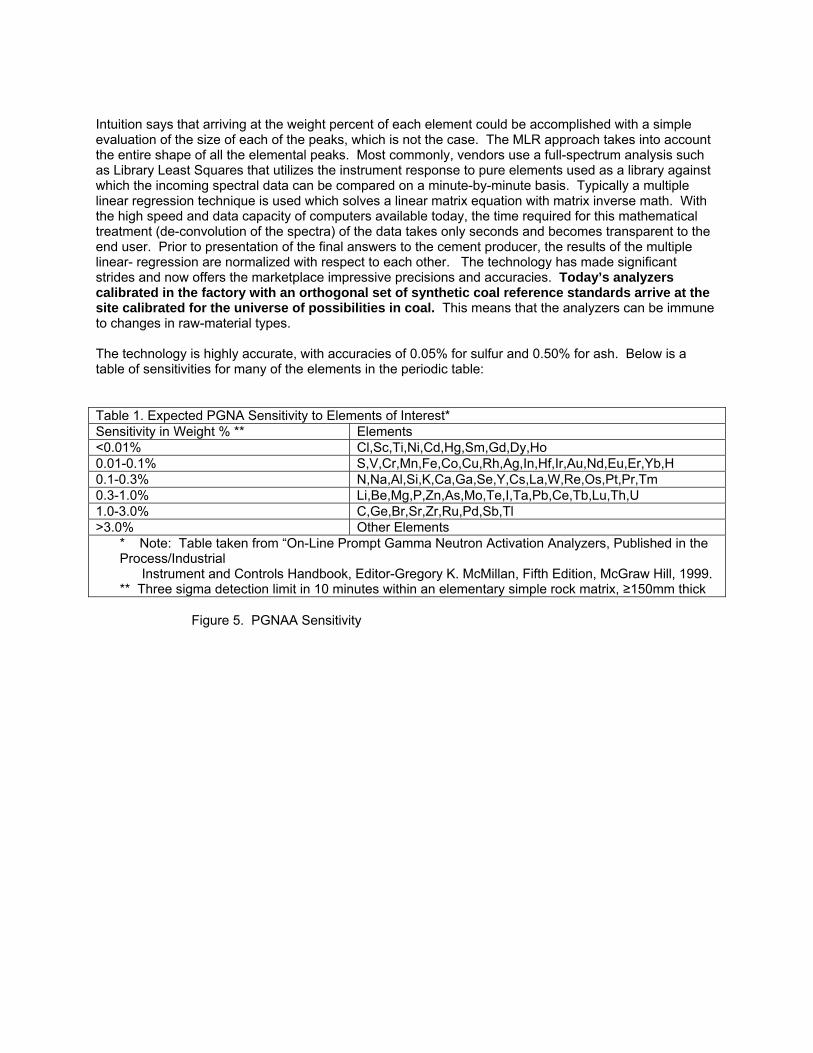
Intuition says that arriving at the weight percent of each element could be accomplished with a simple evaluation of the size of each of the peaks, which is not the case. The MLR approach takes into account the entire shape of all the elemental peaks. Most commonly, vendors use a full-spectrum analysis such as Library Least Squares that utilizes the instrument response to pure elements used as a library against which the incoming spectral data can be compared on a minute-by-minute basis. Typically a multiple linear regression technique is used which solves a linear matrix equation with matrix inverse math. With the high speed and data capacity of computers available today, the time required for this mathematical treatment (de-convolution of the spectra) of the data takes only seconds and becomes transparent to the end user. Prior to presentation of the final answers to the cement producer, the results of the multiple linear- regression are normalized with respect to each other. The technology has made significant strides and now offers the marketplace impressive precisions and accuracies. Today’s analyzers calibrated in the factory with an orthogonal set of synthetic coal reference standards arrive at the site calibrated for the universe of possibilities in coal. This means that the analyzers can be immune to changes in raw-material types. The technology is highly accurate, with accuracies of 0.05% for sulfur and 0.50% for ash. Below is a table of sensitivities for many of the elements in the periodic table: Table 1. Expected PGNA Sensitivity to Elements of Interest* Sensitivity in Weight % ** Elements <0.01% Cl,Sc,Ti,Ni,Cd,Hg,Sm,Gd,Dy,Ho 0.01-0.1% S,V,Cr,Mn,Fe,Co,Cu,Rh,Ag,In,Hf,Ir,Au,Nd,Eu,Er,Yb,H 0.1-0.3% N,Na,Al,Si,K,Ca,Ga,Se,Y,Cs,La,W,Re,Os,Pt,Pr,Tm 0.3-1.0% Li,Be,Mg,P,Zn,As,Mo,Te,I,Ta,Pb,Ce,Tb,Lu,Th,U 1.0-3.0% C,Ge,Br,Sr,Zr,Ru,Pd,Sb,Tl >3.0% Other Elements
* Note: Table taken from “On-Line Prompt Gamma Neutron Activation Analyzers, Published in the Process/Industrial Instrument and Controls Handbook, Editor-Gregory K. McMillan, Fifth Edition, McGraw Hill, 1999. ** Three sigma detection limit in 10 minutes within an elementary simple rock matrix, ≥150mm thick
Figure 5. PGNAA Sensitivity
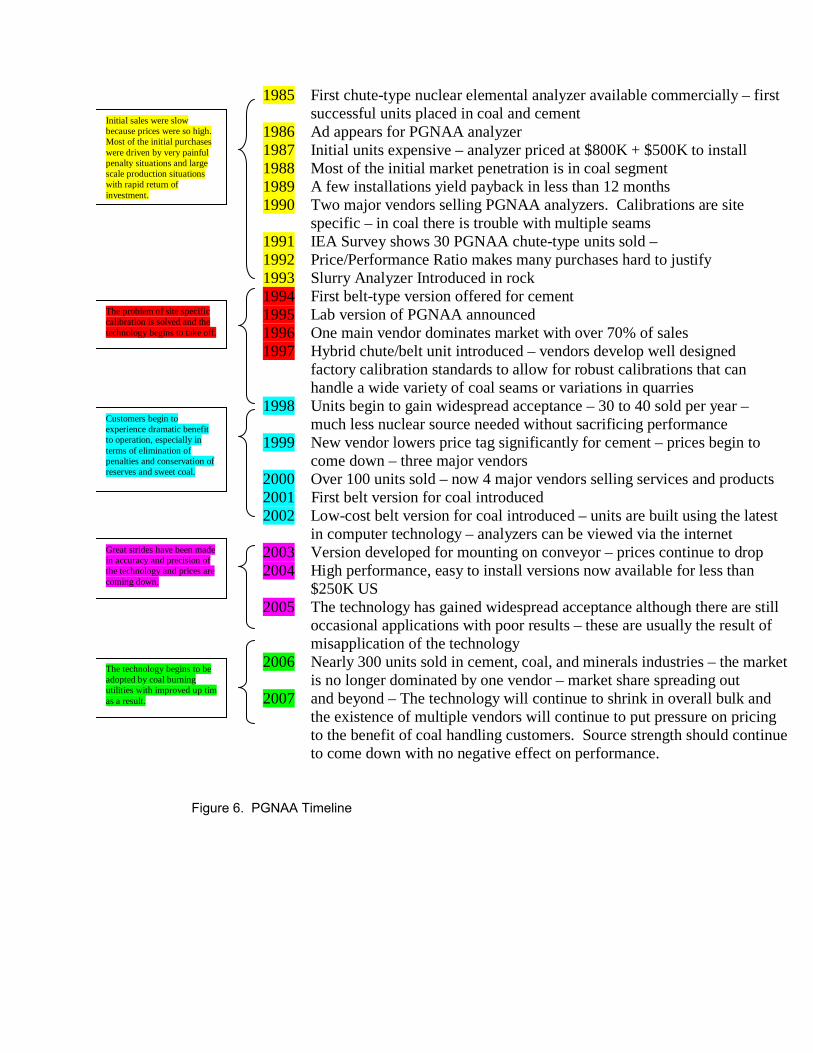
1985 First chute-type nuclear elemental analyzer available commercially – first successful units placed in coal and cement
1986 Ad appears for PGNAA analyzer 1987 Initial units expensive – analyzer priced at $800K + $500K to install 1988 Most of the initial market penetration is in coal segment 1989 A few installations yield payback in less than 12 months 1990 Two major vendors selling PGNAA analyzers. Calibrations are site specific – in coal there is trouble with multiple seams 1991 IEA Survey shows 30 PGNAA chute-type units sold – 1992 Price/Performance Ratio makes many purchases hard to justify 1993 Slurry Analyzer Introduced in rock 1994 First belt-type version offered for cement 1995 Lab version of PGNAA announced 1996 One main vendor dominates market with over 70% of sales 1997 Hybrid chute/belt unit introduced – vendors develop well designed factory calibration standards to allow for robust calibrations that can handle a wide variety of coal seams or variations in quarries 1998 Units begin to gain widespread acceptance – 30 to 40 sold per year – much less nuclear source needed without sacrificing performance 1999 New vendor lowers price tag significantly for cement – prices begin to
come down – three major vendors 2000 Over 100 units sold – now 4 major vendors selling services and products 2001 First belt version for coal introduced 2002 Low-cost belt version for coal introduced – units are built using the latest in computer technology – analyzers can be viewed via the internet 2003 Version developed for mounting on conveyor – prices continue to drop 2004 High performance, easy to install versions now available for less than
$250K US 2005 The technology has gained widespread acceptance although there are still occasional applications with poor results – these are usually the result of misapplication of the technology 2006 Nearly 300 units sold in cement, coal, and minerals industries – the market
is no longer dominated by one vendor – market share spreading out 2007 and beyond – The technology will continue to shrink in overall bulk and
the existence of multiple vendors will continue to put pressure on pricing to the benefit of coal handling customers. Source strength should continue to come down with no negative effect on performance.
Initial sales were slow because prices were so high. Most of the initial purchases were driven by very painful penalty situations and large scale production situations with rapid return of investment.
The problem of site specific calibration is solved and the technology begins to take off.
Customers begin to experience dramatic benefit to operation, especially in terms of elimination of penalties and conservation of reserves and sweet coal.
Great strides have been made in accuracy and precision of the technology and prices are coming down.
The technology begins to be adopted by coal burning utilities with improved up tim as a result.
Figure 6. PGNAA Timeline
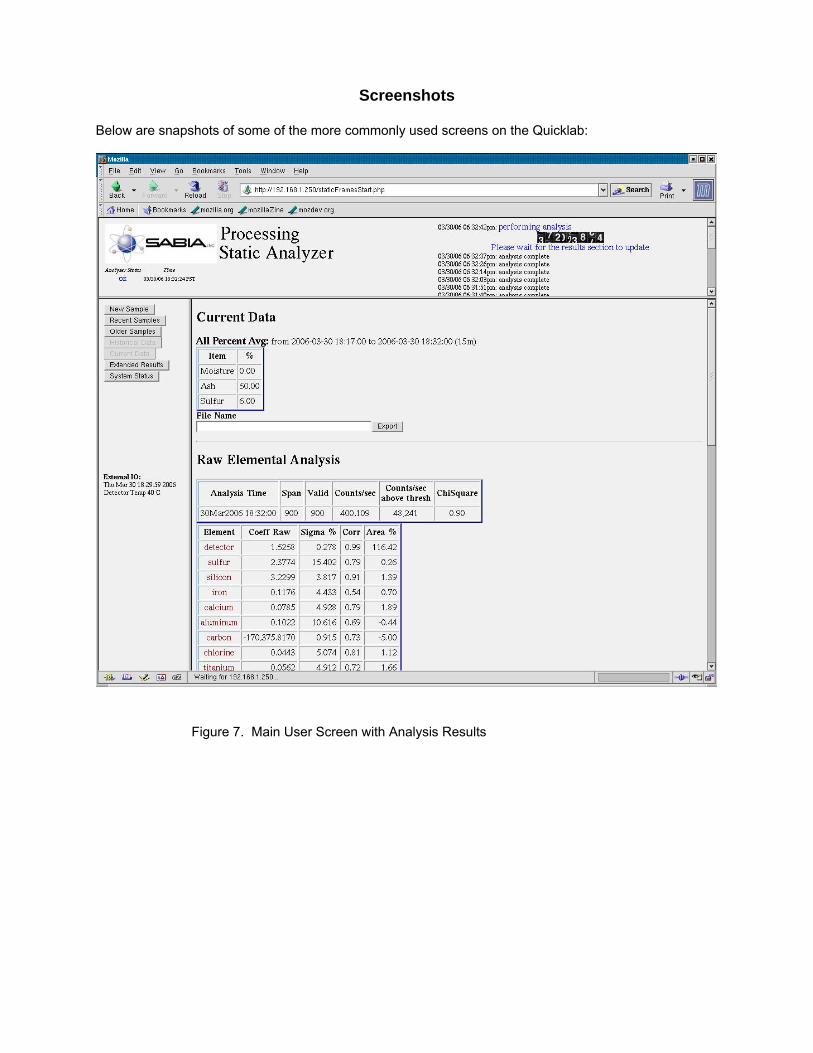
Screenshots
Below are snapshots of some of the more commonly used screens on the Quicklab:
Figure 7. Main User Screen with Analysis Results
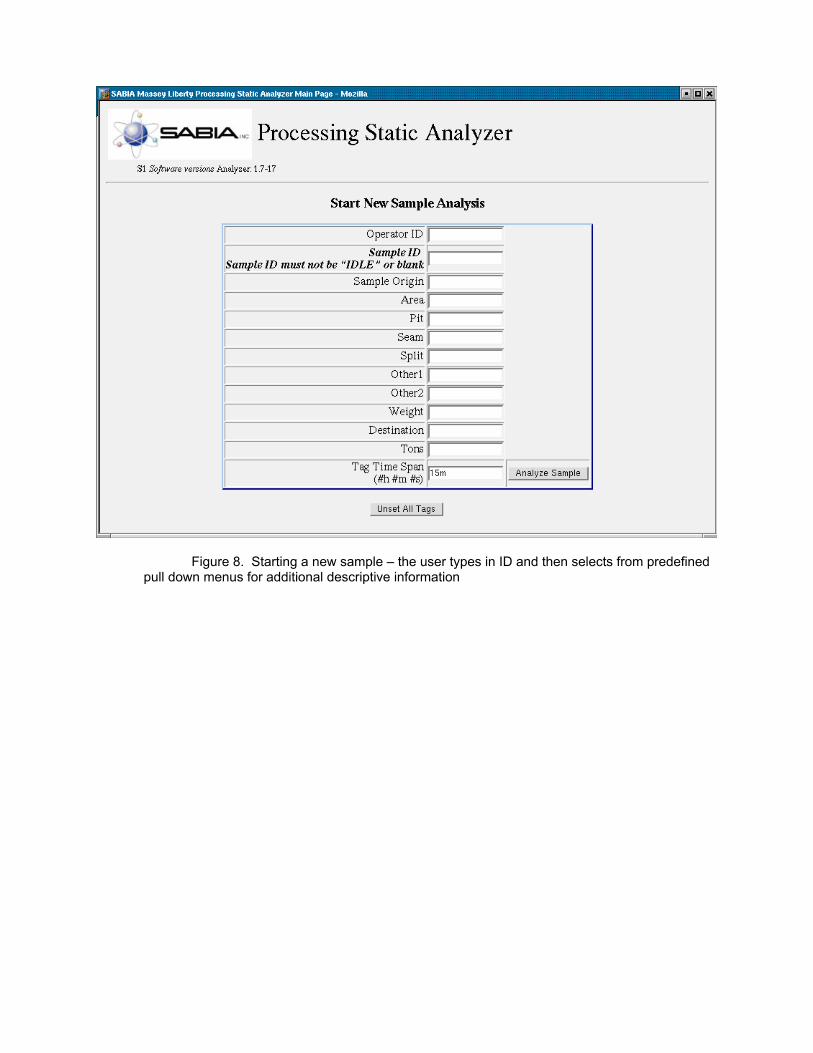
Figure 8. Starting a new sample – the user types in ID and then selects from predefined pull down menus for additional descriptive information
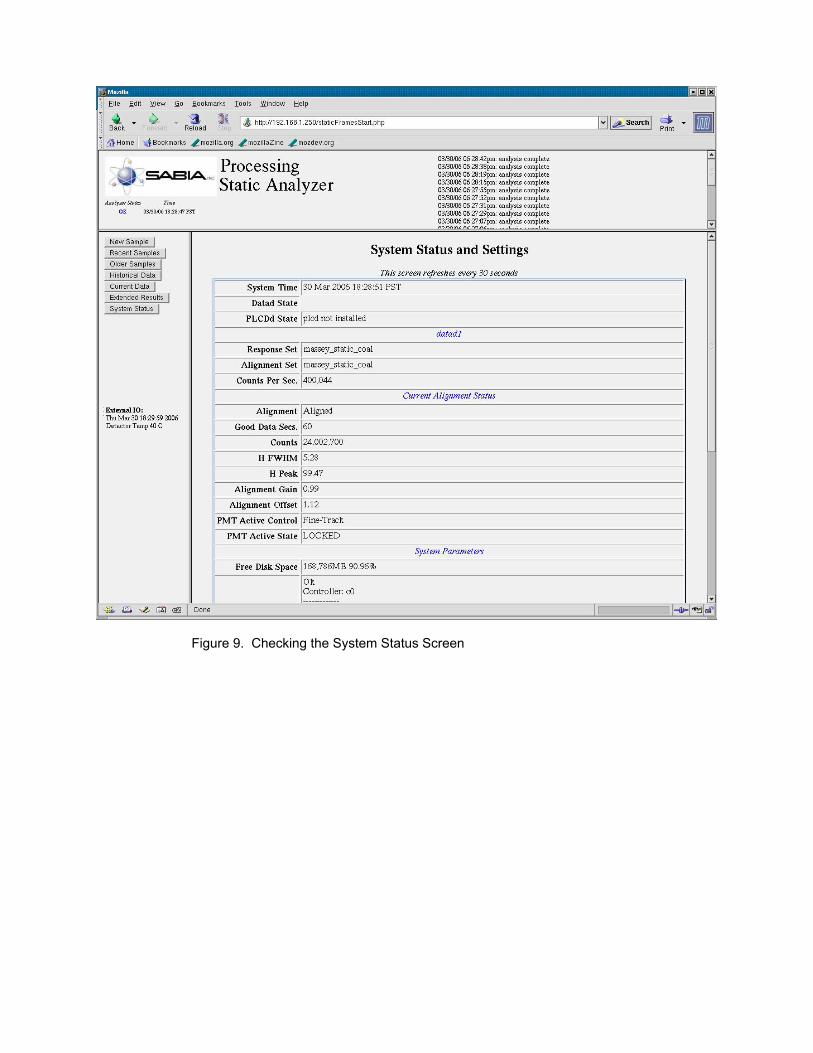
Figure 9. Checking the System Status Screen
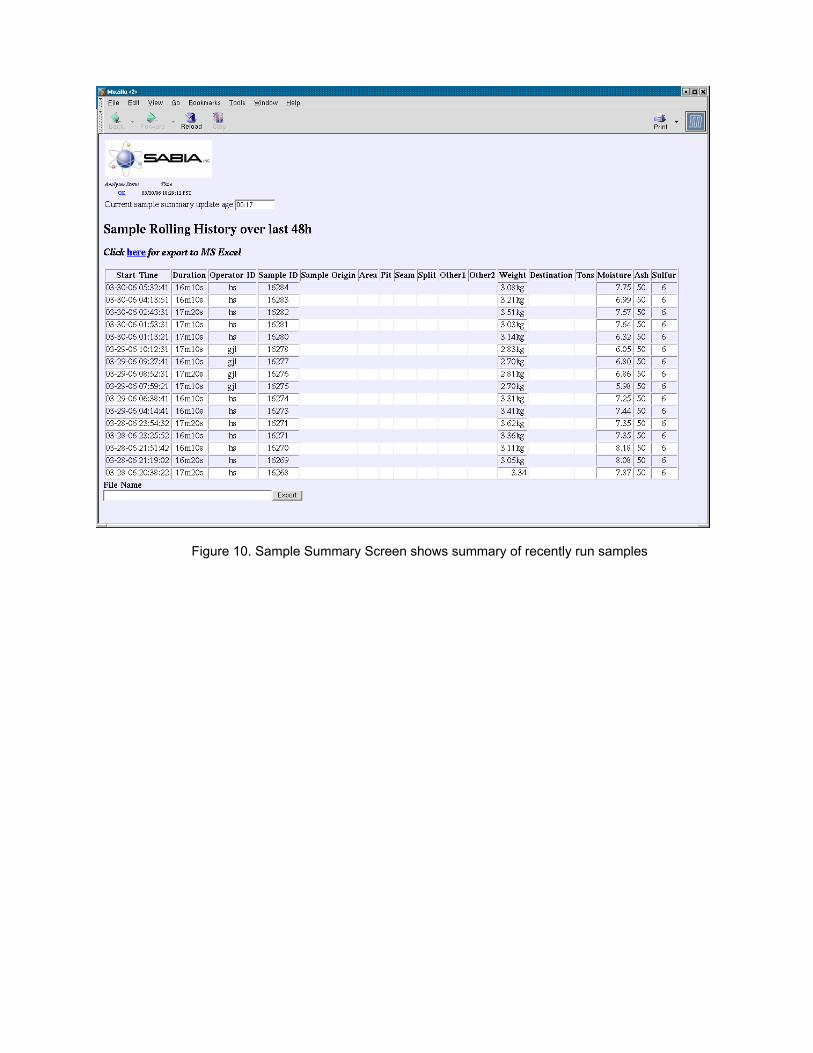
Figure 10. Sample Summary Screen shows summary of recently run samples
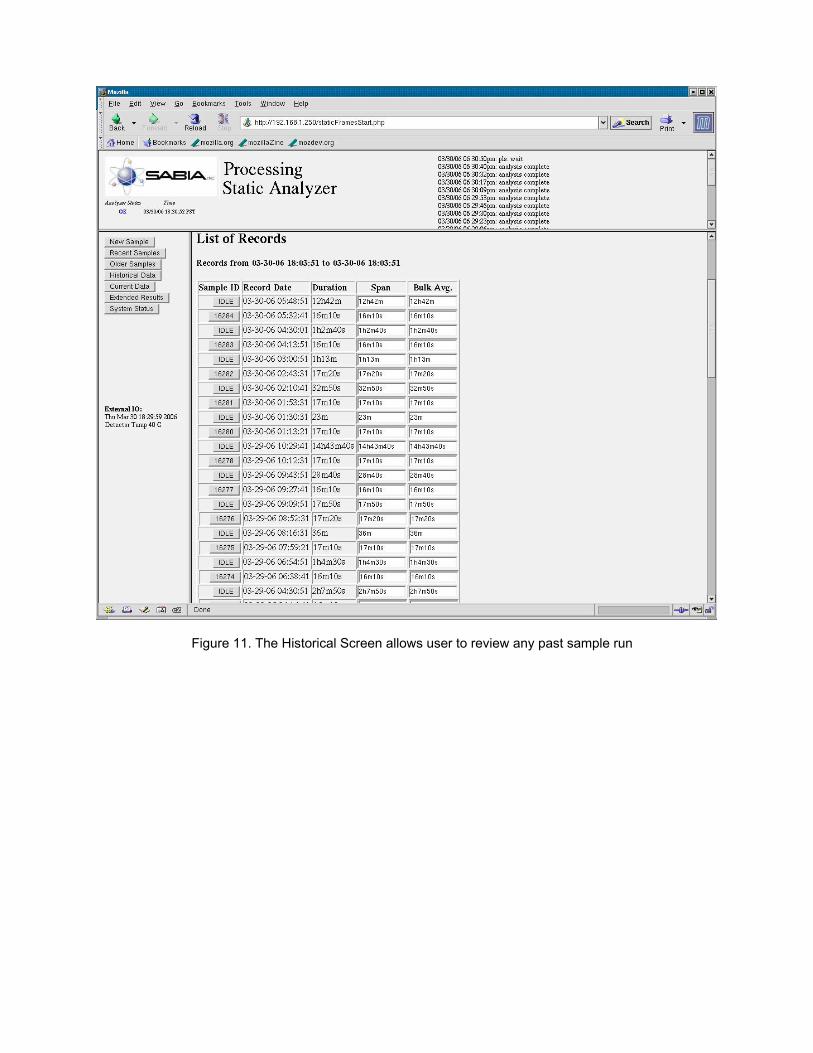
Figure 11. The Historical Screen allows user to review any past sample run
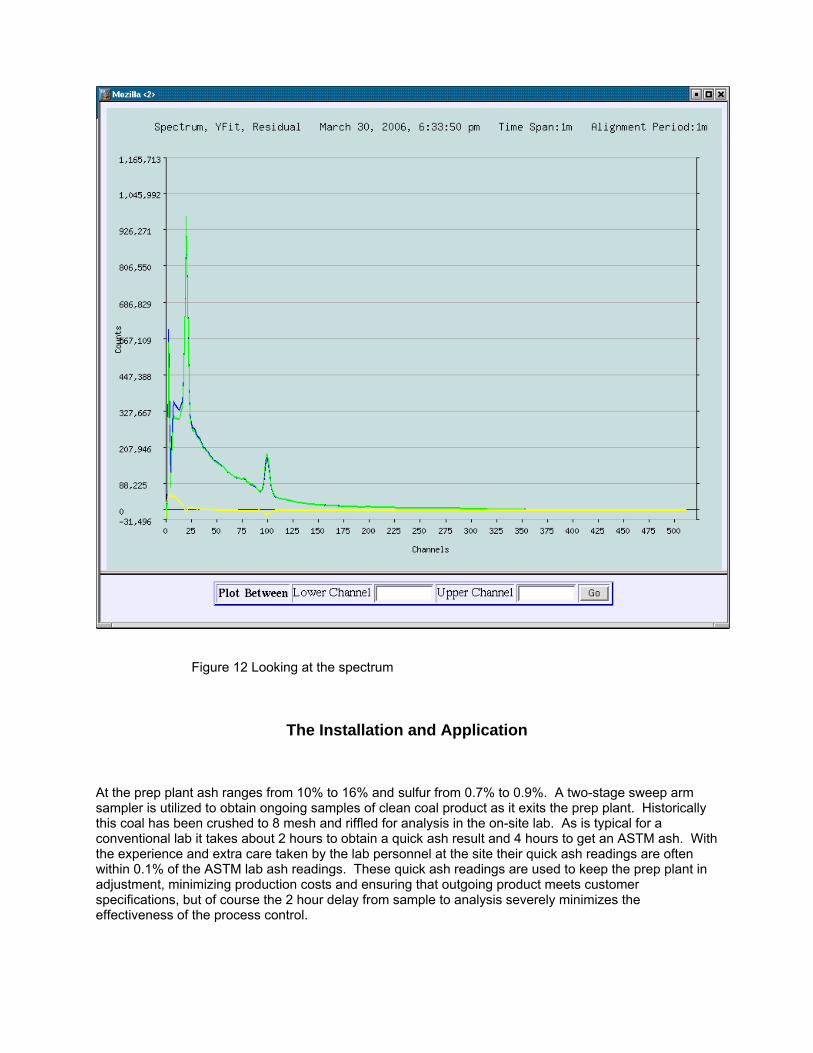
Figure 12 Looking at the spectrum
The Installation and Application At the prep plant ash ranges from 10% to 16% and sulfur from 0.7% to 0.9%. A two-stage sweep arm sampler is utilized to obtain ongoing samples of clean coal product as it exits the prep plant. Historically this coal has been crushed to 8 mesh and riffled for analysis in the on-site lab. As is typical for a conventional lab it takes about 2 hours to obtain a quick ash result and 4 hours to get an ASTM ash. With the experience and extra care taken by the lab personnel at the site their quick ash readings are often within 0.1% of the ASTM lab ash readings. These quick ash readings are used to keep the prep plant in adjustment, minimizing production costs and ensuring that outgoing product meets customer specifications, but of course the 2 hour delay from sample to analysis severely minimizes the effectiveness of the process control.
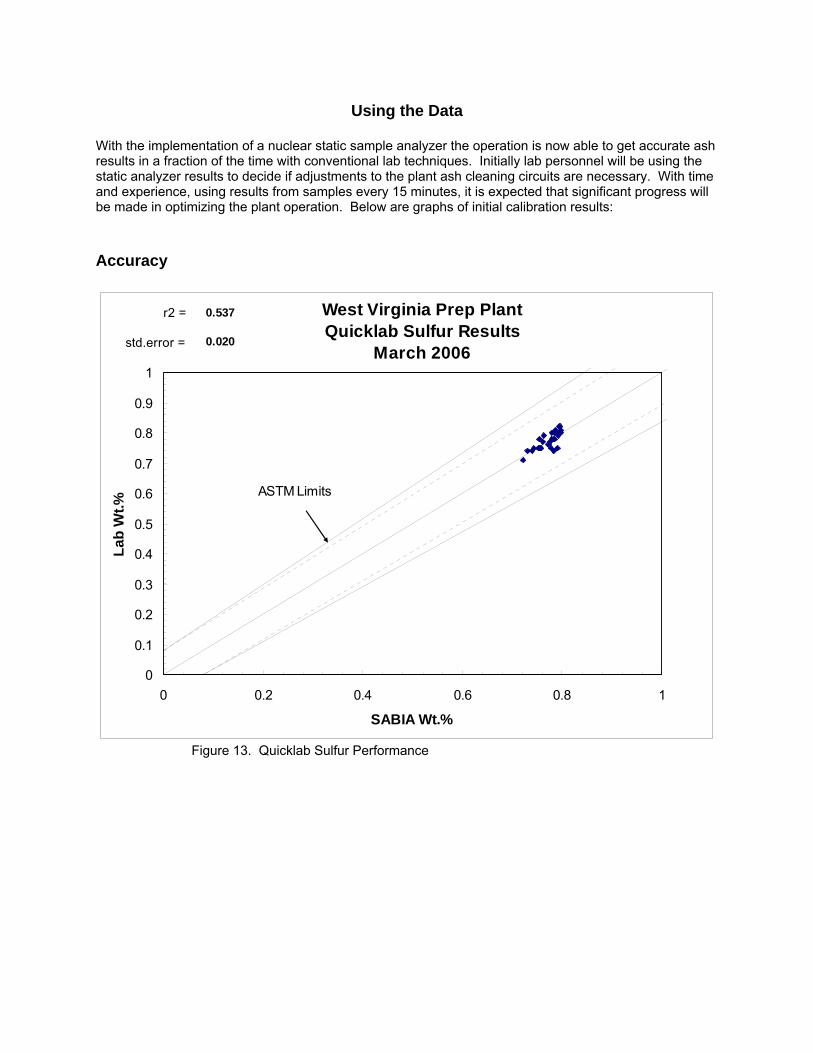
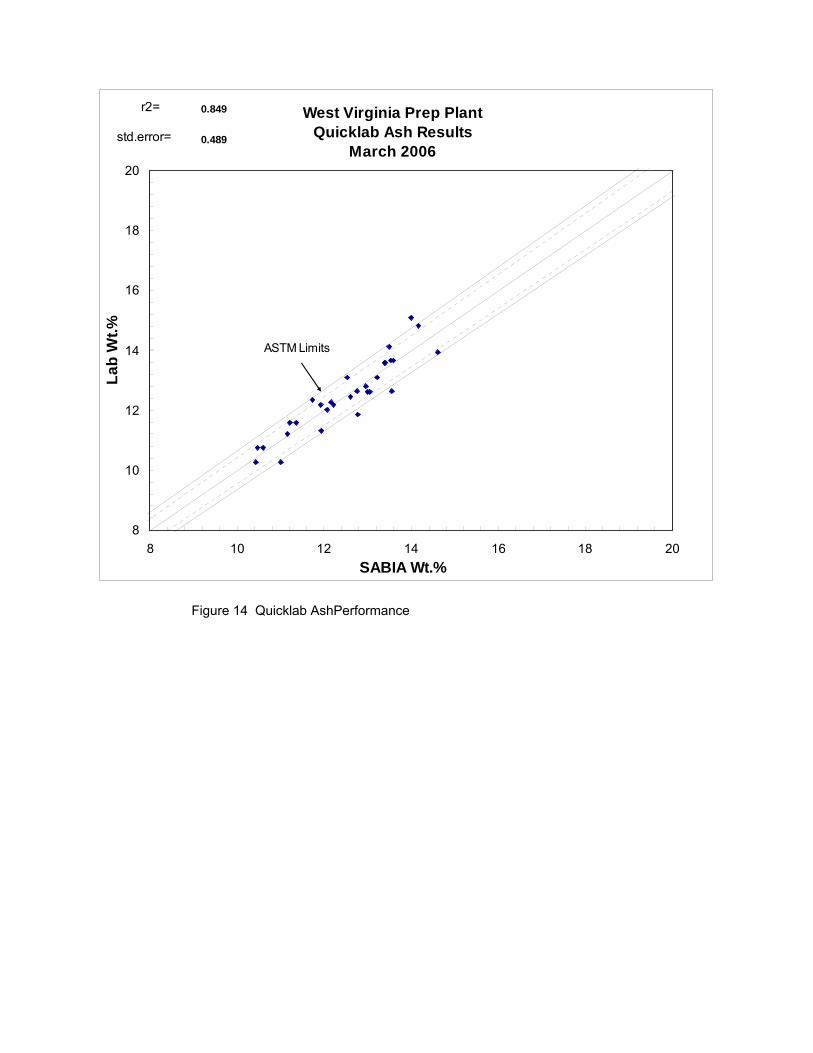
Using the Data
With the implementation of a nuclear static sample analyzer the operation is now able to get accurate ash results in a fraction of the time with conventional lab techniques. Initially lab personnel will be using the static analyzer results to decide if adjustments to the plant ash cleaning circuits are necessary. With time and experience, using results from samples every 15 minutes, it is expected that significant progress will be made in optimizing the plant operation. Below are graphs of initial calibration results: Accuracy
West Virginia Prep Plant Quicklab Sulfur Results
March 2006
0
0.1
0.2
0.3
0.4
0.5
0.6
0.7
0.8
0.9
1
0 0.2 0.4 0.6 0.8 1
SABIA Wt.%
Lab
Wt.%
r2 =
std.error =
0.537
0.020
ASTM Limits
Figure 13. Quicklab Sulfur Performance
West Virginia Prep Plant Quicklab Ash Results
March 2006
8
10
12
14
16
18
20
8 10 12 14 16 18 20SABIA Wt.%
Lab
Wt.%
r2=
std.error= 0.489
0.849
ASTM Limits
Figure 14 Quicklab AshPerformance
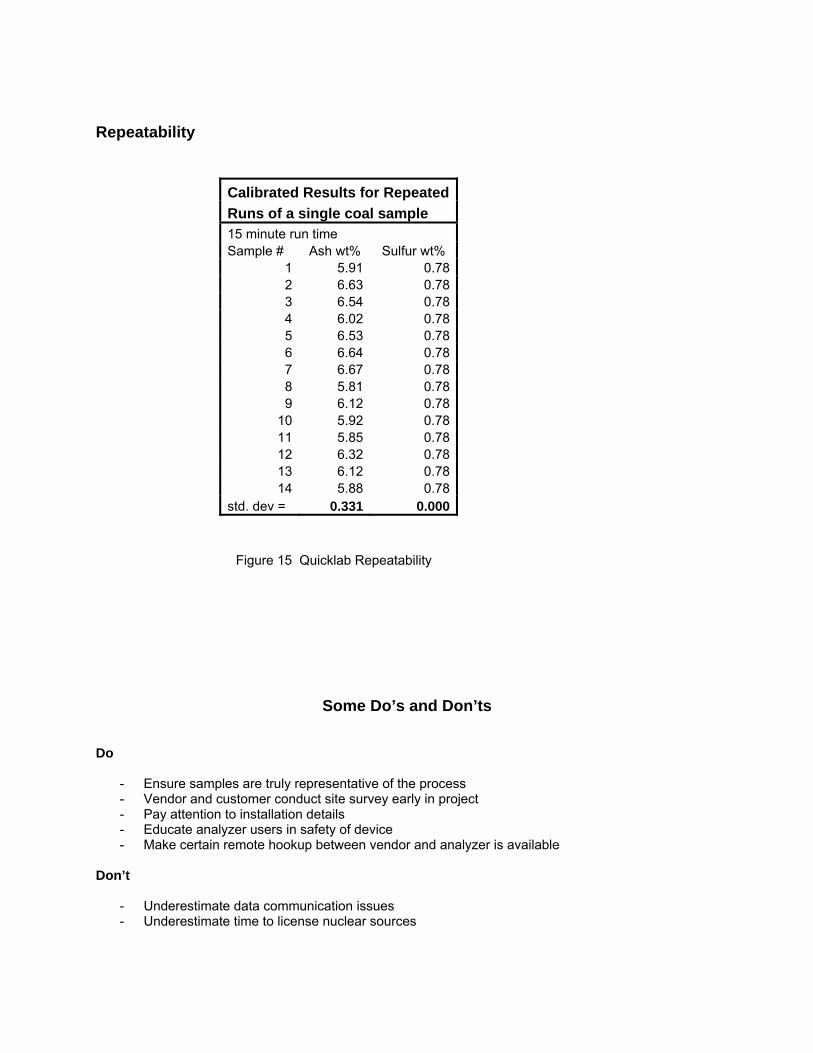
Repeatability
Calibrated Results for Repeated Runs of a single coal sample 15 minute run time Sample # Ash wt% Sulfur wt%
1 5.91 0.782 6.63 0.783 6.54 0.784 6.02 0.785 6.53 0.786 6.64 0.787 6.67 0.788 5.81 0.789 6.12 0.78
10 5.92 0.7811 5.85 0.7812 6.32 0.7813 6.12 0.7814 5.88 0.78
std. dev = 0.331 0.000
Figure 15 Quicklab Repeatability
Some Do’s and Don’ts
Do
- Ensure samples are truly representative of the process - Vendor and customer conduct site survey early in project - Pay attention to installation details - Educate analyzer users in safety of device - Make certain remote hookup between vendor and analyzer is available
Don’t
- Underestimate data communication issues - Underestimate time to license nuclear sources
Looking Ahead To further utilize the information from the analyzer the customer will be monitoring the iron results in the content of the samples. It is hoped that the timeliness of the analyzer results can enable the operators to not only keep the ash level of the coal output from the prep plant more consistent but also enable the plant operators to minimize the loss of magnetite in coal leaving the prep plant. It is estimated that a typical large coal cleaning operation spends as much as $100K per month on magnetite. A 10% reduction in this expense by keeping the circuits in better adjustment could potentially pay for the analyzer over the course of a year.
Summary
It is still early in the operation’s journey to use cutting edge technology to optimize operation, reduce costs and maximize profitability, but the experience so far with PGNA has proven beneficial. The site has correctly identified the culprit in achieving optimum quality and profitability as variation and they are well on their way to significantly reducing variation in the output of the prep plant.
REFERENCES Foster, Stephen, “What is involved in Effective Calibration of a PGNA Analyzer in the Factory and the Field”, International On-Line Coal Analyzer Technical Conference, St. Lousi, MO, November, 2004. Proctor, R.J., “On-line Prompt Gamma Neutron Activation Analyzers”, Process/Industrial and Controls Handbook, Editor-Gregory K. McMillan, Fifth Edition, McGraw Hill, 1999. Sanda, Arthur P., “On-line Analyzers Improve Coal Quality”, Coal Age Magazine, p.52, June 1992. Snider, Kurt, Woodward, Richard. “Using an On-Line Elemental Coal Analyzer to Reduce Lost Generation Due to Slagging”, International On-line Coal Analyzer Technical Conference, St.Louis, MO, November 2004.