Compliance Index – Environmental Compliance/Performance Measure

Using a Digitization Index to measure the Economic and Social Impact of Digital Agendas (*)
Euro CPR 2013 A Digital Agenda in search of evidence:
Issues and Trends Brussels, Belgium March 21, 2013
Dr. Raúl L. Katz, Adjunct Professor, Division of Finance and Economics, and Director, Business Strategy Research, Columbia Institute of Tele-information
(*) This presentation is based on a research jointly developed with Dr. Pantelis Koutroumpis.

Agenda
● Measuring digitization
● Assessing digitization’s economic impact
● Digitization in Europe
● Elements of a future agenda
2

3
Digitization is the capacity to use digital technologies to generate, process, share and transact information
● At the most basic level, digi2za2on is the process of conver2ng analog informa2on into a digital format
● In a broader context, digi2za2on is defined as the social transforma2on triggered by the massive adop2on of digital technologies to generate, process, share and transact informa2on
● Digi2za2on builds on the evolu2on of network access technologies, semiconductor technologies, and so@ware engineering
● Leverages the spillover effects resul2ng from their use (common plaDorms for applica2on development, e-‐government services, e-‐commerce, social networks, and availability of online informa2on)

To achieve a significant impact, digitization has to be widely diffused within the economic and social fabric of a given nation
● Adopted at three levels – U2lized by individuals, economic enterprises and socie2es – Embedded in processes of delivery of goods and services – Relied upon to deliver public services
● For this condi2on to occur, digi2za2on has to fulfill several condi2ons – Affordable to allow scalable impact – Ubiquitous reaching most popula2on of a na2onal territory – Accessible by mul2ple fixed and mobile voice and data devices – Reliable, providing sufficient capacity to deliver vast amounts of
informa2on at speeds that do not hinder their effec2ve use
4

5
The purpose of this research was to develop a digitization index and measure its contribution to economic and social development
● Star2ng premise: most research measuring social and economic impact of ICT focuses on discrete technology plaDorms, such as mobile penetra2on, access to the Internet and broadband adop2on
● Holis2c adop2on and usage of ICT results in enhanced effects that go
beyond the contribu2on of specific plaDorms
● The transi2on to digitally-‐intensive socie2es should be assessed across a mul2ple set of metrics, capturing not only penetra'on, but also usage of these technologies in order to capture the full impact of digi2za2on

6
A composite index comprising 23 indicators was developed to measure the level of digitization of a given country
DIGITIZATION INDEX

Data to develop the index was compiled from multiple sources
7
NAME OF INDICATOR SOURCE
Residential fixed line tariff adjusted for GDP per capita ITU Residential fixed line connection fee adjusted for GDP per capita ITU Mobile cellular prepaid tariff adjusted for GDP/capita ITU Mobile cellular prepaid connection fee adjusted for GDP per capita ITU Fixed broadband Internet access tariff adjusted for GDP per capita ITU Investment per telecom subscriber (mobile, broadband and fixed) World Bank Fixed Broadband penetration ITU Mobile Phone penetration (2010) ITU Population covered by mobile cellular network ITU Percentage of population using a PC (2010) ITU 3G Penetration (2Q 11) Wireless Intelligence International Internet bandwidth (bits/second/internet user) ITU Broadband speeds (% above 2 Mbps) Akamai Internet retail (Retail internet as percentage of total retail) Euromonitor E-government Web measure index UN Percentage of individuals (users) using the internet (2010)` ITU Data as a percentage of wireless ARPU (4Q10) Wireless Intelligence Dominant Social Network Unique Visitors per month Per Capita Internet World Stats SMS Usage (Average SMS sent by consumers) Wireless Intelligence Engineers (Engineers as a percentage of total population) World Bank Skilled Labor (Labor force with more than a secondary education as a percentage of the total labor force) World Bank

8
The index was constructed following a typical methodology for composite index validity assessment
● Define the theore2cal framework of the index and select variables ● Each sub-‐index was normalized, by using the mean and one standard
devia2on, and cropping the extremes – Affordability sub-‐index: the inverse of the maximum is used to cap
it – Mobile penetra2on: was capped at a maximum of 100% to prevent
over-‐weigh2ng ● For each of the six components a minimum of subcomponents is
assigned depending on the scarcity of the available informa2on ● For the Index calcula2on, a minimum of four components is required ● Correla2ons were ini2ally run between the digi2za2on index and other
technology indices to test its ranking value – Network Readiness Index (WEF) – ICT Opportunity Index (ITU) – Digital Opportunity Index (ITU)

Finally, the Kaiser-Meyer-Olkin measure of sampling adequacy was ran, indicating that the index is statistically sound
9
Scale reliability coefficient: 0.9416Number of items in the scale: 23Average interitem covariance: 234.5332
Reversed items: a1 a2 a3 a4 a5Test scale = mean(unstandardized items)
Overall 0.8202 human 0.8311 usage 0.8394 capacity 0.8154 networkacc~s 0.7530 infrastruc~e 0.8741 affordabil~y 0.8854 Variable kmo
Kaiser-Meyer-Olkin measure of sampling adequacyScale reliability coefficient: 0.8640Number of items in the scale: 6Average interitem covariance: 198.3664
Reversed item: affordabilityTest scale = mean(unstandardized items)
The es2mated sta2s2cs derive from factor analysis: • KMO measures how dis2nct the factors (components of the
index) are so that they do not over-‐iden2fy latent phenomena. All factor es2mates need to be higher than 0.60 and the overall KMO>0.8
• The Cronbach coefficient alpha is the most common es2mate of internal consistency of items in a model or survey. It assesses how well a set of sub-‐indicators measures a single one-‐dimensional object. Reliable A-‐threshold >0.8
• With KMO=0.82 and Alpha23=0.94 Alpha6=0.86 the Digi2za2on Index is sta2s2cally sound
10
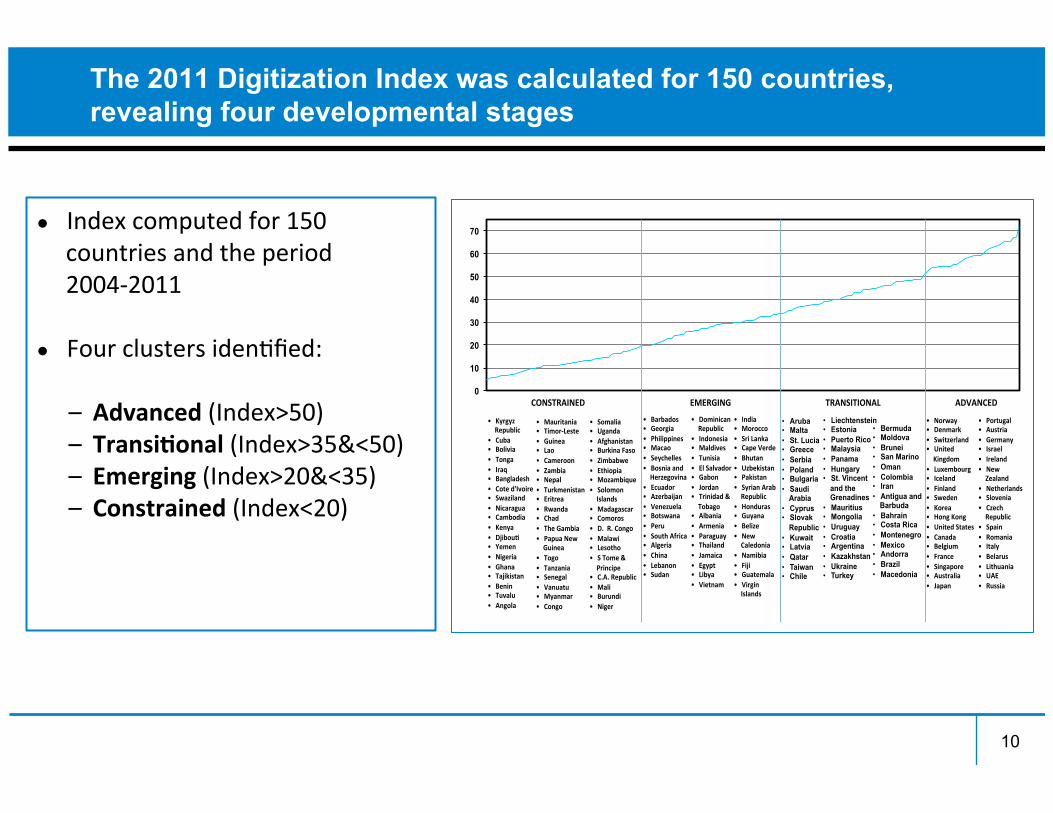
The 2011 Digitization Index was calculated for 150 countries, revealing four developmental stages
● Index computed for 150 countries and the period 2004-‐2011
● Four clusters iden2fied:
– Advanced (Index>50) – Transi'onal (Index>35&<50) – Emerging (Index>20&<35) – Constrained (Index<20)
• Barbados((• Georgia((• Philippines(• Macao(• Seychelles(• Bosnia(and(Herzegovina(
• Ecuador(• Azerbaijan(• Venezuela(• Botswana(• Peru(• South(Africa(• Algeria(• China(• Lebanon(• Sudan((
• Somalia(• Uganda((• Afghanistan((• Burkina(Faso((• Zimbabwe((• Ethiopia((• Mozambique((• Solomon(Islands((
• Madagascar((• Comoros((• D.((R.(Congo(• Malawi((• Lesotho((• S(Tome(&(Principe((
• C.A.(Republic((• Mali((• Burundi((• Niger((
0
10
20
30
40
50
60
70
TRANSITIONAL(
• Aruba • Malta • St. Lucia • Greece • Serbia • Poland • Bulgaria • Saudi
Arabia • Cyprus • Slovak
Republic • Kuwait • Latvia • Qatar • Taiwan • Chile ((
• Liechtenstein • Estonia • Puerto Rico • Malaysia • Panama • Hungary • St. Vincent
and the Grenadines
• Mauritius • Mongolia • Uruguay • Croatia • Argentina • Kazakhstan • Ukraine • Turkey
ADVANCED(
• Norway(• Denmark(• Switzerland(• United(Kingdom(
• Luxembourg(• Iceland(• Finland(• Sweden(• Korea(• Hong(Kong((• United(States(• Canada(• Belgium(• France(• Singapore(• Australia(• Japan((
EMERGING(CONSTRAINED(
• Portugal(• Austria(• Germany(• Israel(• Ireland(• New(Zealand(
• Netherlands(• Slovenia(• Czech(Republic(
• Spain(• Romania(• Italy(• Belarus(• Lithuania(• UAE(• Russia((
• Dominican(Republic((
• Indonesia((• Maldives((• Tunisia((• El(Salvador((• Gabon((• Jordan((• Trinidad(&(Tobago((
• Albania((• Armenia((• Paraguay((• Thailand((• Jamaica((• Egypt((• Libya((• Vietnam((
• Kyrgyz(Republic((
• Cuba((• Bolivia((• Tonga((((• Iraq((• Bangladesh(• Cote(d'Ivoire(• Swaziland(• Nicaragua(• Cambodia(• Kenya((• DjibouU((• Yemen((• Nigeria((• Ghana(• Tajikistan(• Benin(• Tuvalu((• Angola(
• Mauritania((• TimorWLeste((• Guinea((• Lao((• Cameroon((• Zambia((• Nepal((• Turkmenistan((• Eritrea((• Rwanda((• Chad((• The(Gambia((• Papua(New(Guinea((
• Togo((• Tanzania((• Senegal((• Vanuatu(• Myanmar(• Congo(
• India((• Morocco((• Sri(Lanka((• Cape(Verde((• Bhutan((• Uzbekistan((• Pakistan((• Syrian(Arab(Republic((
• Honduras((• Guyana((• Belize((• New(Caledonia((
• Namibia((• Fiji((• Guatemala((• Virgin(Islands((
• Bermuda • Moldova • Brunei • San Marino • Oman • Colombia • Iran • Antigua and
Barbuda • Bahrain • Costa Rica • Montenegro • Mexico • Andorra • Brazil • Macedonia

When ranking countries for each of the six sub-components, we determined that access and affordability are less of a world problem
11
• For all countries, normalized usage sub-‐index never matches the levels of access sub-‐indices, which indicate a big challenge across the world
• For all OECD and middle income countries, the sub-‐indices affordability and network access tend to be consistently above the digi2za2on index indica2ng that countries have addressed the access challenge
• The affordability and capacity sub-‐indices tend to rapidly drop at low GDP levels, indica2ng a big gap between mature and low income countries
0
20
40
60
80
100
120No
rway
Luxembo
urg
United
France
Spain
Greece
Macao, China
Mauritius
Croatia
Antigua an
d
Mexico
Serbia
T.F.Y.R.
Ecuado
r
Mald
ives
Gabo
n
Mon
golia
Pakis
tan
Thailand
Kyrgyzsta
n
Cambo
dia
Zambia
Tanzania
Cuba
Cameroo
n
Eritrea
Ethiop
ia
AFFORDABILITY INFRASTRUCTURE RELIABILITY NETWORK ACCESS
CAPACITY USAGE HUMAN CAPITAL
TOTAL

In addition to assessing digitization development paths, we tracked its evolution over time for selected countries
● Constructed a 2me series of digi2za2on for 18 countries between 1995 and 2011
● Assessed the evolu2on of the index akemp2ng to determine idiosyncra2c country paths to digi2za2on – Emerging countries undergo quantum leap changes in digi2za2on
triggered by key policy ini2a2ves – Mature countries exhibit a consistent, yet gradual, change in digi2za2on
performance
● Analyzed changes in the index in an akempt to iden2fy specific events or policies that have triggered a change at a specific point in 2me
12

0
10
20
30
40
50
60
70
1995 1996 1997 1998 1999 2000 2001 2002 2003 2004 2005 2006 2007 2008 2009 2010 2011
U.S.
13
Most industrialized countries have consistently increased their digitization level over the past fifteen years, albeit at different rates
13 13
USA leading in 1997(pre dot com bubble) and now gradually making again its
way to the top
DIGITIZATION INDEX (1995-2011)

0
10
20
30
40
50
60
70
80
1995 1996 1997 1998 1999 2000 2001 2002 2003 2004 2005 2006 2007 2008 2009 2010 2011
U.S. Norway Sweden
14
Scandinavian countries have significantly changed their digitization development path
14 14
Norway and Sweden leapfrogging through
systematic adoption and timely launch of network
access, skills and services
DIGITIZATION INDEX (1995-2011)

0
10
20
30
40
50
60
70
80
1995 1996 1997 1998 1999 2000 2001 2002 2003 2004 2005 2006 2007 2008 2009 2010 2011
Japan S. Korea U.S. Norway Sweden
15
In Asia, Korea achieved the same leapfrogging move in the late nineties
15 15
S. Korea government intervention for 100% broadband coverage
DIGITIZATION INDEX (1995-2011)
0
10
20
30
40
50
60
70
80
1995 1996 1997 1998 1999 2000 2001 2002 2003 2004 2005 2006 2007 2008 2009 2010 2011
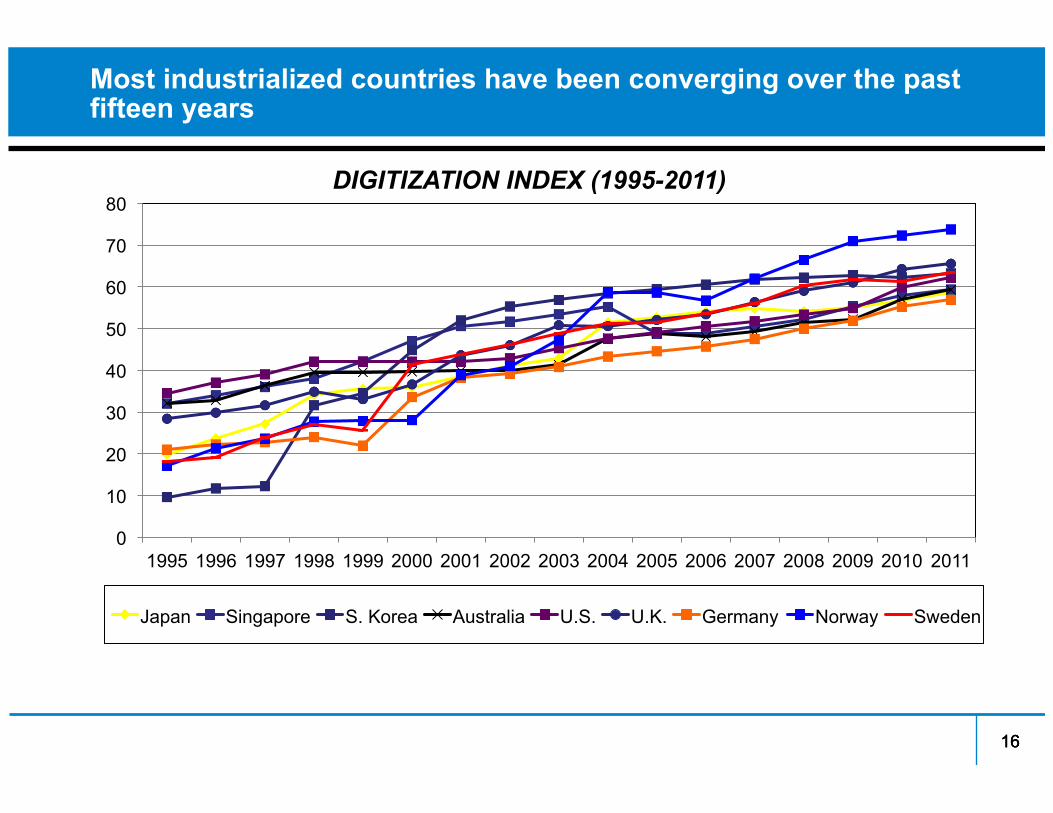
Japan Singapore S. Korea Australia U.S. U.K. Germany Norway Sweden
16
Most industrialized countries have been converging over the past fifteen years
16 16
DIGITIZATION INDEX (1995-2011)

0
5
10
15
20
25
30
35
40
1995 1996 1997 1998 1999 2000 2001 2002 2003 2004 2005 2006 2007 2008 2009 2010 2011
Brazil Egypt China India
The digitization development path of emerging countries depends on specific public policies
India very slow after 2007-08 rise, now trailing most emerging countries
China consistently improving based on
infrastructure deployment plans
17 17 17
Brazil leapfrogs after privatization/
liberalization
Brazil rebounds based on income
redistribution policies
DIGITIZATION INDEX (1995-2011)

In sum, data indicates different development paths towards digitization
● Mature countries follow a gradual progression towards digi2za2on – Ac2ve government interven2on accelerates development (Korea,
Norway)
● Some emerging countries undergo quantum leap changes (25 points in five years) in digi2za2on triggered by specific policy ini2a2ves – Telecom market liberaliza2on with spill-‐over impact on the ICT eco-‐
system – A combina2on of ac2ve government involvement and private sector
par2cipa2on – Centralized state planning
18

Agenda
● Measuring digitization
● Assessing digitization’s economic impact
● Digitization in Europe
● Elements of a future agenda
19
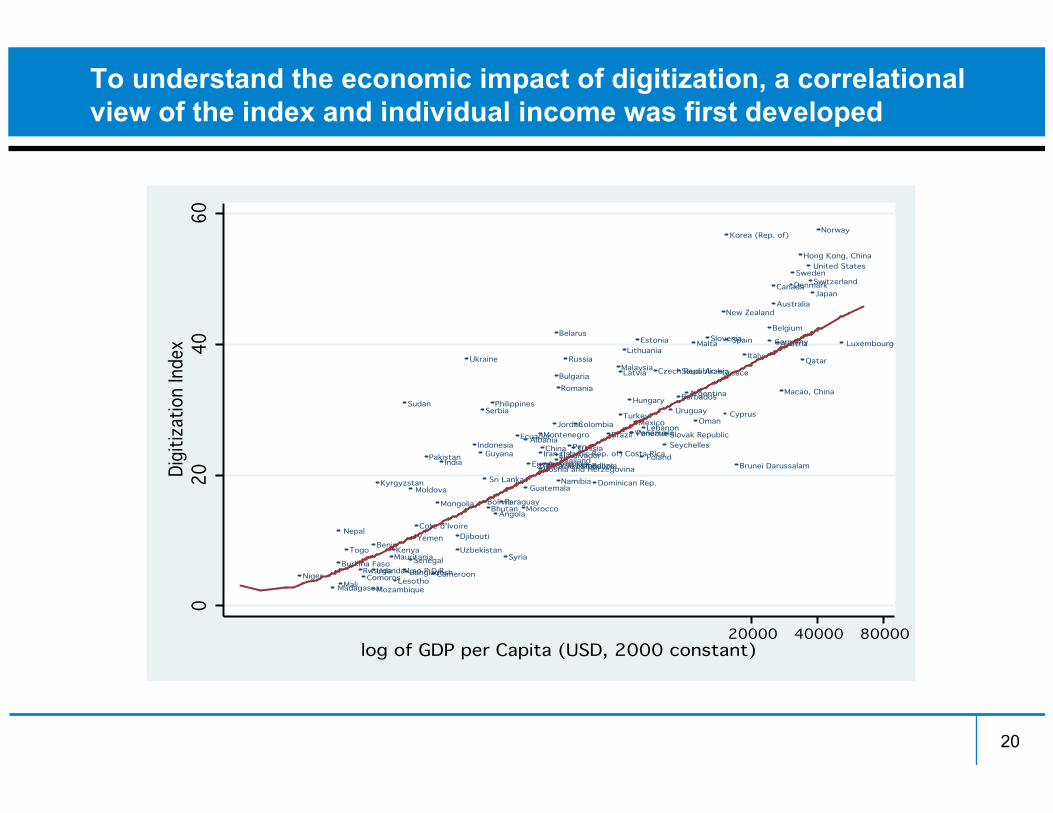
To understand the economic impact of digitization, a correlational view of the index and individual income was first developed
20
Albania
Albania
AlbaniaAngola
Angola
AngolaArgentina
Argentina
ArgentinaAustralia
Australia
AustraliaAustria
Austria
AustriaAzerbaijan
Azerbaijan
AzerbaijanBangladesh
Bangladesh
BangladeshBarbados
Barbados
BarbadosBelarus
Belarus
BelarusBelgium
Belgium
BelgiumBelize
Belize
BelizeBenin
Benin
BeninBhutan
Bhutan
BhutanBolivia
Bolivia
BoliviaBosnia and Herzegovina
Bosnia and Herzegovina
Bosnia and HerzegovinaBrazil
Brazil
BrazilBrunei Darussalam
Brunei Darussalam
Brunei DarussalamBulgaria
Bulgaria
BulgariaBurkina Faso
Burkina Faso
Burkina FasoCameroon
Cameroon
CameroonCanada
Canada
CanadaChina
China
ChinaColombia
Colombia
ColombiaComoros
Comoros
ComorosCosta Rica
Costa Rica
Costa RicaCote d'Ivoire
Cote d'Ivoire
Cote d'IvoireCyprus
Cyprus
CyprusCzech Republic
Czech Republic
Czech RepublicDenmark
Denmark
DenmarkDjibouti
Djibouti
DjiboutiDominican Rep.
Dominican Rep.
Dominican Rep.Ecuador
Ecuador
EcuadorEgypt
Egypt
EgyptEl Salvador
El Salvador
El SalvadorEstonia
Estonia
EstoniaGermany
Germany
GermanyGreece
Greece
GreeceGuatemala
Guatemala
GuatemalaGuyana
Guyana
GuyanaHong Kong, China
Hong Kong, China
Hong Kong, ChinaHungary
Hungary
HungaryIndia
India
IndiaIndonesia
Indonesia
IndonesiaIran (Islamic Rep. of)
Iran (Islamic Rep. of)
Iran (Islamic Rep. of)Italy
Italy
ItalyJapan
Japan
JapanJordan
Jordan
JordanKazakhstan
Kazakhstan
KazakhstanKenya
Kenya
KenyaKorea (Rep. of)
Korea (Rep. of)
Korea (Rep. of)Kyrgyzstan
Kyrgyzstan
KyrgyzstanLao P.D.R.
Lao P.D.R.
Lao P.D.R.Latvia
Latvia
LatviaLebanon
Lebanon
LebanonLesotho
Lesotho
LesothoLithuania
Lithuania
LithuaniaLuxembourg
Luxembourg
LuxembourgMacao, China
Macao, China
Macao, ChinaMadagascar
Madagascar
MadagascarMalaysia
Malaysia
MalaysiaMali
Mali
MaliMalta
Malta
MaltaMauritania
Mauritania
MauritaniaMexico
Mexico
MexicoMoldova
Moldova
MoldovaMongolia
Mongolia
MongoliaMontenegro
Montenegro
MontenegroMorocco
Morocco
MoroccoMozambique
Mozambique
MozambiqueNamibia
Namibia
NamibiaNepal
Nepal
NepalNew Zealand
New Zealand
New ZealandNiger
Niger
NigerNorway
Norway
NorwayOman
Oman
OmanPakistan
Pakistan
PakistanPanama
Panama
PanamaParaguay
Paraguay
ParaguayPeru
Peru
PeruPhilippines
Philippines
PhilippinesPoland
Poland
PolandQatar
Qatar
QatarRomania
Romania
RomaniaRussia
Russia
RussiaRwanda
Rwanda
RwandaSaudi Arabia
Saudi Arabia
Saudi ArabiaSenegal
Senegal
SenegalSerbia
Serbia
SerbiaSeychelles
Seychelles
SeychellesSlovak Republic
Slovak Republic
Slovak RepublicSlovenia
Slovenia
SloveniaSpain
Spain
SpainSri Lanka
Sri Lanka
Sri LankaSudan
Sudan
SudanSweden
Sweden
SwedenSwitzerland
Switzerland
SwitzerlandSyria
Syria
SyriaT.F.Y.R. Macedonia
T.F.Y.R. Macedonia
T.F.Y.R. MacedoniaThailand
Thailand
ThailandTogo
Togo
TogoTunisia
Tunisia
TunisiaTurkey
Turkey
TurkeyUganda
Uganda
UgandaUkraine
Ukraine
UkraineUnited States
United States
United StatesUruguay
Uruguay
UruguayUzbekistan
Uzbekistan
UzbekistanVenezuela
Venezuela
VenezuelaYemen
Yemen
Yemen00
02020
204040
406060
60Digitization IndexDi
gitiza
tion
Index
Digitization Index20000
20000
2000040000
40000
4000080000
80000
80000log of GDP per Capita (USD, 2000 constant)
log of GDP per Capita (USD, 2000 constant)
log of GDP per Capita (USD, 2000 constant)
21
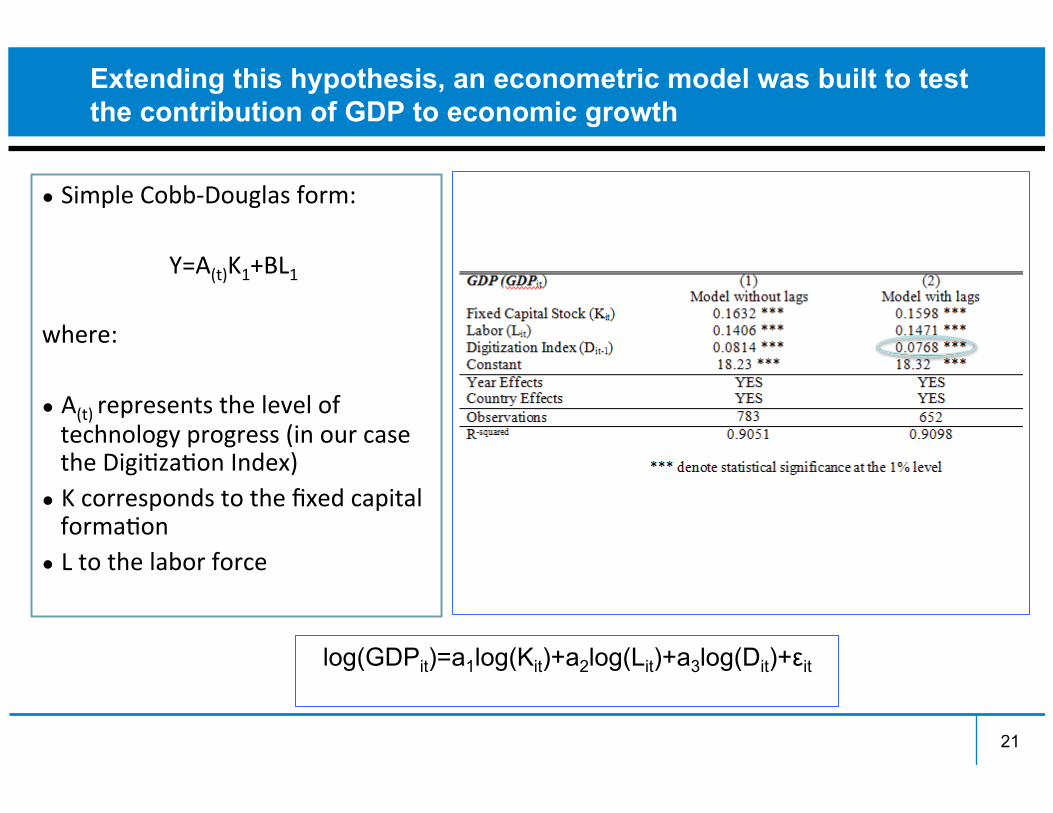
Extending this hypothesis, an econometric model was built to test the contribution of GDP to economic growth
● Simple Cobb-‐Douglas form:
Y=A(t)K1+BL1 where: ● A(t) represents the level of technology progress (in our case the Digi2za2on Index)
● K corresponds to the fixed capital forma2on
● L to the labor force
log(GDPit)=a1log(Kit)+a2log(Lit)+a3log(Dit)+εit
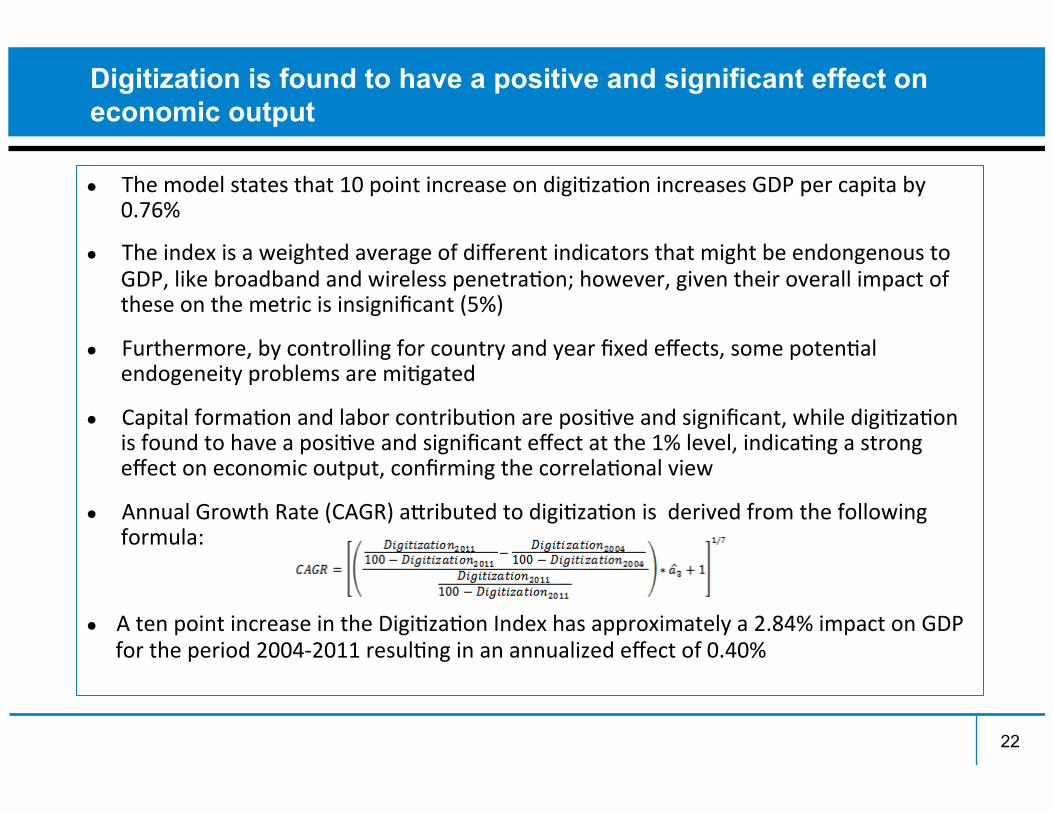
Digitization is found to have a positive and significant effect on economic output
● The model states that 10 point increase on digi2za2on increases GDP per capita by 0.76%
● The index is a weighted average of different indicators that might be endongenous to GDP, like broadband and wireless penetra2on; however, given their overall impact of these on the metric is insignificant (5%)
● Furthermore, by controlling for country and year fixed effects, some poten2al endogeneity problems are mi2gated
● Capital forma2on and labor contribu2on are posi2ve and significant, while digi2za2on is found to have a posi2ve and significant effect at the 1% level, indica2ng a strong effect on economic output, confirming the correla2onal view
● Annual Growth Rate (CAGR) akributed to digi2za2on is derived from the following formula:
● A ten point increase in the Digi2za2on Index has approximately a 2.84% impact on GDP for the period 2004-‐2011 resul2ng in an annualized effect of 0.40%
22

23
Furthermore, digitization has a larger contribution to GDP than stand-alone technologies
23
0.23
0.14
0.08
0.26 0.24
0.16
0.08 0.09
0.17
0.11
0.20
0.76
0.0
0.1
0.2
0.3
0.4
0.5
0.6
0.7
0.8
Contribu'on to GDP
growth of 10 point increase in variable
Broadband Studies
10 POINT INCREASE IN DIGITIZATION YIELDS 0.76%
INCREASE IN GDP PER CAPITA
DIGITIZATION AND ECONOMIC DEVELOPMENT
§ This s2pulates that full economic impact ICT is achieved through the cumula2ve adop2on of all technologies, in addi2on to the assimila2on and usage in the produc2on and social fabric
§ Achieving broadband penetra2on is only one aspect of required policies; maximiza2on of economic impact can only be achieved through a holis2c set of policies ranging from telecoms to compu2ng to adop2on of internet and eCommerce
Mobile Studies

Additionally, digitization exhibits increasing returns to scale, where returns increase after an index score of 30
24
0
0
020000
2000
0
2000040000
4000
0
4000060000
6000
0
6000080000
8000
0
800000
0
020000
2000
0
2000040000
4000
0
4000060000
6000
0
6000080000
8000
0
800000
0
020000
2000
0
2000040000
4000
0
4000060000
6000
0
6000080000
8000
0
800000
0
020
20
2040
40
4060
60
600
0
020
20
2040
40
4060
60
600
0
020
20
2040
40
4060
60
602004
2004
20042005
2005
20052006
2006
20062007
2007
20072008
2008
20082009
2009
20092010
2010
2010Digitization Index
Digitization Index
Digitization IndexGDP per capita
GDP
per c
apita
GDP per capitaGraphs by Year
Graphs by Year
Graphs by Year
Countries with lower scores are o@en the ones that lack basic access, skills and usage that would prevent them from experiencing important effects on their economies

25
The increasing returns to scale hypothesis was also proven econometrically at lower levels of digitization (*)
25
• Advanced: 2.26% compound impact on GDP for the period 2004-‐2011 resul2ng on an annualized effect of 0.32%
• Transi2onal: 2.59% compound impact on GDP for the period 2004-‐2011 resul2ng on an annualized effect of 0.37%
• Constrained: 2.66% compound impact on GDP for the period 2004-‐2011 resul2ng on an annualized effect of 0.37%
• Emerging: 2.44% compound impact on GDP for the period 2004-‐2011 resul2ng on an annualized effect of 0.34%
(*) The sample is broken into four different equally populated clusters. Four dummy variables are created (high, medium, low and very low) that take the value of 1 if the country is within the Digitization scores of interest or 0 if not. For the advanced cluster the threshold is 50, for the transitional 35-50, for the emerging 20-35 and for the constrained 0-20.

26
Beyond its contribution to economic output, digitization also has a positive impact on employment creation
● Simple model links unemployment rates with exis2ng infrastructure, income, educa2on levels, total exports as a percent of GDP and the credit performance:
Uit=b1Dit+b2Kit+b3Eduit+b4GDPCit
+b5Expit+b6Crit+εit ● Model controls for country and year fixed effects
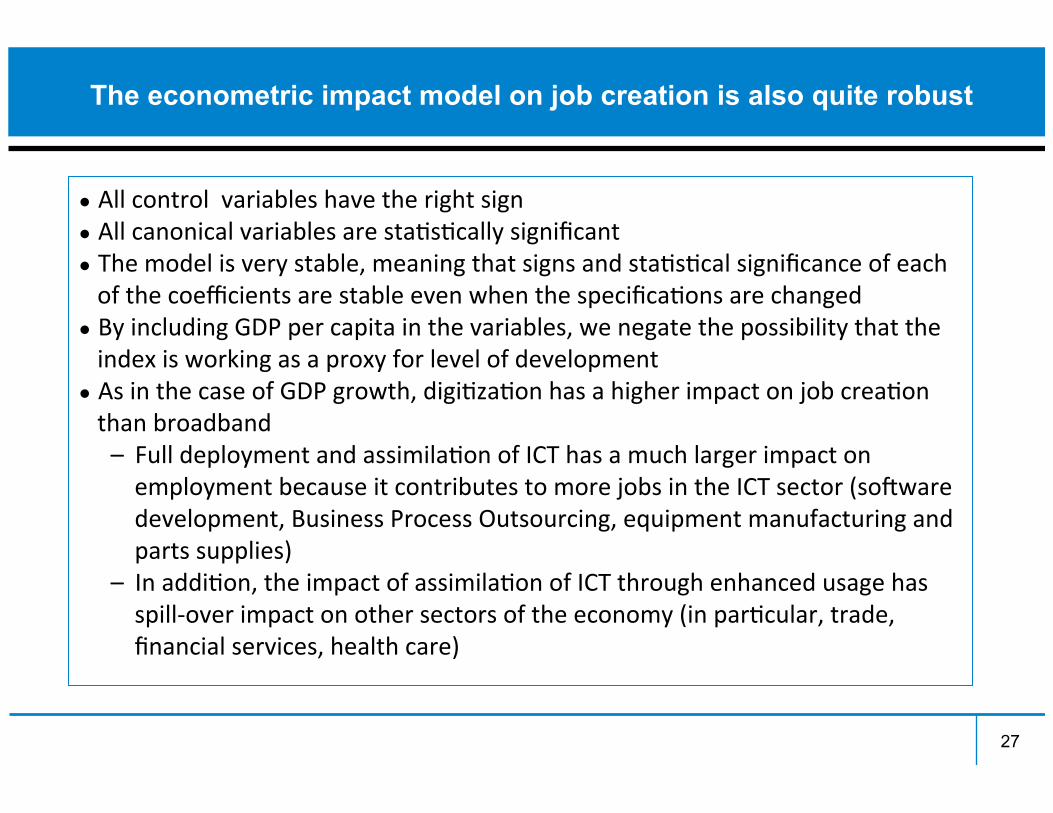
The econometric impact model on job creation is also quite robust
● All control variables have the right sign ● All canonical variables are sta2s2cally significant ● The model is very stable, meaning that signs and sta2s2cal significance of each of the coefficients are stable even when the specifica2ons are changed
● By including GDP per capita in the variables, we negate the possibility that the index is working as a proxy for level of development
● As in the case of GDP growth, digi2za2on has a higher impact on job crea2on than broadband – Full deployment and assimila2on of ICT has a much larger impact on employment because it contributes to more jobs in the ICT sector (so@ware development, Business Process Outsourcing, equipment manufacturing and parts supplies)
– In addi2on, the impact of assimila2on of ICT through enhanced usage has spill-‐over impact on other sectors of the economy (in par2cular, trade, financial services, health care)
27

One of the most interesting and yet unexplored parameters of Digitization is the link to overall societal welfare
● This suggests a hypothesis that Digi2za2on has a direct effect on the overall happiness and life sa2sfac2on that people earn from the capaci2es and capabili2es of engaging in digital technology plaDorms
● A classic counter-‐argument stems from the causal link between the life sa2sfac2on and Digi2za2on, manifes2ng that people might self-‐select to be in a country or regional context with higher provisions of digital services rather than being the subjects of various offerings
● Nevertheless for the vast majority of popula2on, one would infer that people would not migrate for an abundance of Digi2za2on services and technologies
● For this purpose we choose not to model this rela2onship in a strict quan2ta2ve manner but prefer to highlight it in a correla2ve approach
28

Digitization appears to be correlated with life satisfaction and well being
10
10
1020
20
2030
30
3040
40
4050
50
5010
10
1020
20
2030
30
3040
40
4050
50
502
2
22.5
2.5
2.53
3
33.5
3.5
3.52
2
22.5
2.5
2.53
3
33.5
3.5
3.52
2
22.5
2.5
2.53
3
33.5
3.5
3.52005
2005
20052006
2006
20062007
2007
20072008
2008
20082009
2009
20092010
2010
2010Digitization Index
Digitiz
ation
Inde
x
Digitization IndexLife Satisfaction
Life Satisfaction
Life SatisfactionGraphs by Year
Graphs by Year
Graphs by Year • Digi2za2on & Life sa2sfac2on: limited effects from 20 to 40, consistent improvement from 40 to 60
• At lower levels of development is more related to the sa2sfac2on of basic needs (such as food and shelter in the Maslow Scale), while at higher levels of development, once these needs are addressed, digi2za2on becomes more relevant
29 29 29

Agenda
● Measuring digitization
● Assessing digitization’s economic impact
● Digitization in Europe
● Elements of a future agenda
30

The Europe 27 countries are, in aggregate, at an advanced digitization level, only below North America and Western Europe
31
62 59
55
45
33 31 35
12
42
25 32
0
10
20
30
40
50
60
70
DIGITIZATION BY REGIONS (2011)
Source: Katz, Koutroumpis, Callorda (2012) * Europe 27 countries, without Malta because lack of information

Furthermore, these countries have made progress in some areas of their digitization index in the last eight years
32
0
10
20
30
40
50
60
70
80
90
100
2004 2005 2006 2007 2008 2009 2010 2011
Index Affordability Infrastructure Network Capacity Usage Human Capital
Index CAGR (%)
Digitization 5.16%
Affordability 0.80%
Infrastructure 0.38%
Network Access 6.44%
Capacity 16.84%
Usage 4.30%
Human Capital 1.93%
EUROPE 27: DIGITIZATION INDEX(2004-2011)

When disaggregated, half of the countries in Europe 27 are at an advanced stage, while the remainder is in a transitional situation
33
68 66 65 64 63 60 59 58 58 57 56 55 55 55 54 54 54 54 53
48 48 48 48 47 46 45 44
0
10
20
30
40
50
60
70
80
Denm
ark
Unite
d Ki
ngdo
m
Luxe
mbo
urg
Finla
nd
Swed
en
Belgi
um
Fran
ce
Portu
gal
Austr
ia G
erm
any
Irelan
d Ne
ther
lands
Eu
rope
27
Mea
n Sl
oven
ia Cz
ech
Repu
blic
Rom
ania
Spain
Ita
ly Lit
huan
ia G
reec
e Po
land
Bulga
ria
Cypr
us
Slov
ak R
ep.
Latvi
a Es
tonia
Hu
ngar
y
EUROPE 27: DIGITIZATION INDEX (2011)
Source: Katz, Koutroumpis, Callorda (2012)

Each group of countries exhibit different sub-indices and challenges
34
95
26
71
88
56
32
0
20
40
60
80
100
Affordability Infrastructure Network Access
Capacity Usage Human Capital
90
16
60 63
39 32
Affordability Infrastructure Network Access
Capacity Usage Human Capital
EUROPE 27: COMPONENTES OF THE DIGITIZATION INDEX (2011) ADVANCED COUNTRIES (*) TRANSITIONAL
COUNTRIES (*)
(*) Denmark, United Kingdom, Luxembourg, Finland, Sweden, Belgium, France, Portugal, Austria, Germany, Ireland, Netherlands
(*) Slovenia, Czech Republic, Romania, Spain, Italy, Lithuania, Greece, Poland, Bulgaria, Cyprus, Slovak Republic, Latvia, Estonia, Hungary Source: Katz, Koutroumpis, Callorda (2012)

Digitization in the Europe 27 countries has generated USD 343 B in new GDP over the last 8 years
35
2004 2005 2006 2007 2008 2009 2010 2011 Total Digitization Index 38.6 39.7 41.7 43.8 46.7 49.0 52.6 54.9 -
GDP Impact (´000 000 000 USD) - $24.03 $46.53 $53.21 $67.21 $50.23 $61.48 $40.87 $343.57
Employment Impact (job/years) (´000) - 265 512 544 655 541 760 480 3,759
EUROPE 27: ECONOMIC IMPACT OF THE DIGITIZATION (2004-2011)

Europe 27 countries have made progress on affordability, network and capacity components, but still have limitations in infrastructure and usage
36
0
20
40
60
80
100 Affordability
Infrastructure
Network
Capacity
Usage
Human Capital
EUROPE 27: COMPONENTS OF DIGITIZATION (2011)
Source: Katz, Koutroumpis, Callorda (2012)

When compared with Norway, the country with the highest index, the challenges for the Europe 27 countries are highlighted
37
0
20
40
60
80
100 Affordability
Infrastructure
Network
Capacity
Usage
Human Capital
COMPARATIVE ANALYSIS OF THE COMPONENTS OF THE DIGITIZATION (2011) EUROPE 27 = 54.9 NORWAY = 72.3
Source: Katz, Koutroumpis, Callorda (2012)
0
20
40
60
80
100 Affordability
Infrastructure
Network
Capacity
Usage
Human Capital
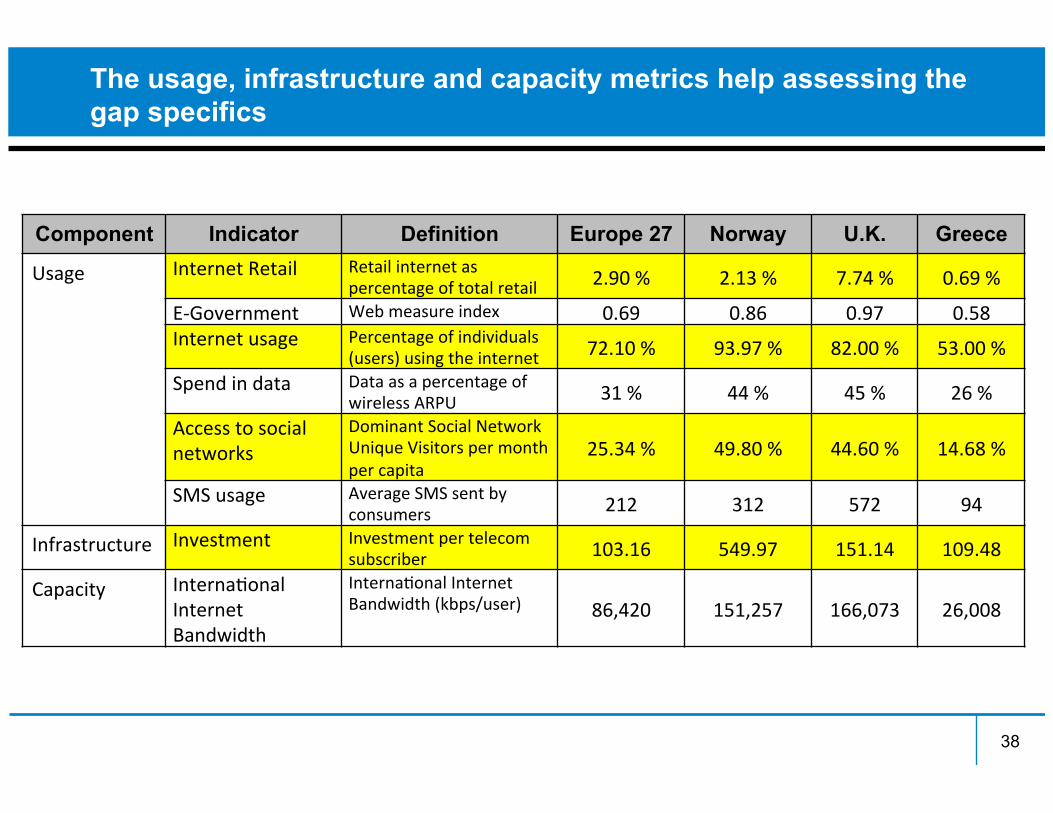
The usage, infrastructure and capacity metrics help assessing the gap specifics
38
Component Indicator Definition Europe 27 Norway U.K. Greece
Usage Internet Retail Retail internet as percentage of total retail 2.90 % 2.13 % 7.74 % 0.69 %
E-‐Government Web measure index 0.69 0.86 0.97 0.58 Internet usage Percentage of individuals
(users) using the internet 72.10 % 93.97 % 82.00 % 53.00 %
Spend in data Data as a percentage of wireless ARPU 31 % 44 % 45 % 26 %
Access to social networks
Dominant Social Network Unique Visitors per month per capita
25.34 % 49.80 % 44.60 % 14.68 %
SMS usage Average SMS sent by consumers 212 312 572 94
Infrastructure Investment Investment per telecom subscriber 103.16 549.97 151.14 109.48
Capacity Interna2onal Internet Bandwidth
Interna2onal Internet Bandwidth (kbps/user) 86,420 151,257 166,073 26,008
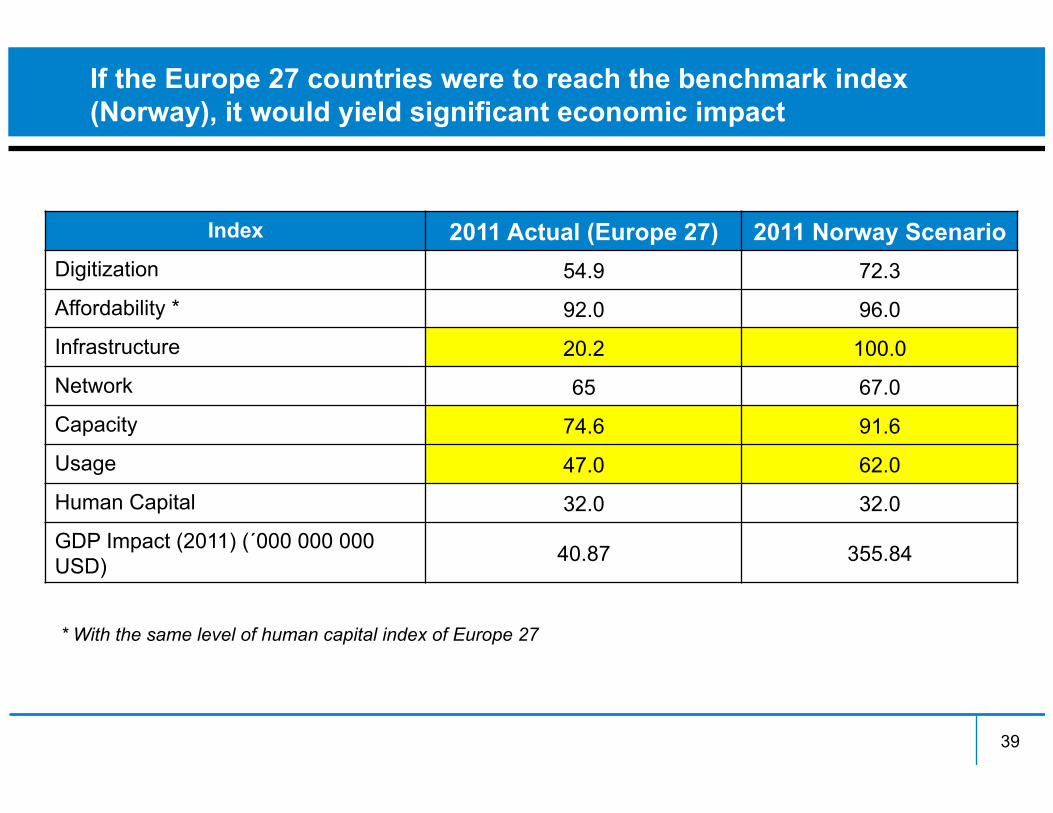
If the Europe 27 countries were to reach the benchmark index (Norway), it would yield significant economic impact
39
Index 2011 Actual (Europe 27) 2011 Norway Scenario Digitization 54.9 72.3
Affordability * 92.0 96.0
Infrastructure 20.2 100.0
Network 65 67.0
Capacity 74.6 91.6
Usage 47.0 62.0
Human Capital 32.0 32.0
GDP Impact (2011) (´000 000 000 USD) 40.87 355.84
* With the same level of human capital index of Europe 27

Agenda
● Measuring digitization
● Assessing digitization’s economic impact
● Digitization in Europe
● Elements of a future agenda
40

The component analysis allows identifying the challenges facing Europe’s Digital Agenda
● Europe has improved 5.16% annually in terms of its digi2za2on in the past eight years
● While affordability has barely improved (0.80%), Europe was at the highest level of all industrialized countries
● The principal improvement areas have been capacity (interna2onal connec2vity and broadband connec2ons >2 mbps) (16.84%) and network access (broadband, mobile and PC penetra2on) (6.44%)
● However, three areas remain with significant challenges: infrastructure (investment) (0.38%), usage (e-‐Commerce, e-‐Government, Data ARPU, social network usage) (4.30%), and human capital (1.93%)
● In sum, public policy focus should be promo2on of investment, s2mulate demand through applica2ons development, and grow human capital
41 41 41

As a starting point, Europe might need to address inefficiencies in the supply and demand side of digitization
42
Demand for digital goods
Digital Technology Firms
DEMAND SIDE INEFFICIENCIES
Production Factors
SUPPLY SIDE INEFFICIENCIES
• Consumers • Enterprises • Government
• Demand production factors (capital, labor, technology)
• Supply digital goods
• Capital • Human capital • Technology
infrastructure
FRAMEWORK FOR ADDRESSING THE
DEMAND GAP
FRAMEWORK FOR ADDRESSING THE
SUPPLY GAP

Conclusion
● Digi2za2on is a global concept, with significant heterogeneity within and across regions
● Digi2za2on index builds on six pillars: affordability, reliability, capacity, access, usage and skills
● Index linked to higher growth, and employment with increasing returns to scale ● Significant finding since it s2pulates that full economic impact of ICT
is achieved through the cumula2ve adop2on of all technologies, in addi2on to the assimila2on and usage in the produc2on and social fabric
● The policy implica2on is that achieving broadband penetra2on is only one aspect of required policies; maximiza2on of economic impact can only be achieved through a holis2c set of policies ranging from telecoms to compu2ng to adop2on of internet and Ecommerce
● At higher levels of its development, digi2za2on contributes to welfare, thereby improving human development
43 43 43

44