USGS Water Missouri Sciences Center USGS Upper Midwest … · 2015-09-02 · native fishes in the...
37
Transcript of USGS Water Missouri Sciences Center USGS Upper Midwest … · 2015-09-02 · native fishes in the...


David W. BolgrienU.S. EPA
Office of Research and Development
EMAP Symposium 2007
An Ecological Assessment An Ecological Assessment of the Mississippi, Missouri, of the Mississippi, Missouri,
and Ohio Riversand Ohio Rivers

Environmental Monitoring and
Assessment Program for Great River
Ecosystems(EMAP-GRE)
http://www.epa.gov/emap/greatriver
EPA ORD NHEERL MED: Ted Angradi, Brian Hill, Terri Jicha, Deb Taylor, Mark Pearson, Sharon Batterman, Mary Moffett, Al Batterman, Leroy Anderson, Colleen Elonen
EPA Regions: Larry Shepard & Bill FranzEPA ORD NERL: Jim Lazorchak, Brent Johnson
USGS Water Missouri Sciences CenterUSGS Upper Midwest Environmental Sciences Research CenterWI, MN, IA Departments of Natural ResourcesIllinois Natural History SurveyMissouri Department of ConservationOhio River Valley Water Sanitation Commission.University of KansasUniversity of MinnesotaUniversity of IowaStroud Water Institute
ThemeAssessing condition is a
prerequisite of protecting the health &
services of Great Rivers.

EPA Ecological Research Program MissionConduct innovative ecological research;Provide information & methods needed;
Shape policy & management actions at multiple scales.
EMAP-GRE’s GoalsResearch assessment approach for Great Rivers. Demonstrate the approach with states & managers.Transfer the data & approach to managers.

The ProblemWater quality problems on Great Rivers might be real and
ominous or they might just be water quality standards problems because assessment approaches are inconsistent.
Unmet needs for assessments of Great RiversEstimate extent of environmental condition.Estimate extent of stressors and disturbance.Condition assessment relative to a reference.Account for effectiveness of management actions.Estimate impact rivers have on receiving waters.Estimate impact of climate change on river ecology.

Drivers of Great River Monitoring and Assessment
• MajorEndangered Species ActRestoration/rehabilitationAdaptive management designated uses (navigation, flood control, hydropower, habitat,irrigation)Targeted problems, sites, chemicals, or conditions (hypoxia, NEPA, nutrient loading, non-point source pollution, sedimentation)
• MinorClean Water Act (CWA designated uses & use attainment , standards)
Currently, inventorying water quality and identifying impairments are deemed impractical because of the lack of consistent sampling designs, designated uses, water quality standards, and biological criteria.

River managers and policy-makers are data-poor and information-poor.
Upper Mississippi River Water Quality data;
1953-2002Upper Mississippi River
Conservation Comm.
42 stations 1--------------- = ---236 miles 6
19 stations 1--------------- = ---275 miles 15
1 station 1--------------- = ---100 miles 100
20 station 1--------------- = ---90 miles 4.5
24 station 1--------------- = ---80 miles 3.3
0 station 0--------------- = ---80 miles 80
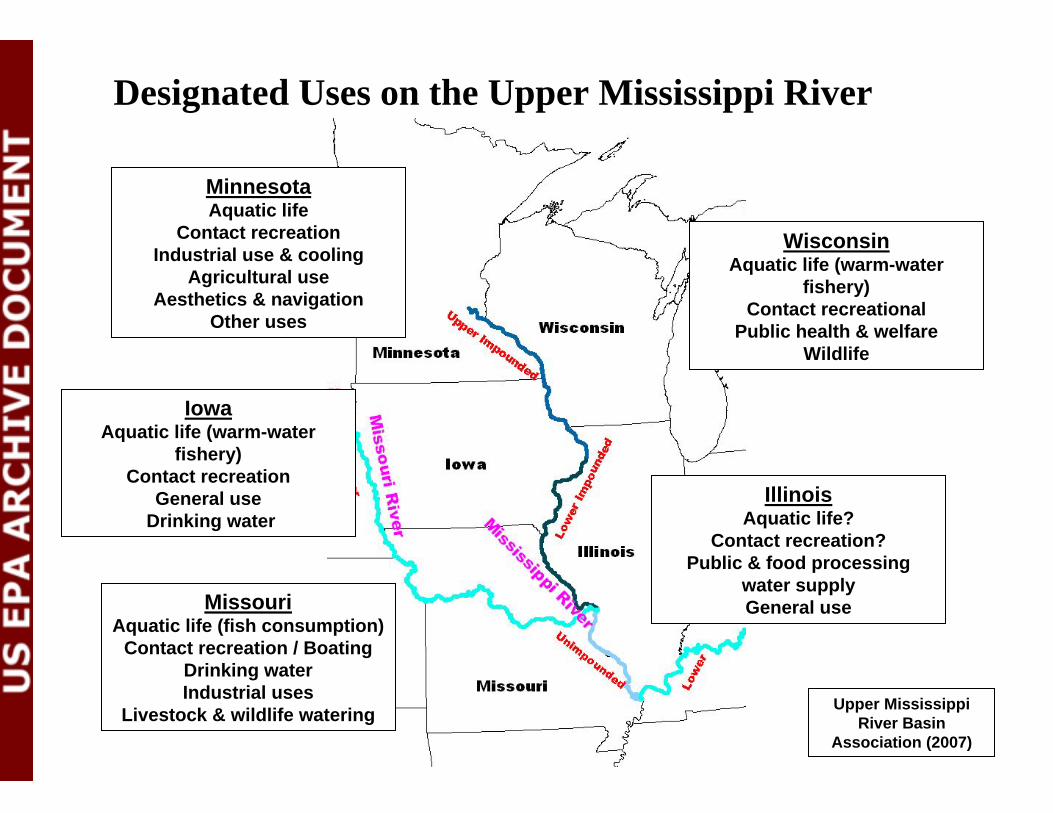
MissouriAquatic life (fish consumption)
Contact recreation / BoatingDrinking waterIndustrial uses
Livestock & wildlife watering
IowaAquatic life (warm-water
fishery)Contact recreation
General useDrinking water
MinnesotaAquatic life
Contact recreationIndustrial use & cooling
Agricultural useAesthetics & navigation
Other uses
WisconsinAquatic life (warm-water
fishery)Contact recreational
Public health & welfareWildlife
IllinoisAquatic life?
Contact recreation?Public & food processing
water supplyGeneral use
Designated Uses on the Upper Mississippi River
Upper Mississippi River Basin
Association (2007)

MissouriRiver is not listed.
IowaNutrients (local) (aquatic life)
Arsenic (local) (drinking water)
MinnesotaPCB & Hg (fish tissue) (FCA)
Mercury (water) (FCA)Turbidity (aquatic life)Nutrients (recreation)
Fecal coliform (recreation)Wisconsin
PCB & Hg (fish tissue) (FCA)PCB & Hg (water) (FCA)
IllinoisPCB (fish tissue) (FCA)
Manganese (local) (drinking water)Fecal coliform (recreation)
Listed impairments on the Upper Mississippi RiverMost criteria are narratives.
Upper Mississippi River Basin Association
(mostly 2006 reports)
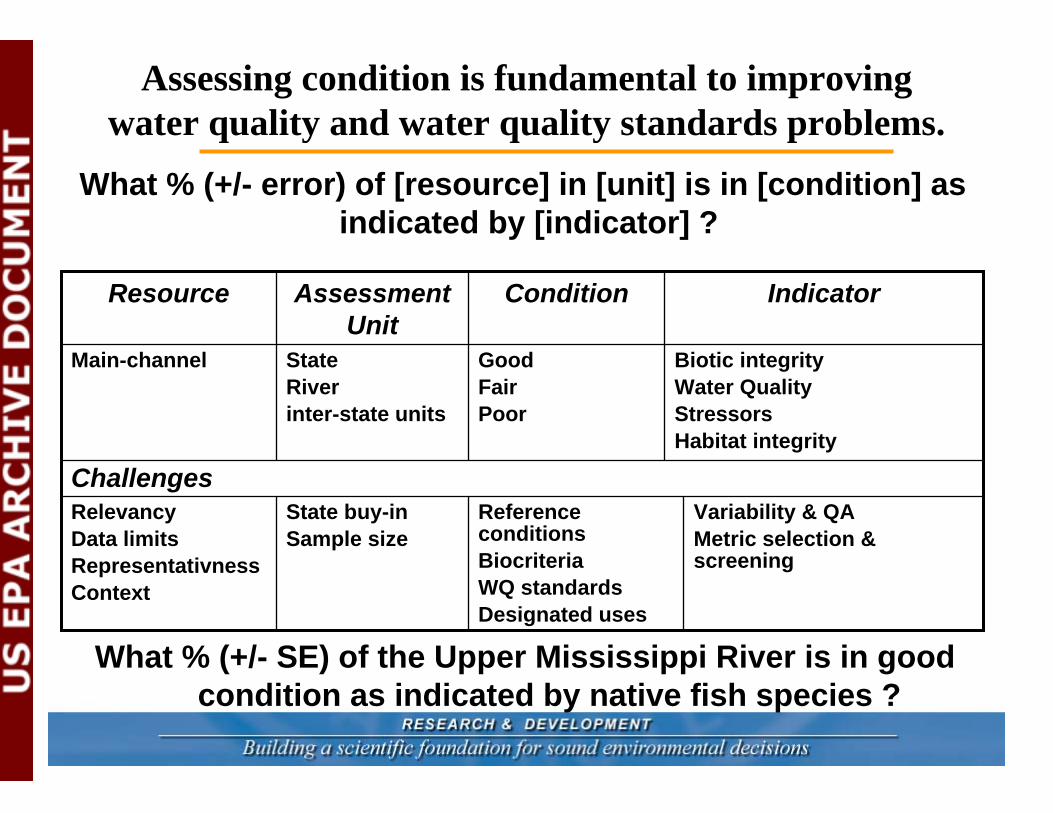
What % (+/- error) of [resource] in [unit] is in [condition] as indicated by [indicator] ?
Variability & QAMetric selection & screening
Reference conditionsBiocriteriaWQ standardsDesignated uses
State buy-inSample size
RelevancyData limitsRepresentativnessContext
Challenges
Biotic integrity Water Quality StressorsHabitat integrity
GoodFairPoor
StateRiverinter-state units
Main-channel
Resource IndicatorConditionAssessment Unit
Assessing condition is fundamental to improving water quality and water quality standards problems.
What % (+/- SE) of the Upper Mississippi River is in good condition as indicated by native fish species ?

EMAP-GRE Basics
• Sampled Upper Mississippi, Missouri, and Ohio Rivers in 2004-2006.
• About 475 unique sites; probability-based design• 10 crews; >100 people from about 15 agencies• >8,000 samples processed• Consistent methods for multiple indicators + training + QA• Additional research includes aquatic vegetation as WQ
indicator, mussels, impairment diagnostics, methods comparisons, and integration of water & biology assessment programs
Develop & demonstrate state-based assessment technology to assess ecological conditions in the Mississippi, Missouri, and Ohio Rivers.
Transfer assessment data and technology to managers.

EMAP-GRE Program Plan
Objectives
Design
Metrics Implementation
Indicators
Stressorresponse
AssessmentStatements
Management and monitoring policy and plans;Criteria development;Trends assessments
Referencecondition
Populationestimates
Project MgmtIM, QA,partnerships
EMAP
OW
& S
tate
s
Env. researchCondition
Statements

starts here, goes through here,
& ends here.
An Ecological Assessment of the Upper Mississippi,
Missouri, and Ohio Rivers
The EMAP-GRE road map

Probability design & State Sample Sizes
27 29
13
3758
39
46 56
55
8080
448 80
49
61
38
4

Consensus-building process to developed uniform field methods, processing, QA, tracking, & data analysis procedures for all indicators.
More than “scaling-up”from streams.
http://www.epa.gov/emap/greatriver/fom.htm
An EMAP-GRE site has 11 littoral and riparian stations on 2 500-m transects and 3 cross-channel stations.

• Water QualityDissolved oxygenConductivitypHMetals (As, Pb, Se, CU, Fe, Ni, Zn)TemperatureAnions & CationsTurbidity, Suspended matterChlorophyllAlkalinityTotal & Dissolved P, N, & CParticulate organic NSilicaElemental particle analysisParticulate stable isotopes
• SedimentEnzyme activityToxicityGrain sizeTotal and volatile matter Chemistry (organics, inorganics)
• Biotic AssemblagesFish
Tissue contaminantsGenetic diversity
InvertebratesLittoralSnags
ZooplanktonPhytoplanktonPeriphytonSubmersed aquatic vegetation
Habitat & LandscapeLittoral
Vegetation coverSubstrate DepthVelocityWoody debris
Riparian Development/disturbance
Selected metrics and indicators balance assessment & research.
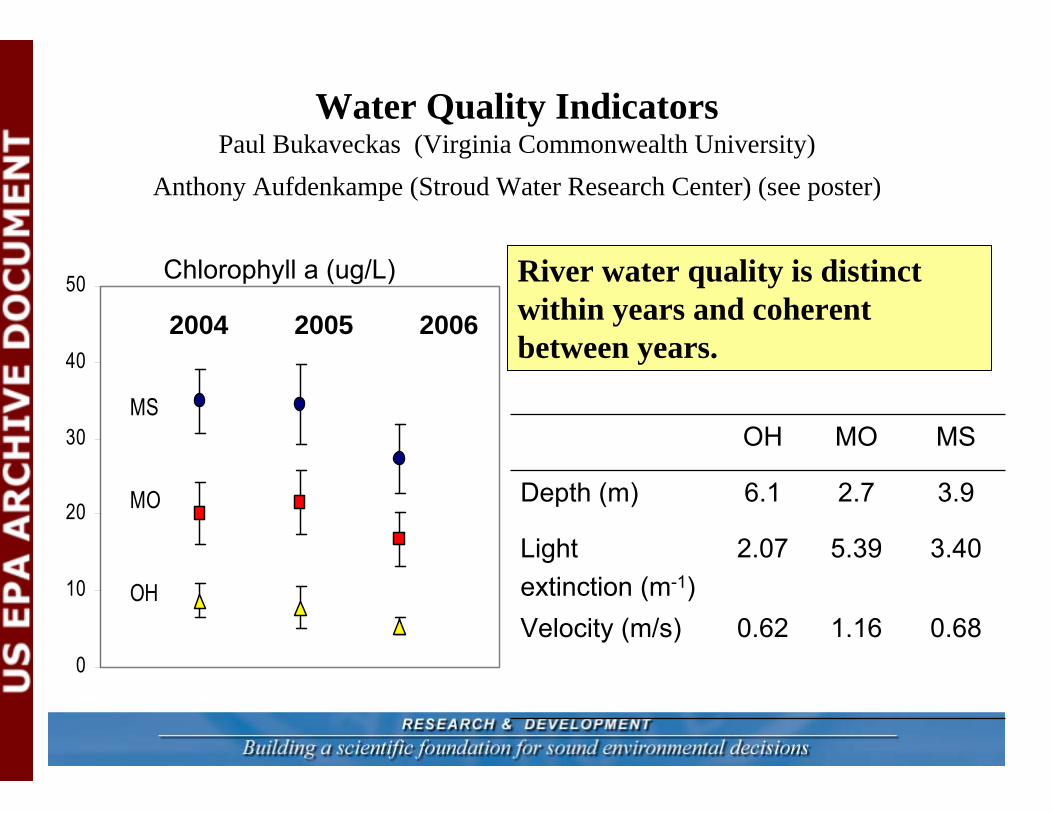
Water Quality IndicatorsPaul Bukaveckas (Virginia Commonwealth University)
Anthony Aufdenkampe (Stroud Water Research Center) (see poster)
0
10
20
30
40
50
MS
MO
OH
2004 2005 2006
0.681.160.62Velocity (m/s)
5.39
2.7
MO
3.402.07Lightextinction (m-1)
3.96.1Depth (m)
MSOH
Chlorophyll a (ug/L) River water quality is distinct within years and coherent between years.

Water chemistry reflects nutrient inputs and processes.River production & processes may be limited by P and C.
TN : TP 1 10 100 1000
TOC
: TN
0.01
0.1
1
10
100
1000
Mississippi RiverMissouri RiverOhio River
N-limited
C-limited
P-limited

0.00010.001
0.010.1
110
1001000
10000
Downstream trends in nutrient loads
Estimated mean annual flow from National
hydrologic data
N Loading (T/yr)
upriver mouth
MS
0
1000
2000
3000
4000
5000
6000
7000
0 20 40 60
Percent Agriculture
TN (u
g/L) N concentrations (ug/L)
and % agriculture
+MSMOOH

Acres of Shallow Floodplain Habitat - 5 Days Upriv
0.0 2.0e+7 4.0e+7 6.0e+7 8.0e+7 1.0e+80
1
2
Biological ResultsJohn Chick & Alex Luvcek Illinois Natural History Survey
John Havel Missouri State UniversityJeff Jack University of Louisville
Cladoceran Diversity Index
Zooplankton habitat needsRotifers secondary channels, temperature, chl-a, turbidityCladocerans secondary channels & contiguous shallow floodplain aquatic areas, temperature, conductivity, chl-aCopepods backwater lakes & contiguous shallow floodplain aquatic areas, conductivity, temperature, pH
Upper Mississippi River zooplankton diversity increases with more upriver shallow floodplain area..

naupliiCopepodaCladocera
River kilometer025050075010001250225025002750
Rotifera
FP1 FP2 GAR URR LRR LCM1 LCM2 LCM3 LCM4 LCM5
The zooplankton in the inter-reservoir
Missouri were diverse but densities were
very low relative to densities in the
channalized river.
Rotifers dominated the assemblage in the
lower river.
Rotifers only
Everythingexcept rotifers
upper lower mouth
Den
sity
(#/L
)
0
20000
0
20

Higher diversity of native fishes in the Upper MS River could reflect higher habitat diversity.
Higher diversity of “Great Rivers” fishes in Missouri River could reflect retention of Great River character despite modifications.
Fish abundance and assemblage diversity
0
5
10
15
20
Missouri Mississippi Ohio
Native fish species richnessGreat River fish species richness
Poster: Ted Wallace and Val Barko

0
500
1000
1500
2000
2500
3000
3500
4000
4500
5000M
edia
n C
once
ntra
tion,
ng/
g lw
Lower Missouri RiverUpper Mississippi RiverOhio River
∑PCB ∑PBDE ∑CHL ∑DDT
Survey of organochlorine pesticides, PCBs, 10 PFCs, PBDEs, PFOAs, musks, and Hg in selected fish species.
Tettenhorst. et al. (2006)
PFCs (mostly PFOS) were widely distributed (beyond currently known areas); Ohio R. > Mississippi = Missouri

Phylogenetic tree for select Catostomids: Black Buffalo and Smallmouth Buffalo
EMAP-GRE is using genetics to research stressor response and biogeography.
Do fish hybridization rates differ in stressed systems?
Is genetic diversity an indicator of community or population health?
Is genetic diversity an indicator of biogeographicalboundaries within river ecosystems or between basins?

EMAP-GRE is contributing to
methods development for ecologically
relevant pharmaceuticals and metabolites in water,
fish tissue, and sediment.
Non-steroidal anti-inflammatory drugs (ibuprofen, aspirin, acetaminophen)
OpioidsThyroid hormonesStatinsAngiotensin antagonistsDiureticsCNS monoamine agonistsEstrogensCalcium channel blockers
Beta-blockersAnti-diabetes drugsCorticosteroids
Angela Batt, Mitch Kostich, Jim Lazorchak, Dan Bender
EPA NERL

# na
tive
fish
spec
ies
16.0
20.0
18.0
channels constrained by human activity (levees, dikes)
naturally constrained
channels (incision,
narrow valley)
unconstrained channels (can access floodplain)
14.0
16.0
18.0
20.0
multiple channels (braided,
anastomosing)
reaches confined to
single channel
Results from all rivers show that native fish species richness is highest in more complex and less constrained channels.
Physical Habitat & Fish Species Richness

Spatial scales of landscape analyses range from continental basin (29% of contiguous U.S.) to local
catchments.

Characterizing spatially-nested site-specific catchments
Local
50 kmcatchment
100 kmcatchment

0
0.1
0.2
0.3
0.4
0.5
0.6
0.7
0.8
0.9
1
Landscape ResultsOn MS & Lower MO, local and floodplain catchments are
relatively less disturbed than catchments upriver, off-channel, and up tributaries. Little change with scale on OH or Upper MO.
natural
disturbed
Catchment size Local floodplain 10 km 50 km 100 km
MS OH Low MO Up MO

EMAP-GRE Program Plan
Objectives
Design
Metrics Implementation
Indicators
Stressorresponse
AssessmentStatements
Management and monitoring policy and plans;Criteria development;Trends assessments
Referencecondition
Populationestimates
Project MgmtIM, QA,partnerships
EMAP
ConditionStatements

Characterizing Reference Conditions
• Reference conditions are relative, empirical, and extant. They are the “best of what is left”.
• Multiple abioticmetrics define reference conditions.
--++
Distance NPDES discharge*Percent forest + wetlandPercent cultivatedPercent impervious surface*
Local landscape
-Sediment toxicity indexExposure
+-+
Human disturbance indexHuman development score Percent of rip-rap shore
Physical habitat
++++--
Total NTotal PChloride*SulfateSecchi depth*DO
Water quality
Expected response
Filteringmetric
Metric Type

Results: Upper Mississippi River
Metrics vary along river.(examples from table)
Less stressMore stress
Combining metrics into a stressor
gradient.

Sites scoring in top 25th percentile of index are “least-disturbed”sites. Least disturbed sites only
found in some pools. Gradients or classification of reference
condition is important issue.
There are more native fish species at least-disturbed
site than other sites.

The top 75 percentile of the least-disturbed sites define least-
disturbed conditions.Least-disturbed conditions, as
defined with abiotic metrics, have> 20 species of native fish.
Biology should respond to reference conditions.
Reference conditions do not respond to biology.
Percentile of least-disturbed sites
% of length of Upper MS River(population estimates)

From preliminary data, we estimate that 27.6 (+/- 3.4)% or 384 km of the Upper Mississippi River are in good condition as indicated by native fish species.

• Assessment of the Upper Mississippi, Missouri, and Ohio Rivers.Analyses of core indicators and reference conditions for assessmentNovel analyses
• Fish genetics (biogeography, non-indigenous species, cryptic species, response to stressors, including climate change)
• Biotic integrity indices for “other than fish” assemblages (zooplankton, algae)• Integrated multi-scalar landscape & physical habitat indicators• Extent of novel contaminants in fish tissue
Outreach to managers (states & programs)• Contribute to National River Assessments
2007 Partnerships & Development2008-2009 Field campaigns: Rivers (including Great Rivers) and Streams2010-2011 Data analyses and reporting
Future Directions for EMAP-GRE
“In FY2008, EMAP will transition to become a data analysis program that focuses on analyzing (accumulated) data”
(EPA’s Budget Justification to Congress March 2007)

Objectives
Design
MetricsImplementation
Reference condition
Populationestimates
ConditionStatements
Management andpolicy outcomes;Criteria development;Monitoring plansManagement plansTrends assessments
Indicator development
Stressorresponseresearch
Project MgmtIM, QA,partnerships
Community Health
Stressors
Ecosystems
Ecosystem Services
Researching, demonstrating, & transferring assessment methods are prerequisites of protecting ecosystem health
& services of Great Rivers.