The Big I's Don R. Simmons, Ph.D. dentify nform nvite nvest.

USGBC's Mission
To transform the way buildings and communities are designed, built and operated, enabling an environmentally and socially responsible, healthy, and prosperous environment that improves the quality of life.

USGBC's Vision
Buildings and communities will regenerate and sustain the health and vitality of all life within a generation.

USGBC statement
USGBC will pursue robust triple bottom line solutions that clarify and strengthen a healthy and dynamic balance between environmental, social and economic prosperity.

About the USGBC
• Non Profit Organization (18 + thousand)• 79 local Chapters Nationwide• 150,000 LEED Professionals• USGBC Headquarters in Washington, DC• Annual Revenue $46 million in 2007• Education, Registration & Certification,
Accreditation, Conferences, Grants & Sponsors
4RP
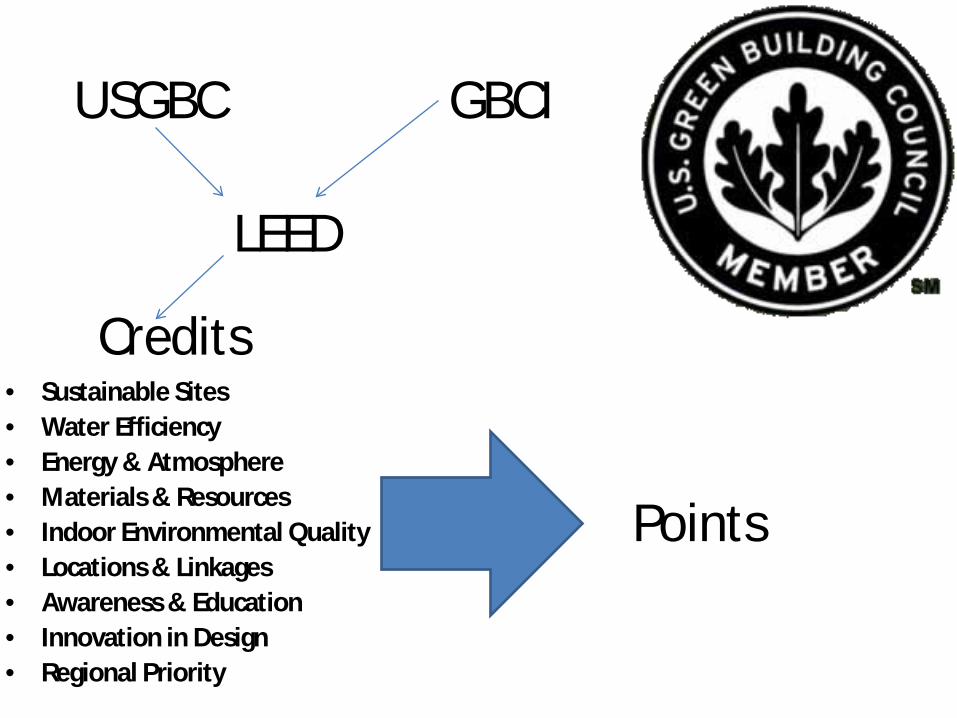
USGBC
Points
Credits
LEED
GBCI
• Sustainable Sites• Water Efficiency• Energy & Atmosphere• Materials & Resources• Indoor Environmental Quality• Locations & Linkages• Awareness & Education• Innovation in Design• Regional Priority

6MM


16,200
* As of August 2010


Why Was LEED® Created?
§ Use as a design guideline§ Recognize leaders
§ Stimulate green competition§ Establish market value with
recognizable national “brand” § Raise consumer awareness
§ Transform the marketplace

Why Was LEED® Created?
§ Facilitate positive results for the environment, occupant health and financial return
§ Define “green” by providing a standard for measurement
§ Prevent “greenwashing”§ Promote whole-building,
integrated design processes


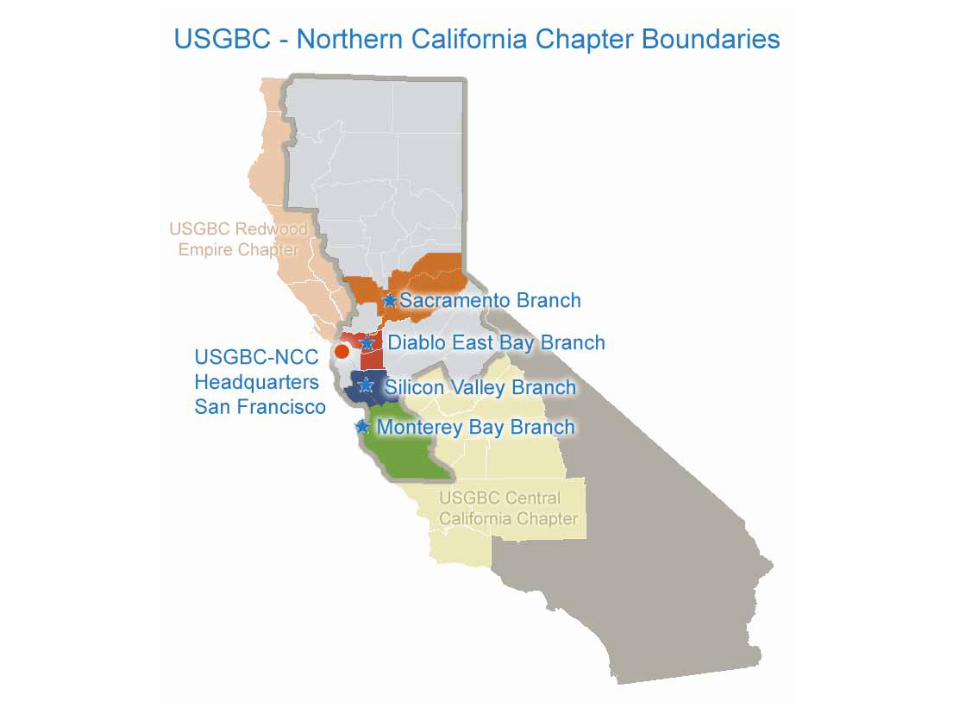
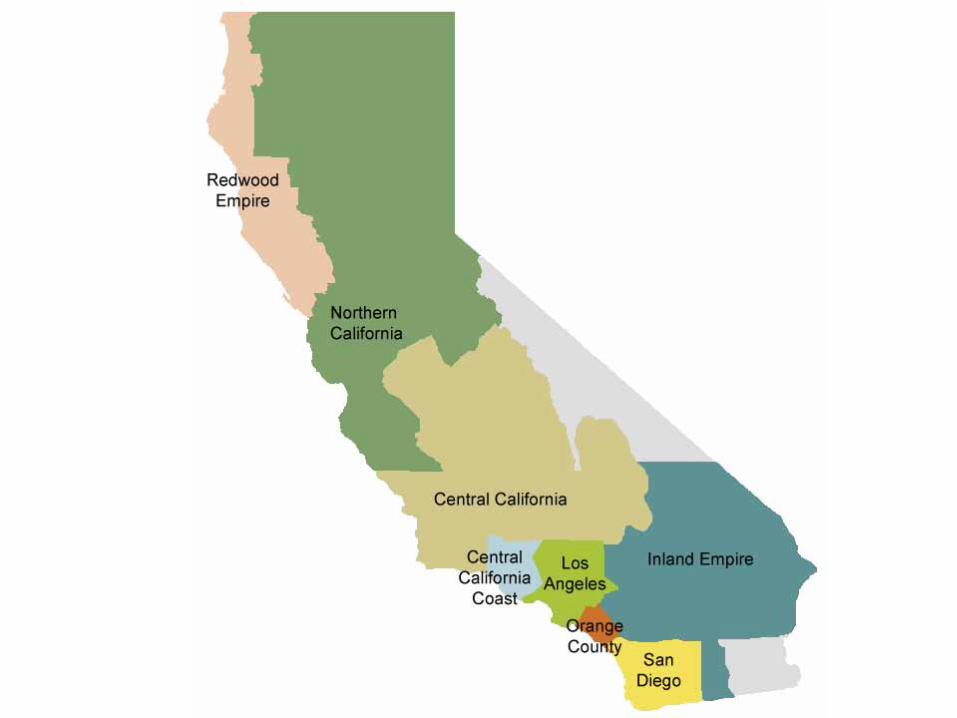
USGBC Membership
Annual Revenue of Company Dictates Membership FeeNational & Local ChapterDiscounts on purchasesPeople are Members of Local Chapter Companies are Members of National
17RP

USGBC Trademark and Logo Usage
• Only use EPS graphics provided by USGBC for logos.• Captured or scanned images are not allowed. • Acceptable sizes: 20%-380% of original or 50-200
pixels on web pages.• The symbol ® after the first most prominent use.• Include TM and SM symbols for marks owned by, but
not yet registered to, the USGBC.• Trademarks must include ownership information.• Trademarks must refer to USGBC products not those
of another organization or company.
18MM


Problems – Check out Real Life LEED

Difficulties with LEED• Time – Money – Effort
– Historically… • Complicated• Time intensive
– Prices • High as $5/ft for
documentation• High as $5 additional for
commissioning
– Miscommunication• Unclear goals • Added effort• Higher consulting fees


LEED EDGE TOOL

Lorax Pro

Certifications-or as they say it Accreditations
• LEED GA• LEED AP
– BD+C, ID+C EBO&M, Homes, ND
• Certified Home Energy Rating System (HERS) rater
• BPI, CSBA, CGBP, CGPR, etc, etc…
28


WHAT’S NEXT?
AB 32 Title 24 2008AB 811 ASHRAE 2007AB 1103 Architecture 2030ASHRAE 189 Carbon Cap & Trade
Cal Green Tiered System
SF Green Building Ordinance
SF Recycling Ordinance


Per Capita Electricity ConsumptionkWh/person
-
2,000
4,000
6,000
8,000
10,000
12,000
14,000
19601962
19641966
19681970
19721974
19761978
19801982
19841986
19881990
19921994
19961998
20002002
2004
CaliforniaUnited States
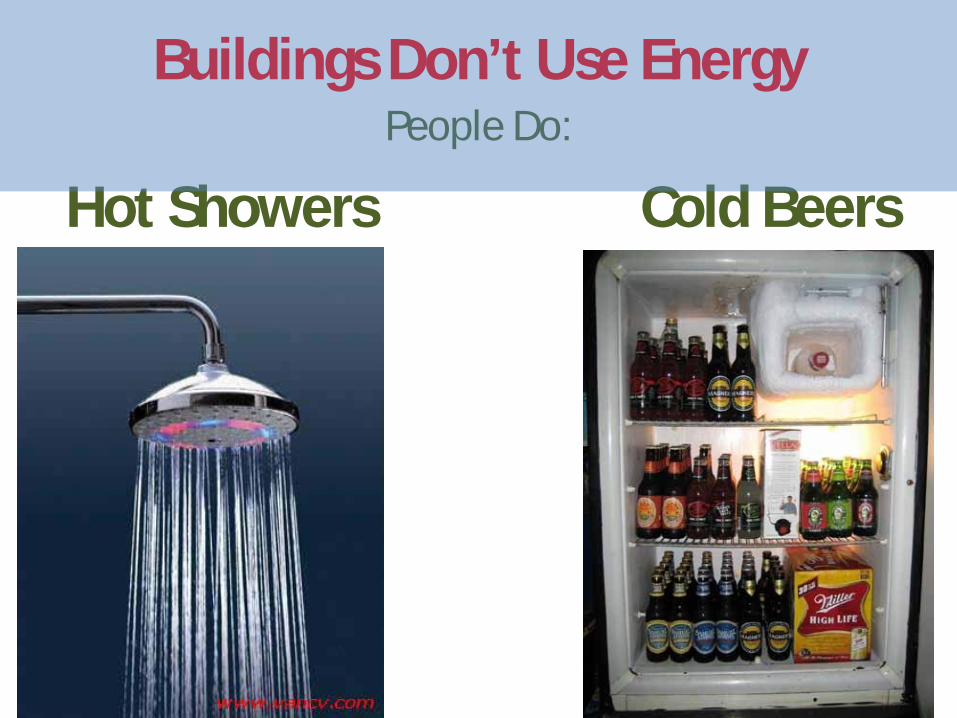
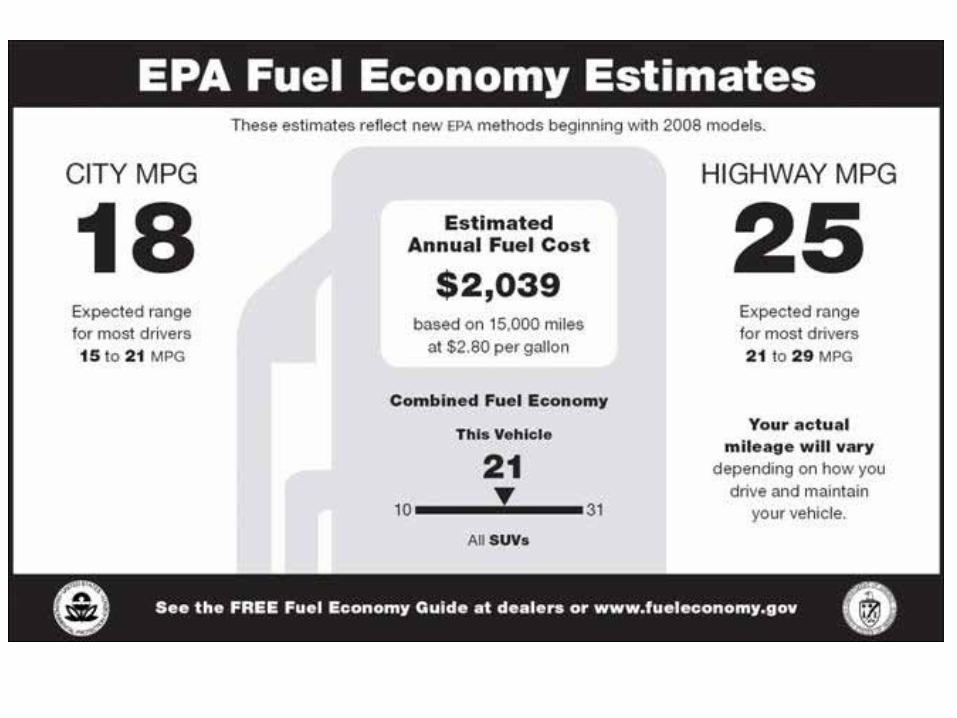
Buildings Don’t Use Energy
Hot Showers Cold BeersPeople Do:

Capital Expense
Event
Affects the building
LEED NC, CI
Process
Affects the users
Operating Expense
LEED EB
VS


Description Cost Rebate Savings ROILoad Management $445,248 $205,437 $729,185 304%Lighting $300,701 $44,918 $155,616 61%Equipment $298,439 $122,575 $107,976 61%Monitor & Controls $39,472 $11,000 $12,001 42%Water Management $145,732 $5,396 $31,287 22%Solid Waste Management $0 $0 $137,380 immediateRecycled Office Supply $0 $0 $87,000 immediatePurchase Alterernative Energy $16,000 $0 $0 N/ALEED Consultant $105,000 $0 $0 N/ARegis/Certification $12,000 $0 $0 N/ATotal $1,362,592 $389,326 $1,182,145 121%
Annual Savings
Adobe Complex, San Jose California
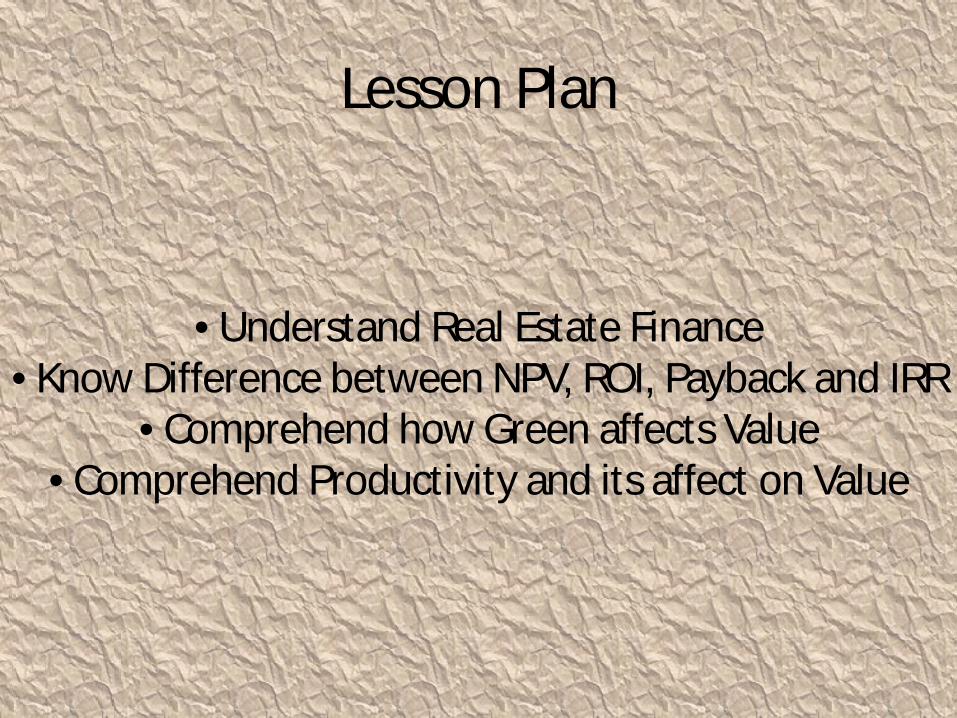
Lesson Plan
• Understand Real Estate Finance• Know Difference between NPV, ROI, Payback and IRR
• Comprehend how Green affects Value• Comprehend Productivity and its affect on Value

• Payback– Cost/Return
• Ambiguous & Problematic
• Return on Investment– A performance measure used toevaluate the efficiency of an investment
• (Gain-Initial)/Initial– Expressed as a %
Finance 101

What is NPV & IRR?
• Net Present Value (NPV)– total present value (PV) of a time series– of cash flows
• Never pass up a negative NPV project
• Internal Rate of Return (IRR)– Rate of Return when NPV is 0– Actual ROI…
Finance 101

ProjectEstimated
Cost RebateAnnual Savings
Simple Payback (yr) ROI NPV
ROI (Gain-
invest)/invest
ROI (Gain-
invest)/invest
Reduced run-time for garage exhaust fans from 8760 hours to 2236 hours, All
Towers 100 48204 immediate 48204 $269,175.19 48104% 482140%Installed HVAC occupancy control in file storage rooms, Library & Apollo
conference room. West Tower 2100 1113 1810 0.5 183 $9,121.35 39% 909%Installed automated faucets and toilet
flush valves, All Towers 110358 24949 4.4 23 $39,038.91 -77% 326%Reduced run-time for garage exhaust fans, East+West Towers. From 2236
hours annually to 871 hours annually, East+West Towers 100 50614 immediate 50614 $282,637.38 50514% 506240%
Installed web based controls & rescheduled fountain pump for
reduced run time. Was 112 hours per wk. Now 50 hrs per wk, West Tower 4400 925 5449 0.6 157 $27,202.41 45% 1317%
Tied in CBC lighting into GE Lighting Control System and placed on
schedule. Previously, lights were on 24/7; Almaden Tower 100 1016 0.1 1016 $5,584.44 916% 10260%
Installed filtration system to reduce disposable water bottles usage. All
towers 146534 82746 1.8 56 $329,003.95 -44% 665%

DCF Modeling
Like this?
Time Value of Money

Time Value of Money

competing investments
Period Year 1 Year 2 Year 3 Year 4 NPV (10%) Payback (yrs)
Duck Project
$-20 $10 $10 $100 $ 72.49 2
Goose Project
$-20 $10 $10 $0 $ -2.64 2
ElephanteProject
$-20 $0 $20 $0 $ -3.47 2
Choose a Project

competing investments
Period Year 1 Year 2 Year 3 Year 4 NPV (10%) Payback (yrs)
Duck Project
$-20 $10 $10 $100 $ 72.49 2
Goose Project
$-20 $10 $10 $0 $ -2.64 2
ElephanteProject
$-20 $0 $20 $0 $ -3.47 2
Anybody like Ducks?
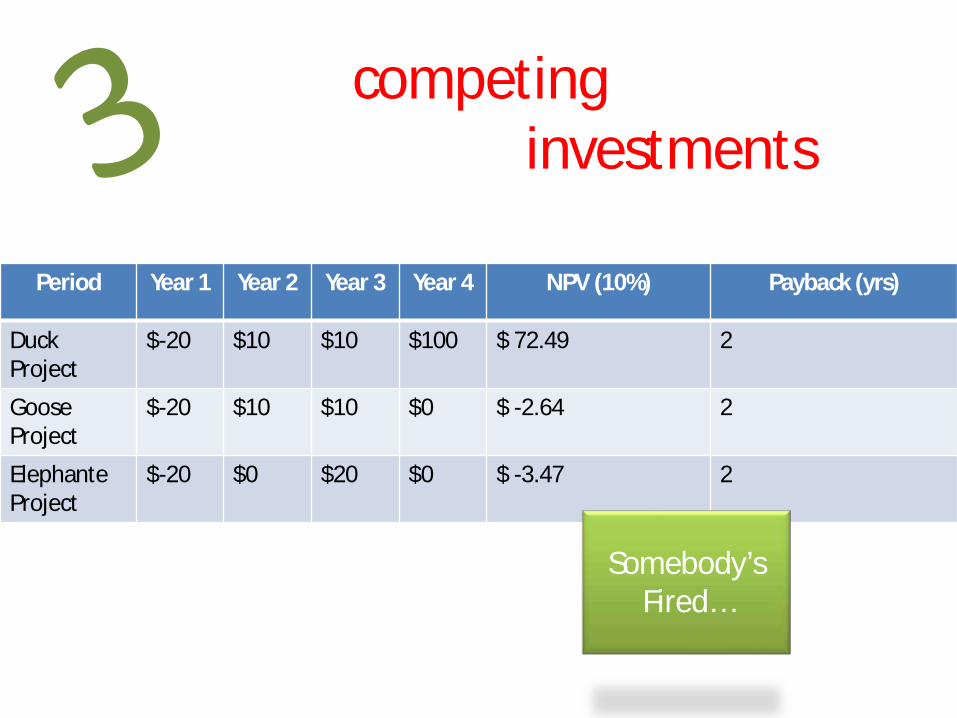
competing investments
Period Year 1 Year 2 Year 3 Year 4 NPV (10%) Payback (yrs)
Duck Project
$-20 $10 $10 $100 $ 72.49 2
Goose Project
$-20 $10 $10 $0 $ -2.64 2
ElephanteProject
$-20 $0 $20 $0 $ -3.47 2
Somebody’s Fired…

The Green 14
• Starts with 4 Categories– Income
• Market Rent Assumption
– Vacancy• Absorption Time• Stabilized Vacancy• Tenant Retention (Rollover Percentage)• Lag Vacancy• Tenant Improvements
IncomeVacancy
ExpensesRisk
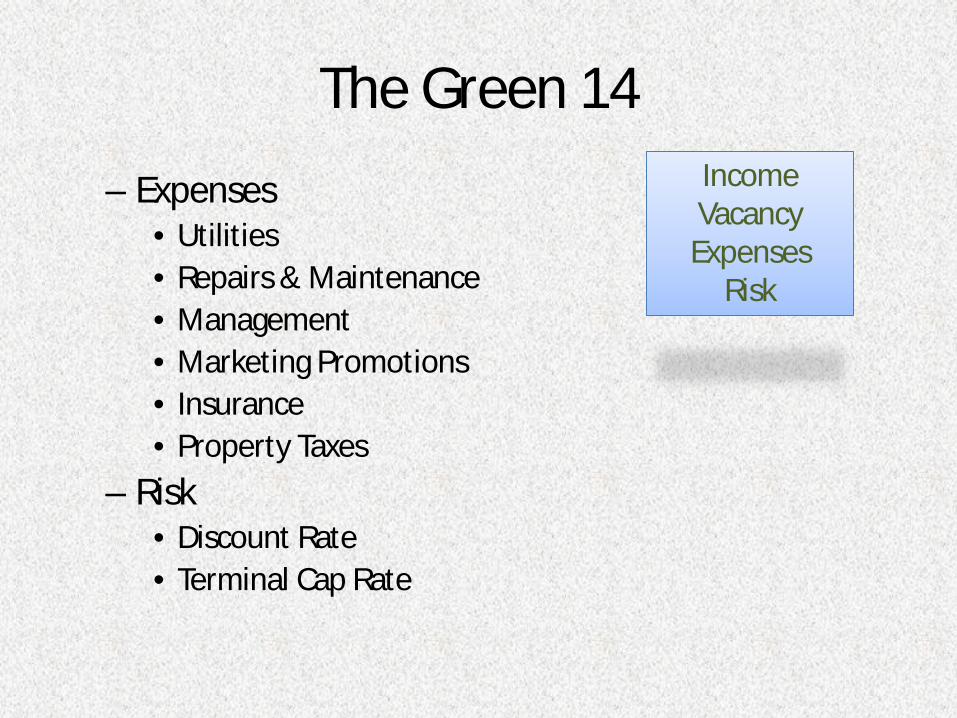
The Green 14
– Expenses• Utilities• Repairs & Maintenance• Management• Marketing Promotions• Insurance• Property Taxes
– Risk• Discount Rate• Terminal Cap Rate
IncomeVacancy
ExpensesRisk
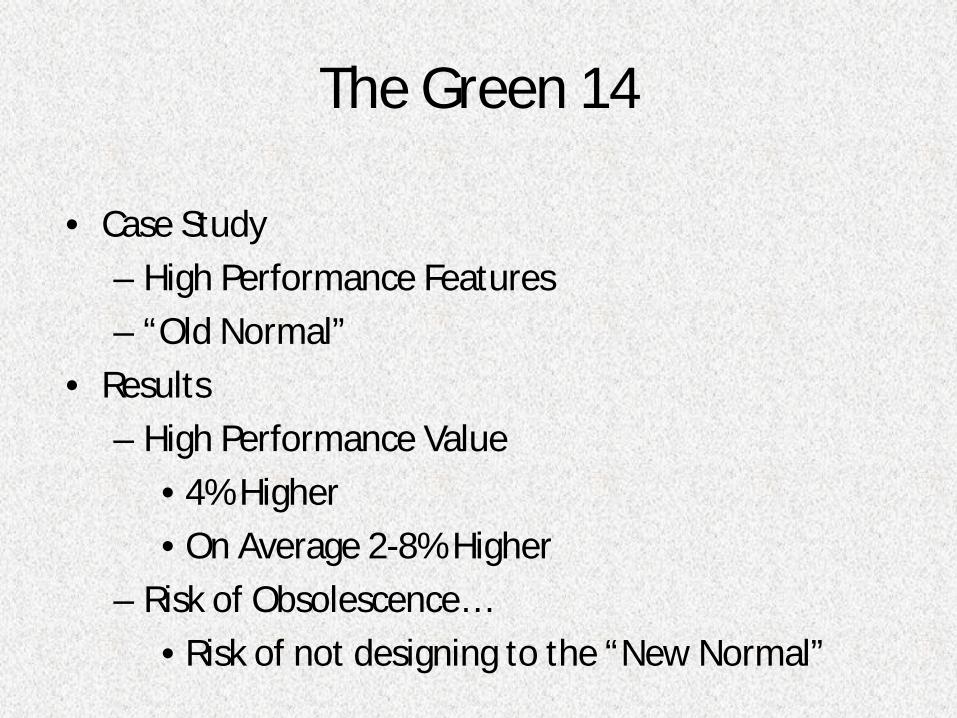
• Case Study– High Performance Features– “Old Normal”
• Results– High Performance Value
• 4% Higher• On Average 2-8% Higher
– Risk of Obsolescence…• Risk of not designing to the “New Normal”
The Green 14
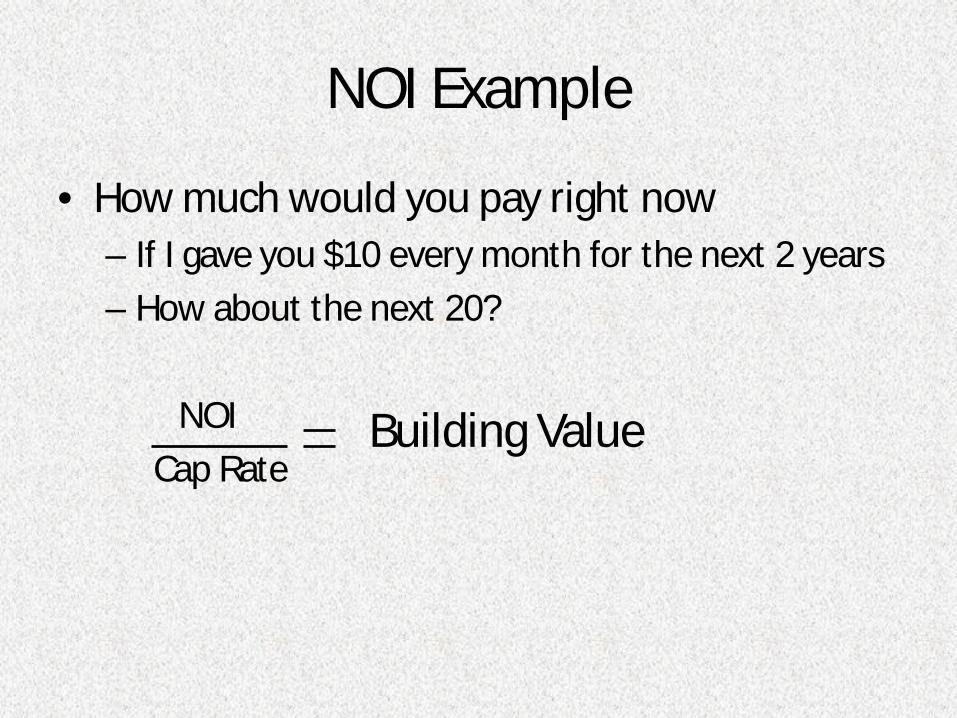
NOI Example
• How much would you pay right now – If I gave you $10 every month for the next 2 years– How about the next 20?
NOI Cap Rate
Building Value

NOI Example• How much would you pay right now
– If I gave you $10 every month for the next 2 years– How about the next 20?
NOICap Rate
NOICap Rate
This is what we effect with Green Building, Energy Efficiency and Smart Decision Making
Building Value
Building Value

NOI – expenses fall directly to BL
0%1%2%3%4%5%6%7%8%
NO
I Inc
reas
e
Energy Savings
Impact of Energy Savings on NOI

• Screen Shot

How to Measure Productivity?
• absenteeism• hours worked• tardiness• safety rule violations• number of grievances filed• employee turnover


Law Firm Example
• Australia a law firm tracked the before and after sick days after a move
• New Space– 5 green star rated building (high rating)
• found sick days reduced by 39%
• Overall dropped to .28 days per month.

Discussion Credits
• Energy Audit – EA P1/C2• Commissioning• Ventilation Compliance – IEQ P1• Green Cleaning

Discussion Credits
• Commercial Interiors HVAC Credits• Daylighting & Views• Thermal Comfort Verification
– EBOM Thermal Comfort Monitoring…

• EBOM, NC or CI– It’s difficult and the
reviewers are hard on compliance
– What are some strategies to help comply
• Identify “Critical Zones”– Ensure all have been
documented – Square Footage
comparison…
• Can’t completely rely on HVAC Engineer


Synergies
• Can anyone give me an example?– What are some Synergistic Credits in LEED?