US/Europe comparison of ATM-related operational...
50
Federal Aviation Administration EUROCONTROL US/Europe comparison of ATM-related operational performance January 19, 2010 Dave Knorr • ATO Liaison to DFS • Eurocontrol & CANSO Support USF Transportation Research Seminar
Transcript of US/Europe comparison of ATM-related operational...

Federal AviationAdministration
EUROCONTROL
US/Europe comparison of ATM-related operational performance
January 19, 2010
Dave Knorr
• ATO Liaison to DFS
• Eurocontrol & CANSO Support
USF Transportation Research Seminar

2Federal AviationAdministration
EUROCONTROL
Performance Focus Areas for ANSPs
Safety
Capacity
CostEffectiveness
Efficiency
Target: 2013
Environment
ATM Performance
Flight EfficiencyTemporal Efficiency
2008
Financial CostEffectiveness
Productivity

FAA-DFS comparison draft Nov20-08
3Federal AviationAdministration
EUROCONTROL
KPA: Safety
• FAA/ATOKPI Category A or B OE‘s per 1,000,000 operations
– Based on % of vertical and lateral separation distance lost
– Measured automatically
– Target (2008): < 2.15 Category A or B OE’s per 1,000,000 Ops
Safety
Capacity
CostEffectiveness
Efficiency
Target: 2013
Environment
ATM Performance
Flight EfficiencyTemporal Efficiency
2008
Financial CostEffectiveness
Productivity
FAA-DFS comparison draft Nov20-08
4Federal AviationAdministration
EUROCONTROL
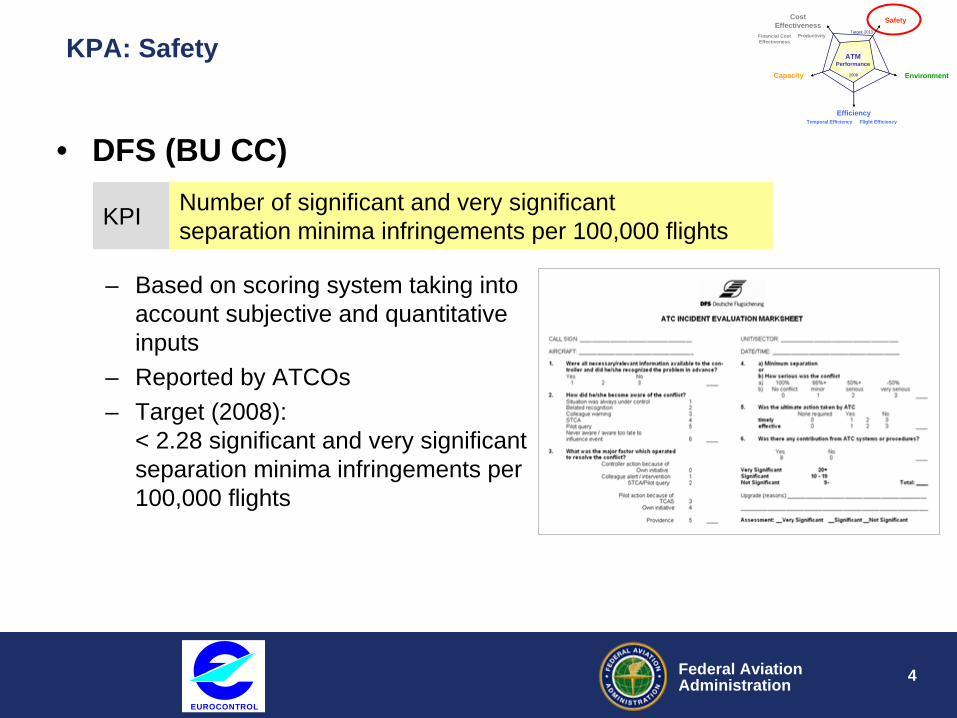
KPA: Safety
• DFS (BU CC)
KPI Number of significant and very significant separation minima infringements per 100,000 flights
– Based on scoring system taking into account subjective and quantitative inputs
– Reported by ATCOs– Target (2008):
< 2.28 significant and very significant separation minima infringements per 100,000 flights
Safety
Capacity
CostEffectiveness
Efficiency
Target: 2013
Environment
ATM Performance
Flight EfficiencyTemporal Efficiency
2008
Financial CostEffectiveness
Productivity

5Federal AviationAdministration
EUROCONTROL
KPA: Safety
• Comparison– Both DFS and ATO use
Operational Error rates as primary measure
– FAA/ATO and DFS Categorization of Operational Errors is Significantly Different
– Categorization has an impact on findings derived from measures
Very Signif icant(57) Signif icant
(323) Not Signif icant(484)
A (9)
B (217)
C (638)
24
186
428
29
132
56
450
50
100
150
200
250
300
350
400
450
DFS
Ope
ratio
nal E
rror
s (S
ampl
e)
DFS KPI
FAA
KPI
Severity of ErrorsDFS Data using FAA and DFS Methodology
Safety
Capacity
CostEffectiveness
Efficiency
Target: 2013
Environment
ATM Performance
Flight EfficiencyTemporal Efficiency
2008
Financial CostEffectiveness
Productivity

6Federal AviationAdministration
EUROCONTROL
Continental IFR Flight Hours per Continental ATCO in Operationsby Region
0
500
1,000
1,500
2,000
2,500
Americas 1,630 1,716 1,940 1,846 1,994
Asia Pacific 1,786 1,773 1,788 1,239 1,367
Europe 798 824 821 838 879
2003 2004 2005 2006 2007
Safety
Capacity
CostEffectiveness
Efficiency
Target: 2013
Environment
DFS
Flight EfficiencyTemporal Efficiency
2008
Financial CostEffectiveness
Productivity
(from CANSO 2007 data)
KPA: Cost-Effectiveness Focus Area: Productivity
Why do FAA/ATO data show a productivity nearly twice that of DFS/Europe?
Sample (2006):
• FAA/ATO: 1,845
• DFS: 1,003

7Federal AviationAdministration
EUROCONTROL
Factors to consider when comparing Productivity
• Hours worked per ATCO• Seasonality of traffic• Changes in traffic during the week• Traffic Density and Complexity• % of Upper versus Lower Airspace• Level of Automation• Operating Philosophy (i.e. 1 person sectors)
Safety
Capacity
CostEffectiveness
Efficiency
Target: 2013
Environment
DFS
Flight EfficiencyTemporal Efficiency
2008
Financial CostEffectiveness
Productivity

8Federal AviationAdministration
EUROCONTROL
ANSP Service Quality - Objective & ScopeOBJECTIVES• Provide a high-level comparison of operational performance between the US and
Europe Air Navigation systems.• Initial focus on the development of a set of comparable performance for high level
comparisons between countries and world regions. SCOPE • Predictability and Efficiency of operations
• Link to “Environmental sustainability” when evaluating additional fuel burn. • Continental airspace (Oceanic and Alaska excluded)• Focus on data subset (traffic from/to top 34 airports) due to better data quality (OEP
airports) and comparability (general aviation). • Commercial IFR flights
NOT in SCOPE• Safety, Cost effectiveness, Capacity• Trade-offs and other performance
affecting factors (weather, etc.)

9Federal AviationAdministration
EUROCONTROL
Overview Comparing USA & Europe
[1] Eurocontrol States plus the Estonia and Latvia, but excluding oceanic areas and Canary Islands.[2] Area, flight hours and center count refers to CONUS only. The term US CONUS refers to the 48 contiguous States located on the North American continent south of the border with Canada, plus the District of Columbia, excluding Alaska, Hawaii and oceanic areas.[3] All facilities of which 280 are FAA staffed and 223 contract towers.
Calendar Year 2007 Europe[1] USA[2] Difference
Geographic Area (million km2) 11.5 10.4 -10%
Number of en-route Air Navigation Service Providers 38 1
Number of Air Traffic Controllers 17 000 17 000 0%
Total staff 56 000 35 000 -38%
Controlled flights (Instrumental flight rules IFR) (million) 10 18 +80%
Share of General Air Traffic 4% 18% x4.5
Flight hours controlled (million) 14 25 +79%
Average length of flight (within region) 548 NM 490 NM -11%
Nr. of en-route centers 66 20 - 70%
En-route sectors at maximum configuration 684 955 +40%
Nr. of airports with ATC services 450 503[3] (280) +12%
Of which are slot controlled > 73 3
Source Eurocontrol FAA/ATO

10Federal AviationAdministration
EUROCONTROL
Airspace Density Comparison (CONUS & European Centers)
Density (flight Hr per Sq.Km)< 1< 2< 3< 4< 5>= 5
*Note due to Mercator projection, northern areas appear larger
• Actual sizes are comparable (USA 10.4 vs Europe 11.5 M km2)• Relative density (flight hours per km2) is 1.2 in Europe and 2.4 in
US

11Federal AviationAdministration
EUROCONTROL
Some facts about the main airports in the US and in Europe
Main 34 airports in 2007 Europe US Difference US vs. Europe
Average number of annual movements per airport (‘000) 267 441 +65%Average number of annual passengers per airport (million) 25 32 +28%Passengers per movement 94 72 -23%Average number of runways per airport 2.5 4.0 +60%Annual movements per runway (‘000) 108 110 +2%Annual passengers per runway (million) 10.0 8.0 -20%
• Traffic to/from the main 34 airports represents some 69% of all IFR flights in Europe and 64% in the US.
• The share of general aviation to/from the main 34 airports is more comparable with 4% in the US and 1.6% in Europe.
• Average number of runways (+60%) and the number of movements (+65%) are significantly higher in the US;
• Number of passengers per movement in the US (-23%) are much lower than in Europe.

12Federal AviationAdministration
EUROCONTROL
Average seats per scheduled flight in the US and in Europe
90
95
100
105
110
115
120
2000
2001
2002
2003
2004
2005
2006
2007
2008
avg.
sea
ts p
er fl
ight
Top34/Intra-European
Intra-European
90
95
100
105
110
115
120
2000
2001
2002
2003
2004
2005
2006
2007
2008
US - 'OEP34/CONUSUS-domestic (CONUS)
Intra-European Domestic US (conus)
Source: FAA/ PRC analysis
• Average seat size per scheduled flight differs in the two systems with Europe having a higher percentage of flights using “Large” aircraft than the US.

13Federal AviationAdministration
EUROCONTROL
Air traffic growth in the US and in Europe (IFR flights)
• Until 2004, growth rates evolved in similar ways• Notable decoupling since 2004
-6%
-4%
-2%
0%
2%
4%
6%
8%
1999 2000 2001 2002 2003 2004 2005 2006 2007 2008
USA Europe

14Federal AviationAdministration
EUROCONTROL
On-time performance in the US and in Europe
70%
72%
74%
76%
78%
80%
82%
84%
86%
88%
90%
2002
2003
2004
2005
2006
2007
2008
Departures (<=15min.) Arrivals (<=15min.)
70%
72%
74%
76%
78%
80%
82%
84%
86%
88%
90%
2002
2003
2004
2005
2006
2007
2008
On-time performance compared to schedule(flights to/from the 34 main airports)
Intra-Europe US (conus)
Source: E-CODA Source: ASQP data
Similar pattern in US and Europe with a comparable level of arrival on time performance; The gap between departure and arrival punctuality is significant in the US and quasi nil in Europe suggesting differences in flow management strategies
Arrivals/ departures delayed by more than 15 minutes versus schedule

15Federal AviationAdministration
EUROCONTROL
Airline Scheduling: Evolution of block times
Europe: Block times remain relatively stable (left side) US: In addition to decreasing on time performance (previous slide), there is a clear increase in scheduled block times (right side)Seasonal effects are visible in the US and in Europe
-2
-1
0
1
2
3
4Ja
n-00
Jan-
01
Jan-
02
Jan-
03
Jan-
04
Jan-
05
Jan-
06
Jan-
07
Jan-
08
min
utes
-2
-1
0
1
2
3
4
Jan-
00
Jan-
01
Jan-
02
Jan-
03
Jan-
04
Jan-
05
Jan-
06
Jan-
07
Jan-
08
Europe US (conus)
Source: FAA/PRU
Evolution of Scheduled Block Times (flights to/from 34 main airports)
Scheduled block times compared to the long term average at city
pair level.
16Federal AviationAdministration
EUROCONTROL
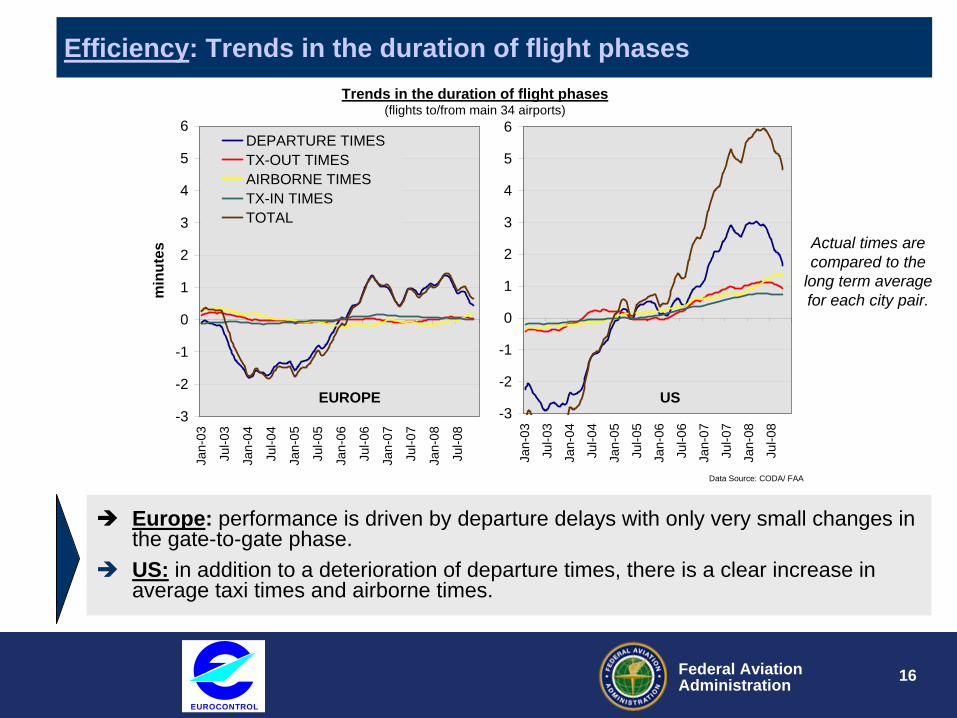
Efficiency: Trends in the duration of flight phases
-3
-2
-1
0
1
2
3
4
5
6
Jan-
03
Jul-0
3
Jan-
04
Jul-0
4
Jan-
05
Jul-0
5
Jan-
06
Jul-0
6
Jan-
07
Jul-0
7
Jan-
08
Jul-0
8
min
utes
DEPARTURE TIMESTX-OUT TIMESAIRBORNE TIMESTX-IN TIMESTOTAL
Data Source: CODA/ FAA
-3
-2
-1
0
1
2
3
4
5
6
Jan-
03
Jul-0
3
Jan-
04
Jul-0
4
Jan-
05
Jul-0
5
Jan-
06
Jul-0
6
Jan-
07
Jul-0
7
Jan-
08
Jul-0
8
EUROPE US
Trends in the duration of flight phases(flights to/from main 34 airports)
Europe: performance is driven by departure delays with only very small changes in the gate-to-gate phase. US: in addition to a deterioration of departure times, there is a clear increase in average taxi times and airborne times.
Actual times are compared to the
long term average for each city pair.

17Federal AviationAdministration
EUROCONTROL
Schedule Growth Shifts Delays
Up 8% Compared to 2000Down 9% Compared to 2000
October-July
0
10
20
30
40
50
60
70
80
90
100
2000 2001 2002 2003 2004 2005 2006 2007D
elay
s pe
r Tho
usan
d O
pera
tions
-12%
-10%
-8%
-6%
-4%
-2%
0%
2%
4%
6%
8%
10%
2000 2001 2002 2003 2004 2005 2006 2007
Cha
nge
in O
pera
tions
sin
ce 2
000
OEP31 EWR,JFK,LGA,PHL
Traffic Change Delayed Flights
18Federal AviationAdministration
EUROCONTROL
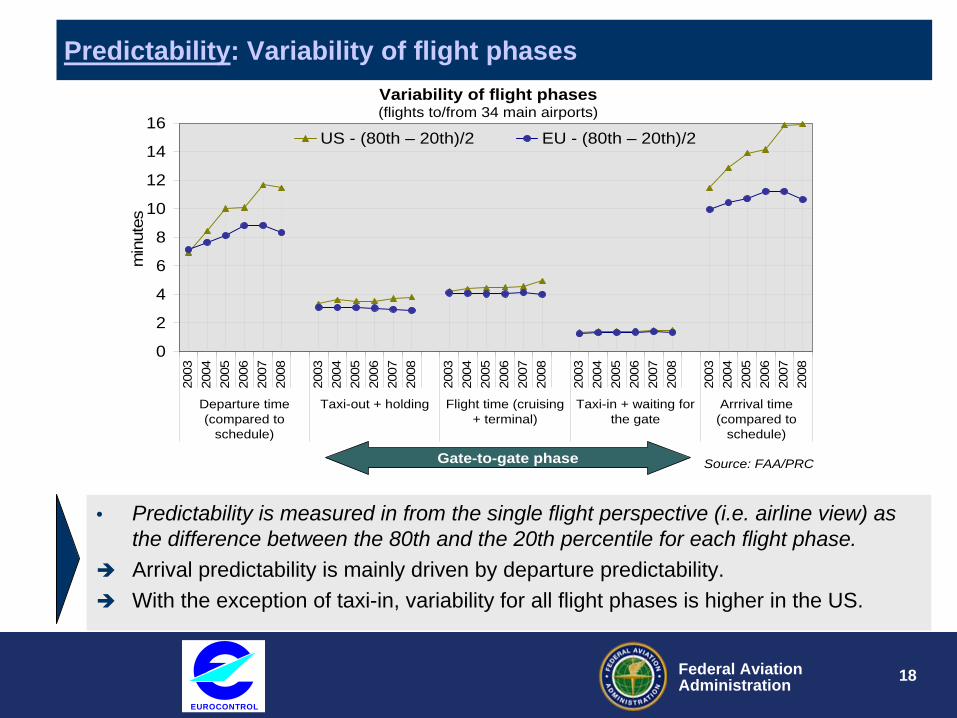
Predictability: Variability of flight phases
0
2
4
6
8
10
12
14
16
2003
2004
2005
2006
2007
2008
2003
2004
2005
2006
2007
2008
2003
2004
2005
2006
2007
2008
2003
2004
2005
2006
2007
2008
2003
2004
2005
2006
2007
2008
Departure time(compared to
schedule)
Taxi-out + holding Flight time (cruising+ terminal)
Taxi-in + waiting forthe gate
Arrrival time(compared to
schedule)
min
utes
US - (80th – 20th)/2 EU - (80th – 20th)/2
Gate-to-gate phase Source: FAA/PRC
Variability of flight phases (flights to/from 34 main airports)
• Predictability is measured in from the single flight perspective (i.e. airline view) as the difference between the 80th and the 20th percentile for each flight phase. Arrival predictability is mainly driven by departure predictability. With the exception of taxi-in, variability for all flight phases is higher in the US.

19Federal AviationAdministration
EUROCONTROL
What We are Measuring Today (w/ Large Data Sets)
FAA/ATO and PRU both establishing consistent measures
100
nm
40 n
m
Feb 15th 20080h01-23h59
GATE-to-GATEDEPARTUREANS-related
Holding at theGate (ATFM/
EDCT)
Taxi-outefficiency
En-routeFlight
efficiency
IFR flightsTo/fromMain 34 airports
Efficiency In last
100NM
Taxi-inefficiency
IFR flightsTo/fromMain 34 airports
Continuous Descent Arrival
Standard Arrival

20Federal AviationAdministration
EUROCONTROL
Efficiency: ANS-related departure delays
2007 En-route related(EDCT/ATFM)
Airport related(EDCT/ATFM)
IFR
flights (M
)
% of flights delayed
delay per flight (m
in.)
delay per delayed flight
(min.)
% of flights delayed
delay per flight (m
in.)
delay per delayed flight
(min.)
US 9.7 0.2% 0.1 53 1.7% 1.1 68Europe 5.7 7.8% 1.4 18 6.8% 1.4 21
US: En-route delays are much lower per flight, but the delay per delayed flight is significantly higher; Europe: Higher share of flights affected (than US) but with a lower average delay. In the US, ground delays (EDCT) are used when other options are not sufficient, whereas, in Europe ground delays (ATFM) are the main ATM tool for balancing demand with capacity
GATE-to-GATEDEPARTUREANS-related
Holding at theGate (ATFM/
EDCT)
Taxi-outefficiency
En-routeFlight
efficiency
Efficiency In last
100NM

21Federal AviationAdministration
EUROCONTROL
0
2000
4000
6000
8000
10000
12000
Oct-06
Nov-06
Dec-06
Jan-0
7Fe
b-07
Mar-07
Apr-07
May-07
Jun-0
7Ju
l-07
Aug-07
Sep-07
EDC
T D
elay
s (m
in)
0
300
600
900
1,200
1,500
1,800
EDC
T D
elay
s (F
light
s-Th
ousa
nds)
En Route Delayed Flights
En Route Delays (min)
En Route Driven Ground Delays (ATO)

22Federal AviationAdministration
EUROCONTROL
Excess Taxi Fuel Burn Calculation Methodology
• Calculate taxi-in/taxi-out delay from ASPM/ASQP-using actual taxi time and nominal taxi time from ASPMNominal taxi time statistically calculated by APO-Taxi-delay = actual time – nominal time-Negative delay truncated to zero
• Derive excess fuel usage from taxi-in/taxi-out delay– Excess fuel used in kg = taxi delay in minute * fuel burn kg/min– Assuming all engines on at idle power for entire delay period– Alternative to truncate delay at maximum of 30 minutes– Idle power from ICAO Emissions databank

23Federal AviationAdministration
EUROCONTROL
Excess time in the taxi out phase
0
5
10
15
20
Lond
on(L
HR
)R
ome
(FC
O)
Lond
on(L
GW
)Fr
ankf
urt
(FR
A)
Par
is (C
DG
)
Mad
rid(M
AD
)B
arce
lona
(BC
N)
Mun
ich
(MU
C)
Ista
nbul
(IST)
Am
ster
dam
(AM
S)
Mila
n (M
XP
)
Dus
seld
orf
(DU
S)
Man
ches
ter
(MA
N)
Vie
nna
(VIE
)Zu
rich
(ZR
H)
Osl
o (O
SL)
Cop
enha
gen
(CP
H)
Par
is (O
RY
)
Bru
ssel
s(B
RU
)S
tock
holm
(AR
N)
min
utes
per
dep
artu
reEurope Top 34 Average (3.7 min.)
05
101520
New
Yor
k(J
FK)
New
ark
(EW
R)
New
Yor
k(L
GA
)P
hila
delp
hia
(PH
L)A
tlant
a(A
TL)
Chi
cago
(OR
D)
Min
neap
olis
(MS
P)
Det
roit
(DTW
)B
osto
n(B
OS
)C
harlo
tte(C
LT)
Sal
t Lak
eC
ity (S
LC)
Las
Veg
as(L
AS
)H
oust
on(IA
H)
Pho
enix
(PH
X)
Den
ver
(DE
N)
Was
hing
ton
(IAD
)S
anFr
anci
sco
Dal
las
(DFW
)Lo
sA
ngel
esO
rland
o(M
CO
)
US OEP 34 Average (6.8 min.)
Source: FAA/ PRC analysis/ CODA/ CFMU
Average excess time in the taxi out phase(Top 20 in terms of annual movements in 2007 are shown)
Excess times in the taxi out phase are higher in the USFor the US, excess times also include delays due to local en-route departure and miles in trail restrictions. .
GATE-to-GATEDEPARTUREANS-related
Holding at theGate (ATFM/
EDCT)
Taxi-outefficiency
En-routeFlight
efficiency
Efficiency In last
100NM
24Federal AviationAdministration
EUROCONTROL
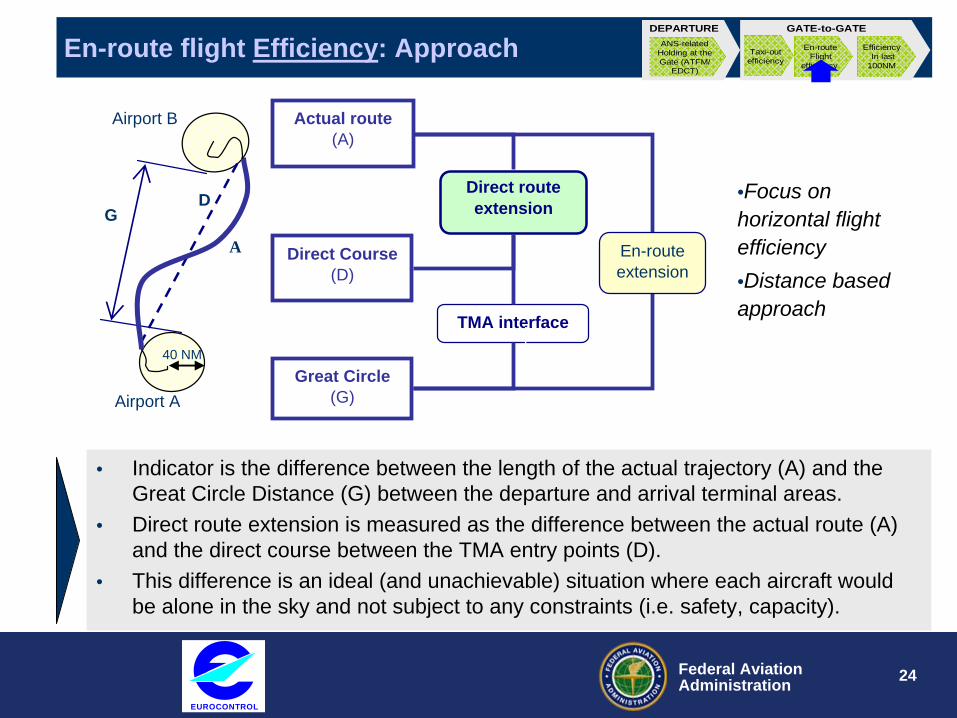
En-route flight Efficiency: Approach
40 NM
Airport A
Airport B
GD
A En-route extension
Actual route(A)
Great Circle(G)
Direct Course(D)
Direct route extension
TMA interface
• Indicator is the difference between the length of the actual trajectory (A) and the Great Circle Distance (G) between the departure and arrival terminal areas.
• Direct route extension is measured as the difference between the actual route (A) and the direct course between the TMA entry points (D).
• This difference is an ideal (and unachievable) situation where each aircraft would be alone in the sky and not subject to any constraints (i.e. safety, capacity).
•Focus on horizontal flight efficiency•Distance based approach
GATE-to-GATEDEPARTUREANS-related
Holding at theGate (ATFM/
EDCT)
Taxi-outefficiency
En-routeFlight
efficiency
Efficiency In last
100NM

25Federal AviationAdministration
EUROCONTROL
Flight efficiency: Direct Route Extension
0.0%0.5%1.0%1.5%2.0%2.5%3.0%3.5%4.0%4.5%5.0%
0-199 NM 200-399 NM 400-599 NM 600-799 NM 800-999 NM >1000 NM
Great Circle Distance between 40NM circles (D40-A40)
Dire
ct ro
ute
exte
nsio
n (%
)
Europe USA
0%
10%
20%
30%
40%
0-199 NM 200-399 NM 400-599 NM 600-799 NM 800-999 NM >1000 NM
% o
f all
fligh
ts
Direct en-route extension ((A-D)/G)(flights to/from the 34 main airports 2007)
US OEP 34 average (2.9%)
European top 34 average (4.0%)
• Direct route extension is approximately 1% lower in the US• US: Miles in trail restrictions are passed back from constrained airports• Europe: Fragmentation of airspace, location of military airspace
GATE-to-GATEDEPARTUREANS-related
Holding at theGate (ATFM/
EDCT)
Taxi-outefficiency
En-routeFlight
efficiency
Efficiency In last
100NM

26Federal AviationAdministration
EUROCONTROL
Impact of Military Airspace SW of Frankfurt
• Military airspace is a significant driver of excess distance• Area southeast of Frankfurt is a major contributor• Adjoining French Military airspace further increases problem
GATE-to-GATEDEPARTUREANS-related
Holding at theGate (ATFM/
EDCT)
Taxi-outefficiency
En-routeFlight
efficiency
Efficiency In last
100NM

27Federal AviationAdministration
EUROCONTROL
Sample „Inefficient“ DFS Routes

28Federal AviationAdministration
EUROCONTROL
Boston (BOS) to Philadelphia (PHL) Flights
Great Circle Distance: 242 nmiAverage Excess Distance: 102 nmiPercent Excess Distance over
Great Circle: 42.1%
Average excess distance per stage:First 40 nmi: 12 nmi40 to 40 nmi circles: 63 nmiLast 40 nmi: 27 nmi
GATE-to-GATEDEPARTUREANS-related
Holding at theGate (ATFM/
EDCT)
Taxi-outefficiency
En-routeFlight
efficiency
Efficiency In last
100NM
July 2007

30Federal AviationAdministration
EUROCONTROL
IAD to FLL
Number of Flights 1488Direct Flight Indicator Total (A-G) 41.9
Direct Between TMA (A-D) 20.3TMA Interface (G-D) 21.5

32Federal AviationAdministration
EUROCONTROL
Efficiency: Excess time in the last 100NM
• Time based measure• Captures type of A/C• ARC Entry point and
runway configuration• Nominal derived from
20th percentile• Excess – time above
nominal for each category
100 nmi
40 nmi
x
ArrivalAirport
Arrival Fix
Actual Route
Notional OptimalRoute
2.5%
Direction of
Flight
33Federal AviationAdministration
EUROCONTROL
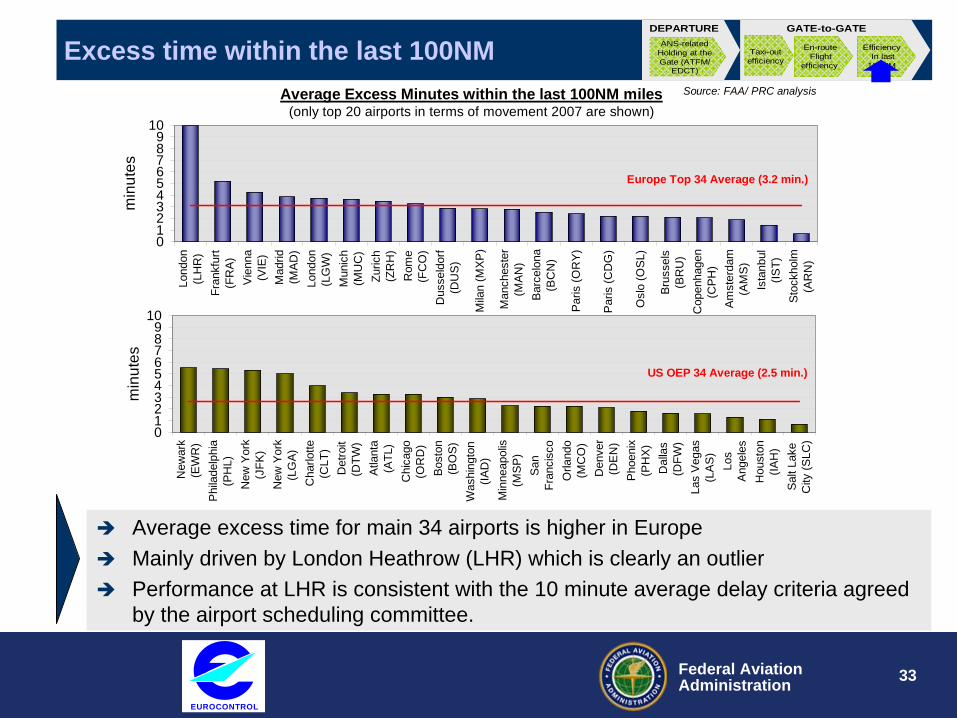
Excess time within the last 100NM
0123456789
10
Lond
on(L
HR
)Fr
ankf
urt
(FR
A)
Vie
nna
(VIE
)M
adrid
(MA
D)
Lond
on(L
GW
)M
unic
h(M
UC
)Zu
rich
(ZR
H)
Rom
e(F
CO
)D
usse
ldor
f(D
US
)
Mila
n (M
XP)
Man
ches
ter
(MAN
)B
arce
lona
(BC
N)
Paris
(OR
Y)
Par
is (C
DG
)
Osl
o (O
SL)
Brus
sels
(BR
U)
Cop
enha
gen
(CPH
)Am
ster
dam
(AM
S)Is
tanb
ul(IS
T)St
ockh
olm
(AR
N)
min
utes
Average Excess Minutes within the last 100NM miles(only top 20 airports in terms of movement 2007 are shown)
Europe Top 34 Average (3.2 min.)
0123456789
10
New
ark
(EW
R)
Phila
delp
hia
(PH
L)N
ew Y
ork
(JFK
)N
ew Y
ork
(LG
A)C
harlo
tte(C
LT)
Det
roit
(DTW
)At
lant
a(A
TL)
Chi
cago
(OR
D)
Bost
on(B
OS)
Was
hing
ton
(IAD
)M
inne
apol
is(M
SP)
San
Fran
cisc
oO
rland
o(M
CO
)D
enve
r(D
EN
)P
hoen
ix(P
HX)
Dal
las
(DFW
)La
s V
egas
(LAS
)Lo
sA
ngel
esH
oust
on(IA
H)
Salt
Lake
City
(SLC
)
min
utes
US OEP 34 Average (2.5 min.)
Source: FAA/ PRC analysis
Average excess time for main 34 airports is higher in EuropeMainly driven by London Heathrow (LHR) which is clearly an outlierPerformance at LHR is consistent with the 10 minute average delay criteria agreed by the airport scheduling committee.
GATE-to-GATEDEPARTUREANS-related
Holding at theGate (ATFM/
EDCT)
Taxi-outefficiency
En-routeFlight
efficiency
Efficiency In last
100NM

34Federal AviationAdministration
EUROCONTROL
Estimated total benefit pool
Estimated excess time on flights to/from the main 34 airports (2007)
TIME per flight(minutes) Predictability
EUR US
Gate/ departure holdings
en-route-related 1.4 0.1 Low
airport-related 1.4 1.1 Low
Taxi-out phase 3.7 6.8 Medium
Horizontal en-route flight efficiency 2.2-3.8 1.5-2.7 High
Terminal areas (ASMA/TMA) 3.2 2.5 Medium
Total estimated excess time per flight 11.9-13.5 12.0-13.2
• The benefit pool represents a theoretical optimum. Safety and capacity constraints limit the practicality of ever fully recovering these “inefficiencies”
• Similar total estimated excess times in US and Europe but with differences in the distribution along the phase of flight. Inefficiencies have a different impact (fuel burn, time) on airspace users, depending on the phase of flight (airborne vs. ground) and the level of predictability (strategic vs. tactical).

35Federal AviationAdministration
EUROCONTROL
Vertical Inefficiency - Continuous Descent Arrival
CDA is an arrival procedure designed to eliminate level segments flown below cruise altitude, thus minimizing fuel burn, emissions and noise.
In a CDA, these level segments would be flown at cruise altitude
Continuous Descent Arrival
Standard Arrival

36Federal AviationAdministration
EUROCONTROL
EUR US
Fuel / Flight %* Fuel / Flight %*
Horizontal Flight Efficiency 160 kg 3.6% 115 kg 3.0%
Vertical Flight Efficiency 25 kg 0.6% 31 kg 0.7%
TMA transit (Airborne Delay)
76 kg 1.6% 98 kg 2.5%
Taxi Delay 30 kg 0.8% 62 kg 1.6%
Total Flight Efficiency** 6.6% 7.8%
Comparisons of US and European Fuel Inefficiency Estimates
Safety
Capacity
CostEffectiveness
Efficiency
Target: 2013
Environment
ATM Performance
Flight EfficiencyTemporal Efficiency
2008
Financial CostEffectiveness
Productivity
*Share of total aviation emissions in European or US airspace
•VERY PRELIMINARY
Very Preliminary

37Federal AviationAdministration
EUROCONTROL
Sample Data from CANSO Participants
R E A D Y T O S T A R T W H E E L S -U P
P U S HB A C K
T A X I
R U N W A Y G A T E
N O M IN A L2 5 m in u te s
1 0 m in s 1 5 m in s
R E Q U E S T C L E A R A N C E
D E L A Y? 1 5 m in s
E X C E S S
Figure Error! No text of specified style in document.-1 Sample Data Summary for CAAS Singapore Measures CAAS Singapore Total Departures 110,310 Flight Hours Delays (minutes) 178,680 Sum of delay for delayed flights (minutes) 47,782 Delayed Flights 2,388 Delay per Delayed Flight (minutes) 20.01 Delay/All Flights (minutes) 1.62 Percent Delayed 2.16% Source: CAAS Singapore 2007

38Federal AviationAdministration
EUROCONTROL
Sample Data on Delay Causes – CANSO ANSP
2007 ATFM Delay Causes for ANSP-3
ATC Equipment, 0.3%
Aerodrome Capacity, 4.6%
Accident Incident, 0.5%
ATC Staffing, 10.4%
ATC Capacity, 13.1%Other, 0.7%
Weather, 70.2%

39Federal AviationAdministration
EUROCONTROL
Conclusions
• High value in global comparisons and benchmarking in order to drive performance and identify best practice;
• Arrival punctuality is similar in the US and in Europe, albeit with a higher level of variability in the US.
• Overall, the estimated average excess time in the US and Europe appear to be similar, but with notable differences in the distribution along the phase of flight.
• Inefficiencies have a different impact (fuel burn, time) on airspace users, depending on the phase of flight (airborne vs. ground) and the level of predictability (strategic vs. tactical). Further work is needed to assess the impact of efficiency and predictability on airspace users.
• A more comprehensive comparison of service performance would also need to address Safety, Capacity and other performance affecting factors such as weather and governance.

40Federal AviationAdministration
EUROCONTROL
Next Steps
• Data analysis on underlying capacities driving performance differences– Variability in weather driving performance in US?– Impact of slots– Uniqueness of US situation…
• Collect data from additional CANSO ANSPs• Develop better understanding of other factors
driving performance– Congestion– Complexity of traffic– Military airspace constraints

41Federal AviationAdministration
EUROCONTROL
World-wide Airspace Map for ATC Service Providers

42Federal AviationAdministration
EUROCONTROL
FAA-DFS comparison draft Nov20- 08
Backup Slides

43Federal AviationAdministration
EUROCONTROL
Time Fuel
Horizontal Flight Efficiency 1.5-2.7 min 63.9kg - 115.0 kg 1.6% - 3.0%
TMA transit (Airborne Delay) 2.3 min 98.1 kg 2.5%
Vertical Flight Efficiency 0 29.4kg - 31.7kg 0.76% - 0.82%
Taxi Delay 5.4-6.3 min 62.6kg - 74.5 kg 1.6% - 1.9%
Total Flight Efficiency** 6.6% - 8.2%
FAA 2007 Inefficiency* EstimatesAssume 3875 kg Average Fuel per Flight
*Inefficiencies includes safety related routings
**With no action the inefficiency pool will grow with traffic
44Federal AviationAdministration
EUROCONTROL
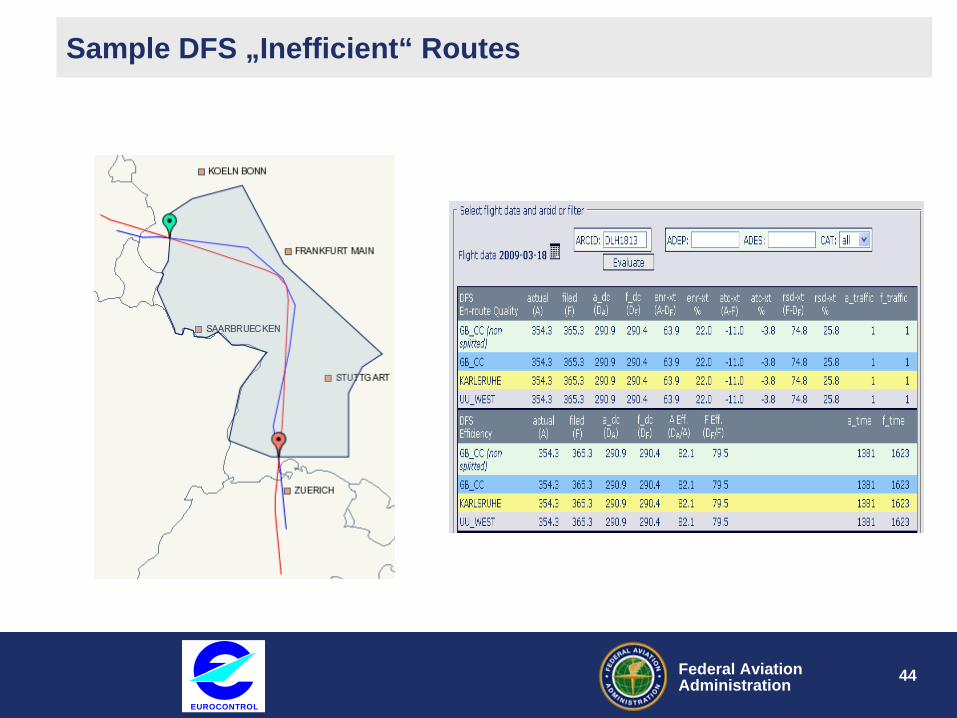
Sample DFS „Inefficient“ Routes

FAA-DFS comparison draft Nov20-08
45Federal AviationAdministration
EUROCONTROL
Mapping ATO Framework to DFS
Balanced Scorecard
ATO Strategic Pathways
AchieveOperationalExcellence
EnhanceFinancial Discipline
IncreaseCapacity
Where Needed
Ensure Viable Future Employees
ATM Performance Framework
Safety EfficiencyCost Effectiveness Capacity Employees &
DevelopmentEnvironment
Safety
Capacity
CostEffectiveness
Efficiency
Target: 2013
Environment
ATM Performance
Flight EfficiencyTemporal Efficiency
2008
Financial CostEffectiveness
Productivity
ATO Dash Board

46Federal AviationAdministration
EUROCONTROL
Target Setting
• FAA/ATO and DFS both use near term target setting (FAA/ATO also for mid term horizon)– FAA/ATO to incentivize the entire organization– DFS to incentivize managers
• In 2006 FAA/ATO changed calculation method for measures– Not actual traffic but traffic forecasts is used as reference
ATM Cost / Charging Unit (DFS BU CC)

47Federal AviationAdministration
EUROCONTROL
ATO En-route Operational ErrorsSafety
Capacity
CostEffectiveness
Efficiency
Target: 2013
Environment
ATM Performance
Flight EfficiencyTemporal Efficiency
2008
Financial CostEffectiveness
Productivity

48Federal AviationAdministration
EUROCONTROL
ATO En-route Operational ErrorsSafety
Capacity
CostEffectiveness
Efficiency
Target: 2013
Environment
ATM Performance
Flight EfficiencyTemporal Efficiency
2008
Financial CostEffectiveness
Productivity
49Federal AviationAdministration
EUROCONTROL
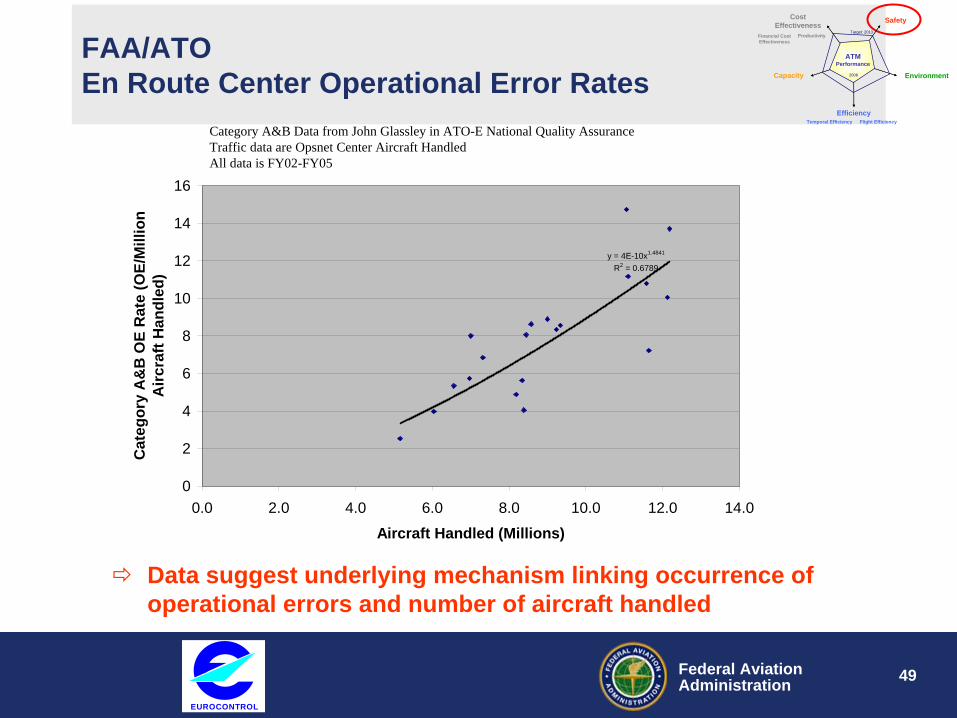
FAA/ATO En Route Center Operational Error Rates
y = 4E-10x1.4841
R2 = 0.6789
0
2
4
6
8
10
12
14
16
0.0 2.0 4.0 6.0 8.0 10.0 12.0 14.0
Aircraft Handled (Millions)
Cat
egor
y A
&B
OE
Rat
e (O
E/M
illio
n A
ircra
ft H
andl
ed)
Category A&B Data from John Glassley in ATO-E National Quality AssuranceTraffic data are Opsnet Center Aircraft HandledAll data is FY02-FY05
Data suggest underlying mechanism linking occurrence of operational errors and number of aircraft handled
Safety
Capacity
CostEffectiveness
Efficiency
Target: 2013
Environment
ATM Performance
Flight EfficiencyTemporal Efficiency
2008
Financial CostEffectiveness
Productivity

50Federal AviationAdministration
EUROCONTROL
CONUS and ZAN OEs FY 2002-2005
0
50
100
150
200
250
300
350
400
0 5 10 15 20 25Aircraft in Sector
Ope
ratio
nal E
rror
s
0%
2%
4%
6%
8%
10%
12%
14%
16%
Sector Time
OE DistributionSector Minute Distribution
FAA/ATO Operational Errors and Sector Traffic
OE data from ATO-AOEs are all OEs, not just category A&BSector time is sum of total minutes sectors are controlling aircraft, normalized to 1Sector time computed from Host Aircraft Management Execs (HAME) dataAll data FY02-FY05
Operational Errors happen most often when controllers are handling 8-10 aircraft …
Safety
Capacity
CostEffectiveness
Efficiency
Target: 2013
Environment
ATM Performance
Flight EfficiencyTemporal Efficiency
2008
Financial CostEffectiveness
Productivity

51Federal AviationAdministration
EUROCONTROL
y = 2.6279x2.4279
R2 = 0.989
0
1000
2000
3000
4000
5000
6000
7000
8000
0 5 10 15 20 25 30Aircraft in Sector
Ope
ratio
nal E
rror
s/M
illio
n H
ours OE Rate
Fit
OE data from ATO-AOEs are all OEs, not just category A&BSector time computed from HAME dataAll data FY02-FY05
FAA/ATO Operational Errors and Sector Traffic
… but Operational error rate increases with traffic after correction for sector traffic frequency (> than square of traffic)
Safety
Capacity
CostEffectiveness
Efficiency
Target: 2013
Environment
ATM Performance
Flight EfficiencyTemporal Efficiency
2008
Financial CostEffectiveness
Productivity

52Federal AviationAdministration
EUROCONTROL
FAA/ATO Delays
• Most En Route Delays during Convective Weather
5
5.5
6
6.5
7
7.5
8
8.5
9Ja
n-00
Jul-0
0
Jan-
01
Jul-0
1
Jan-
02
Jul-0
2
Jan-
03
Jul-0
3
Jan-
04
Jul-0
4
Jan-
05
Jul-0
5
Jan-
06
Jul-0
6
Jan-
07
Jul-0
7
Ann
ual O
ps (M
illio
n)
Annual Ops Monthly Delay
0
5
10
15
20
25
30
Avg
. Tot
al D
elay
Annual Delay
0
5
10
15
20
25
30
Avg
. Tot
al D
elay
0
5
10
15
20
25
30
Avg
. Tot
al D
elay
Annual Delay